


 , Isao Nodaa,f, Jin-Guang Wua
b College of Chemistry and Materials, Hebei Normal University, Shijiazhuang 050016, China;
c School of Postgraduate, Liaoning University of Traditional Chinese Medicine, Shenyang 11660, China;
d The third school of Clinical Medicine of Peking University, Beijing, 100083, China;
e Ninhai Doubly Advanced Martial Co., Ltd., Ninhai 315602, China;
f Department of Materials Science and Engineering, University of Delaware, Newark, DE 19716, USA
Two-dimensional (2D) correlation spectroscopy proposed by Noda [12] provides a new avenue in the field of spectroscopy. Many important subtle spectral features that are difficult to be observed in the original 1D spectra can be clearly visualized via the 2D spectra. Especially,intermolecular interactions have been extensively characterized by using cross peaks in the 2D correlation spectra [13]. However,interfering cross peaks due to other sources,such as concentration variations of solutes,also arise even if there is no intermolecular interaction. This problemmakes it difficult to directly usethecrosspeaksinconventional2Dspectrumasareliablecriterion to judge whether intermolecular interaction actually occurs or not.
To solve the problem,we have developed orthogonal sample design scheme (OSD),asynchronous orthogonal sample design scheme (AOSD) and double orthogonal sample design scheme (DOSD).Byusingthesemethods,interference signal thathasnothing to do with intermolecular interactions can be completely removed [14, 15, 16, 17, 18, 19, 20]. Consequently,spectral portion arisen fromdeviation to the Beer-Lambert’s law caused by intermolecular interactions between two solutes can be clearly visualized as specific cross peaks in the corresponding two-dimensional correlated spectrum. Moreover, spectral variations ona characteristic peak caused by intermolecular interaction include changes in peak position,bandwidth,and absorptivity,which can be revealed via characteristic spectral patterns of cross peaks in 2D spectra generated by using the OSD, AOSD and DOSD approaches. However,peak position,bandwidth and absorptivity of characteristic peaks of two solutes under intermolecular interaction may change simultaneously in some cases. The resultant spectral patterns are too complex to shed light on what happens on the molecular system.
In our previous work,we proposed an approach called double asynchronous orthogonal sample design (DAOSD) scheme [21]. By using this approach,a 2D asynchronous spectrum is decomposed into a pair of complementary sub-2D asynchronous spectra. As a result,spectral variation of different molecule can be reflected in different spectral regions. Therefore,subtle variations on the peak position,bandwidth and absorptivity from the characteristic peaks of two solutes involved in intermolecular interaction can be revealed. In our previous work,we have applied the DAOSD approach to several molecular systems and satisfactory results have been obtained [22, 23].
In this paper,we applied the DAOSD approach on the pyridine hydrochloride/Nd3+ system.
2. Experimental 2.1. MaterialsPyridine,hydrochloric acid and perchloric acid (A.R. grade) were purchased from Beijing Chemical Company. Nd2O3 with purity of 99.99% was purchased from Shanghai Yuelong Chemical Factory. Nd(ClO4)3 was prepared by dissolving the Nd2O3 in perchloric acid.
2.2. InstrumentUV-vis spectra were recorded on a Lambda35 UV-vis spectrophotometer (Perkin Elmer) and all the spectra were measured at a scanning rate of 60 nm/min. Fluorescence spectra were measured on an F-7000 fluorescence spectrometer. The excitation wavelength was 255 nm. Both the excitation and emission slits were set as 5 nm.
2.3. Brief description of thickness-variable cuvetteTo enhance the spectral signal from interaction between Nd3+ and pyridinium,the concentration ranges of Nd3+ and pyridinium should be similar. However,the absorptivity of the π-π transition band of pyridinium is very large (the molar absorptivity is around 106 L mol-1 m-1),while the peak of Nd3+ is a forbidden transition, whose molar absorptivity is between 102 L mol-1 m-1 and 104 L mol-1 m-1. That is to say,there is a large difference on the absorptivity between the π-π transition band of pyridinium and f-f transition band of Nd3+. This problem makes it difficult to get UV-vis spectra with acceptable quality when the concentration of Nd3+ is comparable to that of pyridinium.
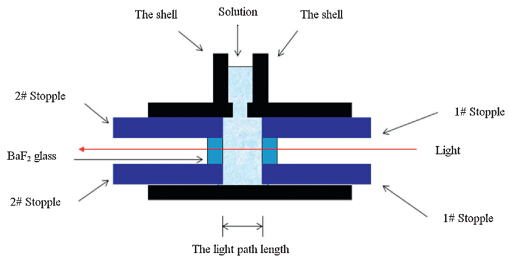
Herein,we develop a thickness-variable cuvette whose pathlength ranges from 10 mm to 1 cm to solve the problem. Scheme 1 shows the structure of the thickness-variable cuvette.ABaF2 window was put at one end of each stopple. Thepathlengthof the solution can be changed by adjusting the positions of the two stopples. We measured the UV-vis spectra of the pyridine hydrochloride when pathlength of the sample is set to be 100 mm.When the f-f transition peak of Nd3+ is recorded,the pathlength is set at 1 cm.With the help of thickness-variable cuvette,the absorbance of both the f-f transition band of Nd3+ and the π-π transition band of pyridine hydrochloride are similar,while the concentrations of the two solutes are close to each other (2-20 mmol L-1) (Scheme 1).

|
Download:
|
| Scheme 1. Schematic diagram of the thickness-variable cuvette. | |
The chemical systems studied here are aqueous solutions containing neodymium perchloride and pyridine hydrochloride. Some levels of solvent-solute interactions are inevitable,since a solvating layer occurs around each solute species. These interactions may lead to a deviation from linearity between absorbance and concentration of the solutes. Such a deviation may also produce cross peaks that reflected solute-solvent interactions rather than solute-solute interactions. Therefore,some additional maneuver should be made to remove the interference caused by solvent-solute interactions.
The solute and its solvating layer can be regarded as a separate entity i.e.,solvated-solute complex. Within a suitable concentration range of the solutes,the integrity of the solvated-solute complex remains undisturbed and the solvated-solute complex also follows the Beer-Lambert law. Hence,intermolecular interactions among solute and solvent do not produce any interfering cross peaks in 2D asynchronous spectra and the interference caused by the solvent-solute interactions can also be effectively removed.
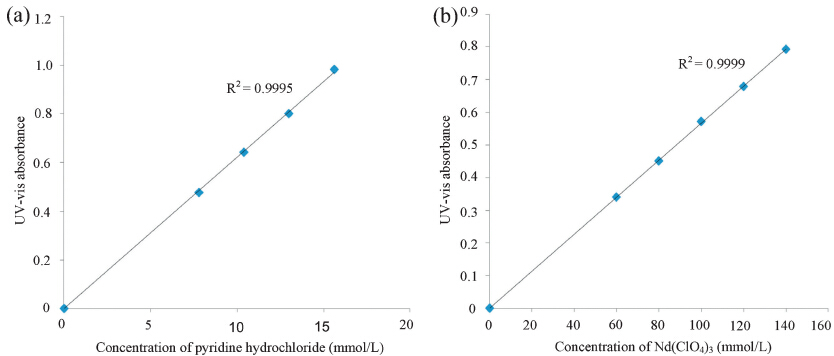
In this experiment,a series of aqueous solutions containing different amount of Nd3+ were prepared. Similarly,another series of aqueous solutions containing different amount of pyridine hydrochloride (pH < 3) were also prepared. UV-vis spectra of the two groups of solutions were recorded. The absorbance of the pyridine hydrochloride at 255 nm is plotted against the concentration of pyridine hydrochloride and the result is shown in Fig. 1(a). Similarly,the absorbance of the f-f transition band of Nd3+ at 575 nm is plotted against the concentration of neodymium chloride (Fig. 1(b)). Good linearity (R > 0.999) can be obtained between absorbance and concentration. The suitable concentration ranges of Nd3+ and pyridine hydrochloride are 2-20 mmol/L and 20-160 mmol/L,respectively.

|
Download:
|
| Fig. 1. Linear fitting results on the relationship between absorbance and concentration: (a) pyridine hydrochloride (R > 0.999) and (b) neodymium perchlorate (R > 0.999). | |
The description of the DAOSD approach in detail can be found in our previous papers. Here we just give a brief description on the procedure to construct 2D asynchronous spectra by using the DAOSD approach.
To investigate the character of the Nd(ClO4)3/pyridinium/H2O system,the 2D asynchronous spectra were constructed following three processes:
Step 1: A series of aqueous solutions with different concentration of pyridinium were prepared. Then the UV-vis spectra of these solutions were recorded to research the relationship between the absorbance of pyridinium and concentrations of the solutes. The suitable concentration range was chosen to make sure the mentioned relationship was linear (Fig. 1(a)). Similarly,the suitable concentration range of Nd(ClO4)3 aqueous solutions was obtained based on the rule that the UV-vis absorbance of f-f transition band from Nd3+ ions formed a linear relationship toward the concentrations of the Nd(ClO4)3 (Fig. 1(b)). The suitable concentration ranges for pyridinium and Nd3+ used in this paper were 2-16 mmol/L and 20-140 mmol L-1,respectively.
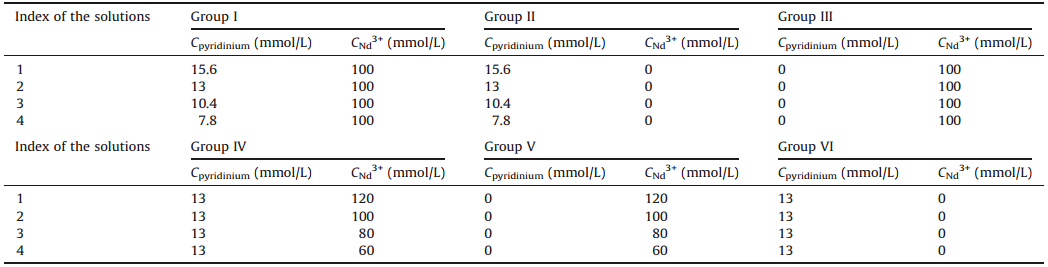
Step 2: Four solutions containing pyridinium or/and Nd(ClO4)3 built one group,and six groups were prepared. The concentrations of solutions in the six groups were listed in Table 1. 1D spectra of solutions of group I were used to generate ΨNd. According to the requirement of DAOSD approach,the concentrations of Nd(ClO4)3 were invariant while the concentrations of pyridinium were variable in this group. 1D spectra of solutions of groups II and III were used to generate modified reference spectra in the construction of ΨNd. The concentration series of pyridinium/ Nd(ClO4)3 in the solutions of groups II/III met the requirement of generation of modified reference spectra which had described in our previous papers. Similarly,1D spectra of solutions of group IV were used to generate Ψpyridinium. Therefore,the concentrations of pyridinium were invariant while the concentrations of Nd(ClO4)3 were variable in the solutions of group IV. 1D spectra of groups V/VI solutions were used to generate modified reference spectra in the construction ofΨpyridinium. The concentration series of pyridinium/Nd(ClO4)3 in the solutions of groups V/VI met the requirement of generation of modified reference spectra.
| Table 1 Initial concentrations of pyridinium and Nd(ClO4)3 in aqueous solutions of the six groups of solutions. |
It should be pointed out that the concentrations of Nd(ClO4)3 and pyridinium in all solutions belonged to the six groups were within the selected concentration ranges obtained in step 1. Therefore,the possibility that cross peaks in the resultant 2D asynchronous spectra were caused by solute-solvent interaction rather than solute- solute interaction could be excluded in the following calculation. Then the UV-vis spectra of the solutions from the six groups were recorded.
Step 3: According to the 1D spectra obtained in the step 2,we constructed one pair of 2D asynchronous spectra (ΨNd, Ψpyridinium),which were based on a program written in our lab using the software of MATLAB (The Math Works Inc.).
3. Results and discussionTypical UV-vis spectra of Nd3+ and pyridinium are shown in Fig. 2. In this paper,we use the peak at 575 nm as the characteristic peak of Nd3+. The broad π-π transition bands around 255 nm in UV-vis spectra are utilized as the characteristic peak of pyridinium. It should be pointed out that pyridinium does not show any absorbance in the 400-800 nm region while Nd3+ has no absorbance in the 240-270 nm region. Therefore,the overlapping problem of the characteristic peaks of two solutes is avoided. Moreover,the absorption peaks of solvent do not overlap with the characteristic peaks mentioned above. Thus,the requirement of the DAOSD approach is satisfied.

|
Download:
|
| Fig. 2. The UV-vis spectrum of pyridine hydrochloride (the pathlength is 100 mm) and neodymium perchlorate (the pathlength is 1 cm). | |
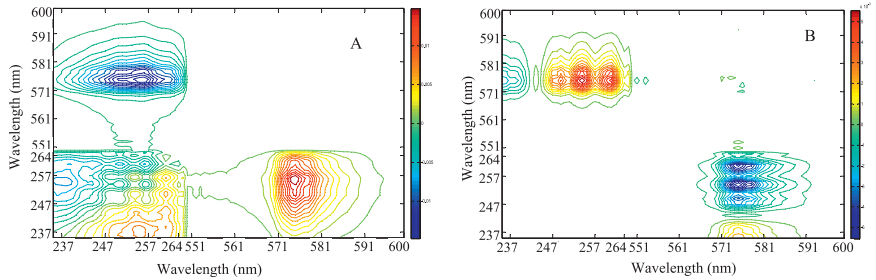
A pair of 2D asynchronous spectra (denoted as ΨNd and Ψpyridine) is constructed and the resultant 2D asynchronous spectra are shown in Fig. 3(a) and (b).

|
Download:
|
| Fig. 3. The 2D asynchronous spectra of the pyridinium/Nd3+ system generated by using the DAOSD approach. (a) ΨNd and (b) Ψpyridine. | |
There is no cross peak around (575 nm,575 nm) in Ψpyridine, suggesting that neither peak position nor bandwidth of characteristic peak of Nd3+ undergoes changes when Nd3+ ions are mixed with pyridine hydrochloride. On the other hand,a strong cross peak can be observed around (575 nm,255 nm) in ΨNd,suggesting that the absorptivity of the characteristic peak of Nd3+ increases as Nd3+ are mixed with pyridine hydrochloride.
Since the π-π transition band of pyridine hydrochloride is a broad peak with two shoulders locating around 250 nm and 262 nm,the complex spectral structure of the π-π transition band of pyridine hydrochloride produce complex cross peaks around (255 nm,255 nm) inΨNd. However,a pair of cross peak at (250 nm, 262 nm) and (262 nm,250 nm) can still be observed. The cross peak around (262 nm,250 nm) is positive. This spectral pattern suggests that the π-π transition band of pyridine hydrochloride undergoes a red-shift as a consequence of interaction between Nd3+ and pyridine hydrochloride. In Ψpyridine,three cross peaks appear around (249 nm,575 nm),(254 nm,575 nm),(261 nm, 575 nm). The pattern of cross peak suggests that the absorptivity of the π-π transition band increases upon interaction with Nd3+. The extent of the variation of absorptivity is more pronounced. Thus, spectral pattern relevant to band-shift observed around (254 nm, 575 nm) in Ψpyridine is masked.
Thus,experimental results from a pair of 2D asynchronous spectra generating by using the DAOSD approach clearly demonstrate that intermolecular interactions occur between Nd3+ and pyridinium.
We would like to discuss the physicochemical nature of the interaction between Nd3+ and pyridinium. First,the possibility that pyridine coordinates with Nd3+ can be excluded. Nd3+ is a hard Lewis acid while the nitrogen atom of pyridine is a soft Lewis base. Thus,pyridine,as a monodentate ligand,has little chance to coordinate with Nd3+ in aqueous solution. Moreover,the pH value of the aqueous solution is below 3.0. As a result,more than 99.99% nitrogen atoms of pyridine are locked by proton. Furthermore, experimental results from 2D asynchronous spectrum provide additional evidence to support that no coordination occurs between Nd3+ and pyridinium. If pyridine molecules take part in coordination with Nd3+,the resultant changes on coordination sphere will bring about changes on the f-f transition peaks. However,no cross peak is observed around (575 nm,575 nm) in Ψpyridine,confirming that there is no change on either peak position or bandwidth of the f-f transition peak.
Therefore,observable cross peak in 2D asynchronous spectrum generated by using the DAOSD approach confirmed that interaction does occur between Nd3+ and pyridinium. The only reasonable explanation is that the interaction stems from interaction between π electron of pyridinium from aromatic system and f electron from Nd3+ ions. Such an interaction may bring about considerable influence on the spectroscopic behavior of the system. Here we provide an example.
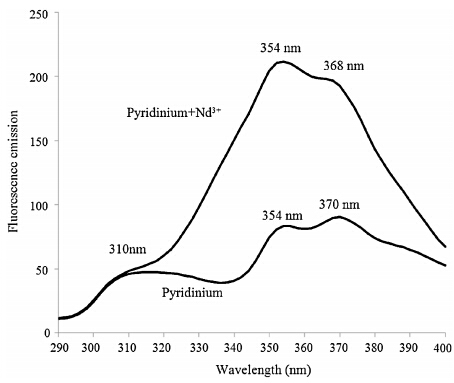
Pyridine was dissolved in D2O and acidified by DCl. Then fluorescent spectrum of pyridinium was recorded. When H2O and HCl were replaced by D2O and DCl,high frequency vibrations relevant to hydrogen atoms can be suppressed so that fluorescent signal can be enhanced significantly. Afterwards,neodymium perchlorate was added into the solution and the fluorescent spectrum was collected. The results are shown in Fig. 4. The fluorescent bands of pyridinium in emission spectrum exhibit remarkable variation upon introducing neodymium perchlorate. From this fact,we suggest that interaction between p electron from aromatic system and f electron from lanthanide ions can be an important factor in the development of functional material containing lanthanides.

|
Download:
|
| Fig. 4. The emission spectra of pyridinium-D2O solution and pyridinium/Nd3+-D2O solution (excitation wavelength = 255 nm). | |
We apply 2D asynchronous spectra generated by using the DAOSD approach to probe interactions between Nd3+ and pyridinium. Intermolecular interaction is proved to occur between Nd3+ and pyridinium via a series of cross peaks in the resultant 2D asynchronous spectrum. Since the possibility of coordination between Nd3+ and pyridine is excluded,the interaction stems from interaction between p electron from aromatic system and f electron from lanthanide ions. The interaction can produce remarkable influence on the spectroscopic behavior of the system. For example, the emission spectrum of pyridinium exhibits significant change upon introducing neodymium perchlorate into the system. The result demonstrates that 2D asynchronous spectroscopy,in conjunction with DAOSD scheme,provides us an experimental approach to characterize metal ions/organic functional groups interactions. Furthermore,the method can be applied to more extensive chemical systems with the help of the thickness-variable cuvette.
AcknowledgmentThis project is financially supported by the National Natural Science Foundation of China (No. 51373003) and Beijing Natural Science Foundation (No. 2122059).
| [1] | S.X. Liu, C.F. Zhang, E. Proniewicz, et al., Crystalline transition and morphology variation of polyamide 6/CaCl2 composite during the decomplexation process, Spectrochim. Acta A: Mol. Biomol. Spectrosc. 115 (2013) 783-788. |
| [2] | J. Liu, S.X. Liu, Y.L. Gao, et al., On the interaction between PVP and europium benzenesulfonate, Spectrosc. Spectral Anal. 33 (2013) 1487-1490. |
| [3] | S.X. Liu, C.F. Zhang, Y.H. Liu, et al., Coordination between yttrium ions and amide groups of polyamide 6 and the crystalline behavior of polyamide 6/yttrium composites, J. Mol. Struct. 1021 (2012) 63-69. |
| [4] | L. Wang, L.L. Li, H.L. Ma, H. Wang, Recent advances in biocompatible supramolecular assemblies for biomolecular detection and delivery, Chin. Chem. Lett. 24 (2013) 351-358. |
| [5] | Y.F. Liu, J.C. Su, W.H. Li, J.G. Wu, First hydrotalcite-like sulfonate coordination network incorporating robust cationic layers and flexible interlayer interactions, Inorg. Chem. 44 (2005) 3890-3895. |
| [6] | W.X. Sun, X.B. Hu, Y.Z. Xu, et al., Study on the interaction between polyamide and lanthanide ions, Acta Chim. Sinica 58 (2000) 1602-1607. |
| [7] | Y.Z. Xu, J.G. Wu, W.X. Sun, et al., A new mechanism of Raman enhancement and its application, Chem. Eur. J. 8 (2002) 5323-5331. |
| [8] | Y.Z. Xu, W.X. Sun, W.H. Li, et al., Investigation on the interaction between polyamide and lithium salts, J. Appl. Polym. Sci. 77 (2000) 2685-3690. |
| [9] | A.F. Xie, D.L. Tao, Z.B. Zhang, et al., The coordination and phase separation in nylon-copper chloride system, J. Mol. Struct. 613 (2002) 67-71. |
| [10] | Y.J. Wu, Y.Z. Xu, D.J. Wang, et al., FT-IR spectroscopic investigation on the interaction between nylon 66 and lithium salts, J. Appl. Polym. Sci. 91 (2004) 2869-2875. |
| [11] | J. Qi, K. Huang, X.X. Gao, et al., Orthogonal sample design scheme for twodimensional synchronous spectroscopy: application in probing lanthanide ions interactions with organic ligands in solution mixtures, J. Mol. Struct. 883-884 (2008) 116-123. |
| [12] | I. Noda, Generalized two-dimensional correlation method applicable to infrared, Raman, and other types of spectroscopy, Appl. Spectrosc. 47 (1993) 1329-1336. |
| [13] | Z.W. Yu, C. Lin, S.Q. Sun, I. Noda, Determination of selective molecular interactions using two-dimensional correlation FT-IR spectroscopy, J. Phys. Chem. A 106 (2002) 6683-6687. |
| [14] | J. Qi, H.Z. Li, K. Huang, et al., Orthogonal sample design scheme for two-dimensional synchronous spectroscopy and its application in probing intermolecular interactions, Appl. Spectrosc. 61 (2007) 1359-1365. |
| [15] | Y.H. Liu, C.F. Zhang, S.X. Liu, et al., Modified orthogonal sample design scheme to probe intermolecular interactions, J. Mol. Struct. 883-884 (2008) 124-128. |
| [16] | J. Chen, C.F. Zhang, H.Z. Li, et al., Patterns of cross peaks in 2D synchronous spectrum generated by using orthogonal sample design scheme, J. Mol. Struct. 883 (2008) 129-136. |
| [17] | C.F. Zhang, K. Huang, H.Z. Li, et al., Double orthogonal sample design scheme and corresponding basic patterns in two-dimensional correlation spectra for probing subtle spectral variations caused by intermolecular interactions, J. Phys. Chem. A 113 (2009) 12142-12156. |
| [18] | X.P. Li, Q.H. Pan, J. Chen, et al., Asynchronous orthogonal sample design scheme for two-dimensional correlation spectroscopy (2D-COS) and its application in probing intermolecular interactions from overlapping infrared (IR) bands, Appl. Spectrosc. 65 (2011) 901-917. |
| [19] | X.P. Li, S.X. Liu, J. Chen, et al., The influence of changing the sequence of concentration series on the 2D asynchronous spectroscopy generated by the asynchronous orthogonal sample design (AOSD) approach, Vib. Spectrosc. 60 (2012) 212-216. |
| [20] | X.P. Li, Q. Bi, S.X.J. Liu, et al., Improvement of the sensitivity of the two-dimensional asynchronous spectroscopy based on the AOSD approach by using a modified reference spectrum, J. Mol. Struct. 1034 (2013) 101-111. |
| [21] | J. Chen, Q. Bi, S.X. Liu, et al., Double asynchronous orthogonal sample design scheme for probing intermolecular interactions, J. Phys. Chem. A 116 (2012) 10904-10916. |
| [22] | Y.L. Gao, J. Liu, Y.H. Liu, et al., Characterization of the coordination between Nd3+ and ester groups by using double asynchronous orthogonal sample design approach, J. Mol. Struct. 1069 (2014) 205-210. |
| [23] | J. Liu, Y.L. Gao, L.R. Zheng, et al., Coordination between cobalt (II) ion and carbonyl group in acetone probed by using DAOSD approach, J. Mol. Struct. 1069 (2014) 217-222. |