


Formaldehyde (HCHO) is one of the most abundant carbonyls with high reactivity in the troposphere,playing roles in the variations of free radicals and oxidation processes [1]. It arises from primary and secondary emissions. The quantitative estimate of HCHO sources is,therefore,essential for effective measures of air quality improvement.
Intensive studies have been conducted to identify the sources of HCHO. The ratios of HCHO/acetaldehyde can be used as an indicator to perform a diagnostic evaluation,qualitatively,on the biogenic/anthropogenic origins of HCHO [2]. Several methods were used to quantify the primary and secondary sources of HCHO,such as methods based on the emission ratios of HCHO/tracer of primary sources [3, 4],the multi-linear regression method based on ambient measurements of HCHO and tracers [5, 6],the photochemical age method based on parameterization of atmospheric reactions [7, 8] and receptor models like positive matrix factorization (PMF) [9, 10]. In this study,the multi-linear regression approach was selected to estimate the HCHO sources in Ziyang city. The fundamental assumption of the method is that the primary and secondary sources of ambient HCHO are linearly associated with the variation of their respective tracers. Therefore, the key to this approach is to identify relevant tracers for both primary and secondary sources.
Ziyang city,the only city connecting Chengdu and Chongqing,is located in a subtropical,humid monsoon region. Because of the stable meteorological conditions,the city is not favorable situated for the removal of air pollutants by diffusion and,hence,has frequent haze pollution,which is typical for the Sichuan Basin. 2. Experimental
A field campaign was conducted from December 5 to 31,2012 in Ziyang city. The sampling site (30.15° N 104.64° E),located in the suburb of the city with minor traffic and no other emission sources in its vicinity,represents the general climate circumstances of the city according to the previous routine municipal air quality monitoring. Ambient HCHO concentrations were measured on the top of a platform about 4 m above the ground. Other VOCs, O3,CO,NO2,fine particles and parameters were measured simultaneously. During the observations,the wind speed was mostly lower than 0.1 m/s,with the prevailing wind from the northeast.
The Formaldehyde Analyzer 4021 (AERO LASER,Germany) based on Hantzsch reaction was used to measure the concentrations of ambient HCHO [11]. The detection limit of the instrument is below 0.05 ppb with a time resolution of one min. During the field campaign,quality control and quality assurance procedures were performed. The RSD (relative standard deviation) was within 1%. Our Hantzsch system measurements were compared with HCHO levels obtained by a proton-transfer-reaction mass spectrometer (PTR-MS),with the linear regression slope between these two systems of 0.83 and a R2 value of 0.7,representing good agreement. 3. Results and discussion 3.1. Ambient HCHO levels
During the measurement period,the concentration of HCHO ranged from 0.19 ppbv to 16.3 ppbv with an average at 2.98 ± 1.65 ppbv. The HCHO concentrations in Ziyang were compared with the levels measured in other cities in winter (Fig. 1): they were comparable to the concentrations in Beijing and Guangzhou [12, 13, 14, 15],while lower than the levels in Shanghai [16],and higher than those in some cities like New York [6].

|
Download:
|
| Fig. 1. HCHO concentrations in other cities in winter. | |
The main primary emissions of HCHO include vegetation, biomass burning,traffic and industries [17]. Ziyang has minor local industry,and the measurements were conducted in winter time, when biogenic emissions could also be neglected. Therefore,we placed the biomass burning and vehicular emissions as the major primary sources to be evaluated. We used two tracers for primary emissions [18]. From our survey,the public transportation in Ziyang uses natural gas as fuel. Propane (C3H8) emanates mainly from motor vehicles and natural gas use [19],so we selected propane as a tracer for vehicular emissions. Methane is the dominant species in natural gas,but methane has a very strong global background,making CH4 inappropriate for use as the tracer for local source. Acetonitrile (CH3CN) is an inert,organic,trace gas in the atmosphere which is predominantly emitted from biomass burning [20]. In an urban atmosphere,however,petrochemical industries,such as acrylic fiber manufacturers,might produce CH3CN as well. The site for our field campaign in Ziyang was selected at the location with no obvious industrial emissions in the vicinity,and therefore,we concluded it is feasible to choose CH3CN as a tracer for biomass burning sources.
In previous studies,O3 was often used as a tracer for secondary production in the atmosphere,but in this study we selected peroxyacetyl nitrate (PAN) to indicate secondary HCHO. The main reason is that O3 has a definite regional background which is very difficult to quantify,and when compared to O3,the background concentrations of PAN are negligible,and HCHO is not a direct precursor for production of PAN [21]. So we considered that PAN could serve as an acceptable indicator for the evolution of photochemical processing and hence the production of secondary HCHO. We believe that PAN was not ideal to trace HCHO production in the air since its production and loss pathways differ from that HCHO,and it would be valuable to try other candidates, like glyoxal,when the measurements were available.
The equation of the multi-linear regression model is as follows:

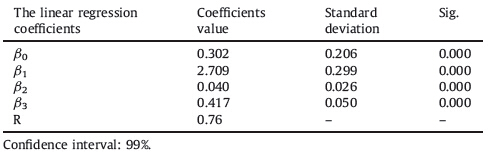
In Eq. (1),the HCHO concentration originates from four sources: background concentration (ß0),biomass burning contributions (ß1[CH3CN]),vehicular source contributions (ß2 [C3H8]),and secondary productions (ß3 [PAN]). ß0,ß1,ß2 and ß3 are correlation coefficients from linear regression,respectively.
The results of estimated source contributions are shown in Tables 1 and 2. When significance values (P-values) turn out to be lower than 0.01 and an R > 0.75,the correlation is considered to be significant at confidence level of 0.01. Both the significance values and R in Table 1 meet the criteria,indicating the linear relationship is statistically reliable.
| Table 1 The multi-linear regression coefficients of HCHO concentrations to tracers. |
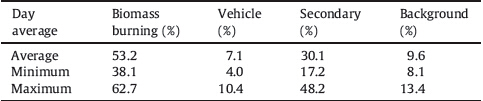
| Table 2 The relative contributions of primary and secondary HCHO. |
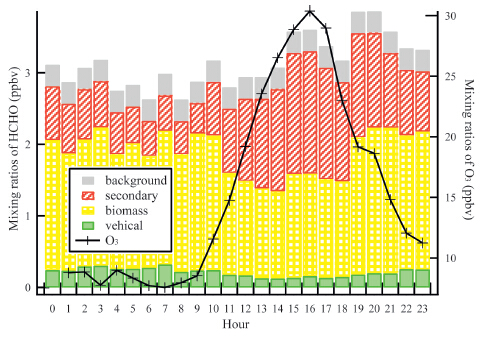
During the measurement period,the biomass burning contributed the largest portion to ambient HCHO with the average contribution at 53.2%,and the daily average ranged between 38.1% and 62.7%,followed by the average contribution of 30.1% (17.2%- 48.2%) from secondary sources and 7.1% (4%-10.4%) from vehicular sources. The diurnal variation of the contribution of secondary sources was similar to the diurnal pattern of measured O3 concentrations (Fig. 2),suggesting that our evaluation of HCHO sources could be reasonable. But it is worth noting that we estimated the secondary HCHO at night was about 0.7 ppb; we believe that this part of the secondary HCHO is not produced chemically at night,and it is,in all likelihood,the residue of secondary products remaining from daytime photochemistry.

|
Download:
|
| Fig. 2. Average diurnal variation of HCHO from different sources. | |
The levels of HCHO in Ziyang during the measurement period range between 0.19 ppbv and 16.3 ppbv with an average of 2.98 ± 1.65 ppbv,which are comparable to the concentrations in Beijing and Guangzhou in winter,but lower than the levels in Shanghai. Using ambient CH3CN as a tracer for biomass burning,C3H8 as tracer for vehicular sources and PAN as tracer for secondary sources,we estimated the relative contributions of different sources through a multi-linear regression approach. The result indicated that in winter in Ziyang biomass burning sources contributed most of the ambient HCHO at an average contribution of 53.2%; the motor vehicle sources contributed only 7.1%; and the secondary sources accounted for 30.1%.
| [1] | M. Possanzini, V. Dipalo, A. Cecinato, Evaluation of lower carbonyls and photochemical oxidants by HPLC-UV and HRGC-MS, Atmos. Environ. 37 (2003) 1309- 1316. |
| [2] | P.B. Shepson, D.R. Hastie, H.I. Schiff, et al., Atmospheric concentrations and temporal variations of C1-C3 carbonyl compounds at two rural sites in central Ontario, Atmos. Environ. A 25 (1991) 2001-2015. |
| [3] | M. Possanzini, V.D. Palo, A. Cecinato, Sources and photodecomposition of formaldehyde and acetaldehyde in Rome ambient air, Atmos. Environ. 36 (2002) 3195- 3201. |
| [4] | Y.C. Lin, J.J. Schwab, K.L. Demerjian, Summertime formaldehyde observations in New York city: ambient levels, sources and its contribution to HOx radicals, J. Geophys. Res. 117 (2012) D08305. |
| [5] | S. Friedfeld, M. Fraser, K. Ensor, et al., Statistical analysis of primary and secondary atmospheric formaldehyde, J. Atmos. Environ. 36 (2002) 4767-4775. |
| [6] | Y. Li, M. Shao, S.H. Lu, C.C. Chang, P.K. Dasgupta, Variations and sources of ambient formaldehyde for the 2008 Beijing Olympic Games, J. Atmos. Environ. 44 (2010) 2632-2639. |
| [7] | J.A. de Gouw, A.M. Middlebrook, C. Warneke, et al., Budget of organic carbon in a polluted atmosphere: results from the New England Air Quality Study in 2002, J. Geophys. Res. Atmos. 110 (2005) D16. |
| [8] | B. Yuan, M. Shao, J. de Gouw, D.D. Parrish, et al., Volatile organic compounds (VOCs) in urban air: how chemistry affects the interpretation of positive matrix factorization (PMF) analysis, J. Geophys. Res. 117 (2012) D24302. |
| [9] | P. Paatero, U. Tapper, Positive matrix factorization: a non-negative factor model with optimal utilization of error-estimates of data values, Environmetrics 5 (1994) 111-126. |
| [10] | B. Buzcu Guven, E.P. Olaguer, Ambient formaldehyde source attribution in Houston during TexAQSⅡ and TRAMP, Atmos. Environ. 45 (2011) 4272-4280. |
| [11] | J.Z. Li, P.K. Dasgupta, W. Luke, Measurement of gaseous and aqueous trace formaldehyde: revisiting the pentanedione reaction and field applications, Anal. Chim. Acta 531 (2005) 51-68. |
| [12] | Q. Wang, Variations and Sources Apportionment of Ambient Carbonyl Compounds, Master Thesis, Peking University, 2011. |
| [13] | Y.J. Zhang, Y.J. Mu, J.F. Liu, A. Mellouki, Levels, sources and health risks of carbonyls and BTEX in the ambient air of Beijing, China, J. Environ. Sci. 24 (2012) 124-130. |
| [14] | X.B. Pang, Y.J. Mu, Seasonal and diurnal variations of carbonyl compounds in Beijing ambient air, Atmos. Environ. 40 (2006) 6313-6320. |
| [15] | H. Lü , Q.Y. Cai, S. Wen, Y. Chi, S. Guo, Seasonal and diurnal variations of carbonyl compounds in the urban atmosphere, Sci. Total. Environ. 408 (2010) 3523-3529. |
| [16] | J. Huang, Y.L. Feng, J. Li, et al., Characteristics of carbonyl compounds in ambient air of Shanghai, China, J. Atmos. Chem. 61 (2008) 1-20. |
| [17] | S.G. Moussa, M. El-Fadel, N.A. Saliba, Seasonal, diurnal and nocturnal behaviors of lower carbonyl compounds in the urban environment of Beirut, Lebanon, Atmos. Environ. 40 (2006) 2459-2468. |
| [18] | B. Rappenglü ck, P.K. Dasgupta, M. Leuchner, Q. Li, Formaldehyde and its relation to CO, PAN, and SO2 in the Houston-Galveston airshed, Atmos. Chem. Phys. 10 (2010) 2413-2424. |
| [19] | R.J. Weber, A.P. Sullivan, R.E. Peltier, et al., A study of secondary organic aerosol formation in the anthropogenic-influenced southeastern United States, J. Geophys. Res. 112 (2007) D13302. |
| [20] | A.R. Garcia, R. Volkamer, L.T. Molina, M.J. Molina, Separation of emitted and photochemical formaldehyde in Mexico City using a statistical analysis and a new pair of gas-phase tracers, Atmos. Chem. Phys. 6 (2006) 4545-4557. |
| [21] | J.A. de Gouw, C. Warneke, D.D. Parrish, et al., Emission sources and ocean uptake of acetonitrile (CH3CN) in the atmosphere, J. Geophys. Res. 108 (2003) D11. |