Application of response surface methodology for optimization of Orange Ⅱ removal by heterogeneous Fenton-like process using Fe3O4 nanoparticles
1. Introduction
Azo dyes are ubiquitous commercial chemicals that are used widely in textiles,leather tanning,paper production and other areas. The presence of dyes in water effluents is a cause for great environmental concern because the low reactivity of the azo bond (-N=N-) makes this class of compounds resistant to degradation. Orange Ⅱ is a typical azo dye and has been selected as a model dyeing pollutant in many investigations,including this study,because of its widespread application and recalcitrant nature.
Recently,the advanced oxidation processes (AOPs) for wastewater treatment have attracted more attention because of the formation of hydroxyl radicals (·OH),a species that acts as a strong oxidant to a wide variety of organic and inorganic compounds [1]. Among the AOPs technologies,one of the most intensively studied is the process based on the Fenton reaction,which has its own unique advantages including high degradation efficiency,simple operation,and inexpensive materials [2]. However,in homogeneous Fenton system,because of the presence of a large amount of iron sludge in water,removal from the final effluent is difficult and expensive [3]. For this reason,the development of efficient,cheap and easily prepared heterogeneous catalysts has received considerable interest. Among various heterogeneous Fenton-like catalysts,Fe3O4 nanoparticles (Fe3O4 NPs) seem to be promising catalysts,due to the intrinsic peroxidase-like activity which can accelerate the decomposition of H2O2 and can be easily separated from the reaction medium by an external magnetic field [4].
Response surface methodology (RSM) is a widely accepted statistical-based method for designing experiments,evaluating the individual and interaction effects of independent variables,and optimizing the process parameters with limited number of experiments [5, 6, 7, 8]. For Fenton and Fenton-like processes,the factors influencing degradation efficiency mainly includes catalyst loading,initial pH reaction temperature and H2O2 concentration. The traditional method to determine the optimal conditions of these variables is to test a single factor at one time while keeping the other variables constant. This methodology does not include a study of interactions between variables and could lead to restricted conclusions. A better research plan should include selection of the variables involved in the process,factorial design of experiments,experimental assays and fitting of results using mathematical methods. The response surface methodology (RSM) based on Box- Behnken design (BBD) is a useful approach for optimizing variables that has been used successfully in other studies [9, 10, 11].
In this work,Fe3O4 NPs were synthesized by the oxidation- precipitation method route,and synthesized Fe3O4 NPs materials were characterized by Scanning electron microscopy (SEM),powder X-ray diffraction (XRD) and Fourier transform infrared spectroscopy (FT-IR). The catalytic properties of obtained heterogeneous catalysts were assessed in the peroxide oxidation of Orange Ⅱ solution. The response surface methodology (RSM) based on Box-Behnken design (BBD) was employed to design and optimize individual and interactive effects of the four main independent parameters (catalyst loading,initial pH,reaction temperature and H2O2 concentration) on decolorization efficiency of Orange Ⅱ.
2. Experimental
Materials: FeSO4·7H2O,NaNO3,NH3·H2O,NaOH,H2SO4,H2O2 (30%,w/w) and Orange Ⅱ (OⅡ) were purchased from Sinopharm Chemical Reagent Co.,Ltd (China). All the chemical reagents were of analytical grade and used without further purification.
Preparation of Fe3O4 NPs catalyst: Fe3O4 NPs were synthesized by oxidation-precipitation method. FeSO4·7H2O (4 g) and NaNO3 (1.8 g) were dissolved in 200 mL of deionized water. The resulting solution was deoxygenated by bubbling with N2 for 20 min and then heated to 95 ℃ with stirring in a round-bottom flask. Afterwards,20 mL NH3·H2O was heated to 95 ℃ and added drop wise (10 mL/min) to the FeSO4·7H2O and NaNO3 mixed solution with vigorous stirring and stable N2 flow during the entire reaction period. After that,the solution was heated at 95 ℃ for 3 h,and then cooled to r.t. The black precipitate was isolated by using an external magnetic field and the supernatant was decanted. The resulting solid material was quickly rinsed five times with deionized water and rinsed three times with absolute ethyl alcohol,the synthetic Fe3O4 NPs were dried at 80 ℃ under vacuum for 12 h and stored in a desiccator for further use.
Characterization of Fe3O4 NPs catalyst: The microstructure of the samples was investigated by Nova 400 Nano SEM. The Powder X-ray diffraction (XRD) patterns were recorded using a Rigaku D/ MAX-RB,employing a range from 3° to 70°,diffractometer equipped with a Cu Kα radiation (λ = 1.54056Å ,40 kV,50 mA). The JCPDS PDF database was used for the phase identification. Fourier transform infrared spectra (FT-IR) were recorded in the range 4000-500 cm-1 with a BRUKER Model VERTEX70 FT-IR spectrometer (Germany),using a KBr wafer.
Experimental procedures and statistical analysis: The experiments were carried out in a conical flask containing 100 mL of reaction solution under constant stirring. The pH of solution was adjusted by H2SO4 and NaOH. Prior to the degradation reaction,the suspension containing Fe3O4 NPs catalyst and Orange Ⅱ was stirred for 5 min to achieve homodispersion. Then,the Fenton-like reaction was initiated by adding H2O2 to the Orange Ⅱ solution. After 60 min reaction,a sample was analyzed by UV-vis spectroscopy (Ultrospec 3300 pro) at a wavelength of 484 nm,which is the maximum absorption wavelength of Orange Ⅱ [12]. The concentration of Orange Ⅱ was converted through the standard curve method of dyes.
In this study,the optimization of experimental conditions for Orange Ⅱ decolorization by Fe3O4 NPs catalytic degradation was conducted using Box-Behnken design (BBD) technique under response surface methodology (RSM),which is a collection of mathematical and statistical techniques for designing experiments,building models and evaluating the effects of factors. This approach permits evaluating not only the factors influencing the degradation of Orange Ⅱ,but also the interaction between these factors. The software Design Expert 8.05b was used for the experimental design,data analysis,quadratic model buildings,and graph plotting. A total of 29 experiments were employed in this analysis. The independent variables of catalyst loading,initial pH,reaction temperature and H2O2 concentration were coded with low level as-1 and high levels as +1 in BBD as shown in Table 1 and the results along with the experimental conditions are presented in Table 2. The response was expressed as % of Orange Ⅱ removal,which could be calculated by using the equation of (C0-Ci)/ C0 × 100%,where C0 and Ci are the initial Orange Ⅱ concentration and the measured Orange Ⅱ concentration after 30 min reaction,respectively.
Table 1

Table 1
Factors and levels of Box-Behnken.
|
Table 1
Factors and levels of Box-Behnken. |
Table 2
Table 2
Design and results of Box-Behnken.
|
Table 2
Design and results of Box-Behnken. |
3. Results and discussion
3.1. Characterization of the catalysts
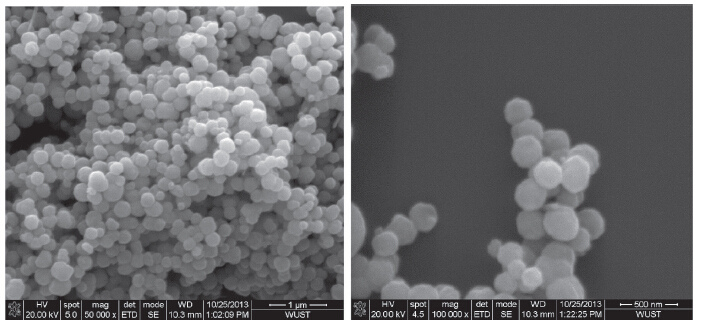
The surface morphologies of the as-prepared products can be illustrated by SEM images. The images in Fig. 1 shows the regular crystal structure and the distribution of diameters of synthesized Fe3O4 nanoparticles ranging from 100 nm to 200 nm.
The crystalline structure of the as-prepared products was characterized by XRD pattern. As shown in Fig. 2(a),it is found that all the diffraction peaks in 2θ = 30.24°,35.62°,43.26°,53.56°,57.12° and 62.78° are consistent with the referenced data of (2 2 0),(3 1 1),(4 0 0),(4 2 2),(5 1 1) and (4 4 0) plane distances,respectively (JCPDS card No. 65-3107). Furthermore,no other miscellaneous diffraction peak were detected in the XRD patterns. Therefore,the XRD pattern can provide enough evidence to confirm that Fe3O4 NPs can be prepared successfully of high purity by such an oxidation-precipitation method,and the strong and sharp peaks of the sample indicate a good crystalline state.
The average diameter of the products also can be obtained from Scherrer’s formula [13]: D = Kλ/βcosθ,where D is particle diameter,the X-ray wavelength of Cu Kα radiation λ is 1.54Å ,and K is the shape factor,which can be assigned a value of 0.89 if the shape is unknown,cosθ is the cosine of the Bragg angle and β is the peak width at half-maximum intensity (FWHM). The average sizes of Fe3O4 NPs prepared are calculated to be about 160 nm,which is consistent with the result of the SEM images.
As shown in Fig. 2(b),the FT-IR spectrum of Fe3O4 NPs synthesized exhibited only the characteristic peak of Fe-Ovibration modes at 572 cm-1 [14]. The absorption peaks at 3404 cm-1 and l632 cm-1 are due to the stretching vibrations of -OH and -FeOO-. It indicates that there are some activated -OH groups at the surface of Fe3O4 NPs [15].
3.2. ANOVA
The full factorial Box-Behnken design (BBD) with four factors in three levels,as well as the results of Orange Ⅱ degradation rate,are presented in Table 2.
An approximate regression model of the decolorization efficiency based on the experimental results was evaluated and expressed by the following second-order polynomial equation:
In Eq. (1),Y is the Orange Ⅱ decolorization efficiency,A,B,C and D are corresponding coded variables of catalyst loading,initial pH value,reaction temperature and H2O2 concentration,respectively.
Statistical testing of the model was performed by analysis of variance (ANOVA) and the results for the coded variable levels are shown in Table 3. These results shows that the regression model had a high value of coefficient of determination (R2 = 93.69%). The R2-value provides a measure of how much variability in the observed response values can be explained by the experimental factors and their interactions. This implies that 93.69% of the variations for dye removal efficiency are explained by the independent variables and this also means that the model does not explain 6.31% of variation. The value of the adjusted determination coefficient (adjusted R2 = 0.8738) also proved the high significance of the model. In addition,the low value of the coefficient of variation (C.V. = 2.45%) suggested the high precision and reliability of the experiment. In addition,the F-test of the regression models produced very low p-values (<0.0001),indicating that the model was of high significance.
Table 3
Table 3
Analysis of variance (ANOVA) for fit of decolorization efficiency from central composite design.
|
Table 3
Analysis of variance (ANOVA) for fit of decolorization efficiency from central composite design. |
As shown in Fig. 3,the comparison of actual and predicted results of the process efficiency shows that the predicted data are in good agreement with the experimental ones. Therefore,the regression models can be used to predict the Orange Ⅱ removal from the initial experimental conditions.
3.3. Three-dimensional (3D) surface plots and optimization analysis
Fig. 4 presents the response surface modeling in a three dimensional (3D) representation reflecting the effects of catalyst loading,initial pH,reaction temperature and H2O2 concentration on the removal of Orange Ⅱ by heterogeneous Fenton-like reactions on Fe3O4 NPs. Fig. 4a-c illustrate the effect between initial pH and catalyst loading,reaction temperature,and H2O2 concentration,respectively. Obviously,all three illustrations show a similar trend,decolorization efficiency increased with decreasing initial pH and at least 95% of color removal is obtained after initial pH reaches less than 3.00. However,the effect of catalyst loading,reaction temperature and H2O2 concentration are less significant relative to the process variable,initial pH. On the other hand,when a lower catalyst loading,reaction temperature and H2O2 concentration are available,color removals increase with decreasing the initial pH reaching their maximum values. For instance,a color removal of≥95% is desired,using lower dosage of catalyst,reaction temperature and H2O2 concentration might be an attractive option from economical points of view. The interaction effect of reaction temperature and H2O2 concentration on the degradation of Orange Ⅱ is presented in Fig. 4d. The decolorization efficiency increased from 92.2% to 99.8% when the reaction temperature increased from 30 8C to50 8C at the lowest H2O2 concentration of 10 mmol/L,but it almost no change and always more than 95% at the highest H2O2 concentration of 30 mmol/L,that means the lower reaction temperature with high H2O2 concentration could save amount of energy in the practical application.
3.4. Model validation and experimental confirmation
The desired goal in term of decolorization efficiency was defined as ‘‘maximize’’ to achieve highest treatment performance. The optimum values of the process variables for the maximum decolorization efficiency are shown in Table 4. After verification through a further experimental test with the predicted values,the result indicates that the maximum decolorization efficiency is obtained when the values of each parameter were set as the optimum values. It implies that the strategy to optimize the decolorization conditions and to obtain the maximal decolorization efficiency by RSM for the decolorization of the dye Orange Ⅱ with Fe3O4 NPs in this study is successful.
Table 4
Table 4
Optimum operating conditions for maximum decolorization efficiency.
|
Table 4
Optimum operating conditions for maximum decolorization efficiency. |
3.5. Control experiment
Setting the initial concentration of Orange Ⅱ at 100 mg/L and the pH at 2.7,the efficiency for the decolorization of Orange Ⅱ by adding 1.5 g/L of Fe3O4 or 22 mmol/L of H2O2 was investigated. Fig. 5 reveals that the decolorization efficiency of Orange Ⅱ with Fe3O4 alone was 30% after 90 min,and with H2O2 alone after 90 min was 5.7%,due to the adsorption of Fe3O4 and a little ·OH released by H2O2 under illumination,respectively. In the presence of Fe3O4 and H2O2,the decolorization efficiency reaches as much as 99.89% after reacting for 90 min,which shows that there was a synergistically cooperative effect with Fe3O4 and H2O2 acting together and the entire decomposition of Orange Ⅱ is dominated by the heterogeneous Fenton-like reaction.
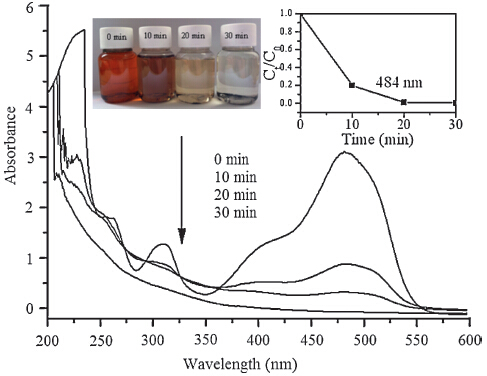
The UV-vis spectra recorded during the decolorization of Orange Ⅱ by Fe3O4 NPs in the presence of H2O2 is shown in Fig. 6. Previous research has demonstrated that Orange Ⅱ has three absorption peaks at 230,310 and 484 nm,which are assigned to the benzene ring,naphthalene ring and azo bond,respectively. The trend in variation shows that the three absorption peaks in the visible region and UV region gradually disappear,indicating that the dramatic destruction of chromophores and the decay of the benzene ring and naphthalene ring. The inset shows the photograph of samples with different time intervals,it can be directly observed that the colors of the solution fade gradually,which agreed well with the result of UV-vis spectra.
4. Conclusion
This work has described an efficient method of synthesizing Fe3O4 NPs by the named oxidation-precipitation method,in which ferrous sulfate used as starting material,ammonium hydroxide as alkaline solution and sodium nitrate as oxidant. The characterization results indicate that Fe3O4 NPs with regular crystal structure and a narrow distribution of diameters have been synthesized with high purity. The response surface methodology (RSM) based on the Box-Behnken design (BBD) is employed to design and optimize individual and interactive effects of the four main independent parameters on the decolorization efficiency of Orange Ⅱ. The result of ANOVA shows that the regression model was of high significance and can be used to predict the Orange Ⅱ removal from the initial experimental conditions. Optimum conditions were a catalyst loading of 1.5 g/L,initial pH of 2.7,reaction temperature of 42 ℃ and H2O2 concentration of 22 mmol/L,respectively. The predicted decolorization rate under the optimum conditions,as determined by the proposed model,was 99.55%. Confirmatory tests were carried out and the decolorization rate of 99.49% was observed after 30 min of reaction time under the optimum conditions,which agreed well with the model predictions. The data indicate the strategy to optimize the decolorization conditions,and to obtain themaximal decolorization efficiency by RSM for the decolorization of the dye Orange Ⅱ with Fe3O4 NPs in this study was successful.
Acknowledgments
This project was financially supported by the Specialized Research Fund for the Doctoral Program of Higher Education of China (No. 20114219110002),Fund from Coal Conversion and New Carbon Materials Hubei Key Laboratory (Wuhan University of Science and Technology) (No. WKDM201107),and Educational Commission of Hubei Province of China (No. D20131107).


