


The artificial sweetener,aspartame (L-aspartyl-L-phenylalanine methyl ester,APM) has long been commonly used as a substitute of sugar in low-calorie meals,soft drinks and frozen desserts [1] due to a degree of sweetness 180 times higher than sucrose [2]. The Joint Food and Agriculture Organization/World Health Organization Expert Committee on Food Additives approved the use of APM in 1982,with a recommended acceptable daily intake of 0-40 mg/ kg body weight [3]. Nevertheless,the issue of safety of APM has been controversial since it was discovered [4, 5]. A number of studies claimed some negative health effects from APM ingestion. It was reported that APM can cause changes in behavior (such as depression and insomnia),alteration in vision,and mental retardation,especially in children [2]. Furthermore,APM was also suspected as carcinogenic [6]. Under this controversy about the safety of APM,the European Commission required the European Food Safety Authority (EFSA) to re-evaluate the security of APM in May 2011. In the assessment process,the expert group of EFSA found that the data of 5-benzyl-3,6-dioxo-2-piperazieacetic acid (DKP),which was the degradation product of APM,was lacking and needed further relevant research.
While APM is harmless itself,it has poor stability at various pH and temperatures,and thus has different degrees of degradation, which can produce aspartic acid (ASP),phenylalanine (PHE), aspartyl-phenylalanine (ASP-PHE) and DKP [7]. These substances, especially DKP,may be harmful to the metabolic processes in the human body [4, 8]. What is worse,the diet soft drinks which contain APM at different pH,depending on the matrix,may also be stored under different temperatures. Therefore,it is important to establish a sensitive,rapid and accurate method for the simultaneously detection of APM and its four degradation products. Furthermore,exploring the degradation of APM at various pH and temperatures is of great significance. A variety of analytical methods,including liquid chromatography [1, 8] and capillary zone electrophoresis [9],have been reported for the quantitative analysis of APM,its degradation products and the other sweeteners. However,the sensitivities of these methods are limited and serious matrix interferences can hardly be avoided. In addition,it is difficult to chromatographically separate the peak response of APM and its degradation products,as they have similar structures [10].
It has been reported that single quadrupole mass spectrometry (MS) [7, 11] was used to quantify APM,its degradation products and the other sweeteners. Compared to MS,tandem mass spectrometry (MS/MS) possesses further sensitivity and stability [12]. What is more,with the improvement of chromatographic techniques,high-performance liquid chromatography (HPLC) has been developed to shorten the analysis time and increase the resolution,capacity and sensitivity,especially when it is coupled with MS/MS [13, 14, 15]. Recently,many reports were focused on the application of HPLC-MS/MS in complex samples analysis [16, 17]. However,to the best of our knowledge,to date no systematic study on the degradation of APM by HPLC-MS/MS has been published.
The aim of this paper is to develop a sensitive,rapid and accurate method using HPLC-MS/MS to simultaneously analyze APM and its four degradation products ASP,PHE,ASP-PHE and DKP. This method is also applied to the study of the degradation of APM at various pH and temperatures,which includes quantifying the main degradation products and exploring degraded pathways. The identification characteristics in the mass spectrum of the five analytes are also included. 2. Experimental 2.1. Materials
The organic reagents were of HPLC-grade and all other chemicals were of analytical reagent-grade. APM,ASP and ASP-PHE were purchased from J&K Chemical (Beijing,China). PHE and DKP were obtained fromSigma-AldrichChemistry (St. Louis,USA).Acetonitrile was purchased from Fisher Scientific (Hampton,USA). Formic acid was obtained fromFluka Analytical (Buchs,Switzerland). Ammonia solution was purchased from Xilong Chemical (Guangdong,China). Plastic bottled cola was obtained from a local supermarket. 2.2. Instrumentations
The HPLC-MS/MS instrumentations used in this paper were all obtained from Shimadzu (Kyoto,Japan). The HPLC was performed on a LC-20A system. The separation was carried out on the column VP-ODS (150 mm × 2 mm,4.6 μm). Flow rate of the mobile phase was controlled by a LC-20AD Pump and CBM-20A Controller. The gradient solvent system consisted of solvent A (0.1% formic acid in water,v/v) and solvent B (acetonitrile). The content of solvent B in the mobile phase for the separation of the tested mixture increased from 10% to 45% in 5 min and was maintained at 45% for 5-7 min. The total time for one run was 7 min. The injection volume was 5 mL. The flow rate was set at 0.2 mL/min and the oven temperature was set at 30 ℃.
The HPLC was coupled to a Shimadzu 8030 triple quadrupole mass spectrometer with an electrospray ionization interface. Nitrogen was supplied as the nebulizing gas and drying gas at the flow rates of 2.5 L/min and 15 L/min,respectively. The heat block temperature was set at 400 ℃. For MS/MS measurements,the mass spectrometer was operated in the multiple reaction monitoring (MRM) mode. Data acquisition was controlled using Shimadzu LCMS Lab Solution software. 2.3. Standards
Aqueous standard solutions of APM,ASP,PHE,ASP-PHE and DKP were separately prepared by dissolving the standard materials in distilled water to give a final concentration of 1000 mg/L and then were stored at 4 ℃ in a refrigerator. The solutions used in the parameter optimization experiments were separately prepared just prior to use by diluting the standard stock solution of each analyte with distilled water to a final concentration of 1 mg/L. Mixed standard solution was prepared just prior to use by diluting the standard stock solution of each analyte with distilled water to a final concentration of 1 mg/L.
A series of the calibration standard water solutions were used for blank matrix curve construction. APM was at the concentration ranges of 10-1000 mg/L while ASP,PHE,ASP-PHE and DKP were at the concentration ranges of 10-500 μg/L. Each calibration standard solution was prepared by mixing appropriate volumes of five prepared stock solutions into the same volumetric flask and adjusting the final volume with distilled water. Similarly,a series of the calibration standard cola solutions were used for cola matrix curve construction. Each calibration standard solution was prepared by diluting the cola solution by 50 times.
For degradation study at various pH,six standard APM solutions (pH 2,4,6,7,8 and 10) were prepared by diluting the standard stock APM solution with distilled water to a final concentration of 20 mg/L,and adjusting the pH with formic acid or ammonia solution. Each solution was stored under 30 ℃ and was diluted to a concentration of 1 mg/L before being tested. Similarly,three standard APM solutions at pH 4,kept and 4,30 and 60 ℃,were prepared for the degradation study at different temperatures. 2.4. Sample preparation
The plastic bottled cola A and cola B were degassed in an ultrasonic bath for 20 min and filtered via 0.2 μm microporous film. They were diluted 100 times with distilled water before injecting into the HPLC-MS/MS system with 5 μL injection volume. 3. Results and discussion 3.1. Optimization of HPLC-MS/MS conditions
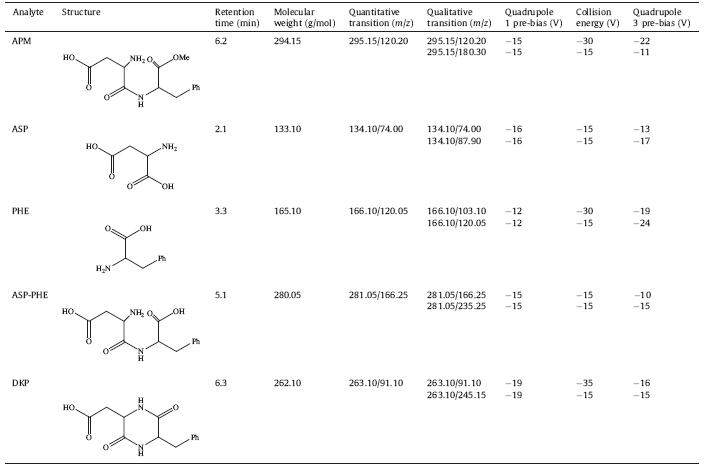
The study of the ionization of the APM,ASP,PHE,ASP-PHE and DKP was performed by scanning them/z ranging from 100 to 500 in both positive and negative modes. In the results,the more abundant precursor ions of the analytes were their molecular ions [M+H]+. Therefore,the analytes were detected in the positive ion mode in remaining work. In order to get the most sensitive product ion,the fragmentations of each compound were studied by using product ion scan mode at various collision energies (CE). The Quadrupole 1 pre-bias and Quadrupole 3 pre-bias were also optimized by direct injection of individual analyte solutions. The characteristic product ion and optimal MS/MS parameters for each analyte are listed in Table 1. The product ion of APM at m/z 180 represented [C6H5CH2CH(COOCH3)NH3]+. Then it lost one HCOOCH3 (60 Da) to produce ion at m/z 120. The product ions originated from the ASP were [ASP+H-HCOOH]+ at m/z 88 and [ASP+H-CH3COOH]+ at m/z 74. The ions assigned to PHE were [PHE+H-HCOOH]+ at m/z 120 and [PHE+H-HCOOH-NH3]+ at m/z 103. The loss of one HCOOH (46 Da) explained the presence of an ion at m/z 235 from ASP-PHE,while the ion at m/z 166 was [C6H5CH2CH(COOH)NH3]+. Finally,the ion at m/z 245 was the result of a loss of one H2O (18 Da) from DKP and the ion at m/z 91 was [C6H5CH2]+ consistent with the cleavage of the branched chain of the ring. In order to simultaneously determine APM,ASP,PHE, ASP-PHE and DKP,aMRMqualitative method was set up. The most abundant product ion in the mass spectra was used for quantification.
| Table 1 Tandem mass spectrometry parameters of the five analytes. |
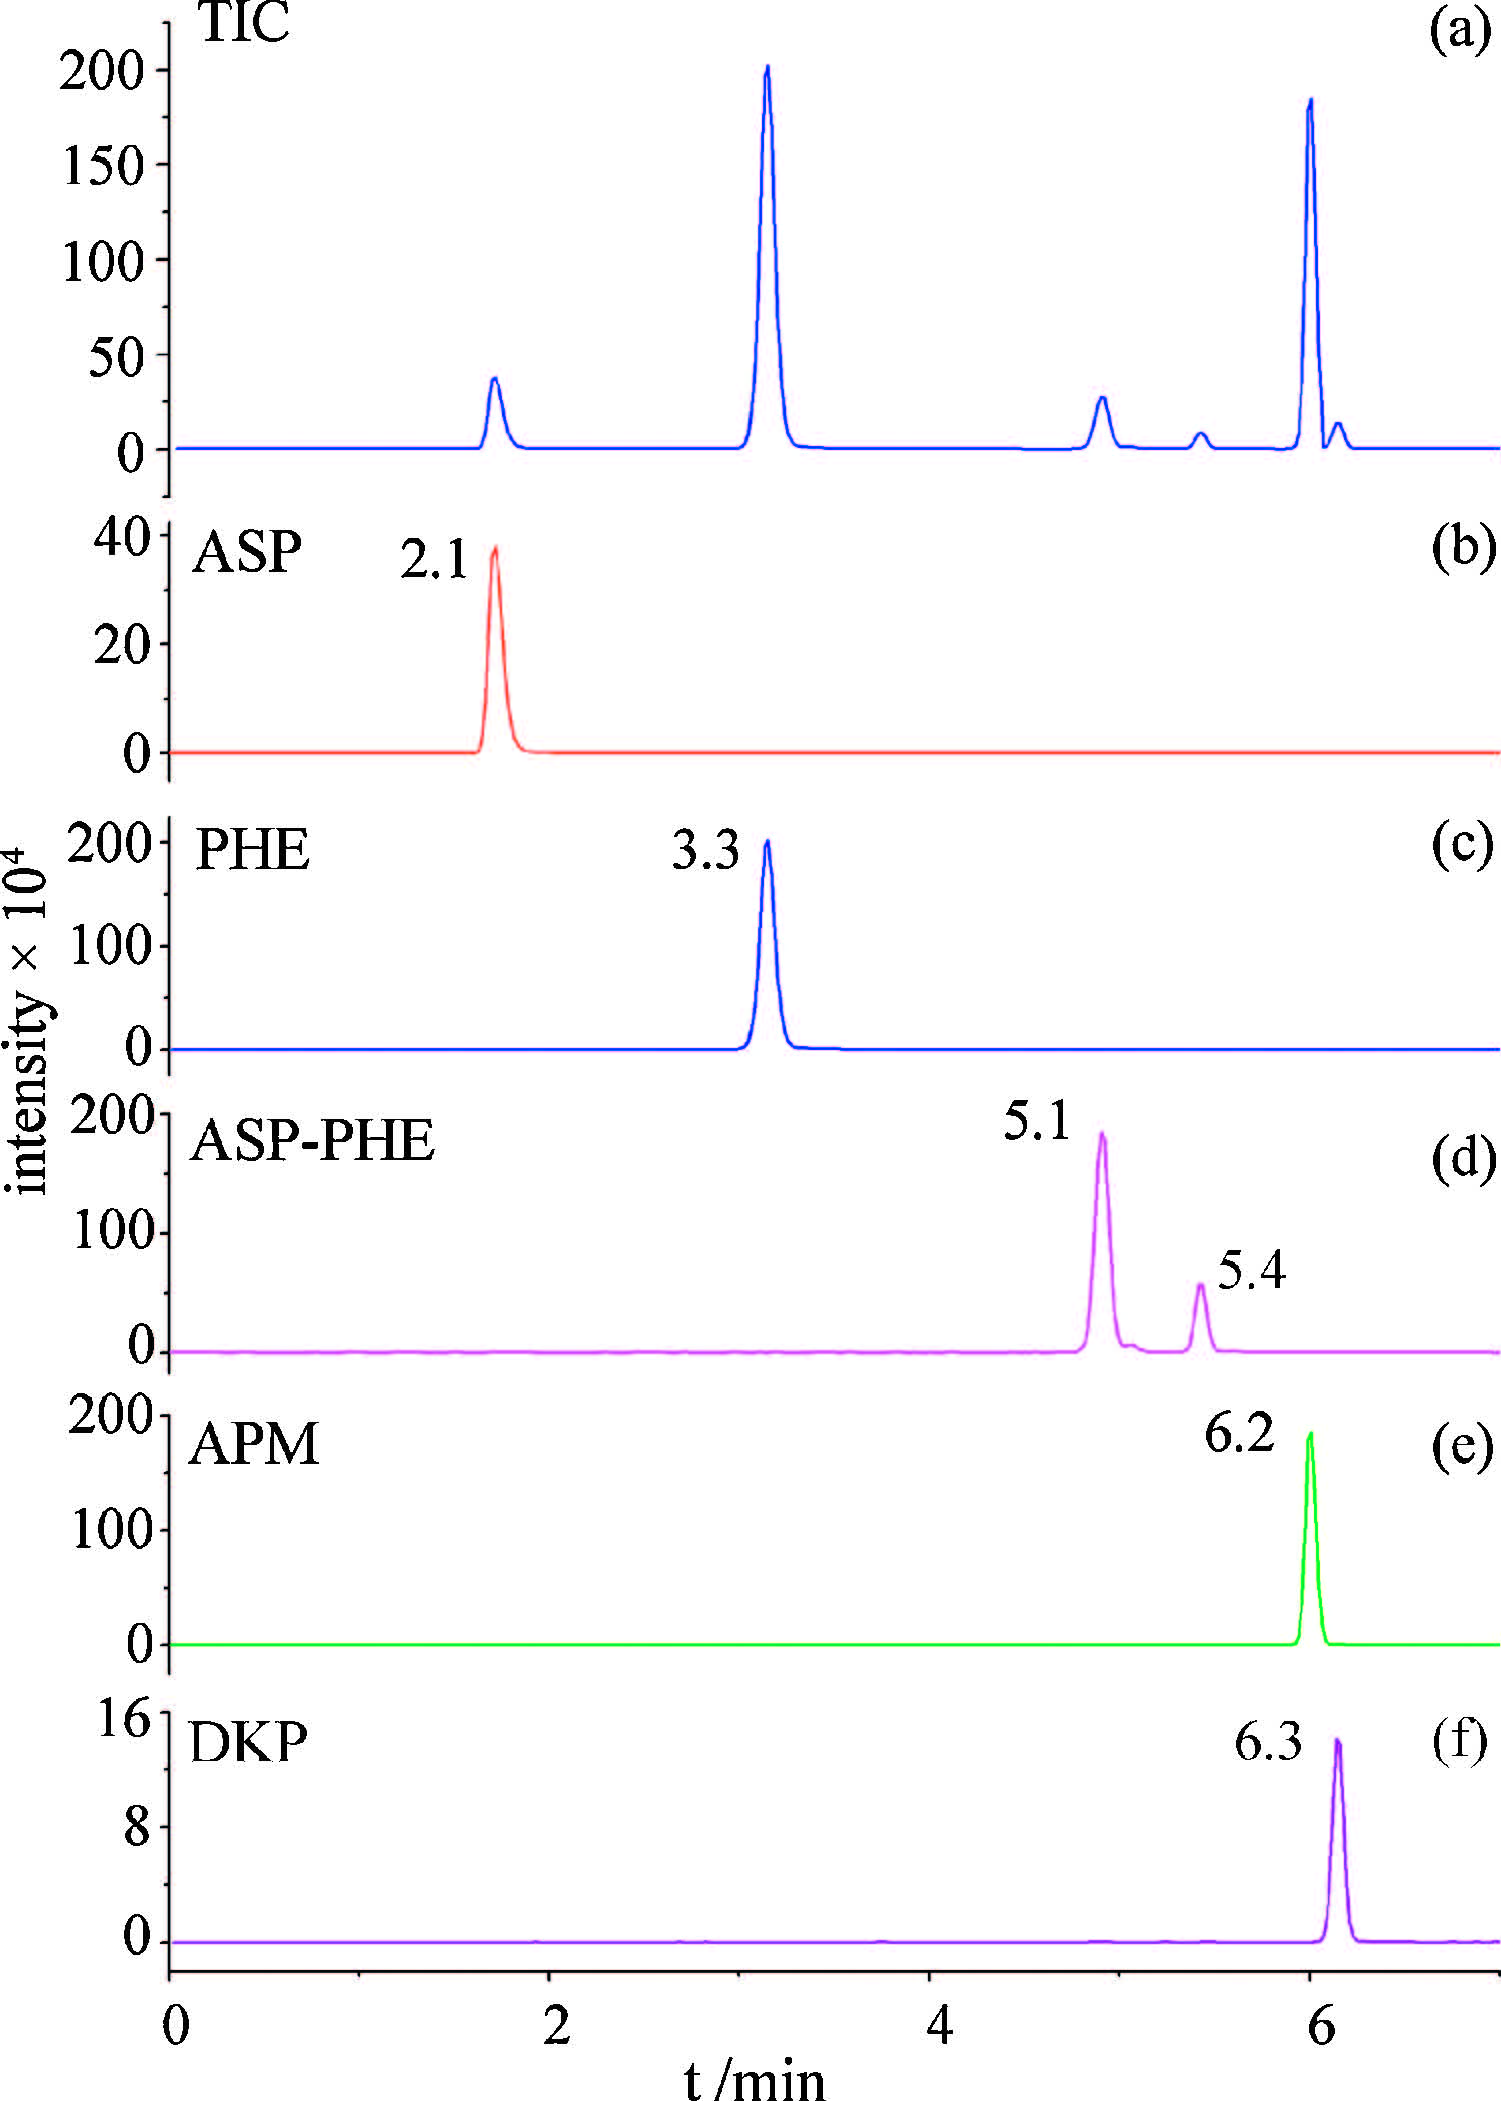
Chromatographic parameters,such as the choice of column, mobile phase composition,flow rate and column temperature, were also tested to obtain the best separation of the five analytes. Our study indicated that 0.2 mL/min and 30 ℃ were the optimal flow rate and oven temperature regarding resolution and total run time. Under optimal conditions,the total ion chromatogram for the mixture of the five analytes is shown in Fig. 1(a),extracted ion chromatograms of the five analytes are shown in Fig. 1(b)-(f). The two peaks in Fig. 1(d) represented ASP-PHE and its isomer [7, 18]. The sum of areas of these two peaks was used to quantify ASP-PHE [18, 19]. Because of similar structures,APM and DKP did not achieve baseline separation. However,with the MRM qualitative method,these two analytes could still be accurately quantified.

|
Download:
|
| Fig. 1.(a) Total ion chromatogram (TIC) for five analytes; extracted ion chromatograms of (b) ASP,(c) PHE,(d) ASP-PHE,(e) APM and (f) DKP. | |
The linearity,sensitivity,as well as precision and accuracy of the proposed method were validated by a series of experiments described below. Linearity was studied by analyzing mixed water standard solutions of the five analytes and also mixed cola standard solution of the five analytes at several concentration ranges,respectively.
The results of linear regression analysis are shown in Table 2. Linear regression analysis of blank matrix curve showed that the correlation coefficients of all the standardswere higher than 0.9964. Limits ofdetection(LODs),whichweredefinedas the concentrations at three times the signal intensity to noise,were in the range of 0.16- 3.2 μg/L. Limits of quantitation (LOQs),defined as the concentrations at 10 times the signal intensity to noise,were in the range of 0.56-10.6 μg/L. The relative standard deviations (RSDs) were less than 3.4%. Similarly,the linear regression analysis of the cola matrix curve showed that the correlation coefficients of all the standards were higher than 0.9987. Results for LOD were in the range of 0.35-5.8 μg/L and LOQs were in the range of 1.2-19.3 μg/L. The LODs and LOQs of the proposed method were of much higher sensitivity than the reported HPLC method [9]. The RSDs were less than 18.9%.
| Table 2 Linear relationships and sensitivities for detection of five analytes. |

The validated method was applied to the simultaneous analysis of APM,ASP,PHE,ASP-PHE and DKP in cola A and cola B. No obvious signal was detected in cola B. However,the peaks of APM, ASP-PHE and DKP were detected in cola A without ASP and PHE. The real concentrations of APM,ASP-PHE and DKP are listed in Table 3. The results indicated that the APM added in cola A had partly degraded and the main products were ASP-PHE and DKP. In addition,to evaluate the accuracy of the method,recoveries were tested. The samples were spiked with 100 μg/L of the mixture of analytes and 500 μg/L analyte mixture,respectively. The recoveries were 96.6%-100% and RSDs were less than 9.2% for the 500 μg/L analyte mixture,which indicated that the method was reliable and could be used for the determination of the five analytes in real samples.
| Table 3 TandemRecoveries of five analytes and concentrations of five analytes in cola A. |

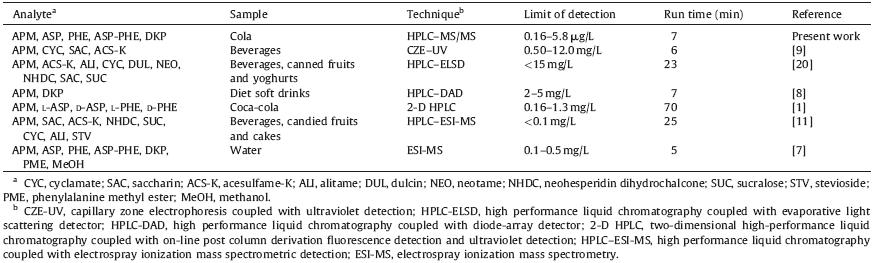
A comparative study of our developed method to other reported methods in terms of LOD and run time was performed,and the results are presented in Table 4. It can be seen that the LOD of this work was far lower than the reported methods,confirming its high sensitivity. This sensitive method made it possible to detect the slightly degradation products from APM in beverages and study their further properties. On the other hand,the run time of this work was shorter than,or nearly equal to the conventional methods,which would increase efficiency in detection of real samples. More importantly,the proposed method could eliminate any matrix interference and produce exact quantitative results even if the analytes did not reach baseline separation. This advantage provided a foundation to discover new degradation products of APM and degradation products having similar structures. In summary,the developed method is a sensitive, rapid and accurate method that can be used for the simultaneous analysis of APM and its four degradation products,as well as its degradation study.
| Table 4 Comparison of the HPLC-MS/MS method developed in the present work with some reported analytical procedures. |
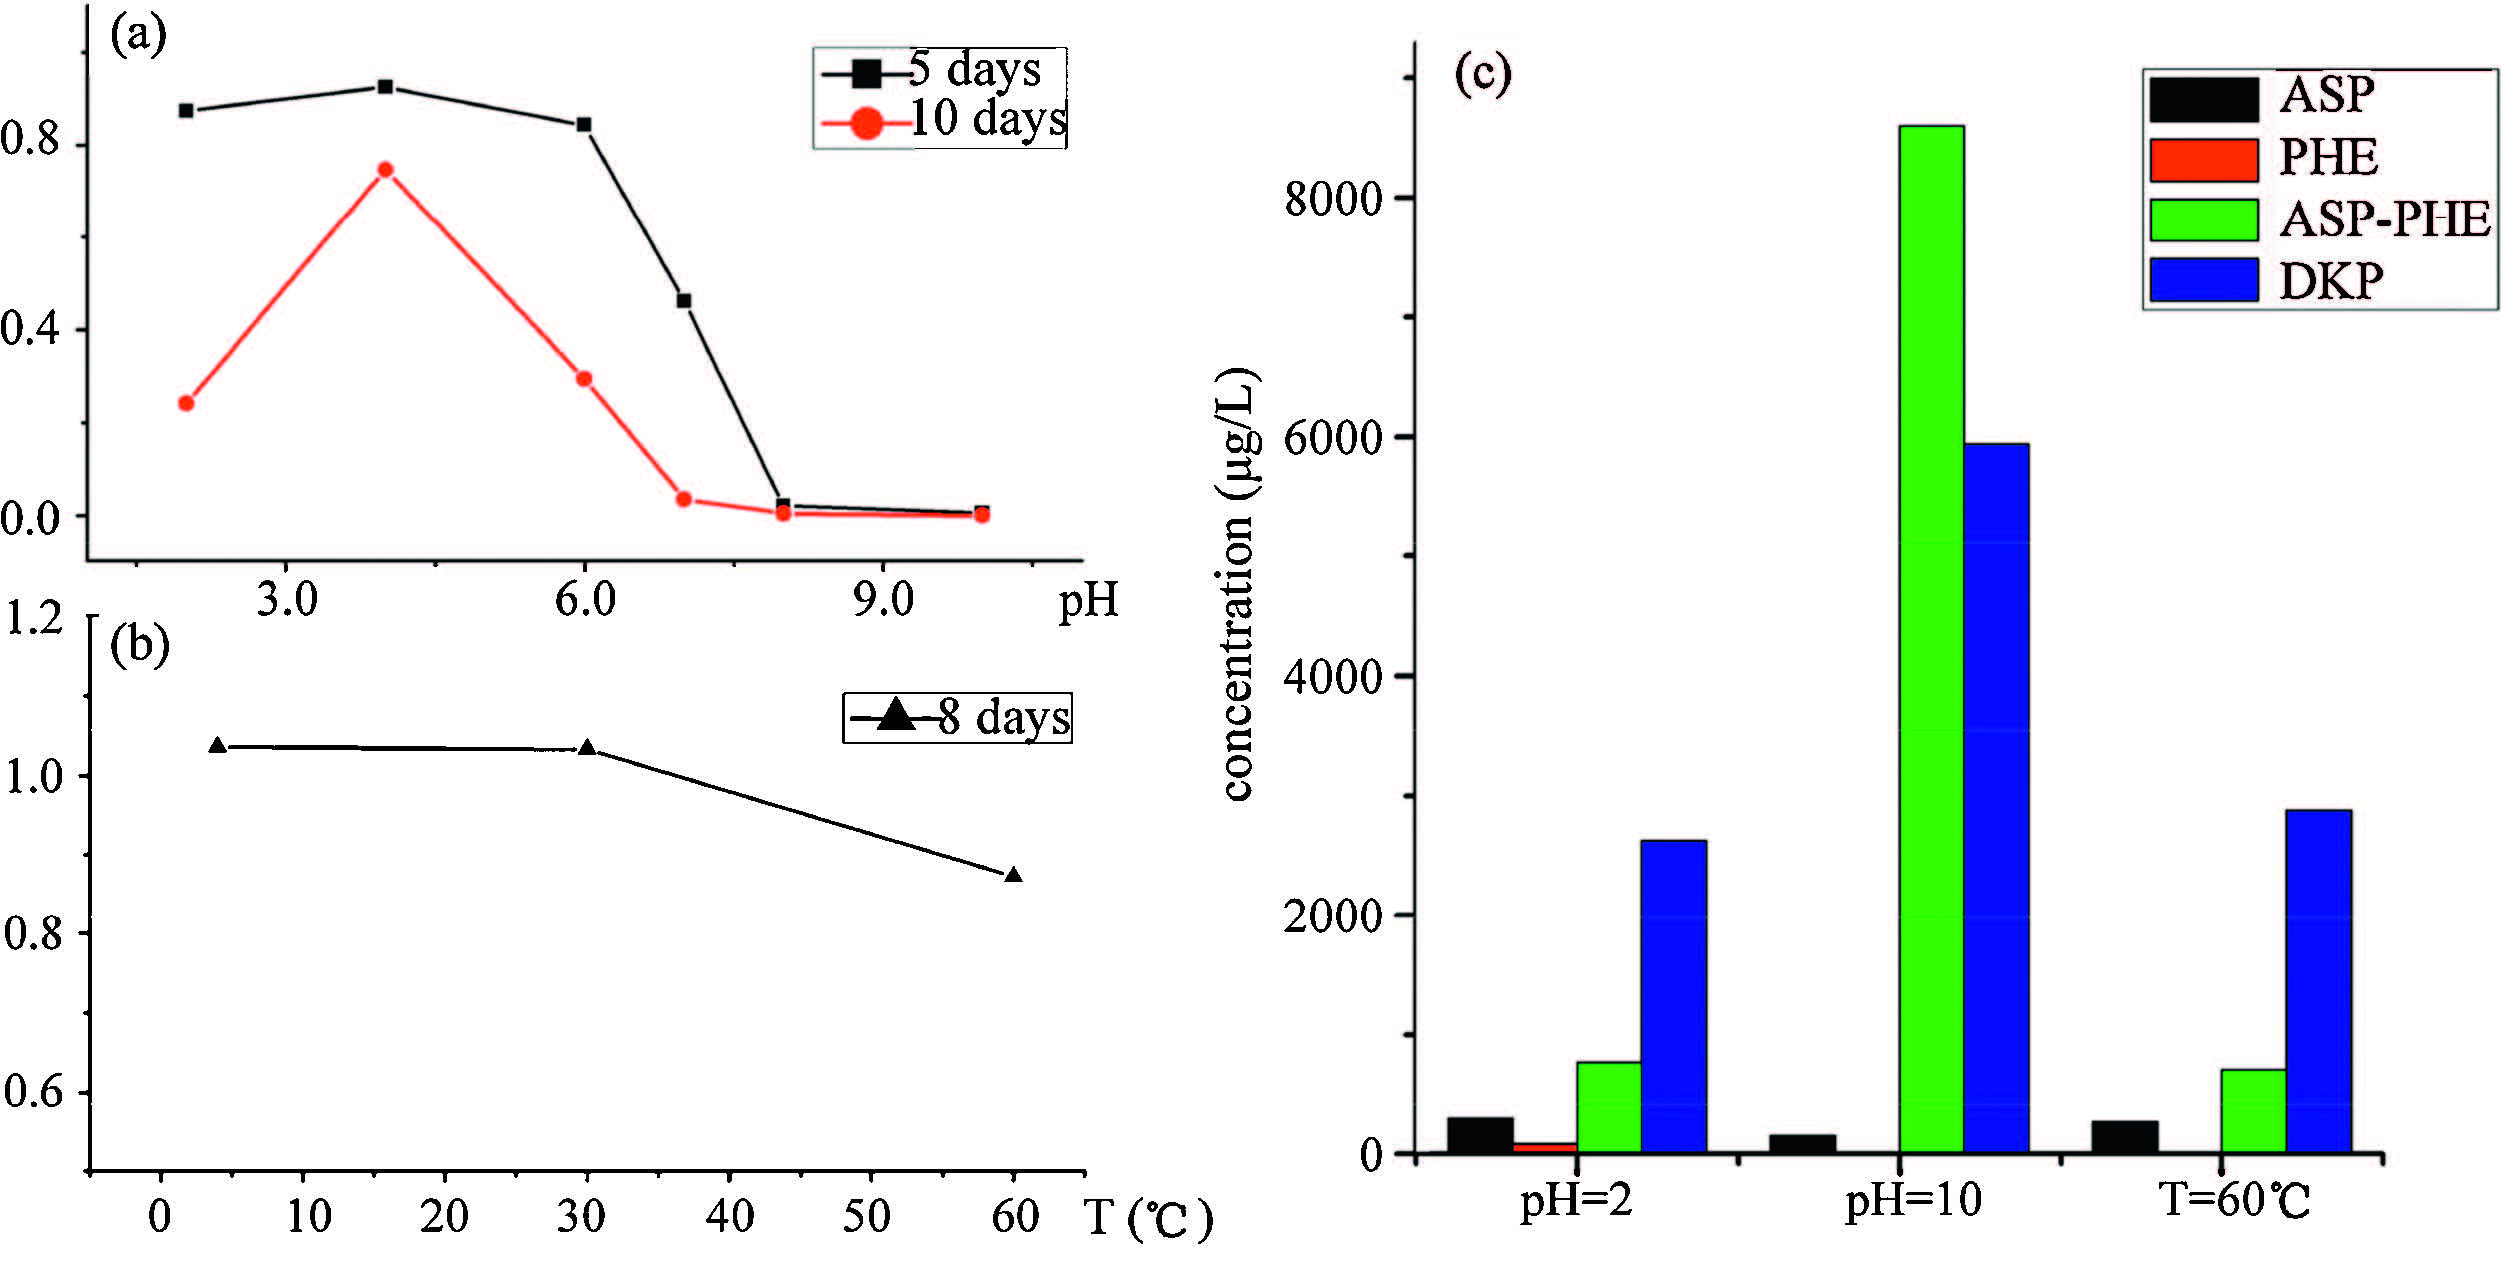
Since diet soft drinks which contained APM are at different pH, depending on their matrixes,and usually stored at different room temperatures,a degradation study of APM at various pH and 30 ℃ was carried out. The 20 mg/L standard APM solutions (pH 2,4,6,7, 8 and 10) were kept at 30 ℃. The pH of each solution was checked every day and formic acid or ammonia solution was carefully added to maintain the study pH,if needed (usually none,or only a negligible volume of the acid or base solution was needed). The solutions were diluted to a concentration of 1 mg/L for analysis at the appropriate time every day.
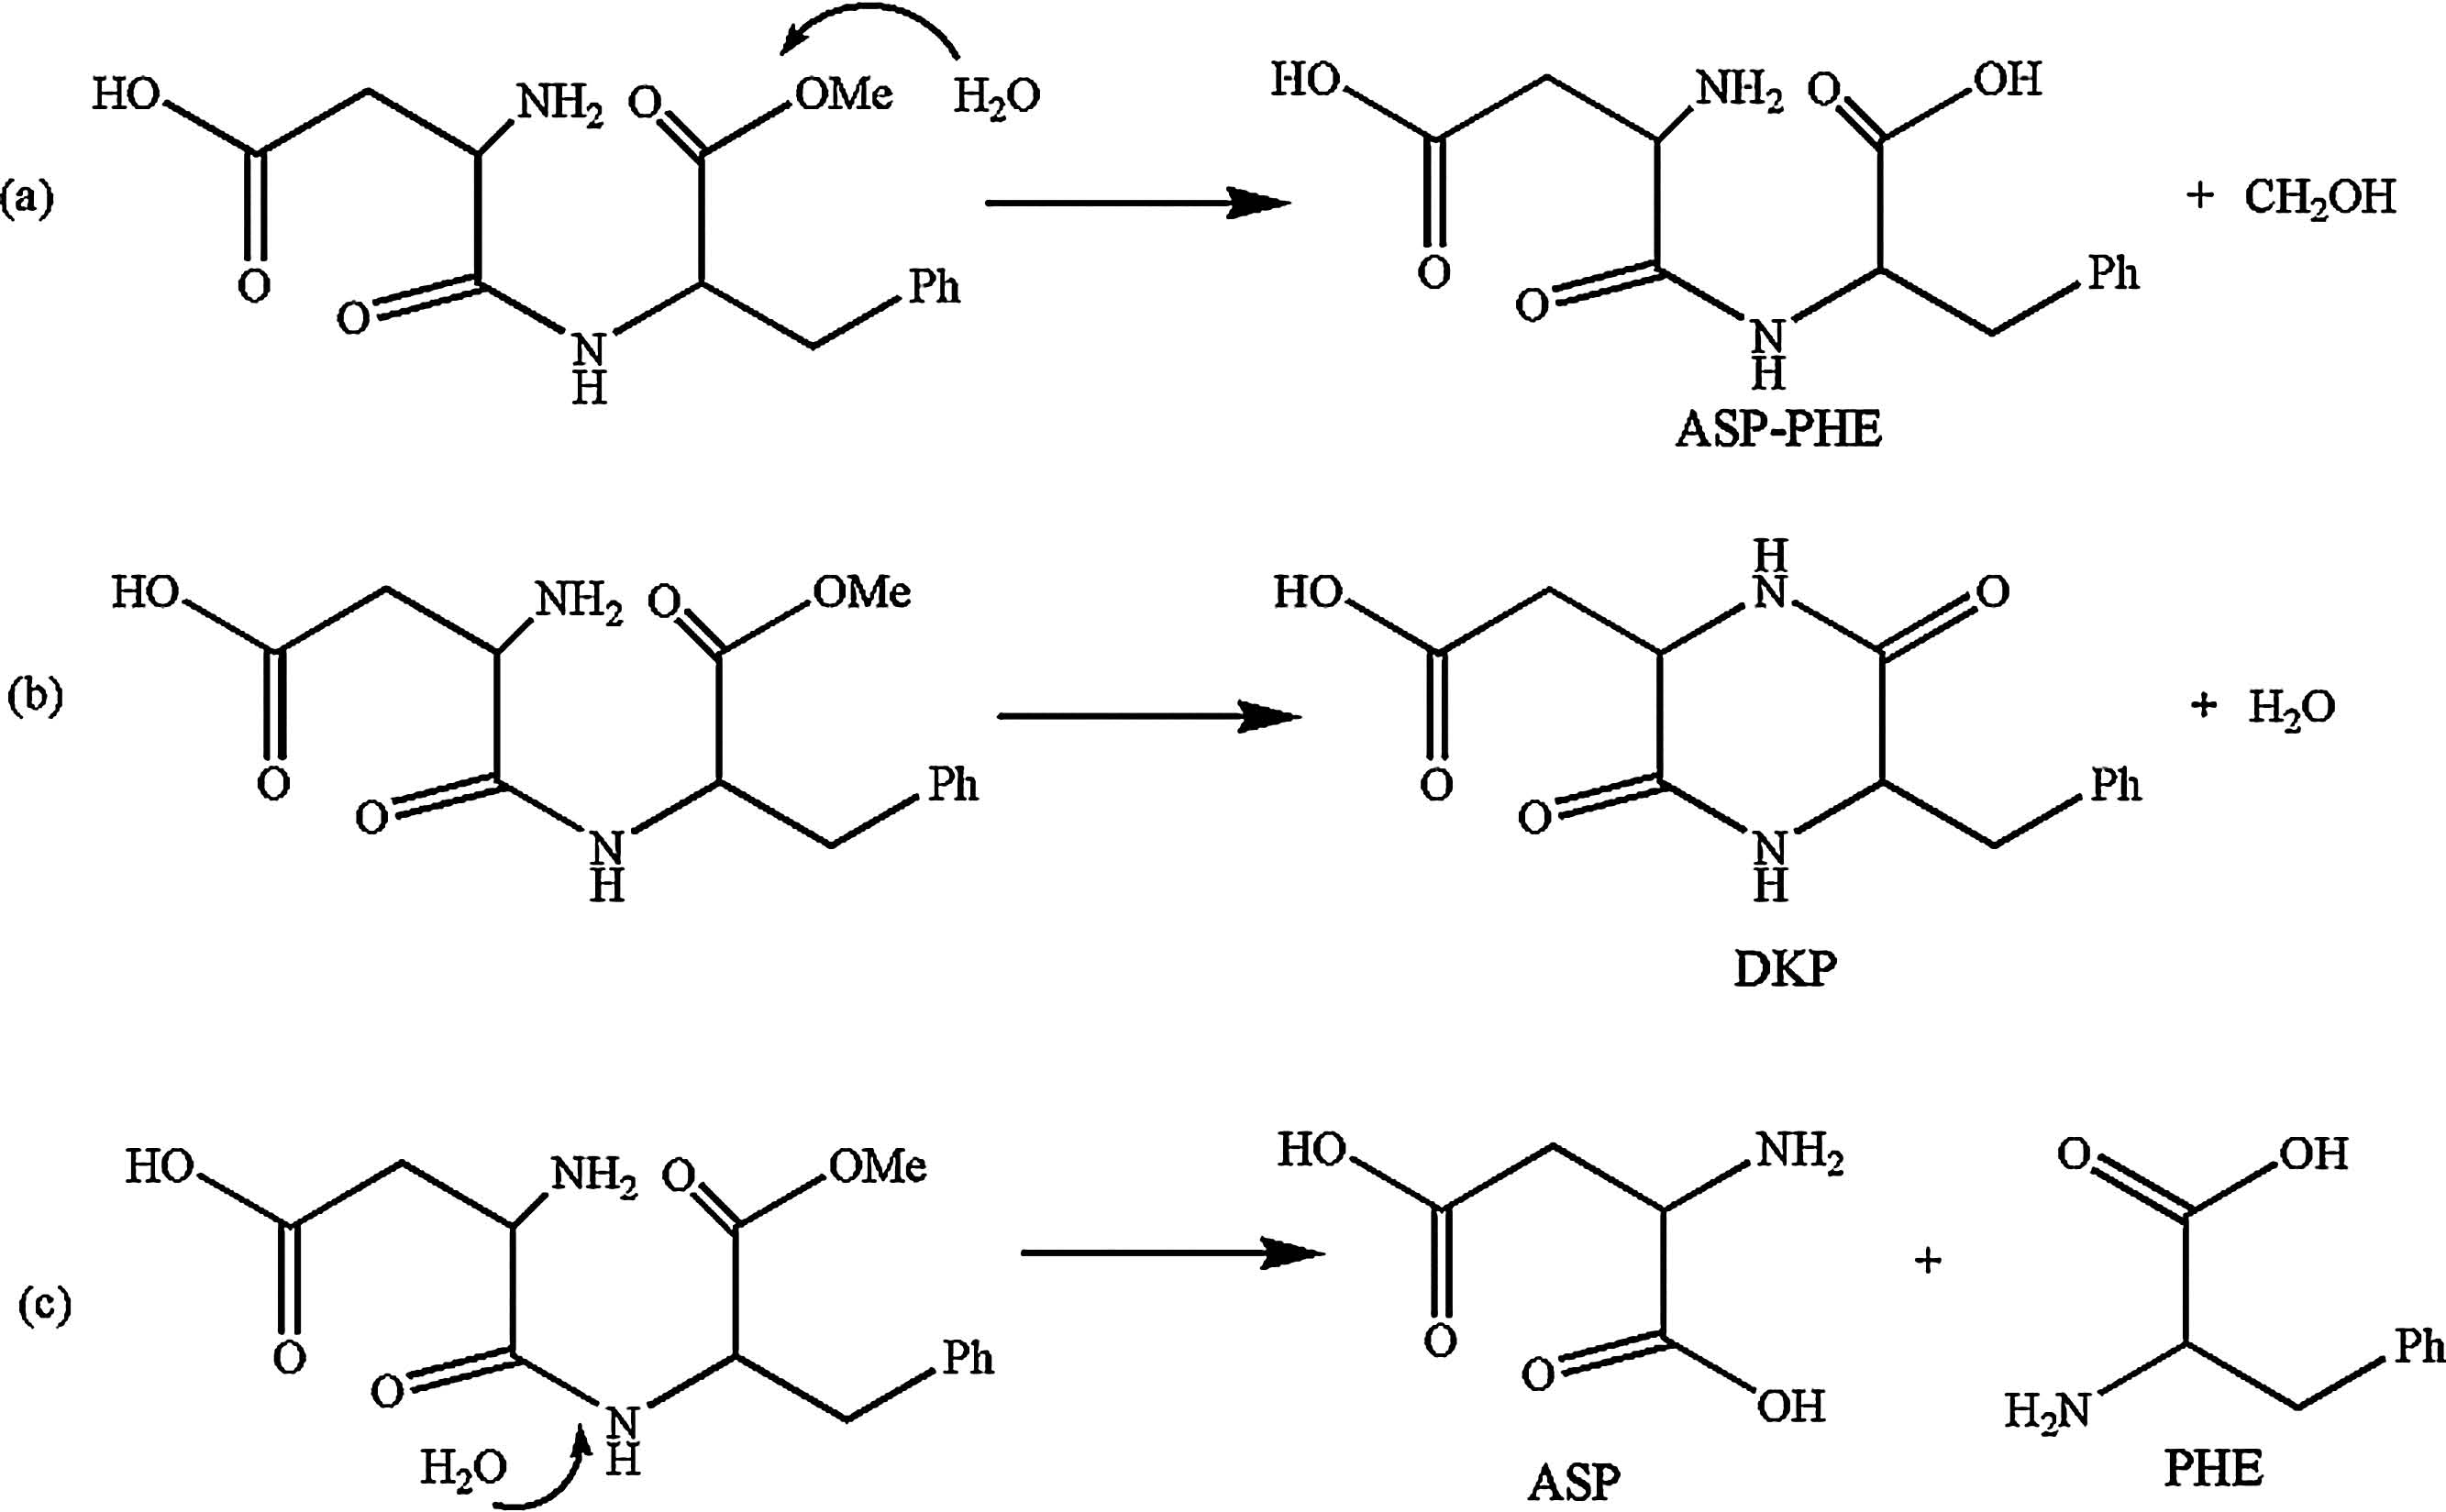
The result in Fig. 2(a) showed the remaining APM concentration ratios to original APM solution at various pH after 5 days and 10 days,respectively,which indicated that APM in strong acid and base environment was unstable. When the pH approximated 4, APM degraded more slowly than at other pH. Besides,at room temperature,APM in the solutions of acidic pH decomposed much more slowly than in solutions of basic pH. The difference between the results of 5 and 10 days indicated the extent of degradation of APM increased over time. The result in Fig. 2(c) showed that the main product under a strong basic environment was ASP-PHE and DKP,due to the OH- ion promoting cleavage of -CH2- from APM to form ASP-PHE and to remove one molecule of methanol to form a ring. Fig. 3(a) and (b) showed the degradation pathways to form ASP-PHE and DKP. Both ASP and PHE only existed under an acid environment,which indicated the acidic environment was conducive to breaking the -NH- bond of APM. Fig. 3(c) showed the degradation pathways to form ASP and PHE. This result was in agreement with previously reported work [7].

|
Download:
|
| Fig. 2.(a) Relative amounts of APM found in solutions at pH 2,4,6,7,8 and 10 at 30 ℃ after 5 days and 10 days to original APM solution; (b) relative amounts of APM found in solutions at 4,30 and 60 ℃ and pH 4 after 8 days to original APM solution; (c) intensity of degradation products ASP,PHE,ASP-PHE and DKP in solutions at pH 2 (60 ℃),pH 10 (60 ℃) and 60 ℃ (pH 4) after 5 days. | |

|
Download:
|
| Fig. 3.Degradation pathways of APM to form (a) ASP-PHE,(b) DKP,(c) ASP and PHE. | |
Based on the experiment in Section 3.6,APM degraded more slowly at pH 4. Thus,three sets of 20 mg/L APM solutions at pH 4 were separately kept at 4,30 and 60 ℃ for degradation. The solutions were diluted to a concentration of 1 mg/L before testing. Three solutions were quantitated every day for APM,ASP,PHE, ASP-PHE and DKP by the developed HPLC-MS/MS method. The result in Fig. 2(b) showed the ratios of remaining APM concentration to original APM solution at 4,30 and 60 ℃ after 8 days,which indicated the extent of degradation of APM increased with temperature. The degradation of APM at 30 ℃ showed the APM was unstable at normal temperatures. This result was in agreement with previous work in Section 3.4 carried out in analyzing real samples of cola A. The APM added to cola A had partly degraded to ASP-PHE and DKP under normal conditions. The result in Fig. 2(c) showed the main product at 60 ℃ was DKP. 4. Conclusion
A reliable HPLC-MS/MS method for the simultaneous analysis of APM and its four degradation products ASP,PHE,ASP-PHE and DKP was developed. The method was based on the simultaneous monitoring of all ion pairs of the analytes in MRM mode at the optimal conditions. Under these conditions,there was no interfering fragment of any monitored analyte by other analytes also being monitored. Therefore,it could provide accurate quantitative results even the analytes could not be baseline separated. The identification characteristics of the mass spectrum of five analytes were also included. This method could be used to analyze real samples with satisfactory results.
The study on degradation of APM in solution at various pH levels and temperatures was carried out easily using this method to simultaneously determine the relative abundance of APM,ASP, PHE,ASP-PHE and DKP. Application of this method to the study on degradation of APM at various pH showed that APM degraded much more easily in strong acidic and basic solutions,with DKP and ASP-PHE as major products in basic solutions. Higher temperatures will promote the degradation of APM,with DKP as the major product. Based on this work,it indicated the cola containing APM should be stored under proper conditions. Based on this work,it is also possible to study the further properties of APM and its degradation products. Acknowledgment
This project was supported by the National Nature Science Foundation of China (No. 21075074).
| [1] | C. Cheng, S.C. Wu, Simultaneous analysis of aspartame and its hydrolysis products of Coca-Cola Zero by on-line postcolumn derivation fluorescence detection and ultraviolet detection coupled two-dimensional high-performance liquid chromatography, J. Chromatogr. A 1218 (2011) 2976-2983. |
| [2] | H.K. Khurana, I.K. Cho, J.Y. Shim, Q.X. Li, S. Jun, Application of multibounce attenuated total reflectance Fourier transform infrared spectroscopy and chemometrics for determination of aspartame in soft drinks, J. Agric. Food Chem. 56 (2008) 778-783. |
| [3] | M.A. Cantarelli, R.G. Pellerano, E.J. Marchevsky, J.M. Camiñ a, Simultaneous determination of saccharin and aspartame in commercial noncaloric sweeteners using the PLS-2 multivariate calibration method and validation by capillary electrophoresis, J. Agric. Food Chem. 56 (2008) 9345-9349. |
| [4] | M. Marinovich, C.L. Galli, C. Bosetti, S. Gallus, C. La Vecchia, Aspartame, low-calorie sweeteners and disease: regulatory safety and epidemiological issues, Food Chem. Toxicol. 60 (2013) 109-115. |
| [5] | I. Ashok, R. Sheeladevi, D. Wankhar, Effect of long-term aspartame (artificial sweetener) on anxiety, locomotor activity and emotionality behavior in Wistar Albino rats, Biomed. Prev. Nutr. 4 (2014) 39-43. |
| [6] | S. Mallikarjun, R.M. Sieburth, Aspartame and risk of cancer: a meta-analytic review, Arch. Environ. Occup. Health (2013), http://dx.doi.org/10.1080/19338244.2013.828674. |
| [7] | S. Pattanaargson, C. Sanchavanakit, Aspartame degradation study using electrospray ionization mass spectrometry, Rapid Commun. Mass Spectrom. 14 (2000) 987-993. |
| [8] | M.M. Conceicao, V.J. Fernandes, A.G. Souza, et al., Study of thermal degradation of aspartame and its products of conversion in sweetener using isothermal thermogravimetry and HPLC, Thermochim. Acta 433 (2005) 163-169. |
| [9] | V.N.O. Fernandes, L.B. Fernandes, J.P. Vasconcellos, et al., Simultaneous analysis of aspartame, cyclamate, saccharin and acesulfame-K by CZE under UV detection, Anal. Methods 5 (2013) 1524-1532. |
| [10] | E.C. Demiralay, G. Ozkan, Optimization strategy for isocratic separation of alphaaspartame and its breakdown products by reversed phase liquid chromatography, Chromatographia 60 (2004) 579-582. |
| [11] | D.J. Yang, B. Chen, Simultaneous determination of nonnutritive sweeteners in foods by HPLC/ESI-MS, J. Agric. Food Chem. 57 (2009) 3022-3027. |
| [12] | S. Jiang, Y.S. Li, B. Sun, Determination of trace level of perchlorate in antarctic snow and ice by ion chromatography coupled with tandem mass spectrometry using an automated sample on-line preconcentration method, Chin. Chem. Lett. 24 (2013) 311-314. |
| [13] | X.Y. Ren, Y. Xue, J. Liang, L.S. Ding, X. Liao, Selective extraction of flavonoids from Ginkgo biloba leaves using human serum albumin functionalized magnetic nanoparticles, Chin. Chem. Lett. 24 (2013) 1099-1102. |
| [14] | S.P. Rong, Y.B. Sun, Z.H. Zhao, Degradation of sulfadiazine antibiotics by water falling film dielectric barrier discharge, Chin. Chem. Lett. 25 (2014) 187-192. |
| [15] | C.Y. Wang, H.Q. Li, L.G. Wang, et al., Insights on the mechanism for synthesis of methylenedianiline from aniline and formaldehyde through HPLC-MS and isotope tracer studies, Chin. Chem. Lett. 23 (2012) 1254-1258. |
| [16] | C.S. Wu, Y. Jin, J.L. Zhang, Y. Ren, Z.X. Jia, Simultaneous determination of seven prohibited substances in cosmetic products by liquid chromatography-tandem mass spectrometry, Chin. Chem. Lett. 24 (2013) 509-511. |
| [17] | S. Kawano, Y. Inohana, Y. Hashi, J.M. Lin, Analysis of keto-enol tautomers of curcumin by liquid chromatography/mass spectrometry, Chin. Chem. Lett. 24 (2013) 685-687. |
| [18] | C. Schummer, J. Sassel, P. Bonenberger, G. Moris, Low-level detections of sudan I, II, III and IV in spices and chili-containing foodstuffs using UPLC-ESI-MS/MS, J. Agric. Food Chem. 61 (2013) 2284-2289. |
| [19] | K. Molder, A. Kunnapas, K. Herodes, I. Leito, "Fast peaks" in chromatograms of sudan dyes, J. Chromatogr. A 1160 (2007) 227-234. |
| [20] | M. Buchgraber, A. Wasik, Determination of nine intense sweeteners in foodstuffs by high-performance liquid chromatography and evaporative light-scattering detection: interlaboratory study, J. AOAC Int. 92 (2009) 208-222. |