


b State Key Laboratory of Bioactive Substance and Function of Natural Medicines, Institute of Materia Medica, Chinese Academy of Medical Sciences and Peking Union Medical College, Beijing 100050, China
1. Introduction
The imaging mass spectrometry (IMS) technology is a molecular imaging technique which features high chemical specificity, parallel detection,and microscopic imaging capabilities. The IMS image contains information of hundreds,or even thousands,of different molecules in the samples,and both molecular and spatial information can be obtained by analyzing a single sample [1, 2, 3, 4].
IMS generally includes four steps: preparation of samples,mass spectrometry scanning,quality analysis,and data processing [5]. The important factors affecting the quality of imaging are the sensitivity of ionization,preparation of samples,spatial resolution, reliability of the system and speed of sampling. Significant progress has been made in the past 20 years in IMS techniques based on a variety of ionization sources,including secondary ion mass spectrometry (SIMS),matrix-assisted laser desorption ionization (MALDI),and desorption electrospray ionization (DESI), as examples [6, 7, 8, 9, 10, 11, 12].
In particular,the DESI-IMS technique has enabled imaging to be carried out in the ambient conditions and has greatly increased the application scope and applicability of IMS [13]. Thus,it is one of the most important and popular IMS technology. But in comparison with other techniques,such as MALDI-IMS,the sensitivity and the resolution of DESI-IMS still needs to be further improved.
MALDI-IMS,where a laser is used to complete sample desorption and ionization,features very high spatial resolution [14]. Since its introduction in the late 1990s,MALDI-IMS has witnessed a phenomenal expansion [15]. However,since ionization occurs in the vacuum environment,the imaging area of a sample is limited due to geometric constraints of the MS instrument [16, 17, 18].
The AFAI-IMS method uses air flow assisted ionization (AFAI) as the ion source [19]. AFAI is an ambient ionization method. In this paper,all IMS experiments were performed with the AFAI ion source in DESI mode,therefore themethod is also called AFADESIIMS. An ion transport tube is used to transport the sample ions which may be far away from the orifice. Even the entire large sample can be placed horizontally at a distance from the MS orifice,so that the sample pre-treatment is simple and convenient. The adoption of assisted air flow and an optimization of distance and alignment between the ion transport tube and MS orifice greatly improve the sensitivity of the AFAI-IMS. In this paper,the design of the AFAI-IMS method is described and the performance is further verified. It is used for the imaging of one sample with a large area (150 mm × 100 mm) in a single analytical measurement.
2. Experimental
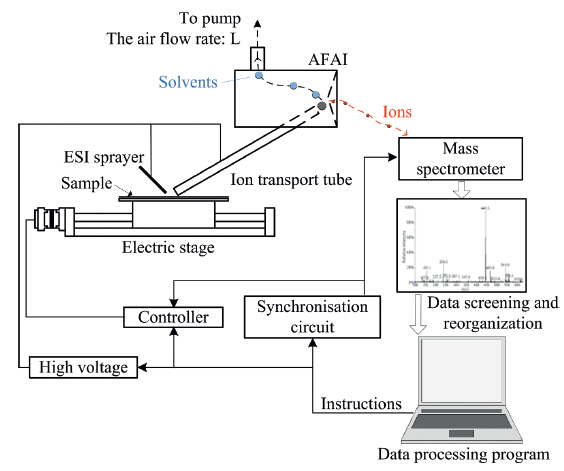
The design of the AFAI-IMS (AFADESI-IMS) system is shown in Fig. 1. It includes the AFAI (ESI) source,high-precision imaging platform,synchronization circuit between the platform and mass spectrometer,and data processing program.

|
Download:
|
| Fig. 1.A general view of the AFAI-IMS (AFADESI-IMS). | |
2.1. AFAI source
Air flow assisted ionization (AFAI) is an ambient ion source. As shown in Fig. 1,it includes a stainless steel ion transport tube (internal diameter: 3 mm,external diameter: 4 mm),a laboratory fabricated PMMA refluence tube (internal diameter: 16 mm, length: 60 mm,connected to the mass spectrometer),and a vacuum pump.
The AFAI source in DESI mode has an ESI nozzle through which a charged solvent is sprayed at high pressure and velocity onto the surface of the sample to complete the process of desorption and ionization. After the ionization,the ions are sucked into the ion transport tube by the air flow. Following the airflow,the ions and other constituents move toward the mass spectrometer orifice. When the samples reach the orifice,the solvent and uncharged molecules are driven by the airflow and move further toward the air outlet under reduced pressure,while the ions of the sample move through the orifice into the mass spectrometer under the influence of an electric field [19].
The ESI sprayer generate the initial charged droplets for desorption. In this paper,the spray gas was N2,with a flow rate of 1.5 L/min,and a spray voltage of 4500 V. The spray solution was prepared by mixing methanol and water (4:1,v/v) with 0.1% formic acid,and was delivered to the sprayer by an Agilent LC pump at a flow rate of 10 mL/min.
2.2. Mass spectrometer and synchronization circuit
The AFAI-IMS experiments were completed using a QTRAP 5500 and a QSTAR Elite QTOF mass spectrometer (AB SCIEX, Foster City,CA,USA). The mass spectrometry synchronization circuit ensures that the mass spectrometer runs simultaneously with the sample scanning,so that each pixel in the imaging map corresponds to the sample. It makes use of the communication port between the mass spectrometer and IMS stage controller.
The major portion of the synchronization circuit is a solidstate relay,whose output (2-pin) is connected to the communication port of the mass spectrometer. When the output of the solid-state relay is connected,the communications port of the mass spectrometer receives a short-circuit signal,and the mass spectrometer starts to run and acquire the raw mass spectra.
2.3. Sample preparation
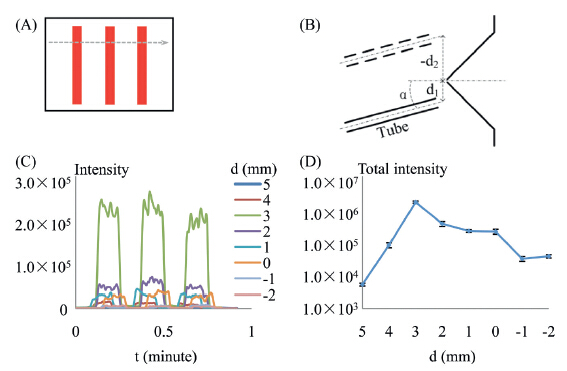
The experiments use four samples. The first sample which is shown in Fig. 2A is three red stripes (each 3-mm wide). The stripes are printed on glossy photographic paper with an ink-jet printer. And the ink was Rhodamine B (m/z 443.2). This sample was designed for complete the optimization of AFAI-IMS.

|
Download:
|
| Fig. 2. Experiment designs and results of different distances between the ion transport tube and orifice. The sample is shown in (A) and the distance is shown in (B). (C) MS analysis under different distances (m/z 443.2); (D) Relationship between total intensity and distance after integrating each peak area. | |
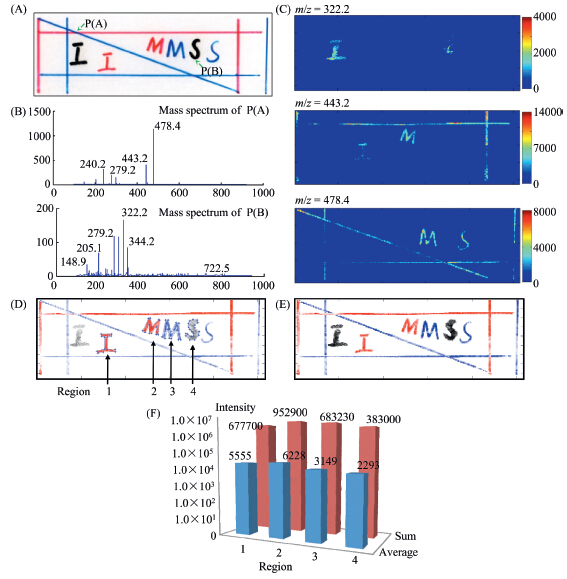
The second sample was used to check the performance of the AFAI-IMS system as shown in Fig. 3A. Additionally,several letters and lines of three different colors (red,blue and black) were written on a glass slide,representing three target mass/charge values. The Rhodamine B (m/z 443.2) was the major constituent of the red pattern. The Basic Blue 7 (m/z 478.4) was the major constituent of the blue pattern. Molecular ions at m/z 322.2 ([M+H]+) and m/z 344.2 ([M+Na]+) were generated by the major constituent of the black pattern. The size of glass slide sections was 150 mm × 100 mm,and the imaging area of the pattern was 130 mm × 40 mm.

|
Download:
|
| Fig. 3. The composite AFAI-IMS image of different target analyte (m/z: 322.2-black,443.2-red and 478.4-blue). (A) Optical image of sample; (B) the mass spectra of point P(A) and P(B); (C) the AFAI-IMS images of three targetm/z; (D) the composite AFAI-IMS image of absolute intensity and the regions for numerical analyze; (E) the composite AFAIIMS image of relative intensity; (F) results of the numerical analyze. | |
The third sample is shown in Fig. 4A. Whole-body section of a rat was used to complete the AFAI-IMS experiment for drugs and metabolites [20, 21, 22]. The target drug is the antitumor candidate drug,S-(+)-deoxytylophorinidine (CAT) [23]. CAT was prepared as a 4 mg/mL aqueous solution in 0.7% NaCl. The rat was administered 15 mg/kg CAT via the tail. After 30 min,the rat was euthanized by ether overdose and then frozen entirely in dry ice/ isopentane and prepared for slicing. A cryomacrotome was used to slice the rat. Thick 20 mm rat body tissue sections were obtained,which size was 150 mm × 50 mm,and were placed on a 150 mm × 100 mm glass slide.

|
Download:
|
| Fig. 4. AFADESI-IMS of drugs in rat sections. (A) Optical image of a rat tissue; (B) IMS image of rat whole-body tissue section. | |
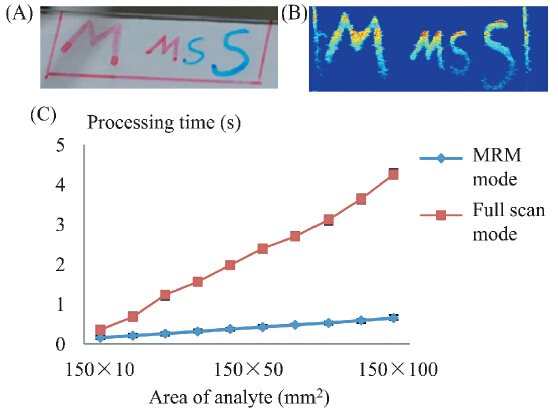
The fourth sample is shown in Fig. 5A. Similar to the second one, it is a 150 mm × 100 mm glass slide with the letter ‘‘M’’ hand written twice in red Rhodamine B on the left hand side,and the letter ‘‘S’’ hand written twice in Basic Blue 7 on the right hand side.

|
Download:
|
| Fig. 5. Computing time in different modes. (A) Optical image of sample; (B) AFAIIMS image (Red: Rhodamine B,m/z 443.2; Blue: Basic Blue 7,m/z 478.4); (C) varying time for different sample sizes in different modes in imaging. | |
2.4. Sample scanning
A high-precision platform is designed to control the motions of the samples and complete the sample scanning of AFAI-IMS. It includes two horizontal high-precision electric stages (maximum of X: 150 mm,maximum of Y: 100 mm),a vertical manual stage (maximum distance: 4 mm),controller,homemade leveling device,and installation rack [24].
There are two modes for sample scanning: linear scanning and point scanning. For both modes,the ESI needle is located in a fixed position above the sample,and the ion transport tube is fixed to form a certain angle with the needle and sample surface. Under linear scanning mode,the sample is divided into multiple lines, and each scanning completes the data acquisition of one line; the scanning process is continuous. Under point scanning mode,the sample is also divided into multiple lines,and then each line is subdivided into multiple points.
2.5. Data processing program
The data processing program is developed based on MATLAB. The data of the AFAI-IMS can be collected in twomodes: full mass scan mode and multiple reaction monitoring (MRM) mode [25].
In full mass scan mode,data of all mass/charge ratios (m/z) within the capacity of the mass spectrometer are collected, obtaining their ion intensity. In this mode,the data set for each mass peak is extracted separately by the data processing program and is placed in the pixel point in one-to-one correspondence so that the IMS image of targeted m/z is formed. The IMS image of all values ofm/z can be superimposed on one image; this imaging map will distinguish between the m/z (composition of the sample) in accordance with different colors,and the degree of one color signifies the content level of such m/z.
The MRM mode is utilized to collect the mass data representative of a few,particularly targeted compounds; in this mode,the data quantity of imaging will be greatly reduced,and is often only a few thousandths of the data quantity of full scan mode,which reduces the complexity of data analysis and shortens the duration of imaging.
The data processing program can also conduct some numerical analyses of IMS images,such as the sum,maximum/minimum values,range,average,and so on [26].
3. Results and discussion 3.1. Distance between the ion transport tube and orifice
Since AFAI enhances the ESI desolvation process of samples, accelerates the formation of ions,and even avoids the formation of fragment ions to a certain extent,it features remote ionization and analysis of samples at a high sensitivity [19].
However,the introduction of assisted air flow causes a serious problem. Due to the air flow and pressure differential,solvents, dust and fragments of samples,especially ablated pieces of tissue in animal slice imaging,might be sucked into the ion transport tube and move to the MS orifice together with the ions to be detected. If the center of the ion transport tube is directly targeted at the orifice,it is possible for part of this large amount material to be injected into the orifice and blocking it,resulting in greatly deteriorated MS signals. This problem is particularly evident in animal tissue section imaging.
To solve this problem,a distance between the center of the ion transport tube and the MS orifice must be maintained during the imaging process. The ion transport tube and the orifice are both at different electrical potentials to form a gradient electric field. In this design,the ions are forced to move toward the orifice under the electric field,and the dust,solvents,and neutral fragments of sample will not be injected into the orifice; thus,the problem of a blocked orifice is avoided.
Due to the limited role of the gradient electric field,and if the center of the ion transport tube is too distant from the orifice,it will reduce the sensitivity of the system. Therefore,the distance between the ion transport tube and the MS orifice needs to be optimized for through put to ensure high detection sensitivity of the present imaging technique and the avoidance of introduction of unwanted materials.
The distance is d,with a negative potential on the up side and a positive potential on the down side. The orifice is loaded with a voltage of 800 V,the ion transport tube with a DC voltage of 1200 V,and the ion spray needle (ESI) with a voltage of 5000 V. As shown in Fig. 2B,the ion transport tube forms a 158 angle to the orifice. Using the experimental setup in Fig. 2,the parameter d is optimized and the results are shown in Fig. 2C and D.
In Fig. 2D,the center of the ion transport tube is placed so that it is in line with the MS orifice (d = 0). However,in this configuration the intensity of ions detected by MS is low,resulting in poor imaging quality. The best distance,d,is 3 mm,under which conditions the intensities of detected m/z ions are the highest. As d was further increased (d = 4 or 5 mm),the intensity decreases significantly. Therefore,d = 3 mmwas selected as the best distance in subsequent imaging analysis.
3.2. The composite AFAI-IMS image of different target analyte
After optimization,the sensitivity of the AFAI-IMS is improved greatly,and the composite AFAI-IMS images,which contain variety of mass/charge ratios,are recorded successfully. Linear scanning mode was adopted during imaging,which is continuous. In consideration of the minimum analysis time of mass spectrometry and minimum speed of the high-precision imaging platform,a pixel size of 500 mm × 500 mm was selected. The total analysis time was approximately 7 h,with most of the time was being spent on sample scanning (moving the sample platform and collecting data).
The full scan mode is used,which is convenient to track all of the target analytes in the entire sample. The target m/z values are 322.2,443.2 and 478.4. A laboratory written data processing program is used for the processing of acquired data,in order to generate the composite AFAI-IMS images of the large sample. The composite AFAI-IMS image of different target analyte is shown in Fig. 3. The sample is shown in Fig. 3A. Two point,P(A) and P(B), were chosen to show the mass spectrum.
As shown in Fig. 3D and E,the IMS images of three different mass/charge ratios are superimposed on one image. It can be seen that the composite AFAI-IMS image and the pattern of sample are matched very well. The different mass/charge ratios are specific and able to distinguish between different colors with the degree of one color signifying the content level (intensity) of such m/z. Moreover,all the straight lines were recovered very well without any position error in the IMS images. These results demonstrated that the designed AFAI-IMS system has excellent repeatability even for a large imaging area.
On the other hand,the intensity of different m/z ions is different. As shown in Fig. 3D,both the maximum and the average intensity of the red pattern are strongest,and the black pattern is weakest. Various factors contributed to the difference,such as: the content and composition level,the ionization efficiency and so on. The composite images in absolute intensity presents the real situation of the sample,but sometimes it makes the useful information unclearly in the whole image. For example,in the field of pathological diagnosis,the content of the characteristic features which cause the disease is usually low. To solve this problem,the data processing program can superimpose the images of different m/z ions in relative intensity,as Fig. 3E shown.
The intuitive information on the concentration and distribution of the target analyte can be obtained by analyzing the IMS images directly. But more accurate,reliable data and conclusions can be obtained by numerical analysis,which is important for drug analysis,diagnosis,and so on. Fig. 3F shows the sum and average analysis of the AFAI-IMS image.
3.3. AFAI-IMS of drugs and metabolites in rats’ whole-body sections
After optimization,the sensitivity of the AFAI-IMS is improved. Compared to our previous work,the new and larger whole-body rat section was used [23]. The IMS image was obtained successfully. A linear scanning mode was adopted during imaging, which is continuous. A laboratory written data processing program was used to process the acquired data,in order to generate IMS images of the whole-body rat tissue section. The IMS image of CAT (m/z 364.2/70.0) is shown in Fig. 4B. The result proves that our method is reproducible.
3.4. Processing time of different modes
The data processingprogramcanoperate intwomodes (fullmass scan mode and MRM mode); correspondingly,there are two algorithms for analysis and imaging of the sample. In order to determine the difference in the time taken for data analysis in the two modes,different parts of the sample were used for experimentation. The sample is shown in Fig. 5A. The slide is analyzed in full scan and MRM modes to obtain the mass spectrometry data. In the data processing program,a clock is set up to obtain the time needed to complete the AFAI-IMS image in the two modes.
Under full scan mode (mass range: 100-900),additional data screening is required,so the data processing time is much longer compared to theMRMmode,as can also be easily seen in Fig. 5C. In addition,the full scan mode provides the ion intensities of all of the m/z,so there is a large amount of data; as the sample size increases, the amount of data will increase further,which will undoubtedly place a burden on data processing programs,making imaging times longer and longer.
It can be seen in Fig. 5C that when the sample size increases,the analysis times of the two modes both increase; but since the MRM mode provides a smaller amount of data,the analysis time does not vary too much,while the full scan mode witnesses a much faster growth of analysis time.
A comparison of the time of two modes,shown in Fig. 5C,is offered to illustrate a point that the two modes are complementary and can satisfy the demands of different fields of application. In full scan mode,IMS results of all mass/charge ratios can be acquired. The data of this mode are comprehensive,but the processing time is long and data processing is difficult,so it is suitable for pathological diagnosis and other situations in which the mass/ charge ratio of the target sample is unknown [27]. The MRM mode allows the data of some specific mass/charge ratios to be obtained, is more sensitive,and requires less processing time and simpler data processing,so it is suitable for situations in which the m/z of the target sample is known,such as drug analysis [28].
4. Conclusion
In summary,a new imaging MS system AFAI-IMS (AFADESIIMS) based on the AFAI source in DESI mode has been developed and applied to the high-resolution imaging of different samples. Since the introduced air flow enhances sample ionization,the detection sensitivity is increased. It provides a very suitable and specific method for the analysis of samples which contains variety of substances.
Another feature is that our system exhibits excellent repeatability for the imaging of very large samples. In this study,a sample with an area of 150 mm × 100 mm has been successfully imaged. Meanwhile,we also developed a data processing program to process the data acquired using AFAI-IMS,which can be further used in numerical analysis.
The AFAI-IMS method reported in this manuscript is a labelfree, high sensitivity,high resolution,high throughput and in situ molecular imaging technique. The method has enormous potentials in the MS imaging of large and complicated samples. In particular,it may be used to determine the specific markers of cancer in the future. It will play an important role in the field of the biomarker assays,diagnostic assays,drug and metabolite assays,etc.
Acknowledgments
This work is financially supported by the National Instrumentation Program (No. 2011YQ17006702),the National Natural Science Foundation of China (No. 21027013 and No. 81102413) and Fundamental Research Program of Shenzhen (No. JC201005280634A).
| [1] | L.A. McDonnell, R.M.A. Heeren, Imaging mass spectrometry, Mass Spectrom. Rev. 26 (2007) 606-643. |
| [2] | S. Shimma, M. Setou, Review of imaging mass spectrometry, J. Mass Spectrom. Soc. Jpn. 53 (2005) 230-238. |
| [3] | D.S. Cornett, M.L. Reyzer, P. Chaurand, R.M. Caprioli, MALDI imaging mass spectrometry: molecular snapshots of biochemical systems, Nat. Methods 4 (2007) 828-833. |
| [4] | J.M. Wiseman, D.R. Ifa, A. Venter, R.G. Cooks, Ambient molecular imaging by desorption electrospray ionization mass spectrometry, Nat. Protoc. 3 (2008) 517- 524. |
| [5] | R. van de Plas, B. De Moor, E. Waelkens, Imaging mass spectrometry based exploration of biochemical tissue composition using peak intensity weighted PCA, in: 2007 IEEE/NIH Life Science Systems and Applications Workshop, IEEE, Bethesda, MD, (2007), pp. 209-212. |
| [6] | S.L. Luxembourg, R.M.A. Heeren, Fragmentation at and above surfaces in SIMS: effects of biomolecular yield enhancing surface modifications, Int. J. Mass Spectrom. 253 (2006) 181-192. |
| [7] | A. Benninghoven, F.G. Rüdenauer, H.W. Werner, Secondary Ion Mass Spectrometry: Basic Concepts, Instrumental Aspects, Applications, and Trends, John Wiley and Sons Publishers, New York, 1987. |
| [8] | S.A. Schwartz, M.L. Reyzer, R.M. Caprioli, Direct tissue analysis using matrixassisted laser desorption/ionization mass spectrometry: practical aspects of sample preparation, J. Mass Spectrom. 38 (2003) 699-708. |
| [9] | R.M. Caprioli, T.B. Farmer, J. Gile, Molecular imaging of biological samples: localization of peptides and proteins using MALDI-TOF MS, Anal. Chem. 23 (1997) 4751-4760. |
| [10] | Z. Takáts, J.M. Wiseman, B. Gologan, R.G. Cooks, Mass spectrometry sampling under ambient conditions with desorption electrospray ionization, Science 306 (2004) 471-473. |
| [11] | R.I. Demian, M.W. Justin, Q. Song, R.G. Cooks, Development of capabilities for imaging mass spectrometry under ambient conditions with desorption electrospray ionization (DESI), Int. J. Mass Spectrom. 259 (2007) 8-15. |
| [12] | G.A. Harris, L. Nyadong, F.M. Fernandez, Recent developments in ambient ionization techniques for analytical mass spectrometry, Analyst 133 (2008) 1297-1301. |
| [13] | D.R. Ifa, L.M. Gumaelius, L.S. Eberlin, N.E. Manicke, R.G. Cooks, Forensic analysis of inks by imaging desorption electrospray ionization (DESI) mass spectrometry, Analyst 132 (2007) 461-467. |
| [14] | K. Yanagisawa, Y. Shyr, B.J. Xu, et al., Proteomic patterns of tumour subsets in nonsmall- cell lung cancer, The Lancet 362 (2003) 433-439. |
| [15] | M.L. Reyzer, P. Chaurand, P.M. Angel, R.M. Caprioli, Direct molecular analysis of whole-body animal tissue sections by MALDI imaging mass spectrometry, Methods Mol. Biol. 656 (2010) 285-301. |
| [16] | P. Chaurand, M. Stoeckli, R.M. Caprioli, Direct profiling of proteins in biological tissue sections by MALDI mass spectrometry, Anal. Chem. 71 (1999) 5263-5270. |
| [17] | P. Chaurand, S.A. Schwartz, D. Billheimer, et al., Integrating histology and imaging mass spectrometry, Anal. Chem. 76 (2004) 1145-1155. |
| [18] | H.R. Aerni, D.S. Cornett, R.M. Caprioli, Automated acoustic matrix deposition for MALDI sample preparation, Anal. Chem. 78 (2006) 827-834. |
| [19] | J.M. He, F. Tang, Z.G. Luo, et al., Air flow assisted ionization for remote sampling of ambient mass spectrometry and its application, Rapid Commun. Mass Spectrom. 25 (2011) 843-850. |
| [20] | E.H. Seeley, S.R. Oppenheimer, D. Mi, P. Chaurand, R.M. Caprioli, Enhancement of protein sensitivity for MALDI imaging mass spectrometry after chemical treatment of tissue sections, J. Am. Soc. Mass Spectrom. 19 (2008) 1069-1077. |
| [21] | J.M. Wiseman, D.R. Ifa, Y. Zhu, et al., Desorption electrospray ionization mass spectrometry: imaging drugs and metabolites in tissues, Proc. Natl. Acad. Sci. U.S.A. 105 (2008) 18120-18125. |
| [22] | C.S. Wu, Z.X. Jia, B.M. Ning, J.L. Zhang, S. Wu, Separation and identification of moxifloxacin impurities in drug substance by high-performance liquid chromatography coupled with ultraviolet detection and Fourier transform ion cyclotron resonance mass spectrometry, Chin. Chem. Lett. 23 (2012) 1185-1188. |
| [23] | Z.G. Luo, J.M. He, Y.J. Chen, et al., Air flow-assisted ionization imaging mass spectrometry method for easy whole-body molecular imaging under ambient conditions, Anal. Chem. 85 (2013) 2977-2982. |
| [24] | V. Kertesz, G.J. van Berkel, Fully automated liquid extraction-based surface sampling and ionization using a chip-based robotic nanoelectrospray platform, J. Mass Spectrom. 45 (2010) 252-260. |
| [25] | S. Jiang, Y.S. Li, B. Sun, Determination of trace level of perchlorate in Antarctic snow and ice by ion chromatography coupled with tandem mass spectrometry using an automated sample on-line preconcentration method, Chin. Chem. Lett. 24 (2013) 311-314. |
| [26] | T. Schramm, A. Hester, I. Klinkert, et al., imzML—A common data format for the flexible exchange and processing of mass spectrometry imaging data, J. Proteomics 75 (2012) 5106-5110. |
| [27] | R. van de Plas, K. Pelckmans, B.D. Moor, E. Waelkens, Spatial querying of imaging mass spectrometry data: a nonnegative least squares approach, in: Benelux Bioinformatics Conference, 2007. |
| [28] | S.K. Shahidi, M. Andersson, J.L. Herman, T.A. Gillespie, R.M. Caprioli, Direct molecular analysis of whole-body animal tissue sections by imaging MALDI mass spectrometry, Anal. Chem. 78 (2006) 6448-6456. |