随着人类社会的发展, 特别是人类活动的不断扩张和加剧, 不仅大量消耗了平流层臭氧, 也使对流层臭氧的浓度和分布产生了巨大变化。早期对对流层臭氧的研究以局地观测为主[1], 然而各地观测资料缺乏时间上的一致性, 而且空间覆盖面积小。因此研究者开始尝试利用卫星观测到的大气臭氧总量来获得对流层臭氧总量。目前, 从卫星观测的大气臭氧总量数据得到对流层臭氧总量的方法有很多种。Fishman提出的TOR方法, 是通过总臭氧测绘光谱计 (Total Ozone Mapping Spectrometer, TOMS) 的大气臭氧柱总量数据和SUVB提供的平流层臭氧廓线数据来得到对流层臭氧总量数据[2-3]。Fishman, Creilson等运用TOR方法得到的对流层臭氧柱总量数据对全球及部分区域对流层臭氧的时空分布及变化做了初步研究[4-7]; 并对对流层臭氧柱总量的高浓度区域进行了分析, 例如:对流层臭氧与厄尔尼诺、北大西洋涛动等气候因子的相关分析, 以及大陆间污染物的输送等[8-9]。
本文运用1979—2000年对流层臭氧柱总量的月平均数据及季节平均数据, 结合MOPITT卫星的CO和GOME及SCIAMACHY卫星的NO2资料讨论了对流层O3分布的可能原因。
1 数据本研究对流层臭氧柱总量数据是由NASA提供的1979—2000年对流层臭氧柱总量的月平均资料和季节平均资料。采用Fishman的TOR (对流层臭氧剩余) 方法。对流层臭氧柱总量数据网格点数据范围是从50°S ~ 50°N, 纬向分辨率为1°, 经向分辨率为1.25°。所用CO数据是由对流层污染测量仪 (Measurement of Pollution in the Troposphere, MOPITT) 提供的, 对流层污染测量仪 (MOPITT) 由加拿大空间局提供, 由COM DEV公司制造, 1999年12月随着美国宇航局 (NASA) 的TERRA卫星的发射而升空工作的。MOPITT离地高度705 km, 每天经过两极环绕地球16次, 大约16 d覆盖整个地球。CO浓度数据的水平分辨率为22 km, 垂直分辨率为3 km, 精度优于10%。所用的NO2数据是由1995年发射的全球臭氧监测仪 (Global Ozone Monitoring Experiment, GOME) 和由2002年发射的大气制图扫描成像吸收光谱仪 (SCanning Imag ing Absorption SpectroMeter for Atmospheric CHartographY, SCIAMACHY) 提供的, GOME卫星NO2的分辨率是320 km ×40 km, 约3 d覆盖全球。SCIAMACHY卫星的分辨率是60 km ×30 km, 约要6 d覆盖全球, 精度优于10%。
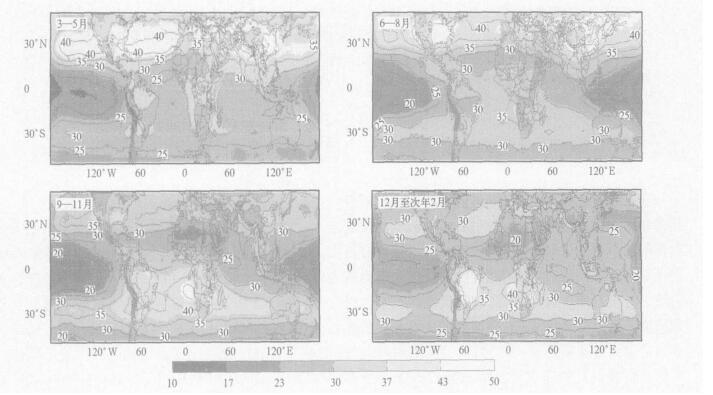
2 全球对流层臭氧柱总量的分布特征对流层臭氧有两个主要来源:一是平流层臭氧对对流层的输送 (STE), 一是对流层的光化学过程。STE过程发生在中纬度一些特定天气过程中, 从全球的角度来讲, 对流层臭氧主要决定于光化学反应。图 1是全球范围 (50°S ~ 50°N) 对流层臭氧柱总量四季平均浓度分布图。从图 1可以得出全球对流层臭氧柱总量的分布特征:太阳辐射的强弱变化主导了对流层臭氧的季节变化, 北半球对流层臭氧柱总量夏季最高, 春季次之, 冬季最低; 对流层臭氧柱总量高浓度区域与人口和城市的分布具有良好的一致性; 从6—8月及9—11月图可明显看出, 南北半球各存在几个对流层臭氧高浓度区域, 分别是:北半球高值区位于我国东部、美国东部、印度北部和东南亚地区、欧洲西部高值区; 南半球两个高值区分别位于南美洲中部和非洲南部和中部。在远离陆地的北大西洋和地中海上对流层臭氧也具有很高的浓度。

|
|
| 图 1. 对流层臭氧柱总量全球四季平均浓度分布图 (单位: DU) Fig 1. Seasonal averaged tro pospheric ozone residual (unit:DU) | |
3 全球对流层臭氧高浓度区域的产生原因
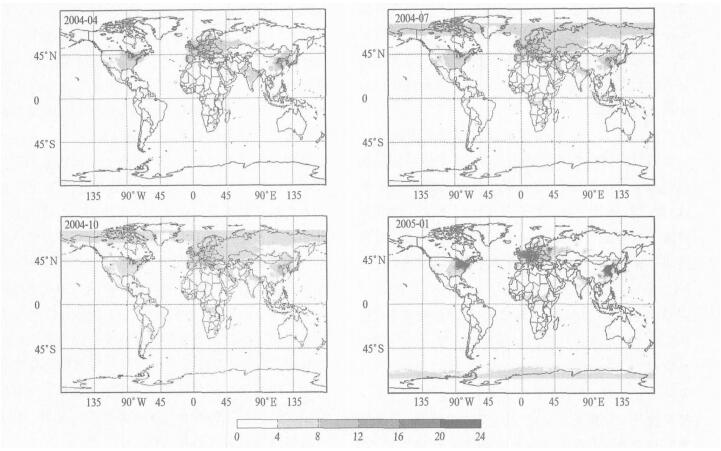
在对流层的光化学反应中, CO, NO2是对臭氧生成起主要贡献作用的气体。图 2是NO2的四季分布图 (根据GOME卫星1996—2002年和SCIAMACHY卫星2003—2004年的数据结果, 发现不同年份NO2高浓度区域分布的变化较小, 所以在此以2004年的情况为代表)。图 2中NO2有较明显的季节变化, 以中国东部为例, 夏季最低, 冬季最高。这与前人工作研究结果相符合[10]。从图 2可以看出NO2高浓度区域主要集中在北半球几个特定的地区, 包括我国东部及沿海地区、欧洲西部、美国东部, 此外在南半球还有3个强度范围相对比北半球较小的高值区。图 2所示的NO2的分布与城市和人类活动的密集程度有相当好的一致性, 这是因为汽车尾气是NO2的主要来源, 大约为33 Tg/a, 约占全球年对流层NOx总量的64% [11]。比较图 1和图 2可发现在NO2的高值区域对流层臭氧柱总量一定为高浓度值, 可以看到在北半球美国东部、我国东部、和欧洲西部, 高浓度的NO2对对流层臭氧的高值有很重要贡献。

|
|
| 图 2. NO2全球分布图 (单位: 1015molec·cm-2) Fig 2. Global NO2 column distribution (unit:1015molec·cm-2) | |
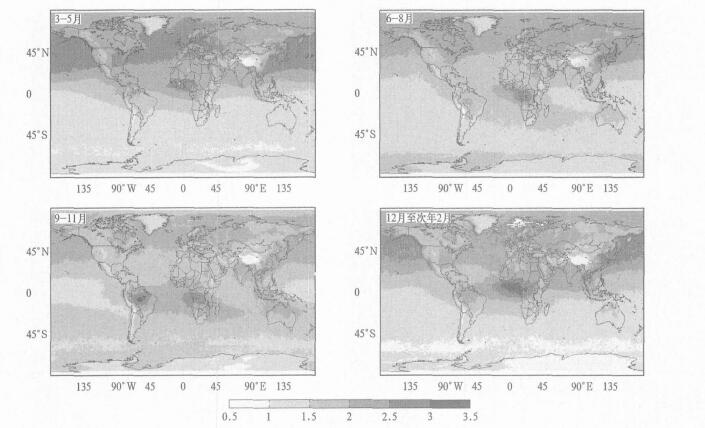
图 3是2000—2004年的CO年平均全球四季分布图。比较图 1和图 3可以看出, 南半球春季有两个对流层臭氧柱总量高值区, 南美中部亚马孙河森林覆盖面积非常大, 在春季经常会发生一些火灾。此外, 生物体燃烧也是CO源重要的组成[10, 12-13], 大约为700 Tg/a[11]。南半球的春季, 尤其是在南美中部亚马孙河流域以及南部非洲以农业为主的区域, 在农耕季节大面积生物体燃烧会产生大量CO, 而CO正是对流层臭氧产生的重要前体物之一。因此, 南半球春季生物体的燃烧可能是此区域对流层臭氧高值产生的主要原因。

|
|
| 图 3. 不同季节CO全球分布图 (单位: 1018molec·cm-2) Fig 3. Global CO column distribution of four seasons (unit:1018molec·cm-2) | |
CO和NOx是在对流层臭氧化学产生过程中起着重要作用的物质。在南半球南美中部和非洲南部, 生物体燃烧产生的CO可能是对流层臭氧高值的主要原因; 在美国东部NOx排放对对流层臭氧高值起主要贡献作用; 在我国东部和在印度北部高浓度的对流层臭氧可能来自于CO和NOx的共同贡献。总之, 人类活动所造成的生物体燃烧、工业活动以及汽车尾气的共同影响是对流层臭氧高值区域分布的主要原因。
比较图 1、图 2和图 3可以发现在北半球3个主要的对流层臭氧柱总量高值区, 夏季是对流层臭氧柱总量最高的季节, 在这3个高值区域的NO2和CO浓度却是其一年中的最低值。因此从3种气体浓度的季节变化来讲, 并不是CO和NO2越高对流层臭氧量越高。这是因为夏季化学反应比较活跃, NO2和CO的汇增强, 使此时NO2和CO浓度处于四季中最低值。但是在对流层臭氧高浓度区域, NO2和CO与其他区域相比还是高浓度。因此仍有足够的CO和NO2来参与生成臭氧的化学反应。从年变化上讲, 北半球对流层臭氧柱总量的大小主要取决于太阳辐射的强度; 从空间分布上讲, 对流层臭氧柱总量的高低值的分布主要取决于NO2和CO的空间分布。
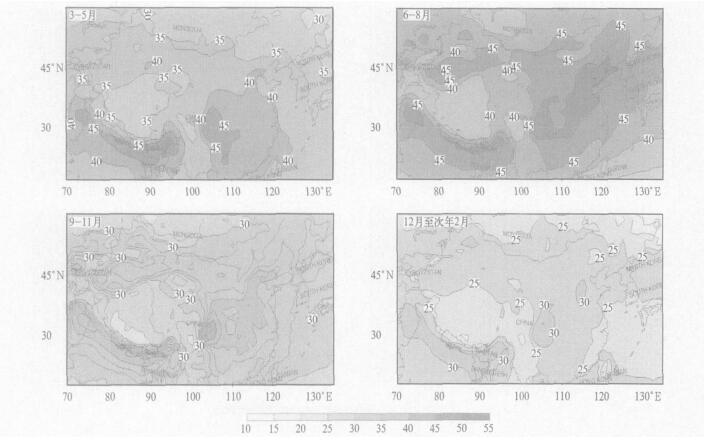
4 我国大陆地区对流层臭氧分布特征图 4是我国大陆地区对流层臭氧四季分布图。从图 4可看出我国对流层臭氧具有明显分布特征。①季节分布:夏季最高, 春季次之, 冬季最低; 与太阳辐射强度周期相一致。②对流层臭氧的分布受地形影响:6—8月我国出现了一个鱼钩形的高值地带, 其钩部正是四川盆地, 东北—西南向的高值带可明显看出与太行山的走向有极好的一致性, 这可能是由于山脉对对流层臭氧西北向输送的阻挡作用。在3—5月和9—11月分布图也可看出山脉对对流层臭氧西北向输送的阻碍作用。四川盆地一年四季与其他地带相比都处于高值状态, 青藏高原地区四季都处于相对低值状态。以上对流层臭氧分布的特点说明了地形对对流层臭氧的分布有重要影响。此外, 从6—8月和9—11月图都可以明显看出在沿青藏高原的北部边缘的新疆沙漠地区及向东的延伸, 虽然人活动稀少但对流层臭氧柱总量在各个季节的浓度都相对较高, 从印度西北部、中亚地区以及欧洲地区的西来气流中的对流层臭氧, 对于该区域的对流层臭氧高值可能有贡献。

|
|
| 图 4. 我国大陆地区近20年对流层臭氧分布图 (单位: DU) Fig 4. Tropospheric ozone residual over East Asia in recent 20 years (unit:DU) | |
5 结论
本文运用现有1979—2000年对流层臭氧柱总量的月平均数据及季平均数据, 分析了全球和我国对流层臭氧的分布, 并结合MOPPIT卫星的CO资料和GOME与SCIAMACHY卫星的NO2资料对其原因进行了初步分析。对流层臭氧柱总量有规律的季节变化, 在北半球, 夏季最高6—7月达到峰值, 春季次之, 冬季最低, 12月左右达到低谷; 在南半球, 春季最高10月达到峰值, 夏季次之, 秋季最低, 5月达到最低值。这是由于生成臭氧的光化学反应速率与太阳辐射强弱的一致性。在南半球南美中部和非洲南部, 生物体燃烧产生的CO可能是对流层臭氧高值的主要原因; 在美国东部NO、我国东部和印度北部高浓度的对流层臭氧来自于CO和NOx的共同贡献。从年变化上讲, 北半球对流层臭氧柱总量的大小主要取决于太阳辐射强度; 从空间分布上讲, 对流层臭氧柱总量高低值的区域分布主要取决于NO2和CO的空间分布。我国对流层臭氧柱总量夏季最高, 春季次之, 冬季最低, 这与太阳辐射强度周期相一致。我国的对流层臭氧浓度高值区主要分布在我国东部沿海人口密集和工业发达的地区。
致谢 感谢asd-www.larc.nasa.gov网站提供的对流层臭氧数据; www.iup.phy sik.uni-bremen.de/doas/gome/NO2-data.htm网站提供的NO2数据; eosdatainfo.gsfc.nasa.gov/eosdata/terra/moppitt/mopitt_dataprod.html网站提供的CO数据。| [1] | 秦瑜, 赵春生. 大气化学基础. 北京: 气象出版社, 2003. |
| [2] | Fishman J, Brackett V G, Browell E V, et al. Tropospheric ozone derived from TOMS/SBUV measurements during TRACE A. J Geophys Res, 1996, 101: 24069–24069. DOI:10.1029/95JD03576 |
| [3] | Fishman J, Brackett V G. The climatological distribution of tropospheric ozone derived from satellite measurements using version 7 total ozone mapping spectrometer and stratospheric aerosol and gas experiment data sets. J Geophys Res, 1997, 102: 19275–19278. DOI:10.1029/97JD01373 |
| [4] | Fishman J, Balok A E. Calculation of daily tropospheric ozone residuals using TOMS and empirically improved SBUV measurements:Application to an ozone pollution episode over the eastern United States. J Geophys Res, 1999, 104: 30319–30340. DOI:10.1029/1999JD900875 |
| [5] | Fishman J, Watson C E, Larsen J C. Distribution of tropospheric ozone determined from satellite data. J Geophys Res, 1990, 95: 3599–3617. DOI:10.1029/JD095iD04p03599 |
| [6] | Fishman J, Wozniak A E, Creilson J K. Global distribution of tropospheric ozone from satellite measurements using the empirically corrected tropospheric ozone residual technique:Identification of the regional aspects of air pollution. Atmos Chem Phys, 2003, 3: 893–907. DOI:10.5194/acp-3-893-2003 |
| [7] | Fishman J, Wozniak A E, Creilson J K. Global distribution of tropospheric ozone from satellite measurements using the empirically corrected tropospheric ozone residual technique:Identification of the regional aspects of air pollution. Atmos Chem Phys Discuss, 2003, 3: 1453–1476. DOI:10.5194/acpd-3-1453-2003 |
| [8] | Creilson A E, Fishman J, Wozniak A E. Intercontinental transport of tropospheric ozone:a study of its seasonal variability across the North Atlantic utilizing tropospheric ozone residuals and its relationship to the North Atlantic Oscillation. Atmos Chem Phys, 2003, 3: 2053–2066. DOI:10.5194/acp-3-2053-2003 |
| [9] | Ceilson J K, Fishman J, Wozniak A E. Intercontinental transport of tropospheric ozone:A study of its seasonal variability across the North Atlantic utilizing tropospheric ozone residuals and its relationship to the North Atlantic Oscillation. Atmos Chem Phys Discuss, 2003, 3: 4431–4460. DOI:10.5194/acpd-3-4431-2003 |
| [10] | Thompson A M, Witte J C, Hudson R D, et al. Tropical tropospheric ozone and biomass burning. Science, 2001, 291: 2128–2132. DOI:10.1126/science.291.5511.2128 |
| [11] | IPCC. Climate Change 2001. Cambridge: Cambridge University Press, 2001. |
| [12] | 江文华, 马建中, 颜鹏, 等. 利用GOME卫星资料分析北京大气NO2污染变化. 应用气象学报, 2006, 17, (1): 68–72. |
| [13] | 方圆圆, 赵春生. 利用对流层污染测量仪研究2002年东亚地区CO总量分布特征. 大气科学, 2005, 29, (3): 363–371. |
 2007, 18 (2): 181-186

