2. 中国地质大学地质过程与矿产资源国家重点实验室, 北京 10008;
3. 维也纳大学地质系, 维也纳 1090
2. State Key Laboratory of Geological Process and Mineral Resources, China University of Geosciences, Beijing 10008;
3. Department of Geology, University of Vienna, Vienna 1090, Austria
石英是地壳中储量最丰富、分布最广泛的矿物之一,可形成于多种物理化学环境。作为重要的热液与脉石矿物,石英在热液系统内的结晶生长能够记录区域环境演化的直接信息(Götte et al., 2011; 陈小丹等, 2011; Götte and Ramseyer, 2012; Kempe et al., 2012; Rusk, 2012)。石英晶体中微量元素含量的变化,反映了石英在富集微量元素过程中的物理化学条件及区域地质演化过程(Rusk, 2012)。因此石英微量元素含量信息不仅可以用来确定其形成环境的成矿潜力,而且可以用来确定石英的结晶条件,判断形成石英的流体、熔体的来源(Flem and Müller, 2012; Deng et al., 2018; Qiu et al., 2021)。
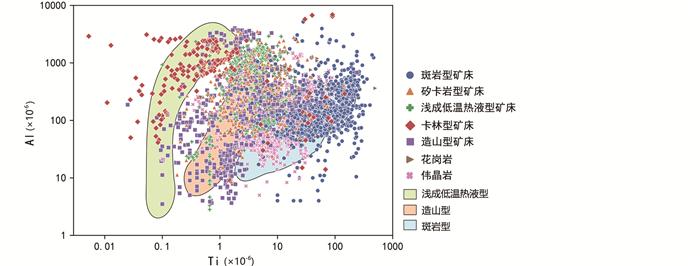
不同地质环境下石英晶格中微量元素的地球化学特征具有明显差异性。通过石英的微量元素对原岩进行分类的研究持续已久(Schrön et al., 1988; Götze, 2009; 陈剑锋和张辉, 2011; Rusk, 2012; Breiter et al., 2020; Deng et al., 2020b, 2021)。前人已经对石英成因判别进行了重要的研究:Schrön et al. (1988)提出适用于判别花岗岩、伟晶岩和流纹岩三种类型石英的Ti-Al-Ge三元图解;Rusk (2012)对来自大约30个热液矿床(包括斑岩型(Cu-Mo-Au)矿床、造山型金矿床和浅成低温热液型金矿床)的石英微量元素归纳研究,根据Al和Ti的含量对这些矿床的类型加以区分,提出可判别这三种类型石英的Al-Ti图解(图 1)。
|
图 1 不同产状石英微量元素Al-Ti图解及其与Rusk (2012)分区对比 Fig. 1 Some published quartz trace element data on the Al-Ti diagram (the base map after Rusk, 2012) |
Schrön et al. (1988)和Rusk (2012)的图解研究均基于二维数据可视化方法。然而,越来越多的研究表明,二维图解无法展示多维度的信息特征,以石英图解为例:这些图解并不能与部分已知类型的石英微量元素数据吻合,如Peterková and Dolejš (2019)的花岗岩石英微量元素数据均落在Schrön et al. (1988)的Ti-Al-Ge三元图相应花岗岩的区域范围之外;Rusk (2012) Al-Ti二元图解,以一些已发表的石英微量元素元素数据为例(图 1),其中斑岩型石英与该图解所划定的范围吻合度较高,而浅成低温热液型石英与Rusk (2012) Al-Ti二元图解划定的相应区域有较大的偏移,且与造山型矿床的相应区域有较大重叠;造山型石英相较于该图解圈定的范围更宽广,进一步增大了误差范围。虽然上述图解在随后的研究中进行了补充修订(Götze, 2009; Breiter et al., 2020),数据二维研究方法的先天性不足导致如今依旧无法准确判断石英类型,精确约束石英生成环境。
近年来,随着数据可用性和计算规模的增长,机器学习为地球科学的发展和应用提供了新的机遇。机器学习可以帮助地质学家对地震数据进行高效分类(周永章等, 2018a; Geng and Wang, 2020),利用遥感数据进行岩性分类(Yu et al., 2012; Cracknell and Reading, 2014; Deng et al., 2020a),通过矿物微量元素数据对矿物形成环境进行判别(Deng and Wang, 2016; O’sullivan et al., 2020; Wang et al., 2021; Zhang et al., 2021; Zhong et al., 2021a, b)。随着微区测试等技术的成熟,日渐丰富的地学数据可以运用机器学习寻找到最适合的,更高效,准确度更高的数据处理方法(周永章等, 2018b)。
本文收集了全球典型矿床的石英微量元素数据,包含造山型矿床、斑岩型矿床、浅成低温热液矿床、卡林型矿床、矽卡岩型矿床以及不含矿的花岗岩和伟晶岩七种类型,剔除成矿晚期的样品后共1220个测试点数据(表 1)。在前人研究的基础上,运用监督学习机器学习方法,重新研究石英微量元素组合对岩体成矿特征的判别,提出有效的地球化学指标,建立新的石英类型判别图解。
|
|
表 1 不同成因类型石英微量元素数据量 Table 1 Published data of quartz trace elements from different forming environment |
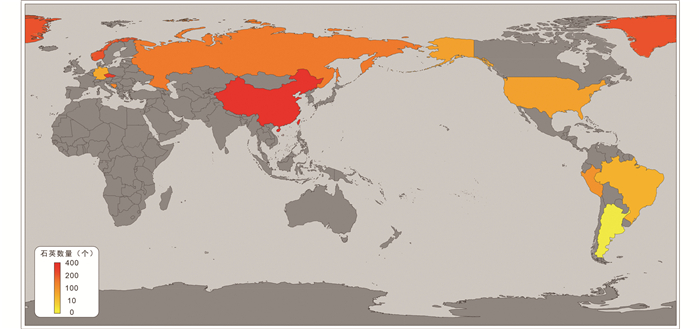
选取Al、Ti、Li、Ge、P等五个在石英微量元素研究中具有典型性和代表性的元素,基于Python在大数据以及人工智能方面具有的显著优势,执行最佳端元穷举。石英微量元素数据集来自以下七种类型:花岗岩:Altenberg-Teplice地区(Breiter et al., 2012)、Bohemian地块(Breiter et al., 2013)、Cínovec-Zinnwald地区(Breiter et al., 2017)、Orlovka花岗岩(Breiter et al., 2019)、Kleivan花岗岩(Jacamon and Larsen, 2009)和Krupka花岗岩(Peterková and Dolejš, 2019);伟晶岩:Borborema伟晶岩(Beurlen et al., 2011)、Orlovka伟晶岩(Breiter et al., 2019)、挪威南伟晶岩(Larsen et al., 2004)和Krupka伟晶岩(Peterková and Dolejš, 2019);斑岩型矿床:Bingham Cu-Au-Mo矿床(Landtwing and Pettke, 2005)、North Parkes Cu-Au矿床(Tanner et al., 2013);浅成低温热液型矿床:Cerro de Pasco地区(Rottier and Casanova, 2021)、Colquijirca地区(Rottier and Casanova, 2021)、Summitville Au-Ag-Cu高硫型矿床(Tanner et al., 2013)、El Indio Au-Ag-Cu高硫型矿床(Tanner et al., 2013);矽卡岩型矿床:鸡冠嘴铜金矿床(Zhang et al., 2019);卡林型矿床:丫他金矿床(Li et al., 2020)、烂泥沟金矿床(Yan et al., 2020);造山型矿床:古台山金锑矿床(Feng et al., 2020)(表 1)。样品的全球分布图见图 2,详见http://doi.org/10.5281/zenodo.4077298。
|
图 2 石英数据集采样位置分布 Fig. 2 Location of quartz dataset used in this study |
数据集Al值从5×10⁻⁶到3579×10-6,平均值为441.7×10⁻⁶;Ti值从0.005×10⁻⁶到501×10-6,平均值为22.6×10⁻⁶;Li值从0.03×10⁻⁶到215.7×10⁻⁶,平均值为19.6×10⁻⁶;Ge值从0.16×10⁻⁶到35.85×10⁻⁶,平均值为2.86×10⁻⁶;P值从0.2×10⁻⁶到113.0×10⁻⁶,平均值为19.0×10⁻⁶。不同成因类型石英的微量元素含量箱式图展示了数据集石英微量元素数据按类型的大致分布(图 3)。

|
图 3 不同产状和成因类型石英的微量元素含量箱式图 矩形盒两端分别是数据的上、下四分位数. 矩形盒中的水平黑线代表中值,白点代表平均值. 矩形盒上、下延伸截至的横线处代表最大值和最小值. 黑点代表偏差大于±1.5σ的异常值 Fig. 3 Trace element concentrations of the different genetic types of quartz Height of the color boxes show the interquartile range. The horizontal black lines within the boxes represent the median value. The white dots represent the mean value. Black lines that extended away up and down from the boxes, shows the maximum and minimum value on their horizontal cross cut. Black dots represent the outliers deviating by more than ±1.5σ |
工作流程如下:(1)数据预处理;(2)建立穷举端元;(3)组合穷举端元;(4)选出最优组合;(5)对比不同机器学习算法在最优组合上的表现;(6)选出在此问题上最优的机器学习分类算法;(7)优化所选算法的超参数制作最终图解。
2.1 数据预处理首先对每个分组中存在缺失值的样品进行剔除处理。通过计算Al、Ti、Li、Ge、P五个元素中任意两元素比值,得到Ti/Ge、Ti/P、Ti/Al、Ti/Li、Ge/P、Ge/Al、Ge/Li、P/Al、P/Li、Al/Li共10种组合。将初始的5种元素含量与计算后的10种元素含量比值联合,进行对数转换,得到15个构建图解的端元。利用正态化的数据,以穷举的方式生成共105个二元图解。
2.2 穷举二元图解端元为量化且准确地筛选有效的地球化学图解,引入轮廓系数(Silhouette Coefficient)。轮廓系数是机器学习中用于无真实标签的环境下评估分簇结果的指标(Rousseeuw, 1987)。更高的轮廓系数代表模型具有更好的分簇。单个样本的轮廓系数s由内聚度和分离度两种因素决定,表达为公式(1):

|
(1) |
其中a代表样本与同一类别中其他所有点之间的平均距离,b代表样本与下一个最近的簇中其他所有点之间的平均距离。一组样本的轮廓系数是每个样本轮廓系数的平均值。轮廓系数的范围为[-1, 1]。1指集群之间的距离清晰,区分清楚;0代表集群无关联性,亦或集群之间的距离不显著;-1代表群集分配方式错误。
通过轮廓系数量化数据簇内部紧密程度与数据簇之间的分离程度,对所有组合的图解按照轮廓系数值降序排序。轮廓系数越大,即各类别数据点簇之间分散度越大且点簇内部数据之间的关联度越高,表示各类型石英的区分度越好。基于轮廓系数,可筛选出全类型石英和仅矿床类型石英具有最佳区分度的端元,来构建端元图解。
2.3 机器学习算法计算决策边界以穷举结果最优组合的两个端元作为坐标轴制作判别图解:本工作首先以这两个端元作为特征样本使用机器学习算法训练模型,再利用所得模型对二维平面中的所有点数据进行预测计算,推断出决策边界。所呈现的决策边界即为图解中不同石英类型的边界。为提高运算精度,测试并对比了当前机器学习领域,普遍使用的6种经典监督学习分类算法,包括线性内核的支持向量机、K近邻、随机森林、多项式内核的支持向量机、高斯内核的支持向量机和神经网络。
支持向量机(Support Vector Machine, SVM)模型是将实际学习样本转换成空间坐标系中的点,以呈现出决策边界。这样映射可将单独类别的实例被最大限度的间隔开。新映射的样本,将基于它们相对于决策边界的分布来预测所属类别。除了典型线性分类预测,支持向量机还可以使用所谓的核技巧有效地进行非线性、多维度的分类预测(Chang and Lin, 2011; Hsu et al., 2003)。K近邻(K-Nearest Neighbors, KNN)是所有的机器学习算法中最易部署的方法之一,它是一种基于学习样本局部近似程度的惰性学习方法(Zhang and Zhou, 2007)。随机森林(Random Forest)是一种基于学习样本建立多决策树,对新的训练样本进行分类与回归预测的集成学习方法(Breiman, 1998, 2001)。人工神经网络(Artificial Neural Network,ANN)是一种通过计算模型或数学模型,模仿动物大脑内生物神经网络结构和功能,用于对学习样本进行估计预测或近似预测的学习方法(Kohonen, 1988)。
判别图解的构建基于六种算法在的学习曲线与分别预测的石英分类边界图。学习曲线使用交叉验证得分(Browne, 2000),具体采用10折交叉验证方法,即将训练集分割成10个子样本,一个单独的子样本被保留作为验证模型的数据,其他9个样本用来训练。交叉验证重复10次,每个子样本验证一次,平均10次的结果最终得到一个单一估测。学习曲线确定不同训练集大小的交叉验证训练和测试分数。结合学习曲线,审查边界过度拟合现象,综合选取最优机器学习算法;超参数进一步优化,计算与确定判别图上的决策边界(石英类型边界)。
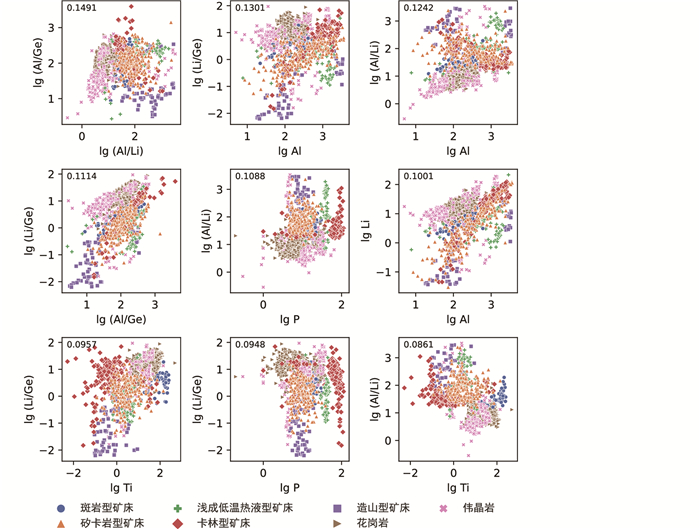
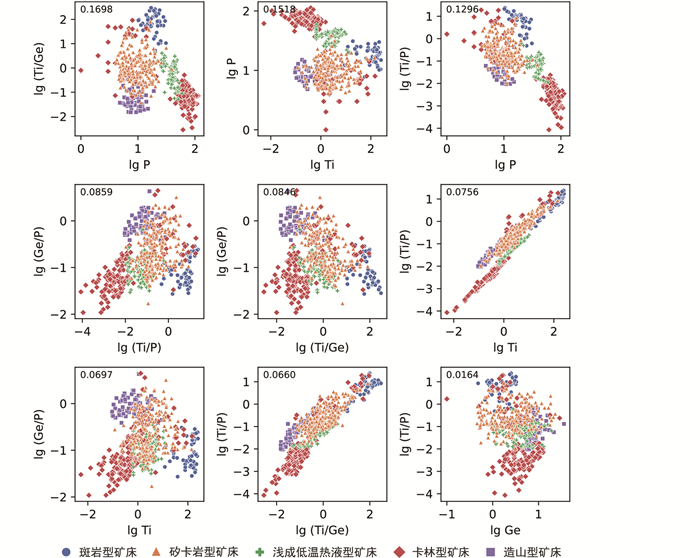
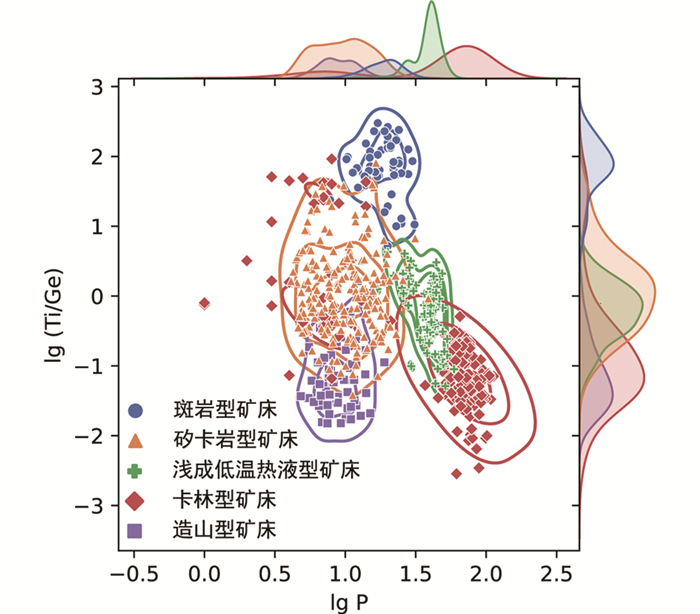
3 结果全类型石英图解中轮廓系数最高的组合为Al/Ge-Al/Li,其轮廓系数为0.1491(图 4)。矿床类型石英图解中轮廓系数最高的组合为Ti/Ge-P,其轮廓系数为0.1698(图 5)。为了更详细地展示Ti/Ge-P图解中数据的分布,绘制了Ti/Ge-P图解的核密度估计图(图 6)。
|
图 4 穷举方法得出的区分数据集全部类别石英排名前9的图解 每个坐标轴左上角数值为其轮廓系数 Fig. 4 Top 9 results of biplots of all types from the dataset of quartz by using exhaustive method The Silhouette Coefficient of each axis is at the upper left corner |
|
图 5 穷举方法得出的区分矿床类型石英排名前9的图解 每个坐标轴左上角为其轮廓系数 Fig. 5 Top 9 results of biplots of mineral deposit types of quartz by using exhaustive method The Silhouette Coefficient of each axis is at the upper left corner |
|
图 6 石英微量元素区分不同矿床类别图解中最优图解的核密度估计图 Fig. 6 Kernel density estimation of the best biplot for discriminating different types of mineral deposits by quartz trace elements |
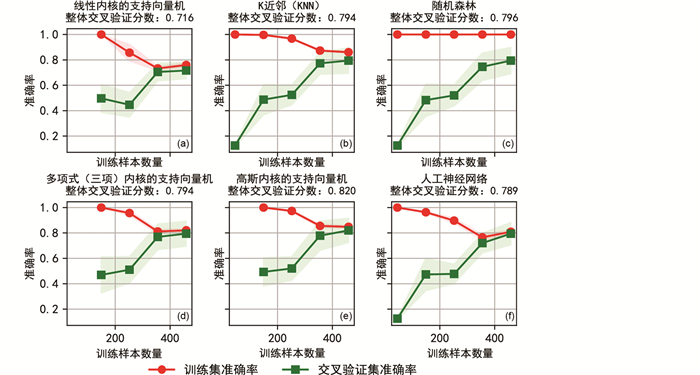
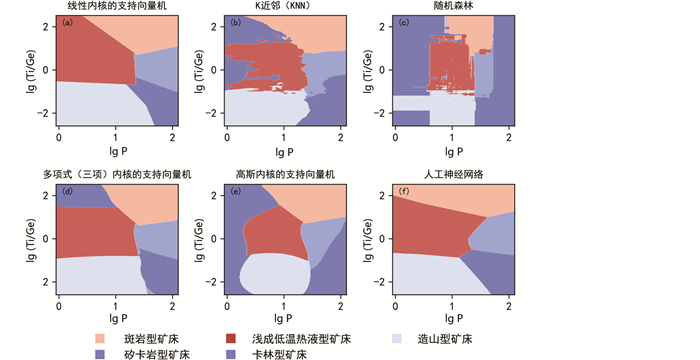
最终用于机器学习的数据量为卡林型矿床76个、浅成低温热液型矿床116个、造山型矿床64个,斑岩型矿床52个、矽卡岩型矿床203个,六种机器学习分类方法分别计算出的5种矿床类型石英的学习曲线(图 7)及其决策边界(图 8)。线性内核的支持向量机交叉验证分数为0.716(图 7a);K近邻交叉验证分数为0.794(图 7b);随机森林交叉验证分数为0.796(图 7c);多项式(三项)内核的支持向量机交叉验证分数为0.794(图 7d);高斯内核的支持向量机交叉验证分数为0.820(图 7e);人工神经网络交叉验证分数为0.789(图 7f)。交叉验证分数越高,即所得结果的准确度越高。
|
图 7 六种机器学习分类算法在不同矿床类型石英分类的学习曲线比较 Fig. 7 Comparison of six machine learning classification algorithms on the learning curve of different mineral deposit types of quartz |
|
图 8 六种机器学习分类算法在不同矿床类型石英分类的决策边界问题上的比较 Fig. 8 Comparison of six machine learning classification algorithms on the making decision boundary of different mineral deposit types of quartz |
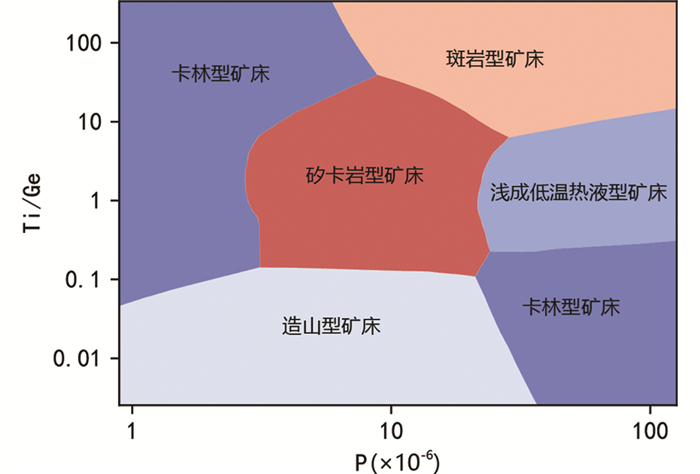
经过交叉验证的分数和视觉审查(图 8)的综合评判,选定人工神经网络作为图解构建的算法,其经优化超参数后预测出最终的判别图解决策边界(图 9),其隐藏层数为2层:其中第一层100个神经元、第二层30个神经元,其交叉验证分数为0.869。
|
图 9 矿床类型石英判别图解 经过网格搜索调整超参数的人工神经网络预测出决策边界 Fig. 9 Discriminating diagram for different types of quartz Decision boundaries predicted by neural network whose hyperparameters was tuned by gridsearch |
由于各端元的数值范围差别巨大(如,Al,5×10-6~3579×10-6;Ge,0.16×10-6~35.85×10⁻⁶),且中值通常远低于其平均值,不符合正态分布。对数据集做对数变换,获得符合正态分布且变化范围较小的数据集,以保证图解中的数据点分布范围相对均匀,易于判断区分效果。由于各类别不存在明显的数据不平衡问题(Chawla et al., 2004),未进行过采样等处理。
七种类型石英的端元穷举结果显示(图 4),整体上,由于二维空间的局限性,区分七种类型石英的数据点时产生叠盖是难以避免的。相较于单一元素值,元素比值能携带更多信息,因此在判别图解上普遍比单一元素作为端元具有更好的表现。在区分不同矿床类型石英的穷举结果上(图 5),P和Ti是单元素作为区分单元效果较优。Al端元对各类矿床的区分效果较差,即便Rusk (2012)图解本身的Al所在的维度亦有较大重叠。Li+常以电价补偿的形式进入石英晶格而存在于其晶格间隙中(陈剑锋和张辉, 2011),常与Al3+共同替代Si4+,Al3+与Li+通常具有较高的正相关关系(Rusk, 2012)。Al/Li是出现频数最高的元素比值端元,具有较好的判别表现。在七种不同类别的石英中,尤其在岩浆岩-斑岩型矿床-浅成低温热液型矿床系列中存在明显变化性与差异性,反映了Al与Li的相关关系可能受温度影响较大。在五种类型矿床区分的结果上(图 5),Ti/Ge与P为最优组合。其中Ti与Ge的比值被认为是岩浆分馏指标(Breiter et al., 2017)。P是较少被讨论的石英微量元素元素之一,但其在不同类型矿床的石英中具有明显的差异,能有效地区分石英的类型。虽然石英中的P能够对岩体赋矿类型进行有效区分,但这种现象尚未得到充分理解,其背后的地球化学意义尚待分析和发掘。
矿床类型石英微量元素最优判别端元的核密度估计图(图 6)显示,除了卡林型矿床类型的石英微量元素数据略呈现两极化,其它类型的石英微量元素数据在此二端元的图解上分布致密,不同类别之间亦具有较好的分离。卡林型矿床的石英微量元素数据来自烂泥沟矿床(Yan et al., 2020)和丫他矿床(Li et al., 2020),尽管二者都被认为是卡林型矿床,但其石英微量元素存在着较明显的分歧,且二者的数据均来自粉砂岩中的石英脉,未见围岩对此差异造成影响。卡林型矿床是否具有成因意义,以及卡林型是否属于成因类型,仍需进一步研究与探讨(欧阳玉飞等, 2011)。
4.2 机器学习算法比较学习曲线结果显示(图 7),除线性内核的支持向量机(图 7a)最终交叉验证分数为0.716,其他五种算法均在0.8左右,无显著差异代表预测结果准确度约为80%。除随机森林外(图 7c),其他五种算法的训练集曲线和交叉验证集曲线均已收敛,无过度拟合。80%准确率,存在一定的欠拟合,从曲线走势来看增加样本量已不能解决问题,已经是在二维空间中的理想结果。高斯内核的支持向量机更适合解决中等样本数量和中等特征数量的问题,而此问题仅有两个特征,从其可视化的的结果来看(图 8e),大面积出现样本概率低的区间均被预测为卡林型矿床类别。此类别的数据点相对分散,对高斯内核的支持向量机方法呈现出的结果有较大影响,因此不建议在此问题上使用高斯内核的支持向量机。K近邻法和随机森林法的边界图边界过于嘈杂,不宜用作判别图解(图 8b, c)。尽管线性内核的支持向量机(图 8a)交叉验证分数稍低,但其具有良好的抗过度拟合能力,所得的决策边界图结果优于K近邻法和随机森林法。线性内核的支持向量机更适合解决线性可分的问题,本数据集中卡林型矿床类型石英的P值呈现出两极化特征,而线性内核的支持向量机无法兼顾。神经网络具有较高的普适性。但神经网络需要进行超参数调整,例如隐藏层数量、各隐藏层神经元的数量、学习速率和迭代次数等,调整超参数较为复杂。且隐藏层的神经网络具有非凸的损失函数,其中存在多个局部最小值,因此,不同的随机权重初始化可能导致不同的验证准确性(周志华, 2016)。在实验中我们也发现在不限定随机权重初始化情况下,人工神经网络方法每次得出的结果有明显差异,较为多变。
4.3 建议矿床判别图解综合学习曲线和决策边界图的视觉审查(图 7、图 8),人工神经网络最有利于解决此问题。为尽可能取得最优结果,通过网格搜索,以3种神经网络构架、2种优化器和100组不同参数值初始化组合的多个神经网络训练后,取交叉验证分数最高的解作为最终参数。这相当于从多个初始点开始搜索,并行选择误差函数更接近全局最小值的预测结果(周志华, 2016)。交叉验证计算得出,此Ti/Ge-P图解(图 9)具有约86%的准确率。随着未来更丰富的石英微量元素数据被发表,此图解还有待进一步更新优化。
5 结论本研究为可视化地研究石英微量元素提供借鉴,以P、Ti/Ge为端元的图解,能有效区分矿床类型。Al/Li值在斑岩型矿床、浅成低温热液型矿床系列中变化明显,Al/Li的强相关性可能受温度影响。
在使用机器学习制定二维分类判别图解问题上,应避免使用K近邻与随机森林应方法;人工神经网络与支持向量机是推荐方案;人工神经网络虽然现在常用于更为复杂深度学习,但是在为判别图解制定决策边界这种低特征数量分类问题上亦有较好的表现。在二维可视化的基础上运用的机器学习方法,高维度的研究目标特征,做出精确预测,将是未来的研究方向。有足量数据的情况下,本工作流程亦适用于其它地球化学判别图解的研究与建立。
Ti/Ge-P图解的决策边界由经过超参数调整优化的人工神经网络计算得出,可用来判别斑岩型矿床、矽卡岩型矿床、浅成低温热液型矿床、卡林型矿床以及造山型矿床中的石英,此图解具有约86%的准确率,是大数据技术与机器学习技术在地球化学研究中的探索。随着未来更丰富的石英微量元素数据的发表,此图解还有待进一步更新与优化。
致谢 论文的完成得益于邓军院士的指导;感谢张静教授和两位匿名审稿专家对文章提出的宝贵意见;感谢俞良军老师对本文细心的审阅;感谢中国地质大学(北京)的李珊珊博士后、龙政宇博士、朱紫怡和周飞为本文提供宝贵的修改意见。
Beurlen H, Müller A and Silva D and Da Silva MRR. 2011. Petrogenetic significance of LA-ICP-MS trace-element data on quartz from the Borborema Pegmatite Province, northeast Brazil. Mineralogical Magazine, 75(5): 2703-2719 DOI:10.1180/minmag.2011.075.5.2703
|
Breiman L. 1998. Rejoinder: Arcing classifiers. The Annals of Statistics, 26(3): 841-849
|
Breiman L. 2001. Random forests. Machine Learning, 45(1): 5-32 DOI:10.1023/A:1010933404324
|
Breiter K, Svojtka M, Ackerman L and Švecová K. 2012. Trace element composition of quartz from the Variscan Altenberg-Teplice caldera (Krušné hory/Erzgebirge Mts, Czech Republic/Germany): Insights into the volcano-plutonic complex evolution. Chemical Geology, 326-327: 36-50 DOI:10.1016/j.chemgeo.2012.07.028
|
Breiter K, Ackerman L, Svojtka M and Müller A. 2013. Behavior of trace elements in quartz from plutons of different geochemical signature: A case study from the Bohemian Massif, Czech Republic. Lithos, 175-176: 54-67 DOI:10.1016/j.lithos.2013.04.023
|
Breiter K, Ďurišová J and Dosbaba M. 2017. Quartz chemistry-a step to understanding magmatic-hydrothermal processes in ore-bearing granites: Cínovec/Zinnwald Sn-W-Li deposit, Central Europe. Ore Geology Reviews, 90: 25-35 DOI:10.1016/j.oregeorev.2017.10.013
|
Breiter K, Badanina E, Ďurišová J, Dosbaba M and Syritso L. 2019. Chemistry of quartz-a new insight into the origin of the Orlovka Ta-Li deposit, Eastern Transbaikalia, Russia. Lithos, 348-349: 105206 DOI:10.1016/j.lithos.2019.105206
|
Breiter K, Ďurišová J and Dosbaba M. 2020. Chemical signature of quartz from S- and A-type rare-metal granites: A summary. Ore Geology Reviews, 125: 103674 DOI:10.1016/j.oregeorev.2020.103674
|
Browne MW. 2000. Cross-validation methods. Journal of Mathematical Psychology, 44(1): 108-132 DOI:10.1006/jmps.1999.1279
|
Chang CC and Lin CJ. 2011. LIBSVM: A library for support vector machines. ACM Transactions on Intelligent Systems and Technology, 2(3): 27
|
Chawla NV, Japkowicz N and Ko A. 2004. Editorial: Special Issue on Learning from Imbalanced Data Sets. ACM SIGKDD Explorations Newsletter, 6(1): 6
|
Chen JF and Zhang H. 2011. Trace elements in quartz lattice and their implications for petrogenesis and mineralization. Geological Journal of China Universities, 17(1): 125-135 (in Chinese with English abstract)
|
Chen XD, Chen ZY, Cheng YB, Ye HS and Wang H. 2011. Distribution and application of trace elements in hydrothermal quartz: Understanding and prospecting. Geological Review, 57(5): 707-717 (in Chinese with English abstract)
|
Cracknell MJ and Reading AM. 2014. Geological mapping using remote sensing data: A comparison of five machine learning algorithms, their response to variations in the spatial distribution of training data and the use of explicit spatial information. Computers & Geosciences, 63: 22-33
|
Deng J and Wang QF. 2016. Gold mineralization in China: Metallogenic provinces, deposit types and tectonic framework. Gondwana Research, 36: 219-274
|
Deng J, Wang CM, Zi JW, Xia R and Li Q. 2018. Constraining subduction-collision processes of the Paleo-Tethys along the Changning-Menglian Suture: New zircon U-Pb ages and Sr-Nd-Pb-Hf-O isotopes of the Lincang Batholith. Gondwana Research, 62: 75-92
|
Deng J, Qiu KF, Wang QF, Goldfarb R, Yang LQ, Zi JW, Geng JZ and Ma Y. 2020a. In situ dating of hydrothermal monazite and implications for the geodynamic controls on ore formation in the Jiaodong gold province, eastern China. Economic Geology, 115(3): 671-685 DOI:10.5382/econgeo.4711
|
Deng J, Yang LQ, Groves DI, Zhang L, Qiu KF and Wang QF. 2020b. An integrated mineral system model for the gold deposits of the giant Jiaodong province, eastern China. Earth-Science Reviews, 208: 103274
|
Deng J, Wang QF, Gao L, He WY, Yang ZY, Zhang SH, Chang LJ, Li GJ, Sun X and Zhou DQ. 2021. Differential crustal rotation and its control on giant ore clusters along the eastern margin of Tibet. Geology, 49(4): 428-432 DOI:10.1130/G47855.1
|
Feng YZ, Zhang Y, Xie YL, Shao YJ, Tan HJ, Li HB and Lai C. 2020. Ore-forming mechanism and physicochemical evolution of Gutaishan Au deposit, South China: Perspective from quartz geochemistry and fluid inclusions. Ore Geology Reviews, 119: 103382 DOI:10.1016/j.oregeorev.2020.103382
|
Flem B and Müller A. 2012. In situ analysis of trace elements in quartz using laser ablation inductively coupled plasma mass spectrometry. In: Götze J and Möckel R (eds.). Quartz: Deposits, Mineralogy and Analytics. Berlin, Heidelberg: Springer, 219-236
|
Geng Z and Wang YF. 2020. Automated design of a convolutional neural network with multi-scale filters for cost-efficient seismic data classification. Nature Communications, 11(1): 3311 DOI:10.1038/s41467-020-17123-6
|
Götte T, Pettke T, Ramseyer K, Koch-Müller M and Mullis J. 2011. Cathodoluminescence properties and trace element signature of hydrothermal quartz: A fingerprint of growth dynamics. American Mineralogist, 96(5-6): 802-813 DOI:10.2138/am.2011.3639
|
Götte T and Ramseyer K. 2012. Trace element characteristics, luminescence properties and real structure of quartz. In: Götze J and Möckel R (eds.). Quartz: Deposits, Mineralogy and Analytics. Berlin, Heidelberg: Springer, 265-285
|
Götze J. 2009. Chemistry, textures and physical properties of quartz: Geological interpretation and technical application. Mineralogical Magazine, 73(4): 645-671 DOI:10.1180/minmag.2009.073.4.645
|
Hsu CW, Chang CC and Lin CJ. 2003. A practical guide to support vector classification. Department of Computer Science and Information Engineering, Taiwan University, Taipei, China
|
Jacamon F and Larsen RB. 2009. Trace element evolution of quartz in the charnockitic Kleivan granite, SW-Norway: The Ge/Ti ratio of quartz as an index of igneous differentiation. Lithos, 107(3-4): 281-291 DOI:10.1016/j.lithos.2008.10.016
|
Kempe U, Götze J, Dombon E, Monecke T and Poutivtsev M. 2012. Quartz regeneration and its use as a repository of genetic information. In: Götze J and Möckel R (eds.). Quartz: Deposits, Mineralogy and Analytics. Berlin, Heidelberg: Springer, 331-355
|
Kohonen T. 1988. An introduction to neural computing. Neural Networks, 1(1): 3-16 DOI:10.1016/0893-6080(88)90020-2
|
Landtwing MR and Pettke T. 2005. Relationships between SEM-cathodoluminescence response and trace-element composition of hydrothermal vein quartz. American Mineralogist, 90(1): 122-131 DOI:10.2138/am.2005.1548
|
Larsen RB, Henderson I, Ihlen PM and Jacamon F. 2004. Distribution and petrogenetic behaviour of trace elements in granitic pegmatite quartz from South Norway. Contributions to Mineralogy and Petrology, 147(5): 615-628
|
Li JW, Hu RZ, Xiao JF, Zhuo YZ, Yan J and Oyebamiji A. 2020. Genesis of gold and antimony deposits in the Youjiang metallogenic province, SW China: Evidence from in situ oxygen isotopic and trace element compositions of quartz. Ore Geology Reviews, 116: 103257
|
O'Sullivan G, Chew D, Kenny G, Henrichs I and Mulligan D. 2020. The trace element composition of apatite and its application to detrital provenance studies. Earth-Science Reviews, 201: 103044
|
Ouyang YF, Liu JS, Zhou YG, Liu WM and Gao QZ. 2011. Discussion on some problems in study of Carlin-type gold deposits. Contributions to Geology and Mineral Resources Research, 26(2): 151-156 (in Chinese with English abstract)
|
Peterková T and Dolejš D. 2019. Magmatic-hydrothermal transition of Mo-W-mineralized granite-pegmatite-greisen system recorded by trace elements in quartz: Krupka district, Eastern Krušné hory/Erzgebirge. Chemical Geology, 523: 179-202
|
Qiu KF, Deng J, Yu HC, Wu MQ, Wang Y, Zhang L and Goldfarb R. 2021. Identifying hydrothermal quartz vein generations in the Taiyangshan porphyry Cu-Mo deposit (West Qinling, China) using cathodoluminescence, trace element geochemistry, and fluid inclusions. Ore Geology Reviews, 128: 103882
|
Rottier B and Casanova V. 2021. Trace element composition of quartz from porphyry systems: A tracer of the mineralizing fluid evolution. Mineralium Deposita, 56(5): 843-862
|
Rousseeuw PJ. 1987. Silhouettes: A graphical aid to the interpretation and validation of cluster analysis. Journal of Computational and Applied Mathematics, 20: 53-65
|
Rusk B. 2012. Cathodoluminescent textures and trace elements in hydrothermal quartz. In: Götze J and Möckel R (eds.). Quartz: Deposits, Mineralogy and Analytics. Berlin, Heidelberg: Springer, 307-329
|
Schrön W, Schmädicke E, Thomas R and Schmidt W. 1988. Geochemische untersuchungen an pegmatitquarzen. Zeitschrift Für Geologische Wissenschaften, 16(3): 229-244
|
Tanner D, Henley RW, Mavrogenes JA and Holden P. 2013. Combining in situ isotopic, trace element and textural analyses of quartz from four magmatic-hydrothermal ore deposits. Contributions to Mineralogy and Petrology, 166(4): 1119-1142
|
Wang Y, Qiu KF, Müller A, Hou ZL, Zhu ZH and Yu HC. 2021. Machine learning prediction of quartz forming-environments. Journal of Geophysical Research: Solid Earth, 126(8): e2021JB021925
|
Yan J, Mavrogenes JA, Liu S and Coulson IM. 2020. Fluid properties and origins of the Lannigou Carlin-type gold deposit, SW China: Evidence from SHRIMP oxygen isotopes and LA-ICP-MS trace element compositions of hydrothermal quartz. Journal of Geochemical Exploration, 215: 106546
|
Yu L, Porwal A, Holden EJ and Dentith MC. 2012. Towards automatic lithological classification from remote sensing data using support vector machines. Computers & Geosciences, 45: 229-239
|
Zhang L, Qiu KF, Hou ZL, Pirajno F, Shivute E and Cai YW. 2021. Fluid-rock reactions of the Triassic Taiyangshan porphyry Cu-Mo deposit (West Qinling, China) constrained by QEMSCAN and iron isotope. Ore Geology Reviews, 132: 104068
|
Zhang ML and Zhou ZH. 2007. ML-KNN: A lazy learning approach to multi-label learning. Pattern Recognition, 40(7): 2038-2048
|
Zhang Y, Cheng JM, Tian J, Pan J, Sun SQ, Zhang LJ, Zhang ST, Chu GB, Zhao YJ and Lai C. 2019. Texture and trace element geochemistry of quartz in skarn system: Perspective from Jiguanzui Cu-Au skarn deposit, eastern China. Ore Geology Reviews, 109: 535-544
|
Zhong RC, Deng Y, Li WB, Danyushevsky LV, Cracknell MJ, Belousov I, Chen YJ and Li LM. 2021a. Revealing the multi-stage ore-forming history of a mineral deposit using pyrite geochemistry and machine learning-based data interpretation. Ore Geology Reviews, 133: 104079
|
Zhong RC, Deng Y and Yu C. 2021b. Multi-layer perceptron-based tectonic discrimination of basaltic rocks and an application on the Paleoproterozoic Xiong'er volcanic province in the North China Craton. Computers & Geosciences, 149: 104717
|
Zhou YZ, Zhang LJ, Zhang AD and Wang J. 2018a. Big Data Mining & Machine Learning in Geoscience. Guangzhou: Sun Yat-Sen University Press (in Chinese)
|
Zhou YZ, Wang J, Zuo RG, Xiao F, Shen WJ and Wang SG. 2018b. Machine learning, deep learning and Python language in field of geology. Acta Petrologica Sinica, 34(11): 3173-3178 (in Chinese with English abstract)
|
Zhou ZH. 2016. Machine Learning. Beijing: Tsinghua University Press (in Chinese)
|
陈剑锋, 张辉. 2011. 石英晶格中微量元素组成对成岩成矿作用的示踪意义. 高校地质学报, 17(1): 125-135. |
陈小丹, 陈振宇, 程彦博, 叶会寿, 汪欢. 2011. 热液石英中微量元素特征及应用: 认识与进展. 地质论评, 57(5): 707-717. |
欧阳玉飞, 刘继顺, 周余国, 刘卫明, 高启芝. 2011. 卡林型金矿研究的若干问题探讨. 地质找矿论丛, 26(2): 151-156. |
周永章, 张良均, 张奥多, 王俊. 2018a. 地球科学大数据挖掘与机器学习. 广州: 中山大学出版社.
|
周永章, 王俊, 左仁广, 肖凡, 沈文杰, 王树功. 2018b. 地质领域机器学习、深度学习及实现语言. 岩石学报, 34(11): 3173-3178. |
周志华. 2016. 机器学习. 北京: 清华大学出版社.
|
 2022, Vol. 38


