2. 北京大学地球与空间科学学院, 北京 100871;
3. 南方海洋科学与工程广东省实验室(广州), 广州 511458
2. School of Earth and Space Sciences, Peking University, Beijing 100871, China;
3. Southern Marine Science and Engineering Guangdong Laboratory (Guangzhou), Guangzhou 511458, China
位于青藏高原东缘的鲜水河断裂带,是中国大陆内部地震活动性最强的大型左行走滑断裂带,自1700年以来鲜水河断裂带发生了5.0级以上地震50余次,其中7.0级以上地震8次,最大震级为1786年康定7.75级地震,距今最近的一次强震为2014年11月22日发生的康定Ms 5.9级地震(李大虎等, 2015)。近些年来附近大地震的频发,使鲜水河断裂带康定段的库伦应力明显增大(Shen et al., 2005; Wang et al., 2009, 2011),发生破坏性强震的概率增强,而康定段的分支断裂雅拉河断裂无历史强震记录,是其本身的特殊性而无强震的条件,还是临近孕震周期的表现,已成为人们关注的焦点,尤其是其深部应力和应变状态等相关的孕震环境是认识鲜水河康定段强震危险性的关键。
在印度板块与欧亚板块的碰撞挤压作用下,鲜水河断裂带表现出高应力累积的特征,是易发生大地震的高风险地区(Yi et al., 2005; Wen et al., 2008)。鲜水河断裂带晚第四纪至现今的走滑速率约为8.8~18mm/yr,平均~10mm/yr(Bai et al., 2018),这与现今GPS观测获得的8.8~17.9mm/yr的左行走滑速率一致(Zheng et al., 2017; Qiao and Zhou, 2021)。古地震研究显示鲜水河断裂带近300年就记录有9次7级以上的大地震,例如:西段玉树-甘孜断裂带上发生了2010年的玉树大地震(Ms 7.1),东段鲜水河断裂带上发生了2014年康定大地震(Ms 6.3)(李东雨等, 2017; Li et al., 2020)。有学者进一步指出道孚-康定段的应力聚集没有被完全释放,未来仍有诱发Ms 7.0地震的潜在风险(Yi et al., 2015)。因此,鲜水河断裂带具有较高发育大型地震(Ms≥7.0)的风险(李海兵等, 2021)。
目前为止,关于鲜水河断裂带的变形行为研究多聚焦于其地形地貌演化、活动速率检测,(Ji et al., 2020; Li et al., 2020; Qiao and Zhou, 2021),对于断层内部的变形机制、破裂行为、岩石物理学等的研究尚不足,然而断层内岩石学研究才能佐证地表监测的结果,并且对于探讨断裂带的发震机制具有重要意义。本论文拟从岩石物理学的研究入手,观察断层带内岩石的变形记录,分析其应力应变历史,计算其强度变化等,通过这些初步的研究试图厘清鲜水河断裂带的变形及破裂机制,为未来的地震预测提供第一手的岩石物性资料。
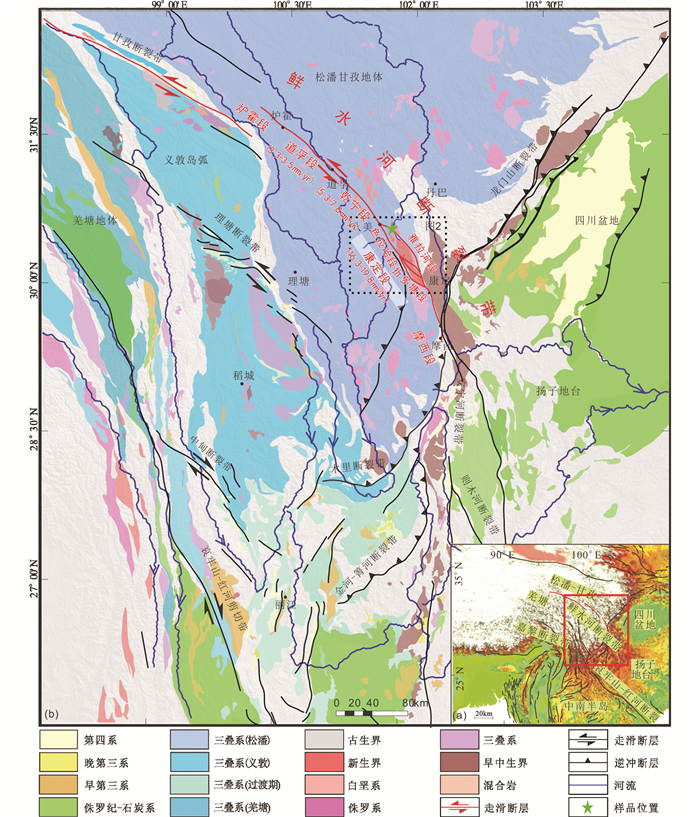
1 区域构造背景约350km长的鲜水河断裂带是青藏高原向东南逃逸的东边界,也是东缘左行走滑断裂带中最活跃的断层(Tapponnier et al., 1986, 1990; Wen et al., 1989)(图 1)。该断裂带位于巴颜喀拉地体和雅江褶皱造山带之间,是两个次级构造单元的构造边界(Ji et al., 2020),根据其几何结构特征可分为三部分(图 1):西北段由炉霍段、道孚段和乾宁段三条次级断层呈左阶羽列排列而成,几何结构较为单一(梁明剑等, 2020);惠远寺以南,分裂成三条次级断裂,即长约31km的雅拉河断裂、80km的色拉哈断裂、30km的折多塘断裂,此三条断裂组成康定段。最近在色拉哈断裂和折多塘断裂之间发现了长约24km的木格措南断裂(潘家伟等, 2020);康定以南呈单一S状几何结构延伸的摩西段(梁明剑等, 2020)(图 1、图 2)。
|
图 1 鲜水河断裂带及邻区构造简图(据Zhang et al., 2017修改) (a)青藏高原中部、东部地形和活动断层区域构造图,红色正方形区域见图b;(b)青藏高原东南部地形和活动断层区域构造图,加粗黑线为活动断层,蓝色实线为河流 Fig. 1 The structural frames along the Xianshuihe fault zone and adjacent region (modified after Zhang et al., 2017) (a) the topography and active fault area structure map of the central and eastern Tibet Plateau, the red square area is shown in Fig. 1b; (b) the topography and active fault area structure map of the SE Tibet Plateau, the bold black line is the active fault, the blue solid line is the river |

|
图 2 鲜水河断裂带雅拉河段断裂几何与运动学(据Zhang et al., 2017修改) Fig. 2 Geometry and kinematic along the Yalahe segment of the Xianshuihe fault zone (modified after Zhang et al., 2017) |
研究显示鲜水河断裂带每一分段的岩性及构造特征具有明显差异,这可能暗示了不同岩性段具有不同的变形行为和变形机制(Zheng et al., 2017; Qiao and Zhou, 2021),具体体现为鲜水河断裂带不同分段其构造加载速率、闭锁深度具有差异(Qiao and Zhou, 2021)。据InSAR观测数据研究显示,鲜水河断裂带构造加载速率约为8.8~17.9mm/yr,不同段闭锁深度范围为7.6~18.5km;其中道孚段浅部非震滑移速率为3.3~3.5mm/yr;乾宁段浅部非震滑移速率为5.3~7.8mm/yr,康定西部浅部非震滑移速率为16.3~19.8mm/yr。康定西段具有如此高的速率可能与2014康定Ms 5.6和Ms 5.9震后释放有关(Qiao and Zhou, 2021)。
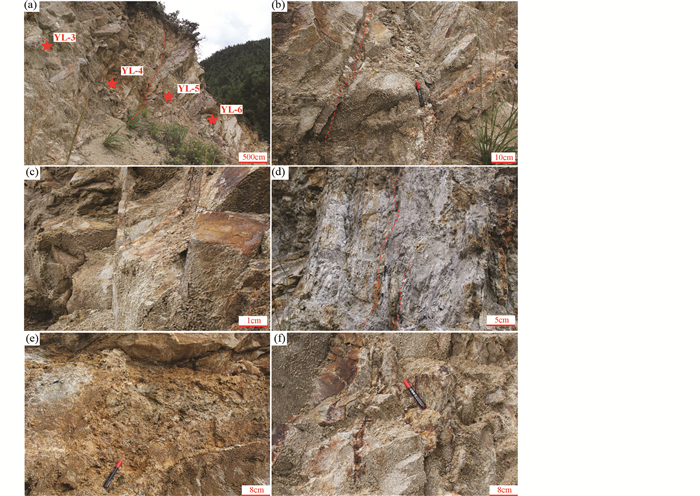
与鲜水河断裂带北段相比,雅拉河段明显不同之处在于出露以韧性剪切变形为主的糜棱岩(图 3),宽约几百米至1~2km(Li and Zhang, 2013),野外露头可见韧性变形S-C组构及脆性破裂(图 3)。在鲜水河断裂带康定岩体段雅拉河断层的糜棱岩的面理走向为北西向,与鲜水河主断裂带的走向一致,因此推断其为鲜水河断裂带深部活动的产物,而后在鲜水河断裂带持续的活动及抬升过程中被剥露至地表,因此其可能记录了鲜水河断裂带演化的全过程。野外的露头观察显示这些糜棱岩面理发育,且顺着糜棱面理发育一系列的微破裂,被绿泥石或者细石英脉充填(图 3),这些岩石学证据显示其经历了韧性变形、脆韧性变形及晚期脆性破裂的叠加变形。本次研究的样品采集于这条花岗质糜棱岩带上,且据糜棱岩的变形程度差异,依次采集了9个样品(图 1、图 2)。
|
图 3 雅拉河断裂带糜棱岩露头构造特征及采样位置(YL-3~YL-6) (a)雅拉河段花岗质糜棱岩出露,可见走滑断层,图中星号为样品采集点;(b)雅拉河走滑断裂发育,同时可见石英脉体顺层发育;(c)花岗质糜棱岩发育S-C组构;(d)花岗质糜棱岩发育S-C组构,其中黑云母具定向性;(e)石英脉顺层发育,局部发育褶皱,具有细粒化现象;(f)石英脉受变形褶皱弯曲,具有S-C组构变形特征 Fig. 3 Features of granitic mylonite outcrops in the Yalahe fault and sampling locations of (YL-3~YL-6) (a) mylonite is exposed in the Yalahe section, and strike-slip faults can be seen. The asterisks in the figure are the sample collection points; (b) strike-slip faults in the Yalahe are developed, and quartz veins are developed along the bed; (c) S-C fabrics are developed in granitic mylonites; (d) S-C fabrics are developed in granitic mylonites, in which biotite is oriented; (e) quartz veins developed along the bed, folds developed locally, with grain-size reduction phenomenon; (f) quartz veins were bent by deformed folds, showing S-C fabric characteristics |
为了探究鲜水河断裂带康定雅拉河段发震机制,本研究在雅拉河分支断层的糜棱岩带采集了9块定向样品,并开展进一步的显微构造研究。主要通过扫描电镜(SEM;scanning electron microscope)、电子背散射衍射技术(EBSD;electron backscattered diffraction)、电子探针(EPMA;Electron Probe Micro-Analysis)等实验方法展开。
2.1 定向薄片采集、显微镜及SEM观察为了观察到最大应变椭球面,获得更为精确的形变信息,我们在精细测量糜棱面理及线理的基础上采集了定向样品,平行于线理垂直于面理切制定向薄片,进行微观分析。在显微镜观察基础上,选取特定的区域开展扫描电子显微镜(SEM)分析,SEM实验开展于中国地质科学院地质研究所,仪器为场发射扫描电镜(FEI VERSA 3D),加速电压15kV,电镜工作距离10mm,工作电流4.5nA。
2.2 石英组构及矿物颗粒特征的EBSD分析EBSD即电子背散射衍射技术,可通过电子显微镜扫描获取矿物的晶体学信息(Zaefferer, 2004)。为了获得更精确的矿物组构信息,在EBSD实验前需要对样品表面进行金刚砂抛光,然后在连续的25nm、10nm、5nm二氧化硅胶体(pH 9.8)悬浮液中进行30~45分钟的化学机械抛光,以消除矿物颗粒表面的机械损伤及制片导致的超微形变。
样品YL-4和YL-5于中国地质科学院地质研究所进行实验,EBSD测试探头为牛津仪器的Nordlys Max2商业相机,工作加速电压为20KeV,电子束流为1.1nA,样品倾角70°,工作距离3.2mm,步长为5μm。样品YL-6的EBSD扫描于牛津仪器(北京)实验室完成,实验室配备高速(1244×1024像素)CMOS数字相机,最新symmetry S2探头,加速电压为20kV,电子束流为1.1nA,工作距离为2.8mm,测试步长为1.5μm。EBSD实验数据的处理软件为牛津仪器配备的全自动解译软件Aztec及HKL CHANNEL5,利用这些软件可以开展降噪、极密、粒度统计等初步分析。
EBSD数据处理和分析,应用MATLAB中的MTEX工具箱,开展了颗粒识别、粒度统计、晶粒取向分布(GOS;grains orientation spread)观察、矿物结晶优选方位(CPO; crystal preferred orientation)及取向差计算、方位分布函数(ODF;orientation distribution function)(10°高斯半直径宽计算)等数据处理,同时CPO强度采用M指数表征(Skemer et al., 2005)。重结晶颗粒的标准是相邻颗粒晶体的取向差大于10°,重结晶颗粒的粒径计算采用了(Cross et al., 2017)提供的算法,可对重结晶颗粒及母颗粒通过颗粒取向分布加以区分。为了避免同一大颗粒进行多次统计对极密权重的影响,统计方法为单颗粒单点。具体选区见电子版附件一。
附件一 薄片实验区域选区
1.YL-4-1实验域选区
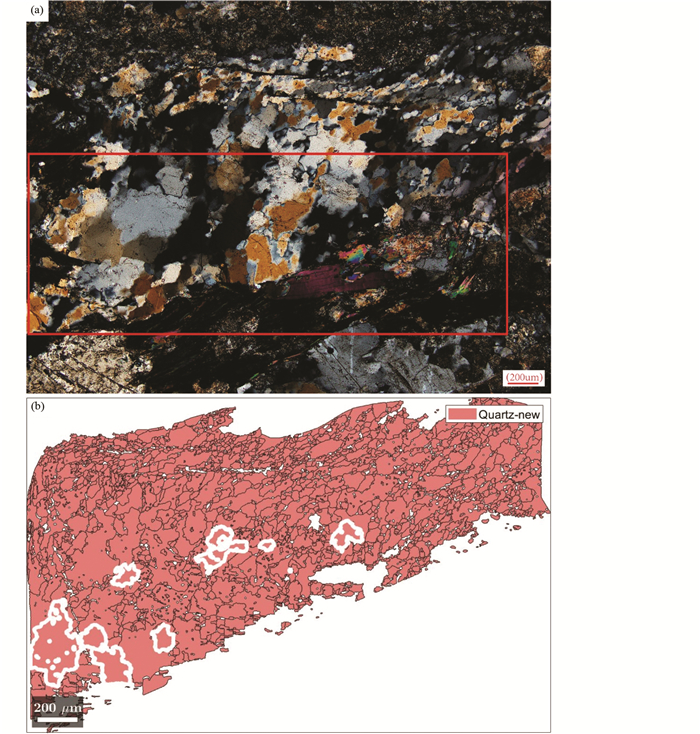
|
图 1 YL-4-1显微构造及YL-4-1 Ti浓度颗粒 |
2.YL-4-2、YL-4-3、YL-4-4实验选区
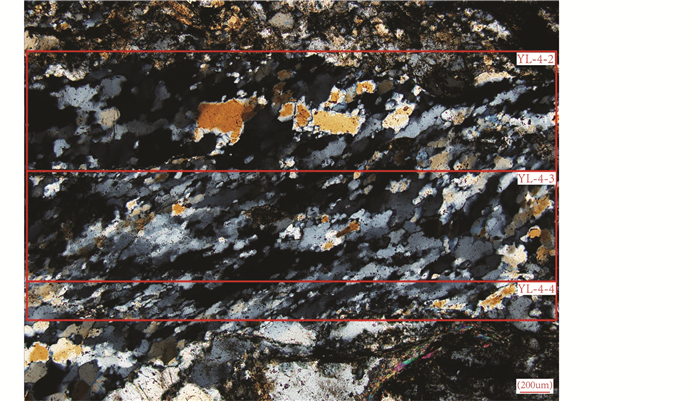
|
图 2 YL-4-2、YL-4-3、YL-4-4显微构造 |
3.YL-5实验选区

|
图 3 YL-5显微构造 |
4.YL-6实验选区
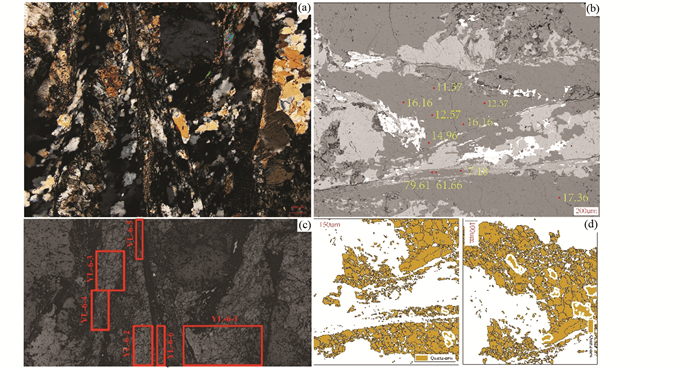
|
图 4 YL-6实验区域 (a)薄片光学显微镜显微构造图;(b)EPMA实验区域图;(c)EBSD实验子区域图;(d)EPMA实验Ti浓度对应矿物颗粒图 |
电子探针分析仪EPMA(Electron Probe Micro Analyzer)实验于西北大学(西安)地质学系完成,仪器为日本电子(JEOL)生产的JXA-8230,测试电压为15keV,高电子束200nA,电子束直径为10μm,标样石英为Andreas Audetat(Bayerisches地质研究所)(Audétat et al., 2015)提供。具体实验结果见电子版附件二。
附件二 Ti浓度及不同温度计计算所得温度
|
|
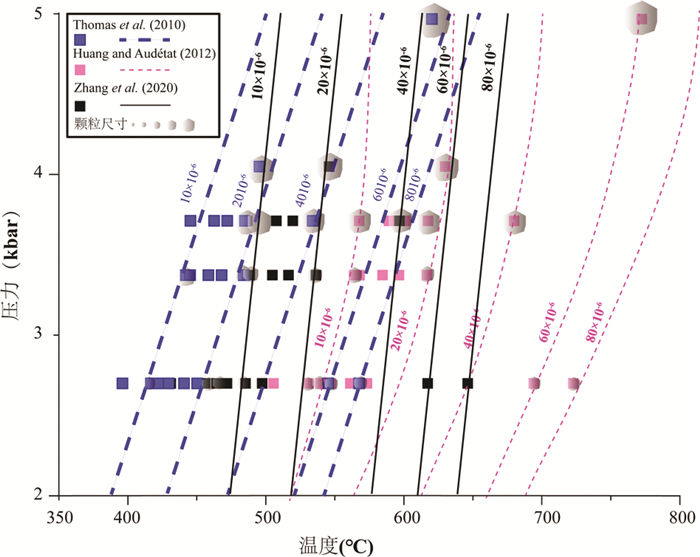
石英的Ti温度计是通过测定Ti饱和体系下石英中Ti的浓度,来计算石英变形时的温度条件。Ti元素在石英中的浓度和扩散速度,与石英的结晶或者变形温度具有很好相关性,所以早期学者通过观测石英中Ti的浓度,构建了温度与石英中Ti浓度的关系(Wark and Watson, 2006)。由于压力的升高,会导致石英中Ti含量系统性地降低,新的研究经实验矫正了石英Ti温度计中Ti含量与压力的关系(Thomas et al., 2010; Huang and Audétat, 2012; Zhang et al., 2020)。为了对比三种温度计的差异,本文将采用此三种公式(1)、(2)、(3)依次对实验所得Ti浓度进行温度计算,结果见附件二:

|
(1) |
(实验于5~20kbar,700~940℃展开,XquartzTiO2-Ti在石英中的浓度(×10-6),R大气常数8.3145J/K,T温度(K),P压力(kbar),aTiO2为TiO2活度(Thomas et al., 2010))

|
(2) |
(实验于TiO2活度=1,1~10kbar,600~800℃展开,Ti为Ti在石英中的浓度(×10-6),T温度(K),P压力(kbar)(Huang and Audétat, 2012))

|
(3) |
(实验于TiO2活度=1,0.5~4kbar,700~900℃的温压条件下展开,CTiQtzTi在石英中的浓度(×10-6),T温度(K),P压力(kbar)(Zhang et al., 2020))。
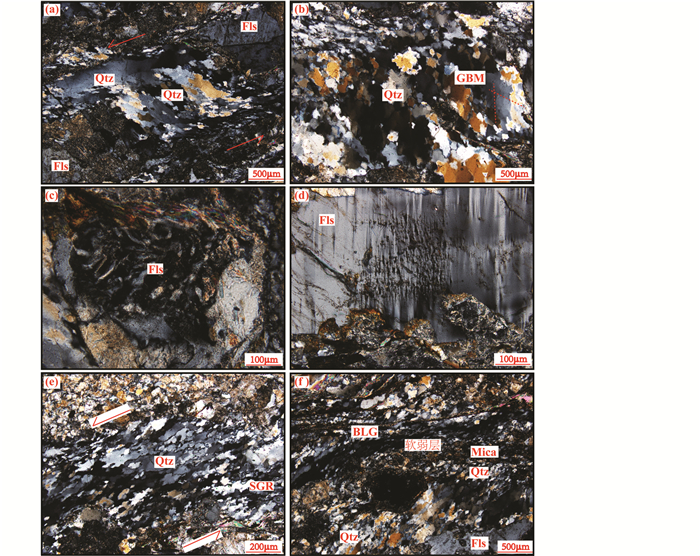
3 糜棱岩的显微构造特征及实验分析结果为了探究鲜水河断裂带康定雅拉河段的变形机制及变形过程,定量化糜棱岩的变形行为,本文重点选取了样品YL-4、YL-5、YL-6开展显微镜观察描述和EBSD组构分析、EPMA元素含量测定等精细研究。显微镜下观察发现糜棱岩样品中的主要矿物成分为石英、斜长石、钾长石、黑云母及少量的白云母,副矿物可见金红石、锆石、绿泥石、磁铁矿等,具体薄片中各种矿物所占的比例有所差异(图 4)。由于其经历了同样的变形过程,因此其显微形变结构具有诸多相似性,具体表现为石英集合体中部颗粒比较大(以GBM为主要机制),向集合体外部面理发育的地方,颗粒大小逐渐减小,定向性增强(变形机制发生转变,发育以SGR、BLG为主要机制变形)(图 4)。
|
图 4 雅拉河断裂带糜棱岩(样品YL-4、YL-5、YL-6)显微构造特征 (a) YL-5样品具有不同粒径的石英条带,上部粒径最大可达1~1.2mm,向下逐步减小;(b) YL-6样品中具有不同粒径石英集合体,中部石英颗粒较大,可达0.5~0.6mm,上部发育应变局部化,粒径大大降低形成细粒化,同时在细粒化过程中晶体定向性发生改变,应力失稳,形成微破裂. 在右侧大颗粒内部发育高温棋盘状亚颗粒消光,红色十字线分别代表柱面和底面滑移系;(c) YL-4样品中长石发育位错蠕变控制的蠕英结构;(d) YL-4样品中长石内部发育由位错蠕变引起的机械双晶;(e) YL-4样品石英颗粒中部粒径较大,可达0.3mm,向两侧递减,发育SGR典型的拉长定向. 长石多为旋转碎斑,在残斑内部可见微破裂,边部发育长石和石英混杂体;(f) YL-6样品中应变局部化作用显著,石英条带以细粒化作用为主,且有云母条带穿插其中. Qtz-石英;Fls-长石;Mica-云母;BLG-膨凸重结晶;SGR-亚颗粒旋转重结晶;GBM-颗粒边界迁移重结晶 Fig. 4 Microstructure characteristics of the Yalahe fault mylonites (samples YL-4, YL-5, YL-6) (a) sample YL-5 has quartz bands with different grain sizes, the biggest grain size can be up to 1~1.2mm, and gradually decreases downward; (b) sample YL-6 has different grain size quartz aggregates, the middle part of the quartz grains is larger, up to 0.5~0.6mm, the upper part develops strain localization, the grain size is greatly reduced to form fine grains, and the crystal orientation changes during the grain size reduction process, and the stress is unstable, lead to the formation of micro-cracks. Inside the large grains on the right, there is a high-temperature chessboard-shaped sub-grain extinction, and the red crosses represent the prism and basal slip systems respectively; (c) sample YL-4 feldspar develops a creeping structure controlled by dislocation creep; (d) sample YL-4 feldspar develops mechanical twins caused by dislocation creep; (e) the middle part of the quartz grains in the sample YL-4 has a larger grain size, up to 0.3mm, decreasing to both sides, developing the typical elongated orientation of SGR. Most of the feldspars are rotating fragments, and micro-cracks can be seen inside the porphyroclasts, and there are mixed feldspar and quartz on the edges; (f) sample YL-6 strain localization is significant, and the quartz bands are mainly caused by grain size reduction, and there are mica bands interspersed in it. Qtz-quartz; Fls-feldspar; BLG-bulging recrystallization; SGR- sub-grain rotation recrystallization; GBM- grain boundary migration recrystallization |
糜棱岩的显微构造现象可以反映其经历的变形机制,也能反推岩石变形的温压条件(Passchier and Trouw, 2005)。本文选取的三个薄片的共同特点是石英集合体的中部为大颗粒具有波状消光的石英,向外直至破裂面逐渐细粒化为<10μm的细小石英颗粒(图 4a)。详见以下四类变形机制显微构造现象。
在石英集合体的中部,大颗粒石英的整体定向性不强,且粒径较大,可达0.2~0.3mm,颗粒内部可见由位错蠕变导致的波状消光,其颗粒边界多呈叶片状及港湾状(图 4b),证明大颗粒石英的主要变形机制为GBM(Stipp et al., 2002)。变形机制为颗粒边界迁移(GBM)重结晶高温韧性变形,主要发生在500~700℃的变形温度范围内(Passchier and Trouw, 2005)。偶见棋盘状亚颗粒消光(图 4b),这预示着柱面滑移系及底面滑移系共同活化形成的亚晶界(Passchier and Trouw, 2005; Wallis et al., 2019b),指示了近700℃的高温形变。长石在样品YL-4中多以大块旋转残斑出现,并且在残斑内部可见长石位错蠕变形成的蠕英构造(Simpson, 1985)(图 4c, d),这也指示了相对高温的变形(Passchier and Trouw, 2005)。
在大颗粒石英的外围发育明显的变形定向性,石英发育定向拉长的集合体,长轴与面理呈小角度相交,这很好地指示了剪切方向,同时粒径降低至10~30μm(图 4e)。在亚颗粒旋转(SGR)变形机制下,石英受拉长定向控制,具有多边形化,亚颗粒边界逐渐形成,同时石英条带边部两侧的长石不再以高温韧性变形为主,而是表现为早期韧性变形形成的重结晶长石颗粒与细粒石英的混合(图 4a, b),并且在大颗粒长石内部可见微破裂,同样指示变形温度的降低(图 4d)(Passchier and Trouw, 2005)。石英的SGR机制主要发生在400~500℃的温度范围内(Passchier and Trouw, 2005),由GBM变形机制向SGR变形机制转变,预示了随着形变的持续变形温度的降低,及可能伴随的折返。
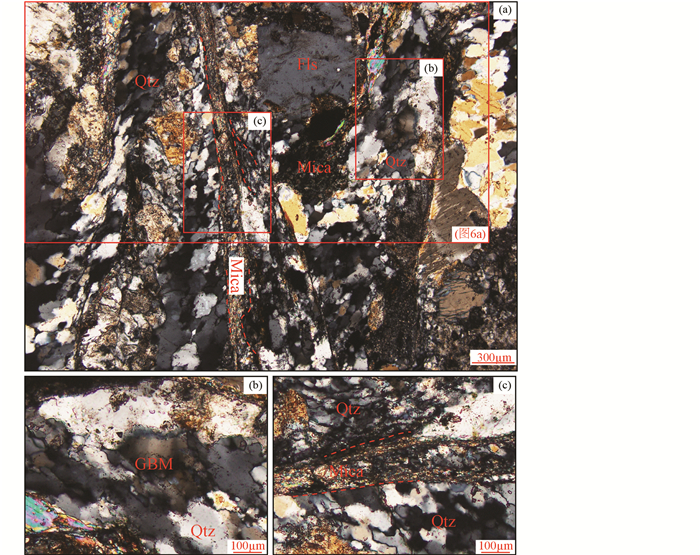
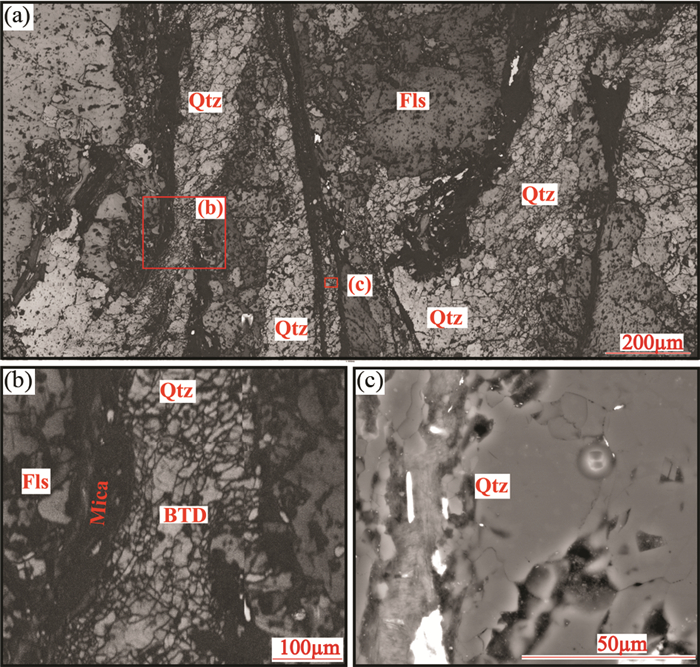
在定向性强的石英颗粒外围,发育有新生的细小石英颗粒带(图 4f、图 5)。通过进一步的SEM观察发现此类颗粒是由大颗粒经韧性变形边部凸出发育形成的,因此判定其变形机制为膨凸重结晶作用(图 6a)(Passchier and Trouw, 2005)。大规模膨凸重结晶(BLG)的发育代表350±50℃的变形温度(Passchier and Trouw, 2005),这个过程使得矿物颗粒粒径大大减小,应变局部化发生在细颗粒的集合体内(图 6b)(Xia and Platt, 2018)。由于粒径的减小,在应变局部化部位或微破裂部位,易形成细粒化条带,导致岩体强度大大降低,形成细粒流薄弱条带(图 5、图 6c)(刘俊来, 2017)。
|
图 5 雅拉河断裂带糜棱岩(样品YL-6)显微构造特征 (a) YL-6样品脆性及韧性变形区域显微构造特征;(b)具有叶状边缘的GBM变形及拉长定性的SGR变形的韧性变形区域;(c)石英重结晶颗粒发育高度细粒化及应变局部化,云母条带层状硅酸盐作为软弱层,内部因地壳抬升至浅部发育脆性破裂,进一步高倍镜下特征见图 6b, c. 红色虚线为云母条带边部脆性微破裂 Fig. 5 Microstructure characteristics of the Yalahe fault mylonite (Sample YL-6) (a) Sample YL-6 contains the microstructure characteristics of brittle and ductile deformation regions; (b) GBM with leaf-shaped edges and ductile deformation regions of elongated qualitative SGR deformation; (c) quartz recrystallized grains have developed highly fine-grained. Mica ribbon layered silicate serves as a deformed and weak layer, the interior microfractures due to the uplift of the crust to the shallow part. Further high-magnification features are shown in Fig. 6b, c. The red dotted line is the brittle micro-crack at the edge of the mica ribbon |
|
图 6 雅拉河断裂带糜棱岩(样品YL-6)的显微构造特征(SE二次电子成像) (a) YL-6样品薄片整体显微构造,以发育大规模S-C组构为主,且石英粒径差异较大,发育碎裂岩及动态重结晶细粒化作用,云母呈条带状分布;(b)为图a局部放大,石英条带以中部发育细粒化,两侧以大颗粒高温韧性变形为特征,反映深部脆韧性转化过程;(c)应变局部化引起的细粒化程度较高,细粒化条带开始失稳,反映地壳抬升至浅层次形成脆性破裂. BTD-脆韧性转化 Fig. 6 Microstructure characteristics (secondary electron, SE imaging) of Yalahe fault mylonite (Sample YL-6) (a) the overall microstructure of Sample YL-6 thin slices is dominated by the development of large-scale SC fabrics, with large differences in quartz particle size, development of cataclastic rocks and dynamic recrystallization and fine-graining, and mica is distributed in bands; (b) Fig. 6a is partially enlarged. Quartz ribbons are characterized by fine-grained development in the middle, and large grains on both sides are characterized by high-temperature ductile deformation, reflecting the deep brittle-ductile transformation process; (c) the degree of fine-graining caused by strain localization is relatively high, and the fine-grained quartz ribbons begin to develop fractures, reflecting that the crustal uplifted to shallow layers to form brittle fractures. BTD-brittle-ductile transformation |
YL-6内部应变局部化导致石英残斑发育剪切带及S-C组构(Papeschi and Musumeci, 2019)(图 4f、图 6),同时剪切带中层状硅酸岩带方向平行于糜棱岩面理(图 4f),形成软弱网络,作为断层和剪切破裂的雏形(Papeschi and Musumeci, 2019),有助于脆性破裂沿此发育。故在此薄片中记录了从深部韧性变形向浅部脆性变形,发育脆韧性转化结构,记录了岩石所受不同深度的温压条件及差应力大小,可据此估算地壳强度(Behr and Platt, 2011, 2014)。
根据以上四类显微构造特征观察,我们推断康定段糜棱岩早期发育韧性变形、后经抬升过程中,依次经历了脆韧性转化及脆性破裂事件(图 4、图 5、图 6),而这些显微结构记录了康定段雅拉河断层岩从深部至浅部的变形全过程。从整体上看我们认为康定雅拉河糜棱岩变形主要受位错蠕变控制,随着变形温度的降低,形成石英颗粒的细粒化带,导致应变局部化引起破裂发生。
3.2 石英组构分析显微构造观察发现样品YL-4、YL-5及YL-6均发育三类不同变形机制的显微构造:大颗粒核部以高温GBM韧性变形为主;中颗粒幔部以中温SGR韧性变形为主;小颗粒边部以BLG低温变形为主的形变特征。同时显微破裂多发生在细颗粒石英域,这反映了糜棱岩经历了韧性变形、脆韧性转换变形以及脆性变形的多阶段变形的叠加,也即样品从深部抬升至浅部的持续变形过程。为了探讨断层带深部和浅部的变形机制差异,我们选取三个薄片内数个显示不同变形机制的石英集合体开展组构学分析,EBSD分析区域见图 4a, b, f。EBSD数据的处理及描述将选取不同石英颗粒粒径大小的区域,具体选区见附件一。
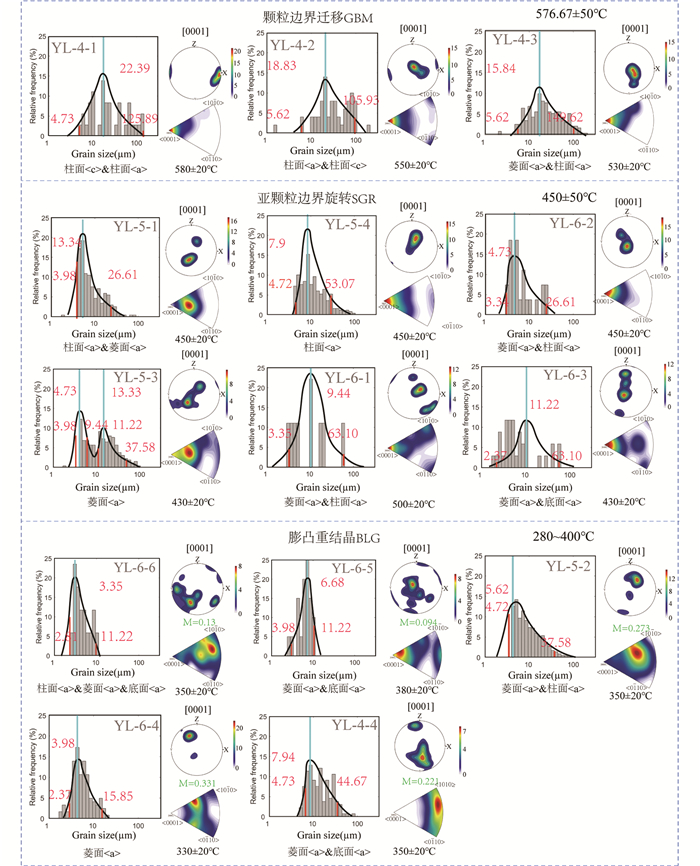
经EBSD面分析实验后,进一步通过MatLab中mtex工具箱(Cross et al., 2017)筛选出实验区域内所有重结晶颗粒。由于在动态重结晶过程中,不仅滑移系会发生变化,粒径会发生更为显著的变化(Behr and Platt, 2011, 2014; Xia and Platt, 2018)。为了更加精确的区分出不同动态重结晶机制的颗粒,根据粒径分类可以清晰分别出不同变形机制的矿物颗粒。根据实验结果(图 7)可见:YL-4粒径范围4.73~ 149.62μm,具有多种滑移系,包括柱面<a>({m}<0001>),柱面<c>({m}<110>),菱面<a>混底面<a>;YL-5粒径范围3.98~53.07μm,主要以菱面<a>({r}<012>)为主;YL-6粒径范围2.372~63.10μm,发育柱面<a>({m}<0001>),菱面<a>及底面<a>({z}<0001>)滑移系。根据以上结果对所有子区域进一步按照不同机制对应的粒径进行分类,以开展不同粒径CPO滑移系所反映的变形机制及变形环境的讨论(图 7)。
|
图 7 雅拉河断裂带花岗糜棱岩样品中动态重结晶石英颗粒粒径和CPO特征(样品YL-4、YL-5、YL-6) 极图为下半球投影,以c轴[0001]为投影轴展开分析;反极图投影晶轴为<0001>、<010>、<100> Fig. 7 Dynamical recrystallized grain size distributions and CPO patterns for the Yalahe fault mylonites (samples YL-4, YL-5, YL-6) The pole Fig. is showed by lower hemisphere projection, and the c-axis [0001] is used as the projection axis to display the analysis; the inverse pole Fig. projection crystal axis is <0001>, <010>, <100> |
在动态重结晶颗粒中,GBM重结晶颗粒粒径较大(Hirth and Tullis, 1992; Stipp et al., 2002; Kilian et al., 2011)。针对微区选定的所有石英大颗粒(GBM)区域进行了颗粒粒径大小分布图、极图和反极图对比分析(图 7、电子版附件三)发现:粒径范围为15.84~22.39μm;晶体内部变形的CPO极图及反极图具有柱面<c>混柱面<a>({m}<0001>)的滑移系,且以柱面<a>为主。综合对比三个区域的动态重结晶石英粒径及CPO极图模式及反极图发现,随粒径减小,CPO模式揭示滑移系从柱面<c>过渡至柱面<a>,甚至开始具有向菱面的过渡趋势(图 7),与石英的显微结构及变形机制的观察相一致(图 4、图 7)。据以上信息可知,以GBM变形机制为主的康定糜棱岩,在变形过程中粒径范围为15.84~22.39μm,发育以柱面<a>({m}<0001>)为主的滑移系,确定此机制变形温度范围为550℃~570±50℃(Hirth and Tullis, 1992; Stipp et al., 2002; Passchier and Trouw, 2005; Langille et al., 2010; Law, 2014)。
附件三 粒径大小及温压环境数据
|
|
样品YL-4石英颗粒显示出拉长定向,形成显著的形态优选定向(SPO),粒径范围为4.73~13.34μm(图 4e);由于矿物在变形过程中可能受多种变形机制控制或影响(Hirth and Tullis, 1992; Stipp et al., 2002),在极图及反极图中表现为既继承了GBM的柱面<a>({m}<0001>)CPO,又使SGR典型的菱面<a>({r}<012>)滑移系活化(Passchier and Trouw, 2005),表现为柱面<a>({m}<0001>)混菱面a({r}<012>)的特征,所以SGR在变形过程中可能残存了GBM的母晶晶体学信息,据以上可知变形机制为SGR的康定段糜棱岩粒径整体减小,大于100μm的颗粒不再出现。CPO极图及反极图具有柱面<a>({m}<0001>)与菱面<a>({r}<012>)的特征,据此估算康定段糜棱岩的韧性变形温度为450±50℃,以SGR重结晶为主。
3.2.3 BLG石英区域的EBSD数据分析结果在样品YL-6中,石英细粒化显著,细粒石英域的主要变形机制表现为BLG(图 4f)。石英域的石英粒径分布小于10μm,集中在3.35~7.94μm的范围。极图及反极图特征显示多滑移系共存,主要为菱面<a>({r}<012>)滑移和底面<a>({z}<0001>滑移。局部区域的细粒石英颗粒CPO模式表现较为离散(YL-6-5、YL-6-6),与发生SGR和GBM重结晶的石英颗粒组构强度相比较而言,显著降低(图 7),这可能是由于颗粒较细小,导致颗粒边界滑移机制的启动(Rutter, 1995)上述显微构造和CPO特征指示康定段糜棱岩发育细粒化温度为280~400℃(Hirth and Tullis, 1992; Stipp et al., 2002; Passchier and Trouw, 2005; Langille et al., 2010; Law, 2014)。
根据EBSD分析三类不同粒径大小、SPO分布特征及对应的变形机制石英集合体,通过粒径分布方式、极图与反极图投图,可知在石英的变形过程中,随着温度的降低(576.67±50℃降至280~400℃),石英颗粒的粒径在逐渐减小(15.84~22.39μm降至3.35~7.94μm),石英位错蠕变的重结晶机制也随之发生了转变(GBM-SGR-BLG)。这一现象与糜棱岩温度的降低与地壳抬升有关,其粒径大小及CPO极密受变形温压条件的控制,也即变形的环境控制石英的变形机制,我们的观察结果显示其发生系统性的改变(图 7)。因此,我们推断说明康定雅拉河段糜棱岩抬升过程中,随着变形温度的降低,变形机制也发生了转变,导致石英颗粒细粒化,进而发生应变局部化(Xia and Platt, 2018),在应变集中的细粒化颗粒域为中部地壳快速摩擦滑移与高应力释放提供了依据(刘俊来, 2017),可能进一步引发微地震在康定雅拉河段的发生。
3.3 石英Ti温度计的分析结果石英Ti温度计可定量化确定岩石韧性变形过程中的变形温度,精度可达±5℃(Wark and Watson, 2006),EPMA可用来测量石英中Ti的含量(Zhang et al., 2020),这大大拓宽了石英Ti温度计的应用范围。石英中Ti的浓度不仅受控于温度,TiO2的活度(αTiO2)对温度计算结果也起到制约作用,因样品中金红石的出现,表明Ti元素已达到饱和,此时αTiO2近似为1(Kidder et al., 2012)。此外,随着压力的升高,石英中Ti的含量会系统性降低(Wark and Watson, 2006),所以使用石英Ti温度计需要对糜棱岩所处的压力进行估算。岩石圈中地温梯度、物质组成等在空间和时间上具有复杂多样性,然而系统的研究显示岩石圈中的地压梯度近似为静岩压力(胡宝群等, 2003),因此当上地壳密度为2700kg/m3,假设变形发生在地壳10~20km深处,地压力约为2.7~5.5kbar。
经过系统的测试得出样品YL-4中石英Ti浓度从10.19×10⁻⁶~56.94×10⁻⁶不等(图 8、附件二),根据公式(Zhang et al., 2020),估算温度范围为455.90~658.53℃。大量发育细粒化的YL-6样品,其Ti浓度含量从11.37×10⁻⁶~16.16×10⁻⁶(图 8),变形温度范围为464.06~646.14℃,误差范围为20℃。

|
图 8 雅拉河断裂带糜棱岩GBM重结晶石英颗粒原位Ti浓度分析 (a) YL-4样品Ti浓度分布(×10-6);(b) YL-6样品Ti浓度分布(×10-6). RT-金红石 Fig. 8 Ti concentration distribution of grain boundary migration recrystallization quartz from mylonite in the Yalahe fault of EPMA experiment (a) Ti concentration distribution of Sample YL-4 (×10-6); (b) Ti concentration distribution of Sample YL-6 (×10-6). Rt-rutile |
前人的研究显示发育GBM变形的石英颗粒才能采用石英Ti温度计计算变形温度(Law, 2014)。本研究通过精细的石英颗粒大小统计和对应的石英中Ti元素的含量发现(附件二):我们测试的颗粒粒径约在45~437μm之间,对应的Ti的含量17×10-6~56×10-6,整体上呈近似正相关性。为了对比不同温度计的差异,我们对三种Ti温度计进行投图(图 9),最终估算GBM的变形温度在520~620℃之间,与滑移系及CPO估算的变形温度相近。据前人获得康定地区地温梯度约~30℃/km(Zhang et al., 2017),因此最终确定康定段花岗质糜棱岩高温GBM变形深度为18~22km。
|
图 9 雅拉河断裂带糜棱岩(样品YL-4、YL-6)温度-压力-Ti浓度-粒径统计(据Thomas et al., 2010; Huang and Audétat, 2012; Zhang et al., 2020) Fig. 9 Statistics of temperature-pressure-Ti concentration-grain size of mylonite (samples YL-4 and YL-6) from Yalahe fault (after Thomas et al., 2010; Huang and Audétat, 2012; Zhang et al., 2020) |
石英在变形过程差应力和新生石英粒径具有负相关性,据此提出了石英重结晶颗粒尺寸压力计(Luton and Sellars, 1969)。在过去十多年的研究当中,学者们通过EBSD实验测量的重结晶粒径来定量化计算古应力大小(Twiss, 1977; Stipp and Tullis, 2003; Stipp et al., 2006; Shimizu, 2008; Holyoke and Kronenberg, 2010; Cross et al., 2017)。但是该压力计仅适用于位错蠕变导致的细粒化的石英颗粒的差应力计算,即稳态变形过程中的动态重结晶颗粒的计算(Cross et al., 2017)。本文采用的计算的公式为(Cross et al., 2017)(公式4):

|
(4) |
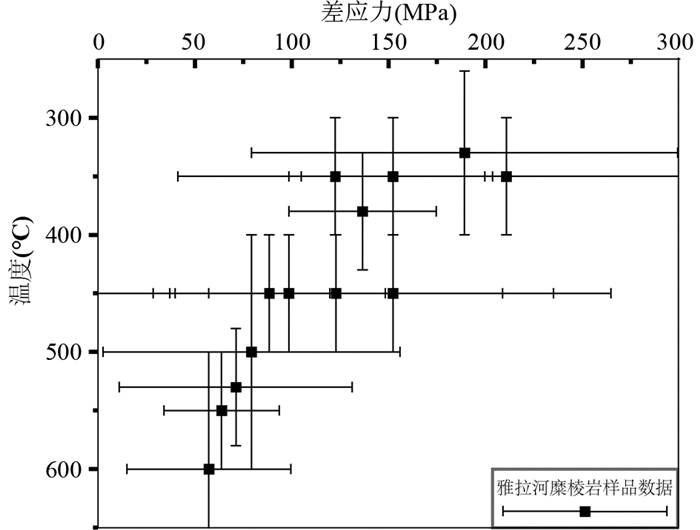
石英的粒径为EBSD数据处理后得到的粒径,本文分别统计了选区内的最大粒径、最小粒径和峰值粒径,其中峰值粒径计算的差应力为中心值,最大最小粒径为误差(图 7)。值得注意的是,当粒径<10μm时,细密颗粒常发生颗粒边界滑移(Rutter, 1995),这一作用可能导致计算的古应力误差较大。数据显示石英大颗粒区域(GBM)的石英颗粒粒径的峰值在15.84~22.39μm的范围内,对应的峰值差应力在63.82~79.34MPa之间,中颗粒区域(SGR)的石英颗粒粒径的峰值在3.35~7.94μm的范围内,对应的峰值差应力在88.40~169.69MPa之间,小颗粒区域(BLG)的石英颗粒粒径的峰值在3.35~7.94μm的范围内,对应的峰值差应力在122.51~210.80MPa(平均值为166.66MPa)之间。
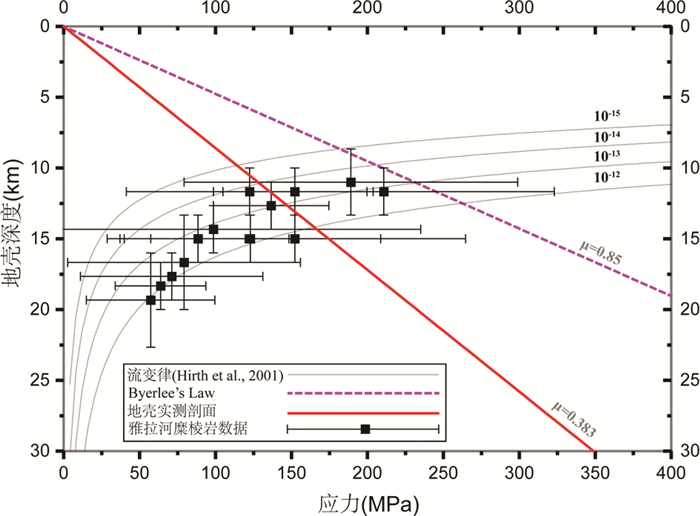
3.5 地壳强度剖面及破裂莫尔圆本文通过对糜棱岩EBSD精细扫描及数据处理,获得了重结晶颗粒的粒径、差应力大小(图 10)、变形温度,最终得到不同应变区域重结晶石英颗粒的差应力及温度条件(见附件三)。投图结果显示随着新生石英颗粒粒径的减小(差应力的增大),其记录的变形温度也在相应的降低(图 10)。利用这些参数,应用石英流变学公式(公式5,表 1为流变学参数)(Hirth et al., 2001) 定量化计算了康定雅拉河段糜棱岩的深部流变律特征、获取该地区地壳强度剖面(图 11),应力强度剖面可进一步用来计算区域的脆韧性转化峰值应力、上地壳的弹性强度(Behr and Platt, 2011)以及下地壳的石英粘性流变学行为(Carter et al., 1976)。

|
(5) |
|
图 10 雅拉河断裂带糜棱岩(样品YL-4、YL-5、YL-6)石英粒径与剪切变形温度曲线图 当粒径减小时(差应力增大),温度也随之减小,二者具有正比关系 Fig. 10 Graphs of grain size temperature curves of mylonite (samples YL-4, YL-5, YL-6) in the Yalahe fault When the grain size decreases (the differential stress increases), the temperature also decreases, and the two have a proportional relationship |
|
|
表 1 流变学参数 Table 1 Flow law parameter |
|
图 11 雅拉河断裂带地壳应力与深度剖面 据古应力计及CPO温度计计算实际数据点大多落在应变速率为10-13流变律曲线上,且与上地壳实测剖面相交于145.45MPa,12.51km,代表雅拉河段脆韧性转化带地壳强度 Fig. 11 Crustal stress and depth profile of Yalahe fault According to the pale-piezometry and CPO thermometer, most of the actual data points fall on the rheological curve with a strain rate of 10-13, and intersect with the measured profile of the upper crust at 145.45MPa and 12.51km, representing the crustal strength of the Yalahe fault |
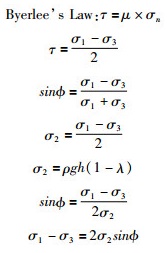
上地壳的岩石无先存破裂面时,其强度遵循库仑(Coulomb)摩擦破裂准则,剪应力(τ)通过摩擦系数(μ)与有效正应力线性相关(公式6)(Sibson, 1983),当有现存破裂面时遵循拜尔莱定律(ByerLee’s Law)(见公式7),未变形花岗岩的摩擦系数为0.85(Byerlee, 1978)。上地壳的应力与深度的关系我们参考地质力学所实测剖面(任洋等, 2021),由于地壳应力测量只有<2km的数值,因此本文对其测量值进行了线性外延,根据实测上地壳应力深度实际值SH=22H+4.47(SH上地壳地应力,单位MPa,H地壳深度,单位km)符合线性变化,由此得到康定雅拉河上地壳地应力曲线(图 11)。

|
(6) |
库仑破裂摩擦准则。τ剪应力,σ0材料内聚强度,μ摩擦系数,σN有效正应力。

|
(7) |
拜尔莱定律。τ剪应力,ϕ滑动摩擦角,σN有效正应力。
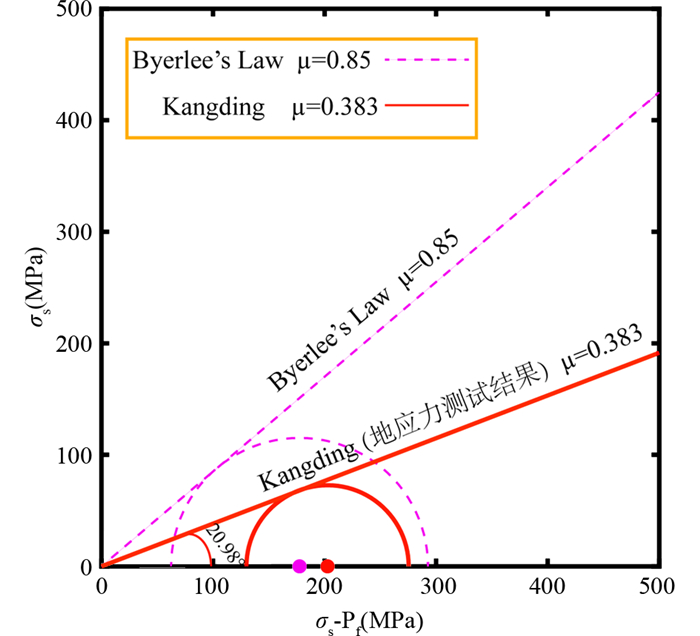
下地壳的岩石为塑性变形,岩石强度受控于应变速率,温度和石英晶粒大小,与变形机制有关(例如位错蠕变、扩散蠕变)(Brace and Kohlstedt, 1980)。图 10采用10-15~10-12(s-1)应变速率进行投图,详见公式(5)。将石英集合体不同应变机制下,即不同变形深度及温度的数据点投图,最终构建康定雅拉河段糜棱岩地壳强度剖面(图 11)。经计算发现康定段糜棱岩应变速率范围6.08×10⁻¹³~1.62×10⁻¹¹s-1,平均为10-13s-1左右(图 11)且与不同上地壳滑动摩擦系数曲线交于不同深度及差应力处(表 2)。通过差应力-变形温度投图发现(图 11),我们获得差应力并未达到拜尔莱提出的μ=0.85摩擦系数的破裂所需的差应力大小,这可能存在花岗岩的弱化。并且通过图示可知康定段雅拉河断裂带应变速率约为10-13s-1,脆韧性转化带地壳强度约为145.45MPa,处于12.51km深度。
|
|
表 2 地壳应变速率10-14~10-12s-1与地壳摩擦滑动系数μ=0.85、0.383直线相交于不同差应力及地壳深度 Table 2 The crustal strain rate within the range of 10-14~10-12s-1 and the crustal friction slip coefficient μ=0.85, 0.383 straight lines intersect at different differential stresses and crustal depths |
经历韧性到脆性持续变形的岩石,可以为我们提供真实的地壳应力剖面,从而帮助我们提供韧脆性转换带的差应力信息、理解岩石弱化机制及深部发震机制等(Behr and Platt, 2011)。本文选取鲜水河康定雅拉河段糜棱岩带开展精细的岩石物理学研究,通过利用断层的实测滑移速率对比流变学计算的应变率,来讨论康定段糜棱岩岩石强度;进而通过破裂点的计算来约束断层带的脆性破裂行为,例如断层的实际摩擦系数等,这些基本的参数对断裂带的发震机制研究具有重要的价值。
4.1 鲜水河康定雅拉河段的脆韧性转换深度鲜水河断裂带康定雅拉河段具有最高无震滑动速率10~19.8mm/yr(Bai et al., 2018; Qiao and Zhou, 2021)。假设康定雅拉河段的活动断层宽度为0.1~1km,那么可知其走滑的应变速率为5×10-13~6.3×10⁻¹³s-1。康定雅拉河段通过InSAR数据和地貌与通过流变率计算获得的应变速率基本在一个数量级上(10-13s-1),这说明我们通过岩石记录获得的差应力及温度关系在合理的范围值内(图 11),也即岩石薄片中观察到应变机制可以代表鲜水河断裂带康定雅拉河段深部的应变机制。
根据康定段岩体地壳强度曲线可知康定段应变速率范围为6.08×10⁻¹³~1.62×10⁻¹¹s-1,与拜尔莱定律(μ=0.85)交于地下8.80~12.50km,206~266MPa,与实测地应力剖面(μ=0.383)交于地下11.11~14.25,129~161MPa(表 2)。据此可以看出,岩体发生弱化,使得岩体强度降低,脆韧性转化带深度增大,最终确定康定段岩体脆韧性转化带深度为12.5±2.5km。与世界上其他类似方法计算获得的数据相比较,指示的脆韧性转化带的剪切应力约为100~110MPa(地温梯度为30~40℃/km时,μ=0.85),所处深度约为8~12km(Behr and Platt, 2014),这与本文获得的康定雅拉河岩石强度理论值为206.06MPa,处于9.80km,剪应力115.15MPa可类比(计算过程见电子版附件五)。
附件五 计算公式及代码
1.走滑型断裂带上地壳强度计算
|
2.中上地壳流变律计算

|
|
|
Origin代码:((-1.35*10^5/(ln((1/37)*(x^-4)*(10^-3.8))*8.314))-273.15)/25
3.破裂摩尔圆

|
Matlab代码:
1%%绘制理论值应力摩尔圆
x0=177.552;
y0=0;
r=115.15;
theta=0:pi/50:2*pi;
x=x0+r*cos(theta);
y=y0+r*sin(theta);
plot(x, y, '-', x0, y0, '.');
axis square;
hold on
%%绘制Byerlee’s定律
x1=0:0.100:500;
y1=0.85*x1
plot(x1, y1)
%设置Y轴的数据显示范围
set(gca, 'YLim', [0 500])
hold on;
2%设置实际值应力摩尔圆
x2=202.662;
y2=0;
r=72.725;
theta=0:pi/50:2*pi;
x=x2+r*cos(theta);
y=y2+r*sin(theta);
plot(x, y, '-', x2, y2, '.');
axis square;
hold on
%%绘制实测摩擦系数
x3=0:0.100:500;
y3=0.383*x1
plot(x3, y3)
此外通过流变律投点发现,实际数据值没有像预期一样沿着一条单一的应变速率曲线演化,而是横跨了几条应变速率曲线。有前人研究也曾发现在变质核杂岩中,脆韧性转换带附近岩石强度上升,温度降低,应变开始更多地发生局部化,应变速率高,导致在越来越窄的区域聚集越来越多的应变,最终形成脆性断层(Gessner et al., 2007)。我们推测鲜水河断裂带康定雅拉河段糜棱岩也发生了类似的冷却过程,从深部低差应力高应变速率演变到浅部更大的差应力和更低的应变率,即岩石在剥蚀上升的过程中,可能由于地温梯度的改变(Liu et al., 2017),导致岩石的差应力和应变所处的温度的比值发生改变,进而导致应变速率的改变。
4.2 鲜水河康定雅拉河段的弱化证据及机制在中地壳发育有典型的脆-韧性转换带,在该带之上岩石表现为脆性变形,断层摩擦滑移是最重要的地壳岩石变形过程;在该带之下的岩石则表现出强烈的塑性变形(刘俊来, 2004),该转换带强震频发(刘俊来, 2017)。以拜尔莱定律为临界破裂准则(μ=0.85)的理论值,在应变速率为10-13s-1时,计算获得理论破裂点差应力为206.06MPa,深度为9.80km(图 12,紫色虚线)。但是我们计算的差应力及实测地应力剖面线均未达到理论的破裂值(图 12),我们假设地应力-深度曲线是该区域的破裂线,在应变速率为10-13s-1时,计算获得实测破裂点差应力为145.45MPa,深度为12.51km(图 11,红线),这个差应力和我们计算的最大差应力值平均值(166.66MPa)相近(附件三)。此时,康定雅拉河段最大主应力与破裂面交角约为20.98°,这和GPS观测结果相吻合,摩擦系数为0.383(图 12)(公式计算见附件五),由此可知康定雅拉河段花岗质糜棱岩有明显的弱化。所以雅拉河段历史无大震可能与位错蠕变引起的应变弱化有关。
|
图 12 雅拉河断裂带破裂摩尔圆 据康定雅拉河段糜棱岩强度145.45MPa,12.51km,拜尔莱定律μ=0.85,实测剖面μ=0.383可知上地壳实最大主应力与破裂面交角约为20.98°,尚未达到临界状态.σs-剪应力,σn-正应力,Pf-静水压力 Fig. 12 Mohr circle of rupture of Yalahe fault According to the strength of mylonite in the Yalahe fault of Kangding at 145.45MPa, 12.51km, Byerlee's law μ=0.85, and the measured profile μ=0.383, it can be seen that the actual maximum principal stress of the upper crust and the fracture surface intersect at an angle of about 20.98°, has not reached the critical state. σs-shear stress, σn-normal stress, Pf-hydrostatic pressure |
对于康定段糜棱岩来说,深部岩体以位错蠕变变形为主(图 4d, f),糜棱岩的抬升过程中,由于温度的降低,动态重结晶作用导致了大颗粒石英的细粒化,SPO逐渐增强,矿物呈拉长定向(图 4b, e),偶见石英条带,在石英颗粒最细小的区域,发育显微破裂,这记录了典型的应变局部化(刘俊来, 2017)。地壳层次上应变局部化,常常伴随着岩石强度的降低、高的应变积累以及局部化应变速率的提高(Read, 1984)。由于细粒化作用为中地壳岩石重结晶作用的结果,是糜棱岩化过程中最为重要的特点,也是引起应变局部化和弱化的主要因素(Xia and Platt, 2018)。所以根据显微构造记录我们认为康定段糜棱岩因位错蠕变引起的细粒化作用,最终导致的岩体弱化可能为康定段摩擦系数较低的主因。
据中国地震台网测定,2014年11月22日16时55分的6.3级康定地震的震源深度为14.6km(USGS),1972年4月8日康定5.2级地震震源深度为15km(见电子版附件四),这两次地震和我们计算的脆韧性变形转换深度12.5±2.5km相吻合。由此推测康定雅拉河段糜棱岩位错蠕变向脆性变形的过渡带是该区域发震带,由于较低的变形温度,位错蠕变导致的细粒化使得岩石强度降低,导致应变在糜棱岩的细粒化部位发生局部化,使得应力失稳,无法聚集较大的差应力,康定雅拉河段可能不易发生Ms 7.0以上的强震。
附件四 震源深度统计表
|
|
依据精细的糜棱岩薄片显微构造观察及岩石物理学计算,我们获得了鲜水河断裂带康定雅拉河段的以下几点结论:
(1) 通过差应力-深度剖面,区域应变速率及通过流变学反推的应变速率量级均为10-13s-1,
(2) 实测的地应力剖面线与10-13s-1应变速率交点于145.45MPa,12.51km,显示雅拉河断裂脆韧性转化带岩石强度约为145.45MPa,这符合石英古应力计估算的结果。
(3) 岩体的临界库伦摩擦角为20.98°摩擦系数为0.383,与拜尔莱定律摩擦系数为0.85相比康定雅拉河段糜棱岩发生了明显的弱化,导致高应力无法累积,这可能和位错蠕变导致的细粒化有关。
(4) 应变速率10-13s-1对应的脆韧性转化带深度约为12.5±2.5km,对比康定地区2014年地震平均深度(14.8km)发现理论计算得出的脆韧性转换的深度和InSAR计算的闭锁深度以及发震深度相吻合。
致谢 感谢中国地质科学院地质所李海兵研究员、李超博士、吴琼博士,中国地质大学(北京)韩宁博士、张岩岩硕士在野外和室内工作中给予的诸多帮助;衷心感谢西北大学董云鹏教授、北京大学张波副教授及本刊编辑对本文提出的宝贵建设性建议及意见,使本文质量得以提升。
Audétat A, Garbe-Schönberg D, Kronz A, Pettke T, Rusk B, Donovan JJ and Lowers HA. 2015. Characterisation of a natural quartz crystal as a reference material for microanalytical determination of Ti, Al, Li, Fe, Mn, Ga and Ge. Geostandards and Geoanalytical Research, 39(2): 171-184 DOI:10.1111/j.1751-908X.2014.00309.x
|
Bai MK, Chevalier ML, Pan JW, Replumaz A, Leloup PH, Métois M and Li HB. 2018. Southeastward increase of the Late Quaternary slip-rate of the Xianshuihe fault, eastern Tibet: Geodynamic and seismic hazard implications. Earth and Planetary Science Letters, 485: 19-31 DOI:10.1016/j.epsl.2017.12.045
|
Behr WM and Platt JP. 2011. A naturally constrained stress profile through the middle crust in an extensional terrane. Earth and Planetary Science Letters, 303(3-4): 181-192 DOI:10.1016/j.epsl.2010.11.044
|
Behr WM and Platt JP. 2014. Brittle faults are weak, yet the ductile middle crust is strong: Implications for lithospheric mechanics. Geophysical Research Letters, 41(22): 8067-8075 DOI:10.1002/2014GL061349
|
Brace WF and Kohlstedt DL. 1980. Limits on lithospheric stress imposed by laboratory experiments. Journal of Geophysical Research: Solid Earth, 85(B11): 6248-6252 DOI:10.1029/JB085iB11p06248
|
Byerlee J. 1978. Friction of rocks. Pure and Applied Geophysics, 116(4-5): 615-626 DOI:10.1007/BF00876528
|
Carter NL. 1976. Steady state flow of rocks. Reviews of Geophysics, 14(3): 301-360 DOI:10.1029/RG014i003p00301
|
Cross AJ, Prior DJ, Stipp M and Kidder S. 2017. The recrystallized grain size piezometer for quartz: An EBSD-based calibration. Geophysical Research Letters, 44(13): 6667-6674 DOI:10.1002/2017GL073836
|
Gessner K, Wijns C and Moresi L. 2007. Significance of strain localization in the lower crust for structural evolution and thermal history of metamorphic core complexes. Tectonics, 26(2): TC2012
|
Hirth G and Tullis J. 1992. Dislocation creep regimes in quartz aggregates. Journal of Structural Geology, 14(2): 145-159 DOI:10.1016/0191-8141(92)90053-Y
|
Hirth G, Teyssier C and Dunlap JW. 2001. An evaluation of quartzite flow laws based on comparisons between experimentally and naturally deformed rocks. International Journal of Earth Sciences, 90(1): 77-87 DOI:10.1007/s005310000152
|
Holyoke CW Ⅲ and Kronenberg AK. 2010. Accurate differential stress measurement using the molten salt cell and solid salt assemblies in the Griggs apparatus with applications to strength, piezometers and rheology. Tectonophysics, 494(1-2): 17-31 DOI:10.1016/j.tecto.2010.08.001
|
Hu BQ, Wang FZ, Sun ZX, Liu CD and Bai LH. 2003. The pressure gradient in the lithosphere. Earth Science Frontiers, 10(3): 129-133 (in Chinese with English abstract)
|
Huang RF and Audétat A. 2012. The titanium-in-quartz (TitaniQ) thermobarometer: A critical examination and re-calibration. Geochimica et Cosmochimica Acta, 84: 75-89 DOI:10.1016/j.gca.2012.01.009
|
Ji LY, Zhang WT, Liu CJ, Zhu LY, Xu J and Xu XX. 2020. Characterizing interseismic deformation of the Xianshuihe fault, eastern Tibetan Plateau, using Sentinel-1 SAR images. Advances in Space Research, 66(2): 378-394 DOI:10.1016/j.asr.2020.03.043
|
Kidder S, Avouac JP and Chan YC. 2012. Application of titanium-in-quartz thermobarometry to greenschist facies veins and recrystallized quartzites in the Hsüehshan range, Taiwan. Solid Earth Discussions, 4(1): 663-706
|
Kilian R, Heilbronner R and Stünitz H. 2011. Quartz grain size reduction in a granitoid rock and the transition from dislocation to diffusion creep. Journal of Structural Geology, 33(8): 1265-1284 DOI:10.1016/j.jsg.2011.05.004
|
Langille JM, Jessup MJ, Cottle JM, Newell D and Seward G. 2010. Kinematic evolution of the Ama Drime detachment: Insights into orogen-parallel extension and exhumation of the Ama Drime Massif, Tibet-Nepal. Journal of Structural Geology, 32(7): 900-919 DOI:10.1016/j.jsg.2010.04.005
|
Law RD. 2014. Deformation thermometry based on quartz c-axis fabrics and recrystallization microstructures: A review. Journal of Structural Geology, 66: 129-161 DOI:10.1016/j.jsg.2014.05.023
|
Li DH, Ding ZF, Wu PP, Zheng C, Ye QD and Liang MJ. 2015. The deep seismogenic environment of the southeastern section of the Xianshuihe fault zone and the 2014 Kangding MS6.3 earthquake. Chinese Journal of Geophysics, 58(6): 1941-1953 (in Chinese with English abstract)
|
Li DY, Chen LC, Liang MJ, Gao SP, Zeng D, Wang H and Li YB. 2017. Holocene Palaeoseismologic record and rupture behavior of large earthquakes on the Xianshuihe fault. Seismology and Geology, 39(4): 623-643 (in Chinese with English abstract)
|
Li HB, Pan JW, Sun ZM, Si JL, Pei JL, Liu DL, Chevalier ML, Wang H, Lu HJ, Zheng Y and Li CR. 2021. Continental tectonic deformation and seismic activity: A case study from the Tibetan Plateau. Acta Geologica Sinica, 95(1): 194-213 (in Chinese with English abstract)
|
Li HL and Zhang YQ. 2013. Zircon U-Pb geochronology of the Konggar granitoid and migmatite: Constraints on the Oligo-Miocene tectono-thermal evolution of the Xianshuihe fault zone, East Tibet. Tectonophysics, 606: 127-139 DOI:10.1016/j.tecto.2013.07.007
|
Li JY, Zhou BG, Li TM, Yang YL and Li ZF. 2020. Locking depth, slip rate, and seismicity distribution along the Daofu-Kangding segment of the Xianshuihe fault system, eastern Tibetan Plateau. Journal of Asian Earth Sciences, 193: 104328 DOI:10.1016/j.jseaes.2020.104328
|
Liang MJ, Chen LC, Ran YK, Li YB, Wang D, Gao SP, Han MM and Zeng D. 2020. Late-Quaternary activity of the Yalahe fault of the Xianshuihe fault zone, eastern margin of the Tibet Plateau. Seismology and Geology, 42(2): 513-525 (in Chinese with English abstract)
|
Liu JL. 2004. Microstructures of deformed rocks and rheology of the lithosphere. Geological Bulletin of China, 23(10): 980-985 (in Chinese with English abstract)
|
Liu JL. 2017. Strain localization and strain weakening in the continental middle crust. Acta Petrologica Sinica, 33(6): 1653-1666 (in Chinese with English abstract)
|
Liu QQ, Shi YN, Wei DP, Han P, Chen SY, Liu PX and Liu LQ. 2017. Near-surface geothermal gradient observation and geothermal analyses in the Xianshuihe Fault Zone, eastern Tibetan Plateau. Acta Geologica Sininca, 91(2): 414-428 DOI:10.1111/1755-6724.13108
|
Luton MJ and Sellars CM. 1969. Dynamic recrystallization in nickel and nickel-iron alloys during high temperature deformation. Acta Metallurgica, 17(8): 1033-1043 DOI:10.1016/0001-6160(69)90049-2
|
Pan JW, Li HB, Chevalier ML, Bai MK, Liu FC, Liu DL, Zheng Y, Lu HJ and Zhao ZB. 2020. A newly discovered active fault on the Selaha-Kangding segment along the SE Xianshuihe fault: The South Mugecuo fault. Acta Geologica Sinica, 94(11): 3178-3188 (in Chinese with English abstract)
|
Papeschi S and Musumeci G. 2019. Fluid-assisted strain localization in quartz at the brittle/ductile transition. Geochemistry, Geophysics, Geosystems, 20(6): 3044-3064 DOI:10.1029/2019GC008270
|
Passchier CW and Trouw RAJ. 2005. Microtectonics. 2nd Edition. Berlin, Heidelberg: Springer, 1-353
|
Qiao X and Zhou Y. 2021. Geodetic imaging of shallow creep along the Xianshuihe fault and its frictional properties. Earth and Planetary Science Letters, 567: 117001 DOI:10.1016/j.epsl.2021.117001
|
Read HE and Hegemier GA. 1984. Strain softening of rock, soil and concrete: A review article. Mechanics of Materials, 3(4): 271-294 DOI:10.1016/0167-6636(84)90028-0
|
Ren Y, Wang D, Li TB, Ran XD, Liu ZJ and Zhang JX. 2021. In-situ geostress characteristics and engineering effect in Ya'an-Xinduqiao section of Sichuan-Tibet Railway. Chinese Journal of Rock Mechanics and Engineering, 40(1): 65-76 (in Chinese with English abstract)
|
Rutter EH. 1995. Experimental study of the influence of stress, temperature, and strain on the dynamic recrystallization of Carrara marble. Journal of Geophysical Research: Solid Earth, 100(B12): 24651-24663 DOI:10.1029/95JB02500
|
Shen ZK, Lü JN, Wang M and Bürgmann R. 2005. Contemporary crustal deformation around the southeast borderland of the Tibetan Plateau. Journal of Geophysical Research: Solid Earth, 110(B11): B11409
|
Shimizu I. 2008. Theories and applicability of grain size piezometers: The role of dynamic recrystallization mechanisms. Journal of Structural Geology, 30(7): 899-917 DOI:10.1016/j.jsg.2008.03.004
|
Sibson RH. 1983. Continental fault structure and the shallow earthquake source. Journal of the Geological Society, 140(5): 741-767 DOI:10.1144/gsjgs.140.5.0741
|
Simpson C. 1985. Deformation of granitic rocks across the brittle-ductile transition. Journal of Structural Geology, 7(5): 503-511 DOI:10.1016/0191-8141(85)90023-9
|
Skemer P, Katayama I, Jiang ZT and Karato SI. 2005. The misorientation index: Development of a new method for calculating the strength of lattice-preferred orientation. Tectonophysics, 411(1-4): 157-167 DOI:10.1016/j.tecto.2005.08.023
|
Stipp M, Stünitz H, Heilbronner R and Schmid SM. 2002. The eastern Tonale fault zone: A 'natural laboratory' for crystal plastic deformation of quartz over a temperature range from 250 to 700℃. Journal of Structural Geology, 24(12): 1861-1884 DOI:10.1016/S0191-8141(02)00035-4
|
Stipp M and Tullis J. 2003. The recrystallized grain size piezometer for quartz. Geophysical Research Letters, 30(21): 2088 DOI:10.1029/2003GL018444
|
Stipp M, Tullis J and Behrens H. 2006. Effect of water on the dislocation creep microstructure and flow stress of quartz and implications for the recrystallized grain size piezometer. Journal of Geophysical Research: Solid Earth, 111(B4): B04201
|
Tapponnier P, Peltzer G and Armijo R. 1986. On the mechanics of the collision between India and Asia. Geological Society, London, Special Publications, 19(1): 113-157 DOI:10.1144/GSL.SP.1986.019.01.07
|
Tapponnier P, Lacassin R, Leloup PH, Schärer U, Zhong DL, Wu HW, Liu XH, Ji SC, Zhang LS and Zhong JY. 1990. The Ailao Shan/Red River metamorphic belt: Tertiary left-lateral shear between Indochina and South China. Nature, 343(6257): 431-437 DOI:10.1038/343431a0
|
Thomas JB, Watson EB, Spear FS, Shemella PT, Nayak SK and Lanzirotti A. 2010. TitaniQ under pressure: The effect of pressure and temperature on the solubility of Ti in quartz. Contributions to Mineralogy and Petrology, 160(5): 743-759 DOI:10.1007/s00410-010-0505-3
|
Twiss RJ. 1977. Theory and applicability of a recrystallized grain size paleopiezometer. Pure & Applied Geophysics, 115(1-2): 227-244
|
Wallis D, Parsons AJ and Hansen LN. 2019. Quantifying geometrically necessary dislocations in quartz using HR-EBSD: Application to chessboard subgrain boundaries. Journal of Structural Geology, 125: 235-247 DOI:10.1016/j.jsg.2017.12.012
|
Wang H, Wright TJ and Biggs J. 2009. Interseismic slip rate of the northwestern Xianshuihe fault from InSAR data. Geophysical Research Letters, 36(3): L03302
|
Wang H, Liu M, Cao JL, Shen XH and Zhang GM. 2011. Slip rates and seismic moment deficits on major active faults in mainland China. Journal of Geophysical Research: Solid Earth, 116(B2): B02405
|
Wark DA and Watson EB. 2006. TitaniQ: A titanium-in-quartz geothermometer. Contributions to Mineralogy and Petrology, 152(6): 743-754 DOI:10.1007/s00410-006-0132-1
|
Wen XZ, Allen CA, Lou ZL, Qian H, Zhou HW and Huang WS. 1989. Segmentation, geometric features and seismotectonic implications of the Holocene Xianshuihe fault zone. Acta Seismologica Sinica, 11(4): 362-372
|
Wen XZ, Ma SL, Xu XW and He YN. 2008. Historical pattern and behavior of earthquake ruptures along the eastern boundary of the Sichuan-Yunnan faulted-block, southwestern China. Physics of the Earth and Planetary Interiors, 168(1-2): 16-36 DOI:10.1016/j.pepi.2008.04.013
|
Xia HR and Platt JP. 2018. Quartz grainsize evolution during dynamic recrystallization across a natural shear zone boundary. Journal of Structural Geology, 109: 120-126 DOI:10.1016/j.jsg.2018.01.007
|
Yi GX, Fang J and Wen XZ. 2005. Study on faulting behavior and fault-segments for potential strong earthquake risk along the central-southern segment of Xianshuihe fault zone based on current seismicity. Earthquake, 25(1): 58-66 (in Chinese with English abstract)
|
Yi GX, Long F, Wen XZ, Liang MJ and Wang SW. 2015. Seismogenic structure of the M6.3 Kangding earthquake sequence on 22 Nov. 2014, Southwestern China. Chinese Journal of Geophysics, 58(4): 1205-1219 (in Chinese with English abstract)
|
Zaefferer S. 2004. The electron backscatter diffraction technique: A powerful tool to study microstructures by SEM. JEOL News, 39: 10-15
|
Zhang C, Li XY, Almeev RR, Horn I, Behrens H and Holtz F. 2020. Ti-in-quartz thermobarometry and TiO2 solubility in rhyolitic melts: New experiments and parametrization. Earth and Planetary Science Letters, 538: 116213 DOI:10.1016/j.epsl.2020.116213
|
Zhang YZ, Replumaz A, Leloup PH, Wang GC, Bernet M, Van Der Beek P, Paquette JL and Chevalier ML. 2017. Cooling history of the Gongga batholith: Implications for the Xianshuihe Fault and Miocene kinematics of SE Tibet. Earth and Planetary Science Letters, 465: 1-15 DOI:10.1016/j.epsl.2017.02.025
|
Zheng G, Wang H, Wright TJ, Lou YD, Zhang R, Zhang WX, Shi C, Huang JF and Wei N. 2017. Crustal deformation in the India-Eurasia collision zone from 25 years of GPS measurements. Journal of Geophysical Research: Solid Earth, 122(11): 9290-9312 DOI:10.1002/2017JB014465
|
胡宝群, 王方正, 孙占学, 刘成东, 白丽红. 2003. 岩石圈中的地压梯度. 地学前缘, 10(3): 129-134. DOI:10.3321/j.issn:1005-2321.2003.03.012 |
李大虎, 丁志峰, 吴萍萍, 郑晨, 叶庆东, 梁明剑. 2015. 鲜水河断裂带南东段的深部孕震环境与2014年康定MS6.3地震. 地球物理学报, 58(6): 1941-1953. |
李东雨, 陈立春, 梁明剑, 高帅坡, 曾蒂, 王虎, 李彦宝. 2017. 鲜水河断裂带乾宁段古地震事件与大震复发行为. 地震地质, 39(4): 623-643. DOI:10.3969/j.issn.0253-4967.2017.04.001 |
李海兵, 潘家伟, 孙知明, 司家亮, 裴军令, 刘栋梁, Chevalier ML, 王焕, 卢海建, 郑勇, 李春锐. 2021. 大陆构造变形与地震活动——以青藏高原为例. 地质学报, 95(1): 194-213. |
梁明剑, 陈立春, 冉勇康, 李彦宝, 王栋, 高帅坡, 韩明明, 曾蒂. 2020. 鲜水河断裂带雅拉河段晚第四纪活动性. 地震地质, 42(2): 513-525. DOI:10.3969/j.issn.0253-4967.2020.02.016 |
刘俊来. 2004. 变形岩石的显微构造与岩石圈流变学. 地质通报, 23(10): 980-985. |
刘俊来. 2017. 大陆中部地壳应变局部化与应变弱化. 岩石学报, 33(6): 1653-1666. |
潘家伟, 李海兵, Chevalier ML, 白明坤, 刘富财, 刘栋梁, 郑勇, 卢海建, 赵中宝. 2020. 鲜水河断裂带色拉哈-康定段新发现的活动断层: 木格措南断裂. 地质学报, 94(11): 3178-3188. DOI:10.3969/j.issn.0001-5717.2020.11.002 |
任洋, 王栋, 李天斌, 冉小东, 刘志军, 张佳鑫. 2021. 川藏铁路雅安至新都桥段地应力特征及工程效应分析. 岩石力学与工程学报, 40(1): 65-76. |
易桂喜, 范军, 闻学泽. 2005. 由现今地震活动分析鲜水河断裂带中-南段活动习性与强震危险地段. 地震, 25(1): 58-66. |
易桂喜, 龙锋, 闻学泽, 梁明剑, 王思维. 2015. 2014年11月22日中国西南地区M6.3康定地震序列的发震构造. 地球物理学报, 58(4): 1205-1219. |
 2021, Vol. 37


