|
收稿日期: 2018-01-30; 预印本: 2018-07-30
基金项目: 国家自然科学基金(编号:41571357, 41871258, 41571359);民用航天十三五预先研究项目(编号:Y7K0020049);高分辨率对地观测系统重大专项项目(编号:11-Y20A32-9001-15/17);国家重点研发计划(编号:2018YFA0605503)
第一作者简介: 杨以坤,1992年生,男,硕士研究生,研究方向为地表温度和发射率反演,气溶胶反演及沙尘检测。E-mail:yangykun_rs@163.com
通信作者简介: 历华,1982年生,男,副研究员,研究方向为热红外辐射传输建模、地表温度与发射率的遥感反演及验证。E-mail:lihua@radi.ac.cn
|
摘要
地表温度在全球能量平衡和气候变化研究中具有重要意义。中国新一代高分辨率卫星高分五号卫星(GF-5)搭载的全谱段成像光谱仪有4个40 m空间分辨率的热红外波段,可以提供高空间分辨率的地表温度信息。本文提出了适用于全谱段成像光谱仪的温度与发射率分离TES(Temperature and Emissivity Separation)算法同时反演地表温度和发射率,为了提高大气校正精度,算法加入了水汽缩放WVS(Water Vapor Scaling)大气校正方法。首先利用Seebor V5.0全球大气廓线库构建模拟数据对算法精度进行了评价;然后利用张掖地区11景ASTER影像作为替代数据和同步的地面实测数据对算法精度进行了验证。模拟数据结果表明加入WVS方法后TES算法反演地表温度的RMSE由2.59 K降低到1.54 K,4个波段地表发射率的RMSE分别从0.122、0.12、0.102和0.037降低到0.042、0.04、0.028和0.026;地表验证结果表明本文算法反演的地表温度与站点实测值具有更好的一致性,平均Bias由1.08 K降低到0.47 K,RMSE由2.17 K降低到1.7 K;反演的各波段地表发射率与地面实测结果误差均小于1%。因此,本文提出的温度与发射率分离算法具有较高精度,可以利用GF-5数据获取高精度高空间分辨率的地表温度和发射率数据,服务于其他相关研究。
关键词
遥感, 地表温度, 地表发射率, 高分五号(GF-5), WVS, 温度与发射率分离
Abstract
Land Surface Temperature (LST), as a key parameter of surface physical processes at regional and global scales, is an important indicator of energy balance and climate change on the land surface. Land Surface Emissivity (LSE) is an intrinsic property of natural materials and is a key parameter of surface energy balance and mineral mapping. LSE is also an important input variable for LST retrieval. LST rapidly changes in space and time given the heterogeneity of land surface, and remote sensing in thermal infrared (TIR) provides a unique means of obtaining LST information at regional and global scales. GF-5 satellite, which was launched in 2018, is the fifth satellite in the national high-resolution Earth observation project of China. Visual and Infrared Multispectral Imager (VIMI) is a sensor onboard GF-5, which has four TIR channels centered at 8.20, 8.63, 10.80, and 11.95 μm with a spatial resolution of 40 m. In this study, we present a physics-based Temperature and Emissivity Separation (TES) algorithm (denoted as WVSTES algorithm) to retrieve LST and emissivity (LST&E) simultaneously from GF-5 VIMI data. The TES algorithm uses full radiative transfer simulations to isolate surface-emitted radiance and an emissivity calibration curve based on the variability in the surface radiance data to retrieve LST and spectral emissivity dynamically. Furthermore, an improved Water Vapor Scaling (WVS) model is adopted to improve the accuracy and stability of atmospheric correction for conditions with high atmospheric water vapor content. First, Seebor V5.0 atmospheric profile database and 81 emissivity spectra extracted from the ASTER spectral library were used to simulate WVS coefficients. Then, reanalysis data of the Modern Era Retrospective-analysis for Research and Applications (MERRA) and fast radiative transfer model RTTOV were used to perform the atmospheric correction of GF-5 TIR data. Second, atmospheric parameters, such as atmospheric transmittance, upwelling, and downwelling radiance, were adjusted through the WVS method. Finally, the LST&E were retrieved using the TES algorithm. Two methods were used to evaluate the accuracy of the proposed algorithm. The first method was used to evaluate the algorithm using simulated data constructed on Seebor profile database and MODTRAN 5.2 model. The second method was applied to validate the algorithm using 11 daytime simulated images from ASTER data acquired in the Heihe River Basin with the concurrent in situ LST&E measurements. First, the GF-5 at-sensor radiances were simulated using the MODTRAN 5.2 model with 9136 atmospheric profiles and 81 ASTER emissivity spectra to evaluate the simulated data. Second, the errors in atmospheric correction were simulated in terms of the total atmospheric water vapor content uncertainties, and the atmospheric profile was adjusted with a scaling factor of 1.2 in MODTRAN to simulate the errors. Finally, the standard TES and WVSTES algorithms were evaluated using the simulated data. Validation results using the simulated data show that LST RMSE reduces from 2.59 K to 1.54 K, and LSE RMSEs in the four bands reduce from 0.122, 0.12, 0.10, and 0.037 to 0.042, 0.040, 0.028, and 0.026, respectively, when the WVS model is applied. The validation results using the simulated GF-5 images show that the LST retrieved using the WVSTES algorithm agrees well with in situ LST data. The LST average bias reduces from 1.08 K to 0.47 K, and the RMSE reduces from 2.17 K to 1.70 K. The error between the retrieved emissivity and ground measured data is basically less than 1%. The abovementioned results indicate that the proposed WVSTES algorithm can retrieve accurate LST&E results, which can be used to obtain the LST&E with high accuracy and spatial resolution from the GF-5 VIMI data.
Key words
remote sensing, land surface temperature, land surface emissivity, GF-5, WVS, TES
1 引 言
地表温度LST(Land Surface Temperature)作为区域和全球尺度地表物理过程的关键参数,同时是表征陆地表面能量平衡和气候变化的重要指标(Wan和Dozier,1996;Zhou 等,2010)。地表温度的准确获取对地气能量、地球水汽平衡、城市热岛效应以及生态系统研究具有重要的意义(Gillespie 等,1998;Huang 等,2008;Islam 等,2017)。地表发射率LSE(Land Surface Emissivity)是地物固有的物理特性,是地—气能量平衡和矿物填图的关键参数(Li 等,2013;Sobrino 等,2008);同时地表发射率也是地表温度反演中一个重要输入变量,在不同的大气条件下,1%的地表发射率误差能够引起0.3—0.7 K的地表温度误差,因此地表发射率的准确反演也是高精度地表温度反演的必要条件(Dash 等,2002)。地表的非均质特征导致地表温度随着时空变化具有较大的差异,因此利用地面站点无法获取大区域地表温度。随着热红外遥感的不断发展,以及LST反演算法的不断成熟,卫星遥感成为获取区域和全球尺度LST时空分布唯一可能的手段。不考虑夜晚和多角度观测,地表温度反演主要采用3类算法,分别是单通道算法SC(Single-Channel methods) (Jiménez-Muñoz和Sobrino,2003;Qin 等,2001;Li 等,2010)、劈窗算法SW(Split-Window algorithm) (McMillin,1975;Sun和Pinker,2007;Wan和Dozier,1996;Du 等,2015;Liu 等,2017)和温度与发射率分离算法TES(Temperature Emissivity Separation method) (Gillespie 等,1998;Wang 等,2011)。
中国高分五号卫星(GF-5)装载了6 台遥感仪器,能够有效的进行大气污染气体、温室气体、环境质量以及生态环境等遥感监测(范斌 等,2017)。全谱段光谱成像仪VIMI(Visual and Infrared Mutispectral Imager)是搭载在GF-5卫星的传感器之一,光谱范围覆盖可见光到热红外区域,共12个通道;其中可见光多光谱和短波红外通道6个,空间分辨率为20 m;中红外通道2个,空间分辨率40 m;热红外通道4个,空间分辨率40 m,中心波长分别为8.20 (8.01—8.39 μm),8.63 (8.42—8.83 μm),10.80 (10.30—11.30 μm)和11.95 (11.40—12.50 μm) (Ren 等,2018)。鉴于GF-5 VIMI具有多个热红外波段,可以采用SC算法、SW算法以及TES算法进行温度反演。SC算法是在LSE和大气廓线已知的情况下,基于辐射传输方程反演LST(Hook 等,1992;Meng 等,2016),该算法在高水汽含量下精度较差(Sobrino 等,2004)。SW算法是利用两个相邻且具有不同的水汽吸收特性的热红外通道来消除大气的影响。Ye等(2017)提出了针对GF-5数据的SW算法,但利用SW算法进行LST反演仍需要LSE,并且SW算法对LSE误差较为敏感(Li 等,2014)。与SC和SW算法不同,TES算法能够同时反演地表温度和发射率,该方法通过建立发射率光谱对比MMD(Maximum-Minimum Difference)与最小发射率的经验关系增加约束条件,实现LST与LSE的同时反演(Gillespie 等,1998)。在精确的大气校正前提下,TES算法反演LST和LSE的理论精度分别为±1.5 K和±1.5%(Gillespie 等,1999)。然而,一些研究指出对于低发射率光谱对比的地物(水体、冰雪、植被)及高水汽含量的大气条件下,TES算法反演的LST&E具有较大的误差(Coll 等,2007;Gillespie 等,2011;Hulley 等,2009;Hulley和Hook,2011)。
大气校正的残差是TES算法反演LST&E的主要误差来源,在高水汽含量的大气条件下能够对ASTER和MODIS LST分别造成3 K和4.5 K的误差(Hulley和Hook,2012;Hulley 等,2012)。为了改进热红外波段大气校正的精度,Tonooka(2001)提出了WVS (Water Vapor Scaling)大气校正方法,该方法通过水汽缩放因子γ对大气参数进行修正从而提高大气校正的精度。Tonooka(2005a)以ASTER数据为例,对比了标准大气校正算法和WVS算法的精度,实验结果表明WVS大气校正方法能够提供更高精度的LST&E反演结果,LST的RMSE期望值约为0.6 K。之后WVS方法被进一步应用到了MODIS数据(Hulley和Hook,2011;Tonooka,2005b)。Malakar和Hulley(2016)针对MODIS数据提出了考虑传感器角度的改进WVS方法,该方法与TES算法结合被用来生产MOD21地表温度和发射率产品,验证结果表明改进的WVS方法有望使LST&E反演精度达到1 K和1%。同样该方法也被应用到VIIRS数据进行生产LST&E产品(VNP21)(Islam 等,2017)。
本文提出了一个适用于GF-5 VIMI数据的地表温度和发射率分离算法,为了提高大气校正精度,首先基于Seebor V5.0全球大气廓线数据库提出适用于GF-5 VIMI数据的WVS大气校正方法,再利用TES算法进行温度和发射率分离(简称:WVSTES算法)。首先利用模拟数据对算法精度进行验证,然后利用黑河流域生态—水文过程综合遥感观测联合试验中获取的ASTER数据作为替代数据和同步的实测地表温度和发射率对算法进行精度验证。
2 温度与发射率分离算法
2.1 热红外辐射传输方程
在热红外波段(8—14 μm)传感器接收到的地表辐射主要包括3部分:地表发射辐射、地表反射的大气下行辐射以及大气上行辐射。因此,传感器入瞳处的辐射亮度值
| ${L_i} = {\varepsilon _i}{B_i}({T_{\rm{s}}}){\tau _i} + (1 - {\varepsilon _i})R_i^ \downarrow {\tau _i} + R_i^ \uparrow $ | (1) |
式中,
| ${L_{{\rm{s}},i}} = {\varepsilon _i}{B_i}({T_{\rm{s}}}) + (1 - {\varepsilon _i})R_i^ \downarrow = \frac{{{L_i} - R_i^ \uparrow }}{{{\tau _i}}}$ | (2) |
因此,利用式(1)和式(2)进行LST&E反演时,首先需要利用辐射传输模型计算大气参数(
2.2 大气校正
地表辐射经过与大气的相互作用(大气反射,衰减以及散射)最终到达传感器。因此,求解地表辐射时需要进行大气校正。传统基于辐射传输模型的大气校正方法通过输入与卫星数据过境时间匹配的大气廓线进行大气参数的计算。目前,常用的辐射传输模型有MODTRAN(Kneizys 等,1996)和RTTOV(Hocking 等,2015;Matricardi 等,2004);Meng等(2016)利用TIGR3大气廓线对比了MODTRAN和RTTOV两种辐射传输模型的精度,结果表明二者计算的大气参数精度基本一致,但RTTOV具有更快的运行速度。常用的大气廓线数据主要通过两种方式获取:(1)利用再分析数据,通过大气再分析数据进行时间和空间插值模拟实时大气状况,目前常用的再分析数据主要有NOAA的NCEP(National Centers for Environmental Prediction)、NASA的MERRA(Modern Era Retrospective-analysis for Research and Applications)和欧洲中期天气预报中心ECMWF(European Centre for Medium-Range Weather Forecasts)再分析数据;(2)利用遥感反演的大气廓线产品,例如MODIS MOD07和AIRS大气廓线产品(Li 等,2013)。由于再分析数据空间上连续并且时间分辨率较高,本文采用MERRA再分析数据来计算大气透过率和大气上、下行辐射,同时为了提高运行效率,对图像数据的大气校正采用快速辐射传输模型RTTOV。
2.3 WVS方法
热红外波段大气校正的残差是TES算法反演LST&E误差的主要来源,而传统的大气校正算法在高水汽含量时具有较大误差,这种不确定性会导致更大的LST&E反演误差(Hulley 等,2009;Li 等,2014;Sabol 等,2009)。因此,本文将WVS大气校正方法应用于GF-5 VIMI数据,以提高大气校正精度。
WVS大气校正方法是由WVD(Water Vapor Dependent)算法发展而来(Francois和Ottle,1996),地表亮温可以表示为水汽和大气层顶亮温的二次多项式(Francois和Ottle,1996;Malakar和Hulley,2016;Tonooka,2005a)
| ${T_{{\rm{g}},i}} = {a_{i,0}} + \sum\limits_{k = 1}^n {{a_{i,k}}{T_k}} $ | (3) |
| ${a_{i,k}}{\rm{ = }}{p_{i,k}} + {q_{i,k}}W + {r_{i,k}}{W^2}$ | (4) |
式中,
WVS方法假设大气透过率
| ${\gamma ^i}{\rm{ = }}\frac{{\ln \left(\frac{{{\tau _i}{{(\theta,{\gamma _2})}^{\gamma _1^{{\beta _{^i}}}}}}}{{{\tau _i}{{(\theta,{\gamma _1})}^{\gamma _2^{{\beta _{^i}}}}}}} \cdot {{\left(\frac{{{B_i}({T_{{\rm{g}},i}}) - L_i^ \uparrow (\theta,{\gamma _1})/(1 - {\tau _i}(\theta,{\gamma _1}))}}{{{L_i} - L_i^ \uparrow (\theta,{\gamma _1})/(1 - {\tau _i}(\theta,{\gamma _1})}}\right)}^{\gamma _1^{{\beta _{^i}}} - \gamma _2^{{\beta _{^i}}}}}\right)}}{{\ln ({\tau _i}(\theta,{\gamma _2})/{\tau _i}(\theta,{\gamma _1}))}}$ | (5) |
式中,
本文利用全球大气廓线库Seebor V5.0模拟WVS系数,其中包括(1) WVS回归系数p、q和r;(2) βi波段模型参数BMP(Band Model Parameters);(3) 大气下行辐射回归系数。Seebor V5.0大气廓线库共包含了15704条全球范围均匀分布的晴空条件下的大气廓线数据;每条廓线记录了101个大气压强层的温度,湿度和臭氧含量等(Borbas 等,2005)。由于无线探空仪可能向水体区域偏移,因此,以陆地面积>50%为条件,共得到9136条陆地上空的大气廓线;此外又利用日出和日落时间,对廓线数据进行二次筛选,最终分别获取了4948条白天和4188条夜晚的陆地上空的廓线数据。
(1) WVS系数模拟。本文利用MODTRAN 5.2辐射传输模型,以筛选的大气廓线作为输入,模拟了GF-5传感器大气层顶亮温
表 1 GF-5全谱段光谱成像仪WVS系数
Table 1 The WVS coefficients of the GF-5 VIMI
| 波段 | p0 | q0 | r0 | p1 | q1 | r1 | p2 | q2 |
| Band09 | −5.2729 | 2.5060 | −1.5999 | −0.7220 | −0.2129 | 0.0875 | 1.5032 | 0.3048 |
| Band10 | −3.6979 | 3.2136 | −1.7592 | −0.8316 | −0.0662 | 0.0591 | 1.6061 | 0.1142 |
| Band11 | 0.1027 | 2.9251 | −1.9145 | −0.5967 | −0.0765 | 0.0630 | 0.5288 | 0.2361 |
| Band12 | 0.8196 | 2.5627 | −1.9431 | −0.8424 | −0.3041 | 0.1183 | 0.7720 | 0.5515 |
| 波段 | r2 | p3 | q3 | r3 | p4 | q4 | r4 | RMSE/K |
| Band09 | −0.0469 | −0.4385 | 0.4256 | −0.0312 | 0.6812 | −0.5266 | −0.0033 | 0.454 |
| Band10 | −0.0086 | −0.3242 | 0.6208 | −0.0806 | 0.5666 | −0.6805 | 0.0367 | 0.363 |
| Band11 | −0.0055 | 0.4675 | 0.7847 | −0.1236 | 0.5995 | −0.9545 | 0.0733 | 0.368 |
| Band12 | −0.0714 | −0.5475 | 0.6534 | −0.0696 | 1.6138 | −0.9101 | 0.0303 | 0.485 |
(2) BMP模拟。与WVS系数模拟相似,BMP模拟时利用MODTRAN 5.2分别获取了不同水汽缩放因子γ(分别为0.7、0.9和1.0)下的大气透过率,利用经验模型对参数进行最小二乘回归
| ${\tau _i}(\theta,\gamma) = {\tau _i}{(\theta,{\gamma _1})^{\frac{{{\gamma ^{{\beta _i}}} - {\gamma _2}^{{\beta _i}}}}{{{\gamma _1}^{{\beta _i}} - {\gamma _2}^{{\beta _i}}}}}} \cdot {\tau _i}{(\theta,{\gamma _2})^{\frac{{{\gamma _1}^{{\beta _i}} - {\gamma ^{{\beta _i}}}}}{{{\gamma _1}^{{\beta _i}} - {\gamma _2}^{{\beta _i}}}}}}$ | (6) |
式中,
表 2 GF-5全谱段光谱成像仪BMP系数
Table 2 BMP coefficients of the GF-5 VIMI
| 波段 | 参数 |
| Band09 | 1.2244 |
| Band10 | 1.5553 |
| Band11 | 1.8818 |
| Band12 | 1.8263 |
(3) 大气下行辐射回归系数模拟。为了减少辐射传输模型的运行次数和时间,大气下行辐射可以表示为天底观测方向大气上行辐射的非线性函数
| $L_i^ \downarrow (\gamma) = {a_i} + {b_i} \cdot L_{_i}^ \uparrow (0,\gamma) + {c_i} \cdot L_{_i}^ \uparrow {(0,\gamma)^2}$ | (7) |
式中,
| $L_i^ \uparrow (0,\gamma) = L_i^ \uparrow (\theta,\gamma) \cdot \frac{{1 - {\tau _i}{{(\theta,\gamma)}^{\cos \theta }}}}{{1 - {\tau _i}(\theta,\gamma)}}$ | (8) |
式中,
2.4 大气参数调整
对于非灰体像元
| $L_i^ \uparrow (\theta,\gamma) = L_i^ \uparrow (\theta,{\gamma _1}) \cdot \frac{{1 - {\tau _i}(\theta,\gamma)}}{{1 - {\tau _i}(\theta,{\gamma _1})}}$ | (9) |
式中,
由于GF-5 VIMI幅宽较小,可近似看作垂直观测;因此在进行大气下行辐射调整时可以直接利用式(7)进行计算,表3为回归系数。
表 3 大气下行辐射回归系数
Table 3 Regression coefficients of the atmospheric downwelling radiance
| 波段 | a | b | c |
| Band09 | −0.0055 | 1.6484 | −0.0201 |
| Band10 | −0.0111 | 1.6225 | −0.0224 |
| Band11 | 0.0011 | 1.6198 | −0.0435 |
| Band12 | −0.0045 | 1.5878 | −0.0434 |
2.5 TES算法
Gillespie等(1998) 提出了针对 ASTER 数据的温度与发射率分离算法。该算法综合了NEM (Normalized Emissivity Method)、RATIO (Ratio algorithm)以及MMD算法的优点。NEM算法主要通过式(10)—式(12)迭代计算地表温度T和发射率的初始值
| $R_i'{\rm{ = }}L_{{\rm{s}},i}' - (1 - {\varepsilon _{\max }})L_i^ \downarrow $ | (10) |
| ${T_{\rm{NEM}}} = \max (B_i^{ - 1}(R_i'))$ | (11) |
| ${\varepsilon '} = R_i'/{B_i}({T_{\rm{NEM}}})$ | (12) |
式中,
| $L_{s,i}' = (L - L_i^ \uparrow)/{\tau _i}$ | (13) |
式中,
RATIO算法利用各通道光谱发射率及其平均值进行比值计算,作为发射率光谱波形的无偏估计,即
| ${\beta _i}{\rm{ = }}\frac{{{\varepsilon _i}}}{{\bar \varepsilon }}$ | (14) |
最后利用MMD算法即最大最小发射率之差与最小发射率之间的经验关系确定发射率
| ${\rm{MMD}} = \max ({\beta _i}) - \min ({\beta _i})$ | (15) |
| ${\varepsilon _{{\rm{min}}}}{\rm{ = }}{\alpha _1}{\rm{ - }}{\alpha _2}{{\rm{MMD}}^{{\alpha _3}}}$ | (16) |
| $\varepsilon _i^{\rm{TES}} = {\beta _i}\left(\frac{{{\varepsilon _{{\rm{min}}}}}}{{\min ({\beta _i})}}\right)$ | (17) |
式中,
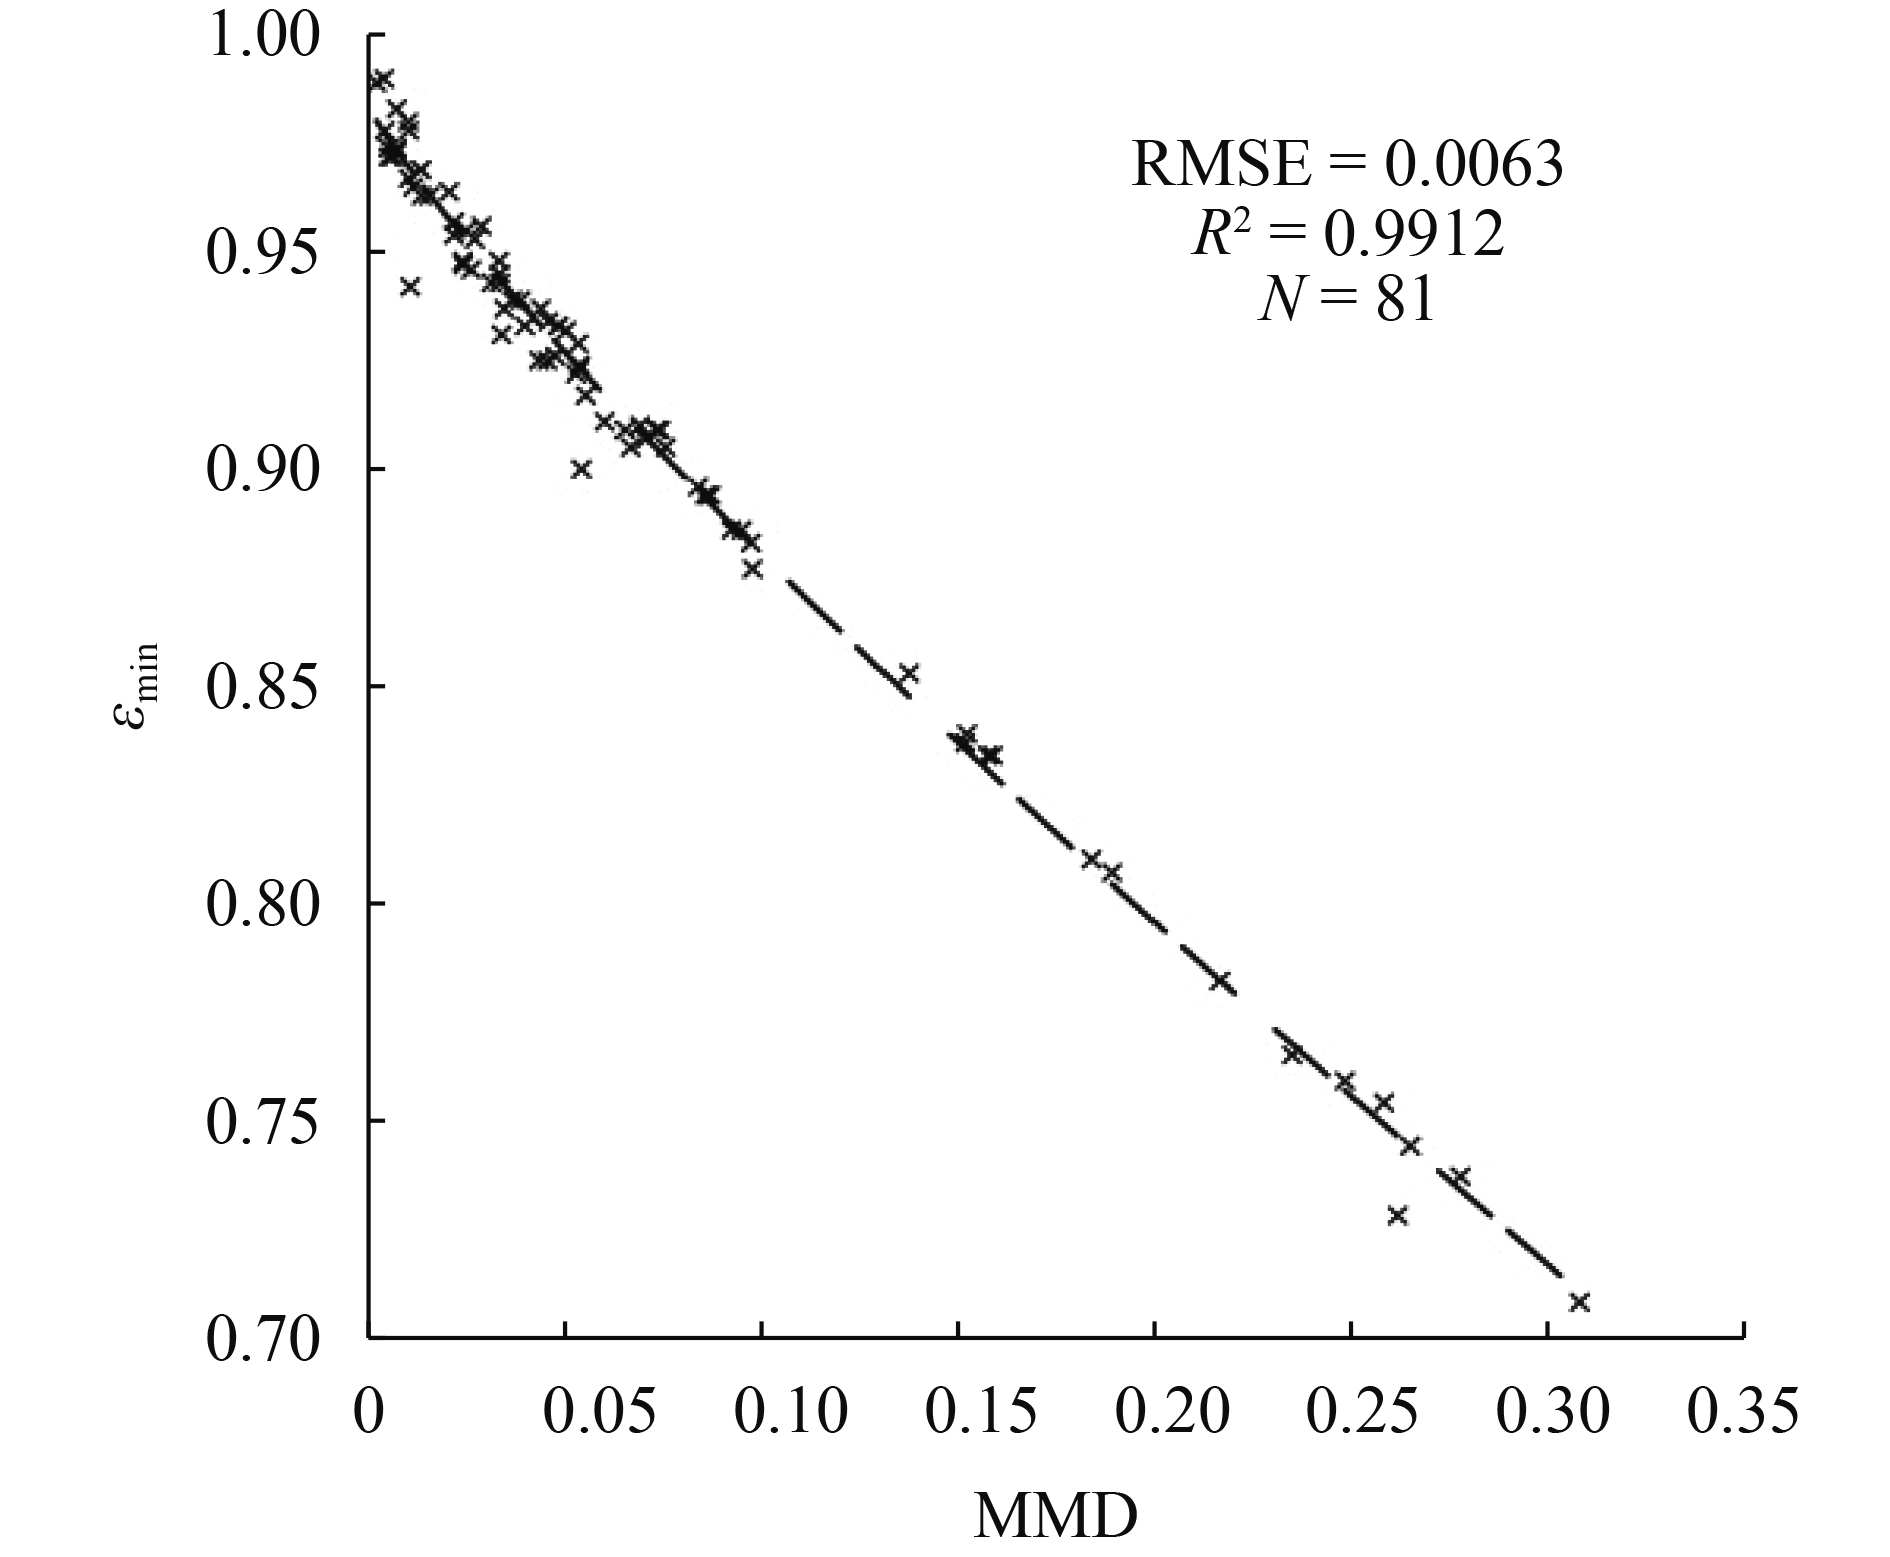
本文利用GF-5 VIMI热红外通道光谱响应函数对81条ASTER发射率波谱数据(包括水体、植被、冰雪、人造地物、土壤和岩石等)进行卷积运算,获取了各热红外波段的通道发射率,然后基于最小发射率回归模型对系数进行模拟,式(18)为GF-5 VIMI热红外通道的MMD与最小发射率的拟合结果;图1为MMD拟合时散点分布图。
| ${\varepsilon _{{\rm{min}}}}{\rm{ = }}0.9865 - 0.7451 \times {{\rm{MMD}}^{0.8455}}$ | (18) |
3 试验数据与处理
3.1 GF-5数据模拟
ASTER传感器与GF-5 VIMI具有相似的波谱分布(图2),为了评价WVSTES算法的精度,本文选取了2012年5月30日—2012年9月19日黑河流域11景无云ASTER作为替代数据(表4),利用数值模拟的方法将ASTER 热红外波段的数据转换成GF-5 VIMI热红外波段的数据。
表 4 ASTER数据成像日期与过境时间
Table 4 List of dates and overpass times of the ASTER data
| 日期 | 过境时间(UTC) |
| 2012-05-30 | 04:19 |
| 2012-06-15 | 04:19 |
| 2012-06-24 | 04:12 |
| 2012-07-10 | 04:13 |
| 2012-08-02 | 04:19 |
| 2012-08-11 | 04:12 |
| 2012-08-18 | 04:19 |
| 2012-08-27 | 04:12 |
| 2012-09-03 | 04:19 |
| 2012-09-12 | 04:12 |
| 2012-09-19 | 04:19 |
ASTER传感器搭载在Terra卫星,由日本和美国合作研制,于1999年12月18日发射。ASTER波谱覆盖了0.52—11.65 μm,共14个波段,其中包含3个可见光近红外波段,空间分辨率15 m;6个短波红外波段,空间分布率为30 m;以及5个热红外波段,空间分辨率为90 m(Yamaguchi 等,1998)。
由于VIMI和ASTER波段设置具有一定的差异(图2),本文以大气辐射传输模型MODTRAN 5.2为基础,利用9136条陆地上空的Seebor大气廓线,同时结合ASTER发射率数据,利用辐射传输方程分别模拟了ASTER和VIMI热红外波段对应的大气层顶辐射亮度,建立了VIMI与ASTER各波段的转换关系(Ye 等,2017),其模拟系数见表5,其中VIMI第11波段采用了ASTER 14和15两个波段。
表 5 ASTER与GF-5 VIMI大气层顶辐亮度转换系数
Table 5 Conversion coefficients of at-sensor radiance between ASTER and GF-5 VIMI
| GF-5 | ASTER | 系数 | R2 | ||
| a | b | c | |||
| Band09 | Band10 | 0.9463367 | 0.0943222 | — | 0.9998 |
| Band10 | Band11 | 1.0155251 | −0.0086296 | — | 0.9999 |
| Band11 | Band14/15 | 0.5855831 | 0.4165008 | 0.001726 | — |
| Band12 | Band15 | 0.8780376 | 0.5688741 | — | 0.9988 |
| $L_{_i}^{\rm{GF-5}} = a \times L_j^{\rm{ASTER}} + b \times L_k^{\rm{ASTER}} + c$ | (19) |
| $L_i^{\rm{GF-5}} = a \times L_j^{\rm{ASTER}} + b$ | (20) |
式中,
3.2 地面验证数据
3.2.1 地表温度数据
“黑河流域生态—水文过程综合遥感观测联合试验”(简称“黑河生态水文遥感试验”,英文名称Heihe Watershed Allied Telemetry Experimental Research,简称HiWATER)是2012年—2015年在黑河流域开展的卫星和航空遥感及地面观测互相配合的多尺度综合观测试验(Li 等,2013)。本文利用了HiWATER 3种地表温度的观测网络数据进行验证,(1) WATERNET无线传感器网络(Jin 等,2012),(2) MUSOEXE自动气象观测站矩阵(Xu 等,2013),以及(3) 定标站。共包括52个地表温度测量站点(图3)。
WATERNET是在黑河中游盈科/大满灌区5.5 km×5.5 km观测矩阵(图3黄色图框)布设的获取生态水文关键参数的无线传感器网络,该传感器网络共有50个节点,其中29个下垫面为玉米的节点安装了SI-111红外辐射计(图3右图);数据观测频率为10 min,当卫星或飞机过境时每分钟观测一次(Jin 等,2012)。MUSOEXE是在黑河流域中游张掖地区构建的两个嵌套的自动气象站(AMS)观测矩阵,利用CNR1/CNR4四分量辐射仪进行观测,观测频率为1 min。张掖绿洲周边的神沙窝(SSW)、花寨子(HZZ)、戈壁(GB)与湿地(SD)4个普通站,观测矩阵大小为30 km×30 km,下垫面涉及绿洲农田、沙漠、荒漠、戈壁和湿地。在绿洲内5.5 km×5.5 km观测区有17个观测站点,利用四分量辐射仪进行测量(Xu 等,2013)。两个定标站主要用于试验期间机载热红外传感器的绝对辐射定标,安装有SI-111红外辐射计;其中低温目标场地位于张掖市正东的二坝水库(EB),高温目标场地位于张掖机场附近的荒漠(JCHM)。
遥感影像像元代表了一定尺度范围内地表信息的综合,而利用地面站点对遥感数据进行验证时,容易受地表异质性结构的影响。为了对验证站点进行空间均一性评价,本文利用11景ASTER影像统计了各站点周围3×3像元大气层顶亮温的标准差,以标准差小于1 K作为衡量标准(Wan,2014;杨贵军 等,2015),最终选取了32个验证站点,其中包括13个WATERNET站点,17个MUSOEXE站点以及2个定标站。
对于SI-111观测,使用以下公式计算地表温度
| $B({T_{\rm{s}}}) = (B({T_{\rm{r}}}) - (1 - \varepsilon){L_{{\rm{sky}}}})/\varepsilon $ | (21) |
式中,B为Planck公式,
对于CNR1/CNR4观测的地表长波辐射数据,使用式(2)计算地表温度
| ${T_{\rm{s}}} = {\left(\frac{{{F^ \uparrow } - (1 - {\varepsilon _{\rm{b}}}) \cdot {F^ \downarrow }}}{{{\varepsilon _{\rm{b}}} \cdot \sigma }}\right)^{1/4}}$ | (22) |
式中,
3.2.2 地表发射率数据
野外试验期间利用CIMEL CE312-2热红外辐射仪和漫反射金板同步测量了地表辐射和大气下行辐射,并使用TES算法反演了地表发射率,测量的样点包括EB站的水体、SD站的芦苇和MUSOEXE AMS15站点的玉米。CE312-2包括5个窄波段和1个宽波段,光谱范围覆盖了8—13 μm。由于CE312-2窄波段与ASTER TIR波段基本一致,为了能够利用CE312-2发射率对VIMI反演的发射率进行验证,本文分别利用CE312-2和VIMI TIR波谱响应函数对81条ASTER发射率波谱进行卷积计算,获得与 CE312-2和VIMI各TIR通道对应的通道发射率,然后利用最小二乘方法对发射率进行回归,最后利用回归系数将CE312-2的通道发射率转换成与VIMI通道对应的发射率,回归系数如表6所示。
表 6 GF-5 VIMI与CE312-2发射率回归系数
Table 6 Regression coefficients of the channel emissivity between GF-5 VIMI and CE312-2
| GF-5 | CE312-2 | 系数 | R2 | ||
| a | b | c | |||
| Band09 | Band1 | 0.8664112 | 0.1273459 | — | 0.9755 |
| Band10 | Band2 | 1.0129350 | −0.0128953 | — | 0.9996 |
| Band11 | Band4/5 | 0.4280704 | 0.6134041 | −0.0399128 | — |
| Band12 | Band5 | 0.6608578 | 0.3341415 | — | 0.9061 |
3.3 MERRA数据
MERRA再分析数据是美国航空航天局通过地球观测系统的资料同化系统提供的再分析资料,致力于天气和气候时间尺度与水循环相关研究。本文使用的MERRA数据空间分辨率为2/3°×1/2°,垂直方向分为42个压强层,共记录了包括地面压强,地面温度以及臭氧混合比等多个数据集(Rienecker 等,2011),其时间分辨率为6 h,本文根据影像成像时间对MEERA数据进行线性插值,得到卫星过境时刻的大气廓线数据。
4 结果与分析
为了验证WVSTES算法的精度,本文利用两种方法对算法进行了验证。(1)利用含误差的Seebor廓线对算法进行验证,由于TES算法对低水汽含量敏感性较低,因此本文将20%水汽误差加入廓线模拟大气校正的残差(Jiménez-Muñoz等,2014)。(2)利用黑河流域11景ASTER数据作为替代数据,分别利用TES和WVSTES算法反演了LST&E,同时将反演结果与地表温度和发射率实测数据进行对比。
4.1 利用模拟数据验证
为评价WVSTES算法对VIMI的适应性,首先利用无水汽误差的大气廓线及81条ASTER发射率数据基于辐射传输方程模拟了大气层顶辐射亮度;然后利用加入20%水汽误差的大气廓线获取含误差的大气参数,用于模拟LST&E反演时大气校正的残差;最后分别利用TES和WVSTES算法进行LST&E反演,验证时计算了偏差(Bias)、标准差(STD)以及均方根误差RMSE(Root-Mean-Square-Error),表7为TES和WVSTES算法的验证结果。
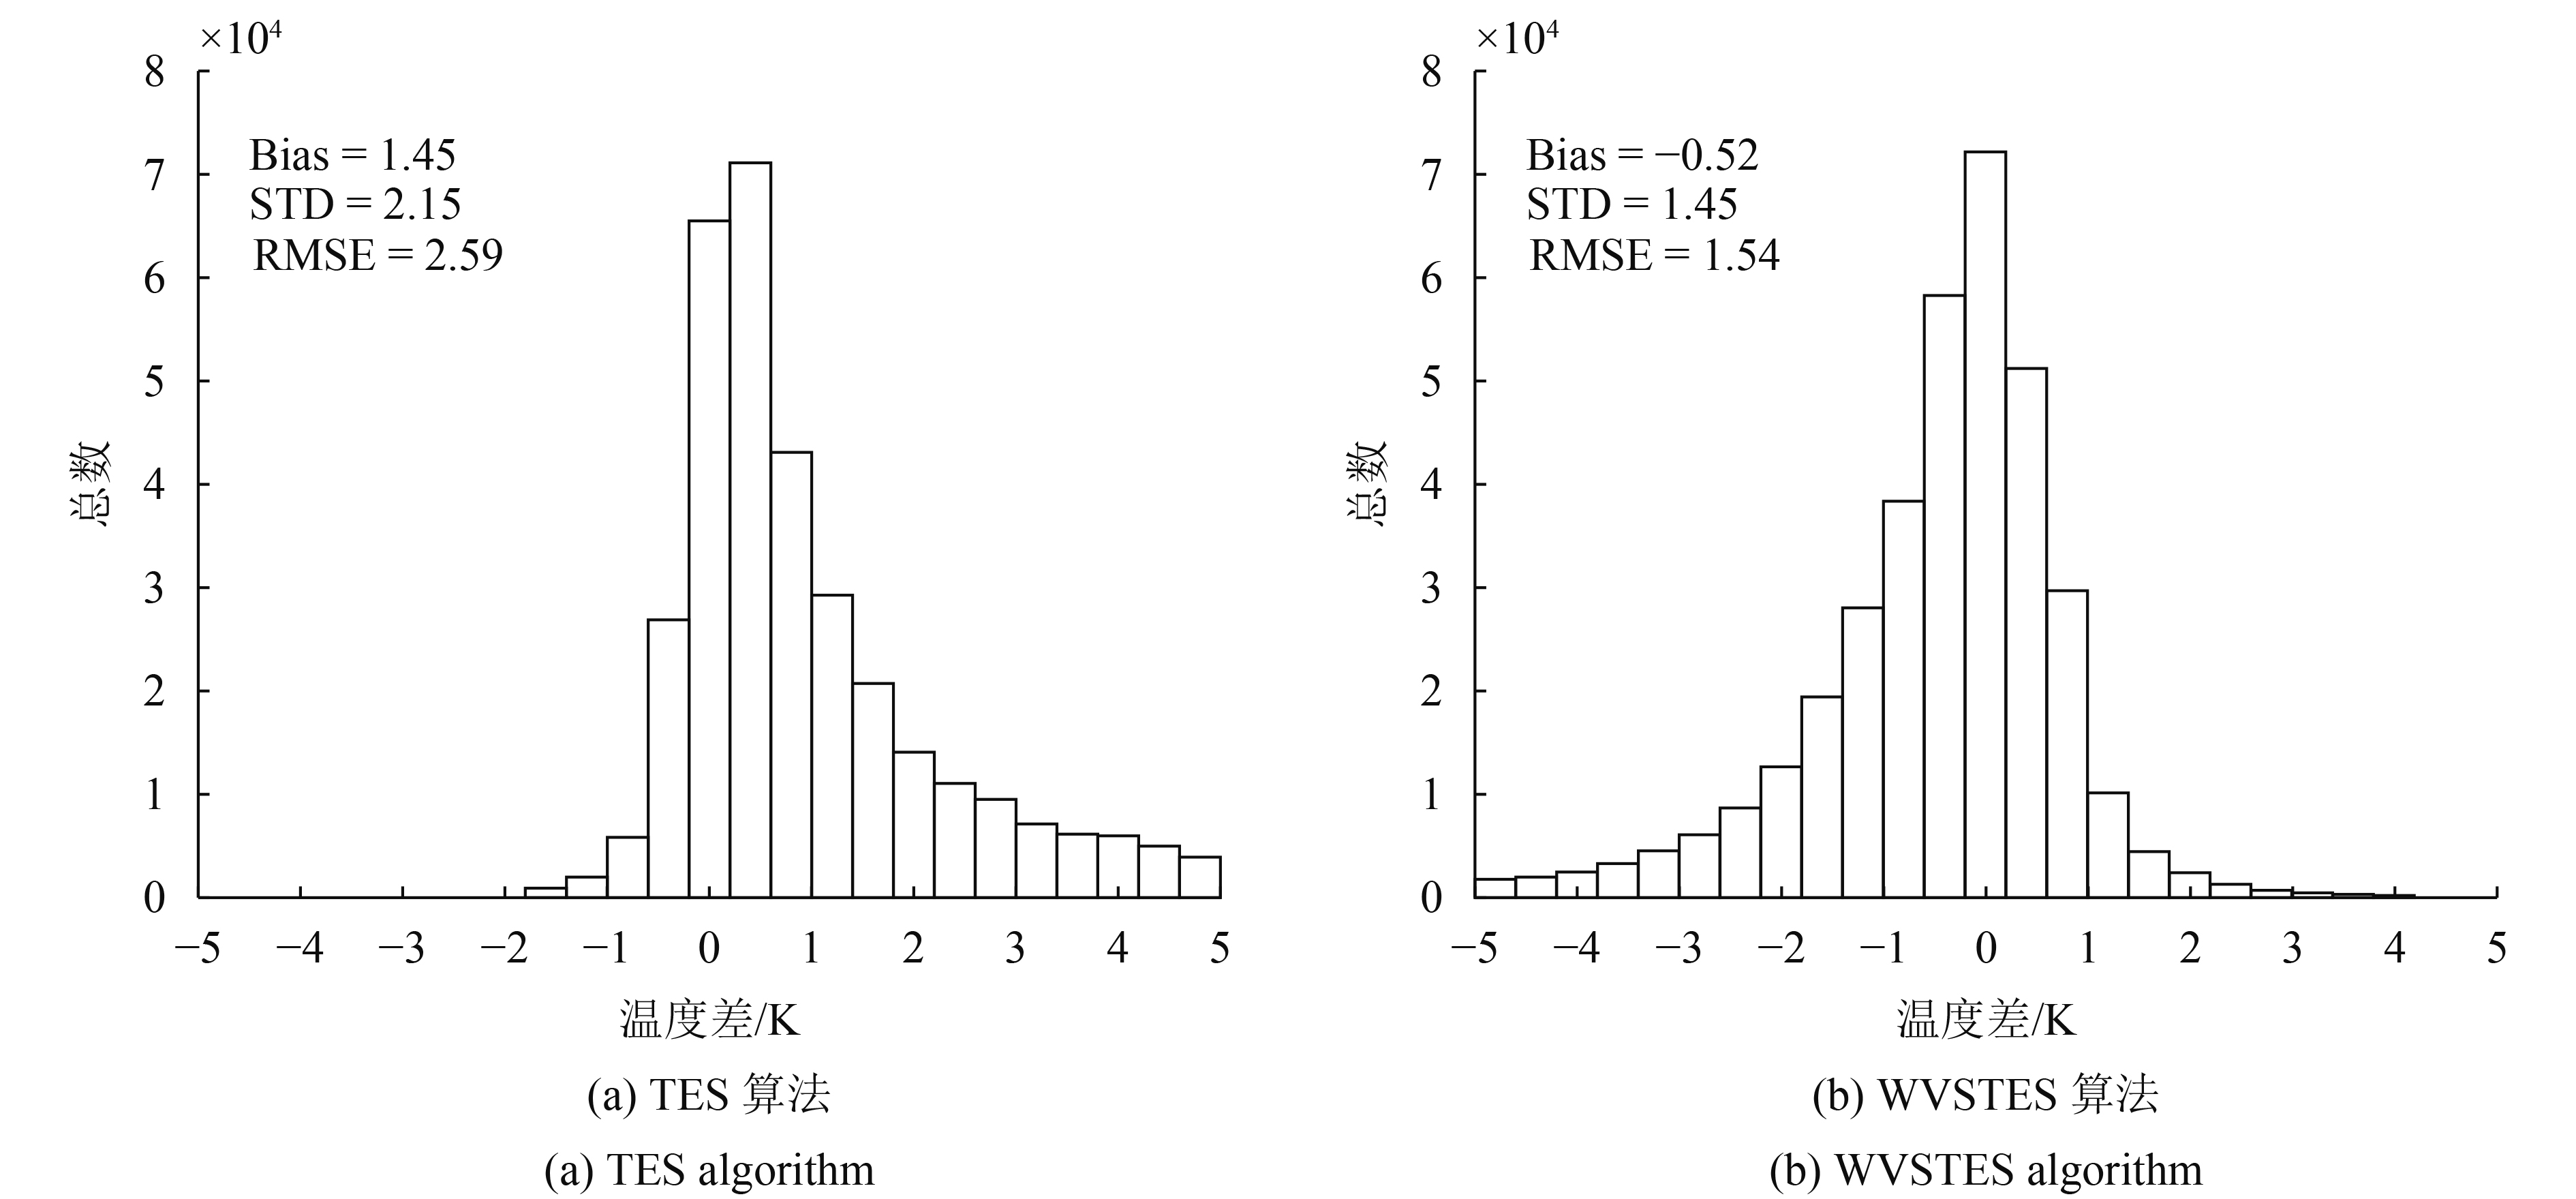
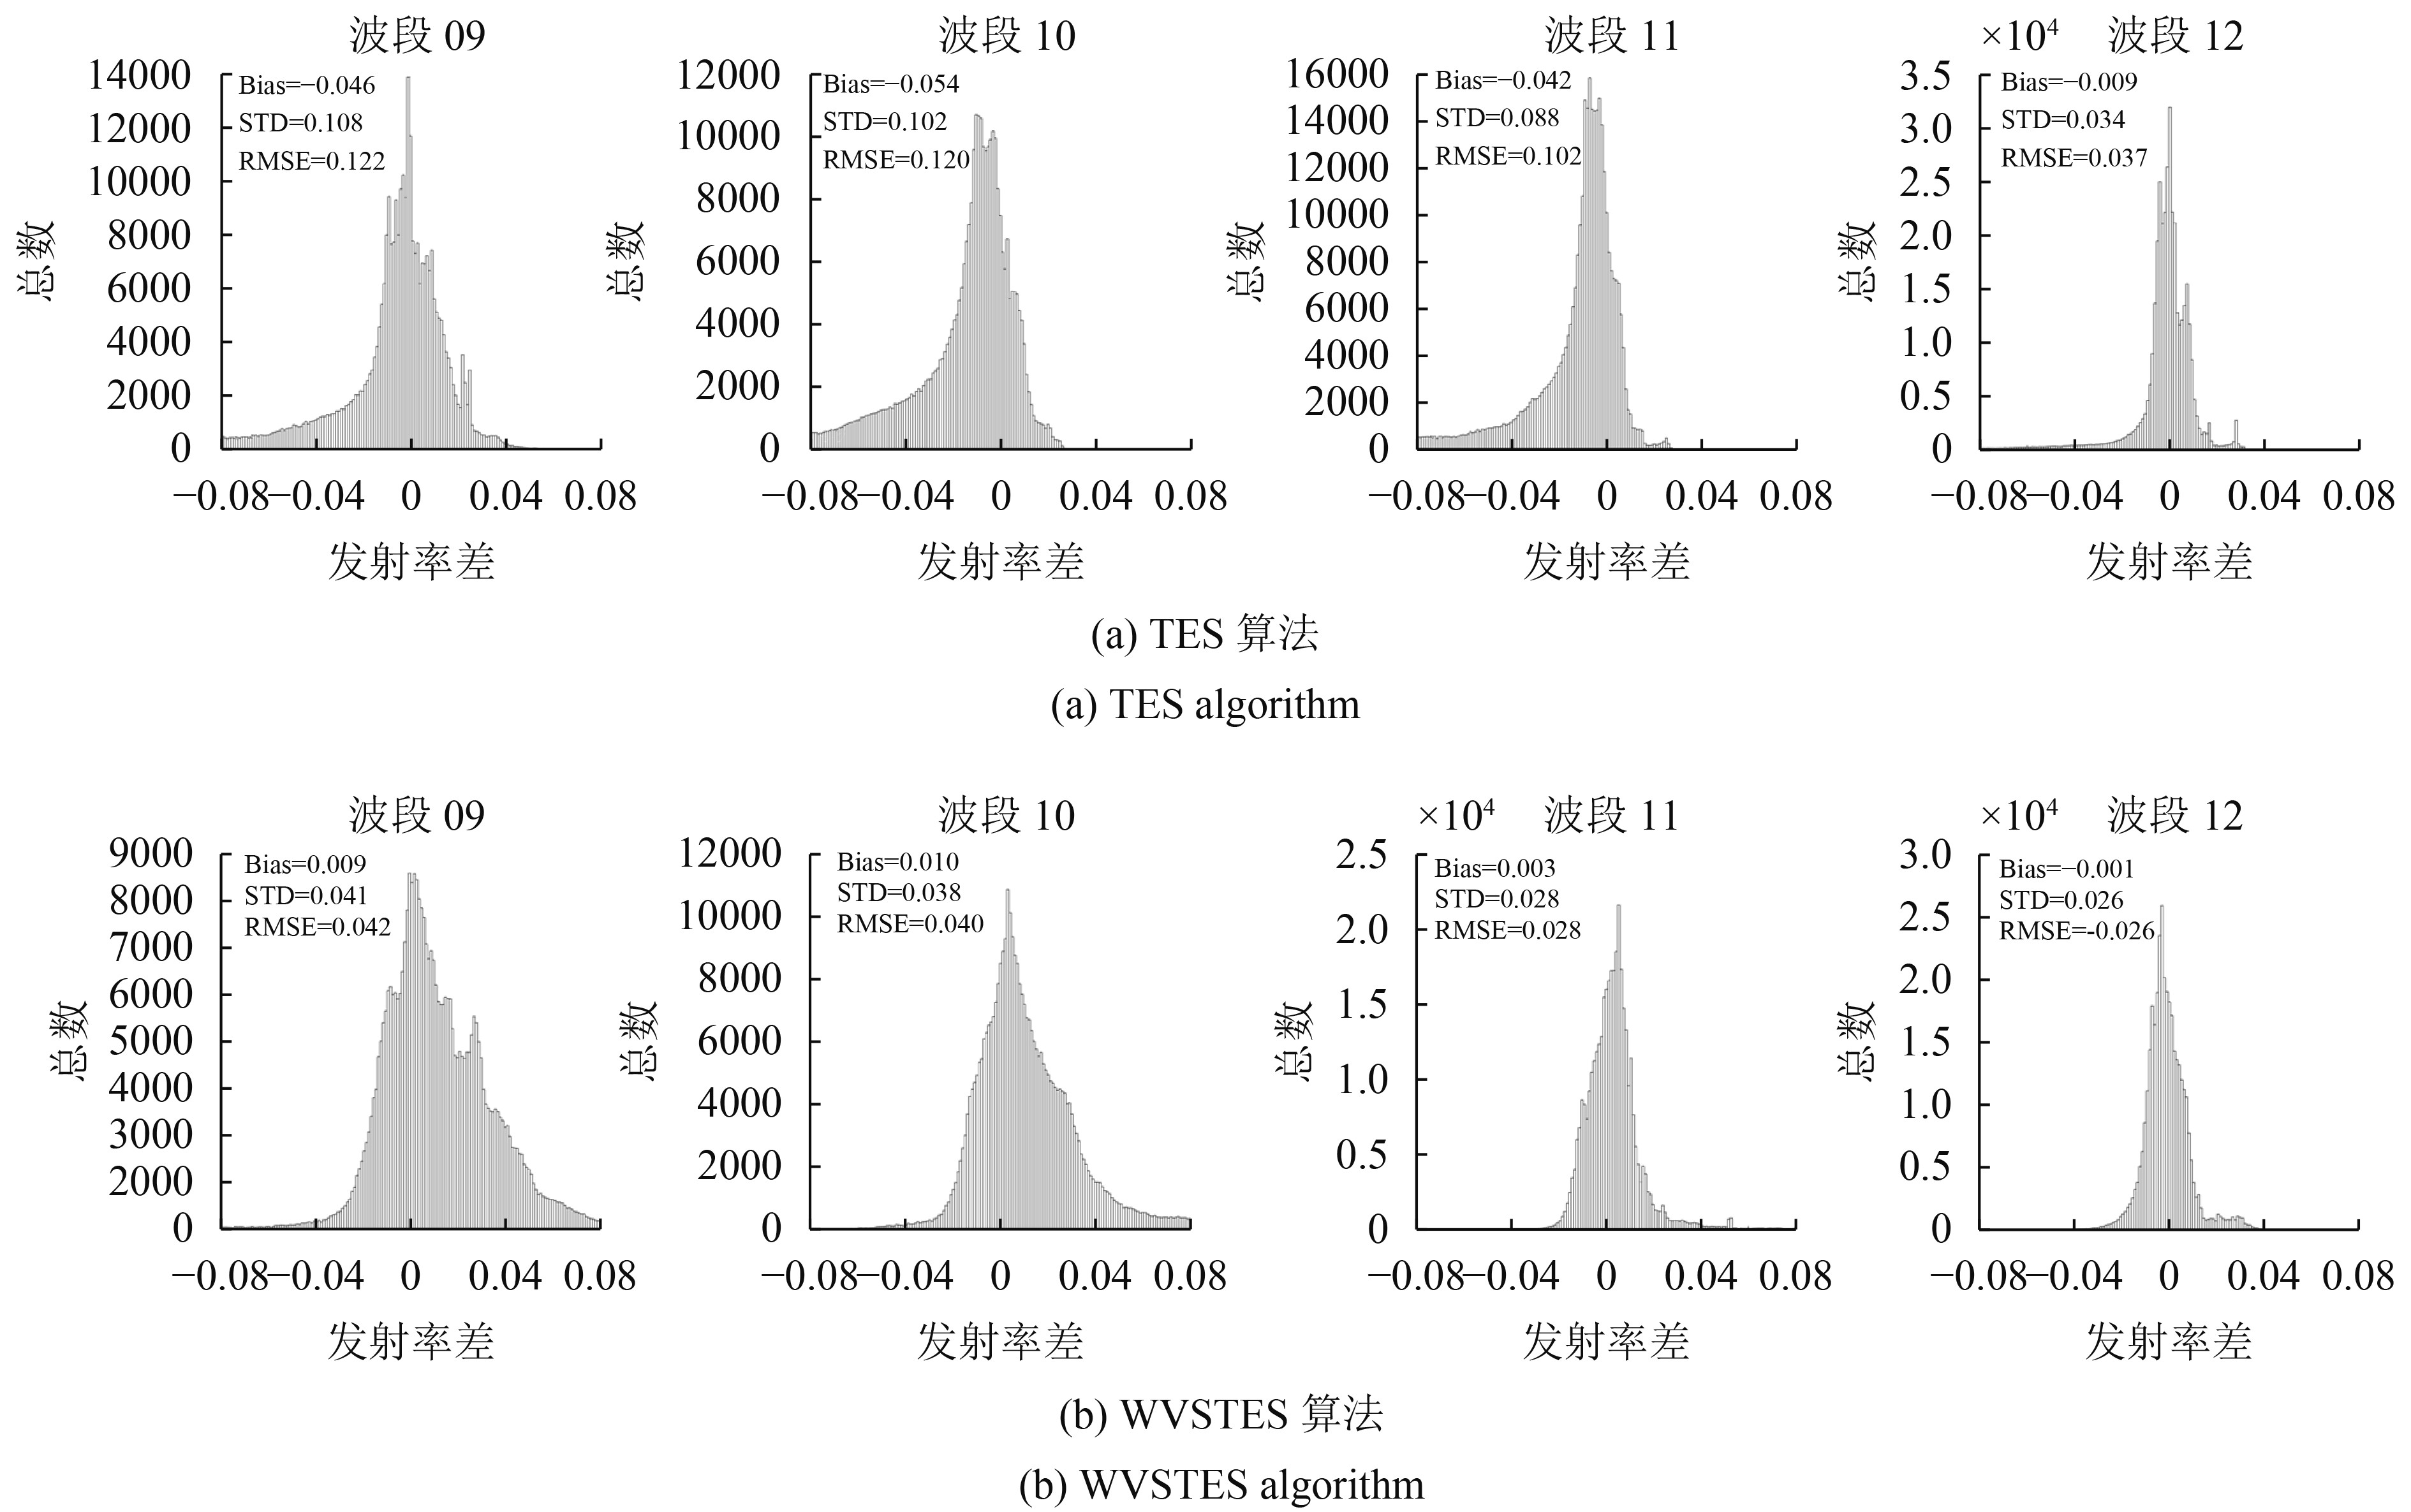
从表7可以看出,TES算法对地表温度高估了1.45 K,严重低估了地表发射率,特别是前3个波段;相比于TES算法,WVSTES算法LST&E总体精度有较大的提高,LST偏差由1.45 K降低到−0.52 K;STD由2.15 K降低到1.45 K;均方根误差由2.59 K减小到1.54 K;同时,各波段LSE误差也得到了不同程度的降低(0.01—0.08),特别是前3个波段RMSE分别由0.122、0.120和0.102降低到0.042、0.040和0.028。图4(a)和图4(b)分别为TES和WVSTES算法LST误差(ΔLST)的直方图,从图中可以看出,当增加20%水汽误差时,TES算法对地表温度存在明显高估;这是因为当水汽含量增大时,大气透过率降低,为了保持大气层顶辐射不变,离地辐射亮度增加,进而导致地表温度升高。而对于WVSTES算法而言(图4(b)),ΔLST直方图符合均值为0的正态分布且误差基本小于2 K,说明该算法能够降低大气校正的误差,提高LST&E反演精度。
表 7 TES和WVSTES算法模拟数据的验证结果
Table 7 Validation results of TES and WVSTES algorithm using simulated data
| TES | WVSTES | ||||||
| Bias | STD | RMSE | Bias | STD | RMSE | ||
| LST | 1.45 | 2.15 | 2.59 | −0.52 | 1.45 | 1.54 | |
| LSE Band 09 | −0.046 | 0.108 | 0.122 | 0.009 | 0.041 | 0.042 | |
| LSE Band 10 | −0.054 | 0.102 | 0.120 | 0.010 | 0.038 | 0.040 | |
| LSE Band 11 | −0.042 | 0.088 | 0.102 | 0.003 | 0.028 | 0.028 | |
| LSE Band 12 | −0.009 | 0.034 | 0.037 | −0.001 | 0.026 | 0.026 | |
图5为两种算法4个热红外波段LSE的误差直方图。从图5中可以看出TES算法受大气校正误差的影响更为严重,由于高估温度,导致发射率被低估,前3个波段的绝对Bias都大于0.04,RMSE除第4波段外均大于0.1。而WVSTES误差直方图呈对称分布,无明显高估或低估现象,并且Bias较小,均小于0.01。与TES算法相似,WVSTES算法前两个波段RMSE比后两个波段更大,主要是由于前两个波段位于8—9 μm,更容易受大气的影响,且前两个波段的地表发射率动态范围也更大。
本文还利用模拟数据对不同地表类型下TES和WVSTES算法的精度进行了验证,选取的地物类型包括灰体(水体、冰雪、植被)、人造地物以及土壤。表8为TES算法地表温度和各通道发射率的Bias和RMSE,表9为WVSTES算法地表温度和各通道发射率的Bias和RMSE。对比表8和表9可以看出WVSTES算法反演的地表温度具有更高的精度,尤其是灰体区域,其RMSE从TES算法的2.53 K下降到WVSTES算法的0.87 K;不同地表类型下LSE RMSE精度约提高了0.01—0.09,特别是前3个波段提高了0.08左右。此外,从灰体模拟结果来看,WVSTES算法能够较好的改进TES算法在高水汽含量下灰体区域精度较差的情况,反演得到更高精度的LST&E。
表 8 不同地表类型的TES算法精度
Table 8 The accuracy of TES algorithm for different land surface types
| LST/K | Band 09 | Band 10 | Band 11 | Band 12 | ||||||||||
| Bias | RMSE | Bias | RMSE | Bias | RMSE | Bias | RMSE | Bias | RMSE | |||||
| 灰体 | 1.45 | 2.53 | −0.044 | 0.124 | −0.051 | 0.120 | −0.040 | 0.097 | −0.006 | 0.031 | ||||
| 人造地物 | 1.26 | 2.54 | −0.039 | 0.121 | −0.049 | 0.119 | −0.038 | 0.100 | −0.004 | 0.033 | ||||
| 土壤 | 1.47 | 2.61 | −0.046 | 0.123 | −0.054 | 0.121 | −0.042 | 0.102 | −0.009 | 0.035 | ||||
表 9 不同地表类型的WVSTES算法精度
Table 9 The accuracy of WVSTES algorithm for different land surface types
| LST/K | Band 09 | Band 10 | Band 11 | Band 12 | ||||||||||
| Bias | RMSE | Bias | RMSE | Bias | RMSE | Bias | RMSE | Bias | RMSE | |||||
| 灰体 | 0.03 | 0.87 | −0.002 | 0.032 | −0.001 | 0.030 | 0.002 | 0.025 | 0.004 | 0.025 | ||||
| 人造地物 | −0.63 | 1.17 | 0.021 | 0.043 | 0.014 | 0.036 | 0.008 | 0.027 | 0.005 | 0.016 | ||||
| 土壤 | −0.43 | 1.25 | 0.011 | 0.040 | 0.010 | 0.035 | 0.002 | 0.026 | −0.001 | 0.023 | ||||
4.2 地面站点验证
4.2.1 地表温度验证
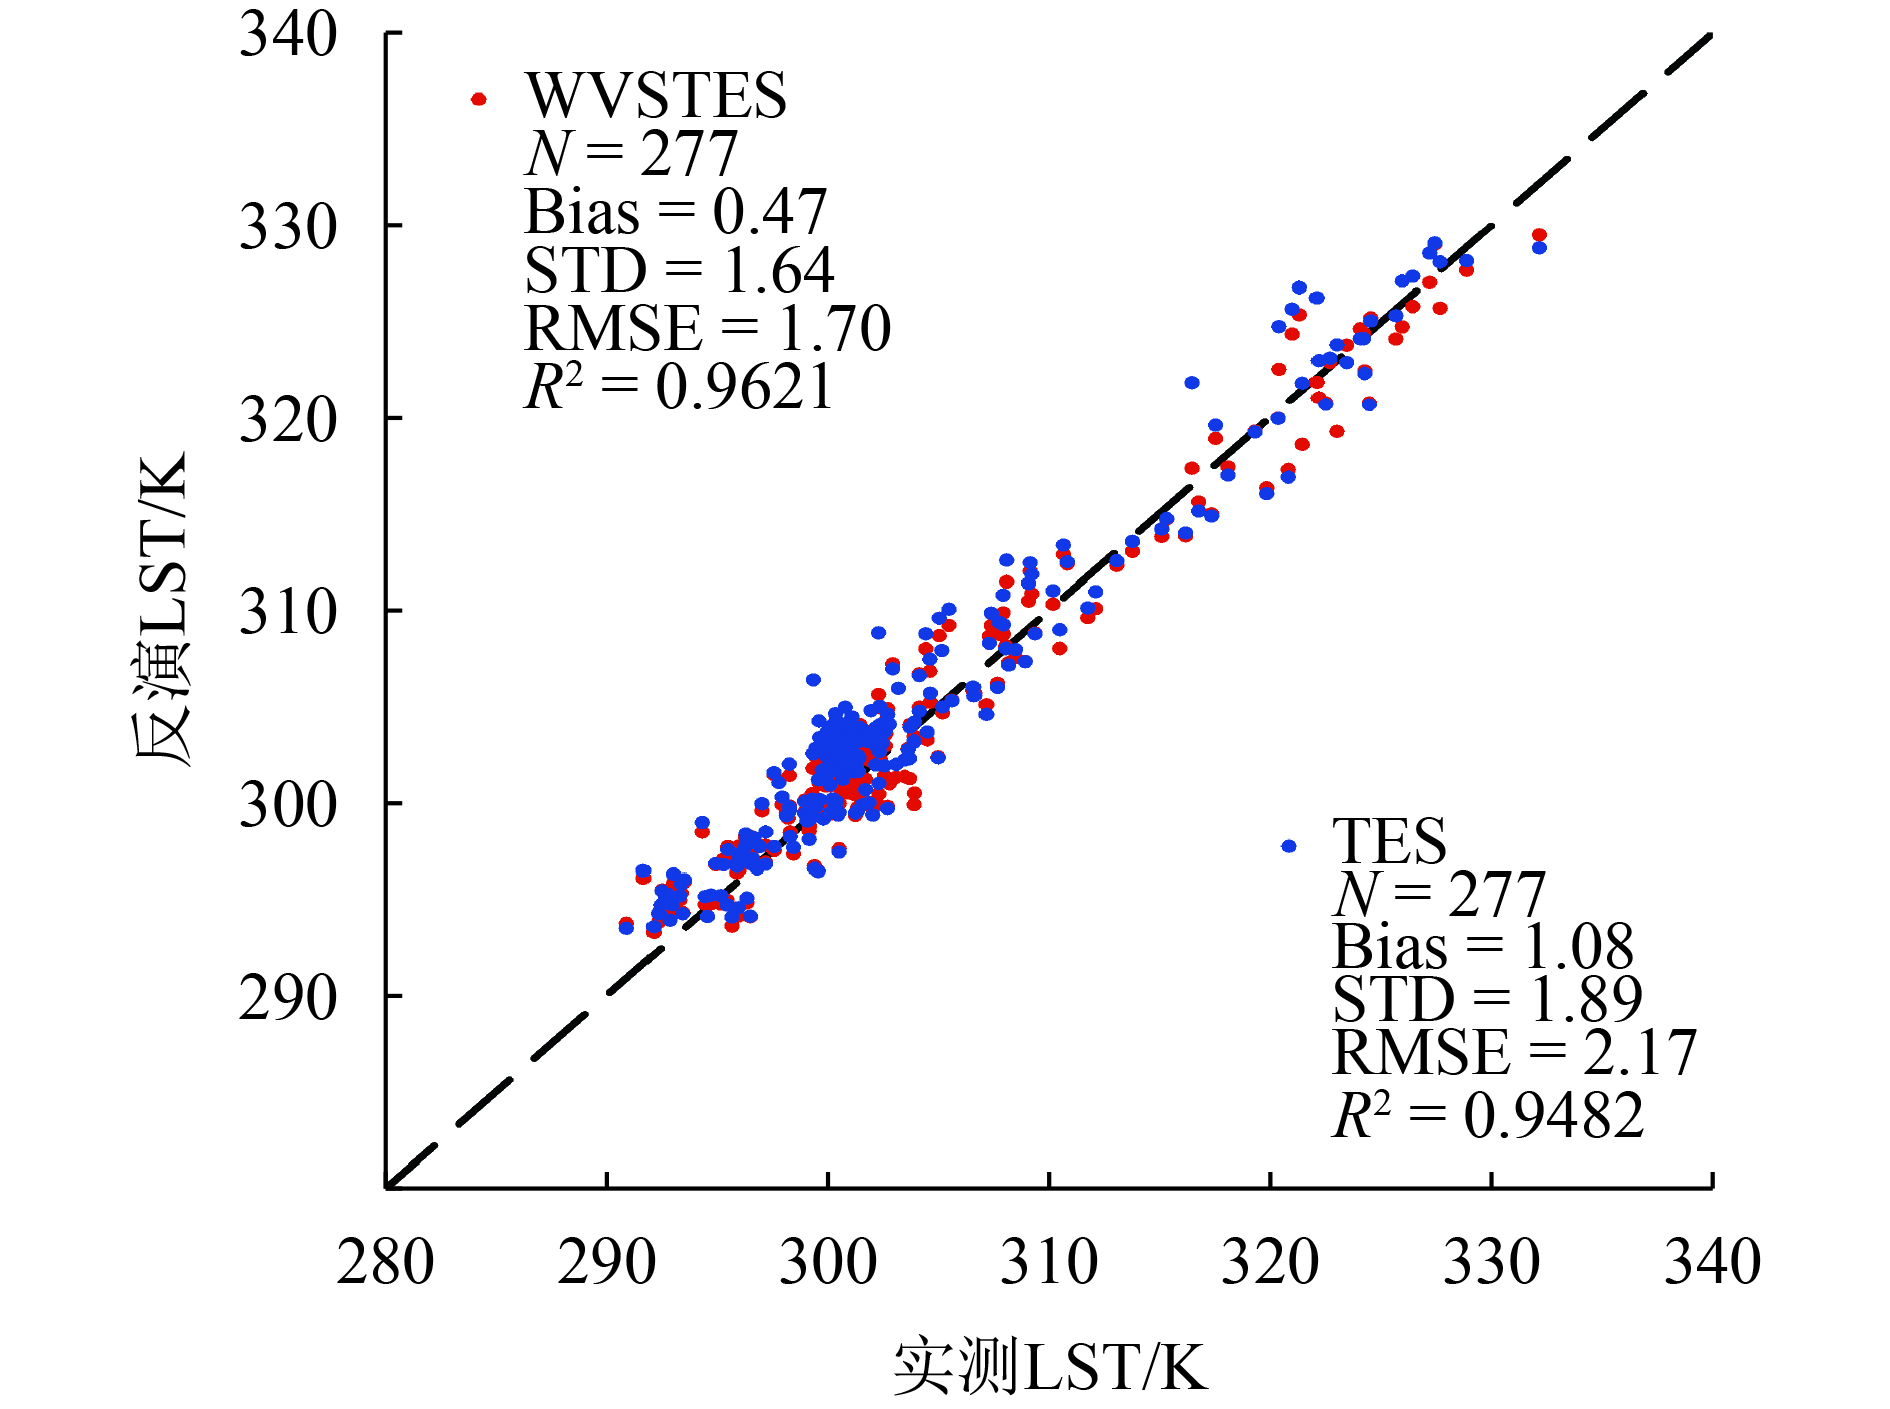
本文通过将卫星过境时间与地表实测数据时间相匹配,提取了HiWATER各站点对应的LST反演结果,共284个验证数据,同时分别计算了Bias、STD以及RMSE对反演结果进行定量化描述。对比发现部分反演结果与实测值之间存在较大的误差,因此为了获取可靠的验证结果,在验证时利用阈值对异常值进行剔除,本文采用3倍算法理论误差作为异常值去除的条件(Sobrino和Julien,2016)。对于TES算法,地表温度的理论误差是1.5 K,因此本文用4.5 K作为异常值的剔除条件,最终有277个点用于LST结果的验证。图6为反演LST与地面实测数据的散点图,其中红色为WVSTES算法反演结果,蓝色为TES算法反演结果。由整体统计结果可知,TES算法高估了LST,Bias为1.08 K,STD和RMSE分别为1.89 K和2.17 K;而WVSTES算法具有更高的LST反演精度,Bias、STD和RMSE都更小,其中Bias为0.47 K,与TES算法相比降低了0.61 K;STD和RMSE分别为1.64 K和1.7 K,分别减小了0.25 K和0.47 K。WVSTES算法反演结果与实测值的决定系数
表10是两种算法11天数据的验证结果。从表中可以看出TES算法11天LST结果的Bias介于−1.06—3.01 K,其中5天的Bias大于1 K;而WVSTES算法的Bias介于−1.01—1.07 K,基本都在±1 K以内,说明WVSTES具有更高的精度。TES算法11天的RMSE介于1.2—3.5 K之间,WVSTES算法11天的RMSE介于1.1—2.1 K之间。TES算法Bias和RMSE的最大值出现在8月11号,分别为3.01 K和3.47 K,这是由于高水汽含量(3.05 g/cm2)导致的结果,而WVSTES算法的Bias和RMSE分别为−0.12 K和1.73 K,这说明WVSTES算法能在高水汽含量下具有更高的反演精度,这与Tonooka (2005a)和Hulley等(2012)的结果一致。
表 10 两种算法反演的地表温度结果与32个地面站点实测数据验证结果
Table 10 Evaluation results between LST retrieved from two algorithm and ground measurements at 32 sites
| 日期 | N | TES/K | WVSTES/K | |||||
| Bias | STD | RMSE | Bias | STD | RMSE | |||
| 2012-05-30 | 8 | −1.06 | 1.66 | 1.87 | −1.01 | 1.61 | 1.81 | |
| 2012-06-15 | 22 | 1.33 | 2.06 | 2.41 | 0.64 | 1.96 | 2.02 | |
| 2012-06-24 | 23 | 0.49 | 1.91 | 1.93 | 0.70 | 1.81 | 1.90 | |
| 2012-07-10 | 29 | 1.86 | 1.58 | 2.43 | 1.07 | 1.54 | 1.86 | |
| 2012-08-02 | 30 | 1.20 | 1.19 | 1.68 | 1.05 | 1.11 | 1.51 | |
| 2012-08-11 | 31 | 3.01 | 1.75 | 3.47 | −0.12 | 1.76 | 1.73 | |
| 2012-08-18 | 30 | 0.13 | 1.23 | 1.21 | 0.19 | 1.13 | 1.13 | |
| 2012-08-27 | 29 | 1.50 | 1.30 | 1.97 | 0.45 | 1.34 | 1.39 | |
| 2012-09-03 | 32 | 0.29 | 1.72 | 1.72 | 0.33 | 1.70 | 1.71 | |
| 2012-09-12 | 29 | 1.17 | 1.9 | 2.2 | 0.87 | 1.84 | 2.01 | |
| 2012-09-19 | 14 | −0.52 | 1.76 | 1.77 | −0.35 | 1.6 | 1.58 | |
| 总计 | 277 | 1.08 | 1.89 | 2.17 | 0.47 | 1.64 | 1.70 | |
4.2.2 地表发射率验证
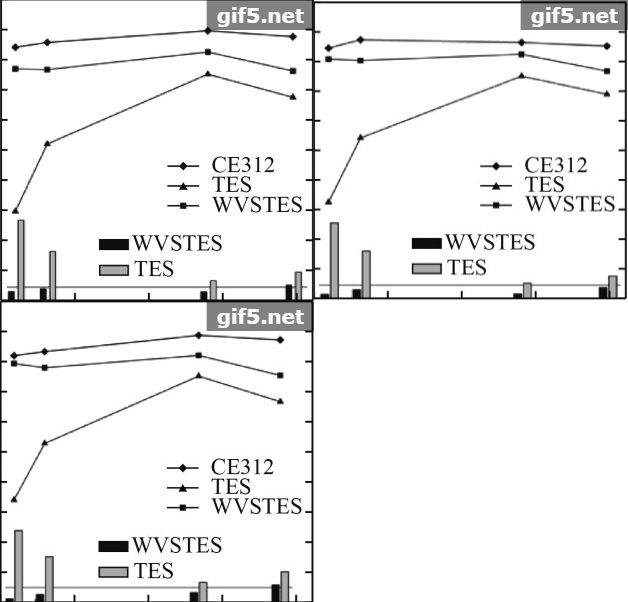
为了验证GF-5 WVSTES算法LSE反演结果,将WVSTES和TES算法反演的LSE与CE312-2测量的发射率进行对比。选取了6月24日水体(EB)、芦苇(SD)和玉米(AMS15)作为LSE验证站点,图7为WVSTES, TES以及实测LSE验证结果。从图中可以看出,TES算法的LSE结果低估严重,特别是前两个通道,这与TES算法高估LST的结果一致。WVSTES算法反演的LSE发射率波谱形状与实测值基本保持一致,二者相差结果较小,而TES算法的发射率波谱有较大偏差,与实际情况不符。图7中直方图代表以上验证点分别利用WVSTES和TES算法反演LSE与实测值之间的差异,其中黑色为WVSTES算法结果,灰色为TES算法结果。从图中可以看出,TES算法受大气校正残差的影响较大,LSE反演结果与实测值之间误差均大于0.01,其中各波段最小偏差分别为0.048、0.030、0.011和0.016;而WVSTES算法能够提高LSE反演的精度,误差能够达到1%的理论精度。
5 结 论
本文提出了一个适用于GF-5 VIMI数据的地表温度和发射率分离算法,为了提高大气校正精度,该算法加入了WVS大气校正方法。该算法首先利用快速辐射传输模型RTTOV和MERRA再分析数据进行大气校正,再利用WVS方法改进大气校正结果,最后利用TES算法同时反演地表温度和发射率。为了评价算法精度,选取了Seebor V5.0大气廓线库中9136条陆地上空的晴空大气廓线进行了模拟验证。首先利用真实的大气廓线模拟了大气层顶辐射亮度,然后对大气廓线数据加入20%的水汽误差以模拟大气校正的残差,再利用模拟数据分别对TES算法和WVSTES算法进行精度验证。验证结果表明加入WVS方法后TES算法反演地表温度的RMSE由2.59 K降低到1.54 K,4个波段地表发射率RMSE分别由0.122、0.12、0.10和0.037降低到0.042、0.04、0.028和0.026;此外,不同地表类型下TES和WVSTES算法精度也进行了模拟,验证结果表明加入WVS算法后不同地表类型地表温度RMSE降低了约1.5 K,各通道发射率RMSE降低了0.01—0.09,特别是前3个通道约0.08;模拟结果说明WVSTES算法能够精确进行大气校正,反演更加准确的地表温度和发射率。
此外,本文还利用黑河流域的ASTER数据模拟了GF-5 VIMI影像,并利用同步的实测地表温度和发射率数据对算法精度进行了验证。结果表明TES算法高估了地表温度,Bias和RMSE分别为1.08 K和2.17 K;WVSTES算法反演结果与实测LST有更好的一致性,Bias和RMSE分别为0.47 K和1.7 K,相比TES算法分别降低了0.61 K和0.47 K。同时利用CE312-2实测的地表发射率数据对LSE反演结果进行了验证,结果表明WVSTES算法能够明显降低大气校正误差对结果的影响,各波段发射率RMSE均小于0.01。以上结果表明,WVSTES算法能够取得较高的地表温度和发射率反演精度,适用于GF-5 VIMI的地表温度和发射率反演。本文在利用ASTER数据模拟GF-5 VIMI的数据时只进行了光谱转换,并没有考虑两种数据空间分辨率的差异,因此今后将采用更多真实GF-5数据对算法进行测试和验证。
本文在进行地表温度和发射率反演时仅计算了灰体区域的水汽调节因子,而对于非灰体区域的水汽调节因子通过反距离加权法插值和平滑得到可能会产生一定的误差;下一步工作将对非灰体区域水汽调节因子的计算进行改进,实现更高精度的大气校正。
志 谢 此次实验的MERRA数据从NASA GES DISC下载,ASTER数据从Earthdata(https://earthdata.nasa.gov/)下载,地面验证数据来自于HiWATER实验,GF-5 RTTOV系数由James hocking提供,在此表示衷心的感谢!
参考文献(References)
-
Borbas E E, Seemann S W, Huang H L, Li J and Menzel W P. 2005. Global profile training database for satellite regression retrievals with estimates of skin temperature and emissivity//Proceeding of International ATOVS Study Conference. Beijing, China: ATOVS: 763-770.
-
Cheng J, Liang S L, Yao Y J and Zhang X T. 2013. Estimating the optimal broadband emissivity spectral range for calculating surface longwave net radiation. IEEE Geoscience and Remote Sensing Letters, 10 (2): 401–405. [DOI: 10.1109/LGRS.2012.2206367]
-
Coll C, Caselles V, Valor E, Niclòs R, Sánchez J M, Galve J M and Mira M. 2007. Temperature and emissivity separation from ASTER data for low spectral contrast surfaces. Remote Sensing of Environment, 110 (2): 162–175. [DOI: 10.1016/j.rse.2007.02.008]
-
Dash P, Göttsche F M, Olesen F S and Fischer H. 2002. Land surface temperature and emissivity estimation from passive sensor data: theory and practice-current trends. International Journal of Remote Sensing, 23 (13): 2563–2594. [DOI: 10.1080/01431160110115041]
-
Du C, Ren H Z, Qin Q M, Meng J J and Zhao S H. 2015. A practical split-window algorithm for estimating land surface temperature from Landsat 8 data. Remote Sensing, 7 (1): 647–665. [DOI: 10.3390/rs70100647]
-
Fan B, Chen X, Li B C and Zhao Y H. 2017. Technical innovation of optical remote sensing payloads onboard GF-5 satellite. Infrared and Laser Engineering, 46 (1): 8–14. [DOI: 10.3788/IRLA201746.0102002] ( 范斌, 陈旭, 李碧岑, 赵艳华. 2017. " 高分五号”卫星光学遥感载荷的技术创新. 红外与激光工程, 46 (1): 8–14. [DOI: 10.3788/IRLA201746.0102002] )
-
Francois C and Ottle C. 1996. Atmospheric corrections in the thermal infrared: global and water vapor dependent split-window algorithms-applications to ATSR and AVHRR data. IEEE Transactions on Geoscience and Remote Sensing, 34 (2): 457–470. [DOI: 10.1109/36.485123]
-
Gillespie A, Rokugawa S, Hook S J, Matsunaga T and Kahle A B. 1999. Temperature/Emissivity Separation Algorithm Theoretical Basis Document, Version 2.4. Pasadena, CA: Jet Propulsion Laboratory.
-
Gillespie A, Rokugawa S, Matsunaga T, Cothern J S, Hook S and Kahle A B. 1998. A temperature and emissivity separation algorithm for Advanced Spaceborne Thermal Emission and Reflection Radiometer (ASTER) images. IEEE Transactions on Geoscience and Remote Sensing, 36 (4): 1113–1126. [DOI: 10.1109/36.700995]
-
Gillespie A R, Abbott E A, Gilson L, Hulley G, Jiménez-Muñoz J C and Sobrino J A. 2011. Residual errors in ASTER temperature and emissivity standard products AST08 and AST05. Remote Sensing of Environment, 115 (12): 3681–3694. [DOI: 10.1016/j.rse.2011.09.007]
-
Hocking J, Rayer P, Saunders R, Matricardi M, Geer A and Brunel P and Vidot J. 2015. RTTOV v11 Users Guide Doc ID: NWPSAF-MO-UD-028, available at: www.nwpsaf.eu/site/download/documentation/rtm/docs_rttov/users
-
Hook S J, Gabell A R, Green A A and Kealy P S. 1992. A comparison of techniques for extracting emissivity information from thermal infrared data for geologic studies. Remote Sensing of Environment, 42 (2): 123–135. [DOI: 10.1016/0034-4257(92)90096-3]
-
Huang C L, Xin L and Ling L. 2008. Retrieving soil temperature profile by assimilating MODIS LST products with ensemble Kalman filter. Remote Sensing of Environment, 112 (4): 1320–1336. [DOI: 10.1016/j.rse.2007.03.028]
-
Hulley G C and Hook S J. 2011. Generating consistent land surface temperature and emissivity products between ASTER and MODIS data for earth science research. IEEE Transactions on Geoscience and Remote Sensing, 49 (4): 1304–1315. [DOI: 10.1109/TGRS.2010.2063034]
-
Hulley G C and Hook S J. 2012. A radiance-based method for estimating uncertainties in the Atmospheric Infrared Sounder (AIRS) land surface temperature product. Journal of Geophysical Research: Atmospheres, 117 (D20): D20117 [DOI: 10.1029/2012JD018102]
-
Hulley G C, Hook S J and Baldridge A M. 2009. Validation of the North American ASTER land surface emissivity database (NAALSED) version 2.0 using pseudo-invariant sand dune sites. Remote Sensing of Environment, 113 (10): 2224–2233. [DOI: 10.1016/j.rse.2009.06.005]
-
Hulley G C, Hughes C G and Hook S J. 2012. Quantifying uncertainties in land surface temperature and emissivity retrievals from ASTER and MODIS thermal infrared data. Journal of Geophysical Research: Atmospheres, 117 (D23): D23113 [DOI: 10.1029/2012JD018506]
-
Islam T, Hulley G C, Malakar N K, Radocinski R G, Guillevic P C and Hook S J. 2017. A physics-based algorithm for the simultaneous retrieval of land surface temperature and emissivity from VIIRS thermal infrared data. IEEE Transactions on Geoscience and Remote Sensing, 55 (1): 563–576. [DOI: 10.1109/TGRS.2016.2611566]
-
Jiménez-Muñoz J C and Sobrino J A. 2003. A generalized single-channel method for retrieving land surface temperature from remote sensing data. Journal of Geophysical Research: Atmospheres, 108 (D22): ACL 2 [DOI: 10.1029/2003JD003480]
-
Jiménez-Muñoz J C, Sobrino J A, Mattar C, Hulley G and Göttsche F M. 2014. Temperature and emissivity separation from MSG/SEVIRI data. IEEE Transactions on Geoscience and Remote Sensing, 52 (9): 5937–5951. [DOI: 10.1109/TGRS.2013.2293791]
-
Jin R, Li X, Yan B P, Luo W M, Li X H, Guo J W, Ma M G, Kang J and Zhang J L. 2012. Introduction of eco-hydrological wireless sensor network in the Heihe River Basin. Advances in Earth Science, 27 (9): 993–1005. [DOI: 10.11867/j.issn.1001-8166.2012.09.0993] ( 晋锐, 李新, 阎保平, 罗万明, 李秀红, 郭建文, 马明国, 亢健, 张艳林. 2012. 黑河流域生态水文传感器网络设计. 地球科学进展, 27 (9): 993–1005. [DOI: 10.11867/j.issn.1001-8166.2012.09.0993] )
-
Kneizys F X, Robertson D C, Abreu L W, Acharya P, Anderson G P, Rothman L S, Chetwynd J H, Selby J E A, Shettle E P, Gallery W O, Berk A, Clough S A and Bernstein L S. 1996. The MODTRAN 2/3 Report and LOWTRAN 7 MODEL. Hanscom: Phillips Laboratory, Geophysics Directorate.
-
Kondratyev K Y. 1969. Radiation in the Atmosphere [Electronic Resource]. New York : Academic Press.
-
Li H, Liu Q H, Zhong B, Du Y M, Wang H S, Wang Q. 2010. A Single-channel algorithm for land surface temperature retrieval from HJ-1B/IRS data based on a Parametric Model//Proceedings of 2010 IEEE International Geoscience and Remote Sensing Symposium. Honolulu, HI, USA: IEEE: 2448-2451 [DOI: 10.1109/IGARSS.2010.5649801]
-
Li H, Liu Q H, Du Y M, Jiang J X and Wang H S. 2013. Evaluation of the NCEP and MODIS atmospheric products for single channel land surface temperature retrieval with ground measurements: a case study of HJ-1B IRS data. IEEE Journal of Selected Topics in Applied Earth Observations and Remote Sensing, 6 (3): 1399–1408. [DOI: 10.1109/JSTARS.2013.2255118]
-
Li H, Sun D L, Yu Y Y, Wang H Y, Liu Y L, Liu Q H, Du Y M, Wang H S and Cao B. 2014. Evaluation of the VIIRS and MODIS LST products in an arid area of Northwest China. Remote Sensing of Environment, 142 : 111–121. [DOI: 10.1016/j.rse.2013.11.014]
-
Li X, Cheng G D, Liu S M, Xiao Q, Ma M G, Jin R, Che T, Liu Q H, Wang W Z, Qi Y, Wen J G, Li H Y, Zhu G F, Guo J W, Ran Y H, Wang S G, Zhu Z L, Zhou J, Hu X L and Xu Z W. 2013. Heihe watershed allied telemetry experimental research (HiWATER): scientific objectives and experimental design. Bulletin of the American Meteorological Society, 94 (8): 1145–1160. [DOI: 10.1175/BAMS-D-12-00154.1]
-
Li Z L, Wu H, Wang N, Qiu S, Sobrino J A, Wan Z M, Tang B H and Yan G J. 2013. Land surface emissivity retrieval from satellite data. International Journal of Remote Sensing, 34 (9/10): 3084–3127. [DOI: 10.1080/01431161.2012.716540]
-
Liu C, Li H, Du Y M, Cao B, Liu Q H, Meng X C and Hu Y J. 2017. Practical split-window algorithm for retrieving land surface temperature from Himawari 8 AHI data. Journal of Remote Sensing, 21 (5): 702–714. [DOI: 10.11834/jrs.20176492] ( 刘超, 历华, 杜永明, 曹彪, 柳钦火, 孟翔晨, 胡友健. 2017. Himawari 8 AHI数据地表温度反演的实用劈窗算法. 遥感学报, 21 (5): 702–714. [DOI: 10.11834/jrs.20176492] )
-
Malakar N K and Hulley G C. 2016. A water vapor scaling model for improved land surface temperature and emissivity separation of MODIS thermal infrared data. Remote Sensing of Environment, 182 : 252–264. [DOI: 10.1016/j.rse.2016.04.023]
-
Matricardi M, Chevallier F, Kelly G and Thépaut J N. 2004. An improved general fast radiative transfer model for the assimilation of radiance observations. Quarterly Journal of the Royal Meteorological Society, 130 (596): 153–173. [DOI: 10.1256/qj.02.181]
-
McMillin L M. 1975. Estimation of sea surface temperatures from two infrared window measurements with different absorption. Journal of Geophysical Research, 80 (36): 5113–5117. [DOI: 10.1029/JC080i036p05113]
-
Meng X C, Li H, Du Y M, Liu Q H, Zhu J S and Sun L. 2016. Retrieving land surface temperature from Landsat 8 TIRS data using RTTOV and ASTER GED//Proceedings of 2016 IEEE International Geoscience and Remote Sensing Symposium. Beijing, China: IEEE [DOI: 10.1109/IGARSS.2016.7730121]
-
Mu X H, Huang S, Ren H Z, Yan G J, Song W J and Ruan G Y. 2015. Validating GEOV1 fractional vegetation cover derived from coarse-resolution remote sensing images over croplands. IEEE Journal of Selected Topics in Applied Earth Observations and Remote Sensing, 8 (2): 439–446. [DOI: 10.1109/JSTARS.2014.2342257]
-
Pierluissi J H, Jarem J M and Peng G S. 1985. Proposed molecular transmission band models for LOWTRAN//Proceedings of SPIE 0510, Infrared Technology X. San Diego, United States: SPIE [DOI: 10.1117/12.945019]
-
Qin Z, Karnieli A and Berliner P. 2001. A mono-window algorithm for retrieving land surface temperature from Landsat TM data and its application to the Israel-Egypt border region. International Journal of Remote Sensing, 22 (18): 3719–3746. [DOI: 10.1080/01431160010006971]
-
Ren H Z, Ye X, Liu R Y, Dong J J and Qin Q M. 2018. Improving land surface temperature and emissivity retrieval from the Chinese Gaofen-5 satellite using a hybrid algorithm. IEEE Transactions on Geoscience and Remote Sensing, 56 (2): 1080–1090. [DOI: 10.1109/TGRS.2017.2758804]
-
Rienecker M M, Suarez M J, Gelaro R, Todling R, Bacmeister J, Liu E, Bosilovich M G, Schubert S D, Takacs L, Kim G K, Bloom S, Chen J Y, Collins D, Conaty A, da Silva A, Gu W, Joiner J, Koster R D, Lucchesi R, Molod A, Owens T, Pawson S, Pegion P, Redder C R, Reichle R, Robertson F R, Ruddick A G, Sienkiewicz M and Woollen J. 2011. MERRA: NASA’s modern-era retrospective analysis for research and applications. Journal of Climate, 24 (14): 3624–3648. [DOI: 10.1175/JCLI-D-11-00015.1]
-
Sabol D E Jr, Gillespie A R, Abbott E and Yamada G. 2009. Field validation of the ASTER temperature-emissivity separation algorithm. Remote Sensing of Environment, 113 (11): 2328–2344. [DOI: 10.1016/j.rse.2009.06.008]
-
Sobrino J A, Jiménez-Muñoz J C and Paolini L. 2004. Land surface temperature retrieval from LANDSAT TM 5. Remote Sensing of Environment, 90 (4): 434–440. [DOI: 10.1016/j.rse.2004.02.003]
-
Sobrino J A, Jimenez-Munoz J C, Soria G, Romaguera M, Guanter L, Moreno J, Plaza A and Martinez P. 2008. Land surface emissivity retrieval from different VNIR and TIR sensors. IEEE Transactions on Geoscience and Remote Sensing, 46 (2): 316–327. [DOI: 10.1109/TGRS.2007.904834]
-
Sobrino J A and Julien Y. 2016. Exploring the validity of the long-term data record v4 database for land surface monitoring. IEEE Journal of Selected Topics in Applied Earth Observations and Remote Sensing, 9 (8): 3607–3614. [DOI: 10.1109/JSTARS.2016.2567642]
-
Sun D and Pinker R T. 2007. Retrieval of surface temperature from the MSG-SEVIRI observations: Part I. Methodology. International Journal of Remote Sensing, 28 (23): 5255–5272. [DOI: 10.1080/01431160701253246]
-
Tonooka H. 2001. An atmospheric correction algorithm for thermal infrared multispectral data over land-a water-vapor scaling method. IEEE Transactions on Geoscience and Remote Sensing, 39 (3): 682–692. [DOI: 10.1109/36.911125]
-
Tonooka H. 2005a. Accurate atmospheric correction of ASTER thermal infrared imagery using the WVS method. IEEE Transactions on Geoscience and Remote Sensing, 43 (12): 2778–2792. [DOI: 10.1109/TGRS.2005.857886]
-
Tonooka H. 2005b. Atmospheric correction of MODIS thermal infrared bands by water vapor scaling method//Proceedings of SPIE 5979, Remote Sensing of Clouds and the Atmosphere X. Bruges, Belgium: SPIE [DOI: 10.1117/12.629290]
-
Valor E and Caselles V. 1996. Mapping land surface emissivity from NDVI: application to European, African, and South American areas. Remote Sensing of Environment, 57 (3): 167–184. [DOI: 10.1016/0034-4257(96)00039-9]
-
Wan Z M. 2014. New refinements and validation of the collection-6 MODIS land-surface temperature/emissivity product. Remote Sensing of Environment, 140 : 36–45. [DOI: 10.1016/j.rse.2013.08.027]
-
Wan Z M and Dozier J. 1996. A generalized split-window algorithm for retrieving land-surface temperature from space. IEEE Transactions on Geoscience and Remote Sensing, 34 (4): 892–905. [DOI: 10.1109/36.508406]
-
Wang H S, Xiao Q, Li H and Zhong B. 2011. Temperature and emissivity separation algorithm for TASI airborne thermal hyperspectral data//Proceedings of 2011 International Conference on Electronics, Communications and Control. Ningbo, China: IEEE: 1075-1078 [DOI: 10.1109/ICECC.2011.6066288]
-
Xu Z W, Liu S M, Li X, Shi S J, Wang J M, Zhu Z L, Xu T R, Wang W Z and Ma M G. 2013. Intercomparison of surface energy flux measurement systems used during the HiWATER-MUSOEXE. Journal of Geophysical Research: Atmospheres, 118 (23): 13140–13157. [DOI: 10.1002/2013JD020260]
-
Yamaguchi Y, Kahle A B, Tsu H, Kawakami T and Pniel M. 1998. Overview of advanced spaceborne thermal emission and reflection radiometer (ASTER). IEEE Transactions on Geoscience and Remote Sensing, 36 (4): 1062–1071. [DOI: 10.1109/36.700991]
-
Yang G J, Sun C H and Li H. 2015. Verification of high-resolution land surface temperature by blending ASTER and MODIS data in Heihe River Basin. Transactions of the Chinese Society of Agricultural Engineering, 31 (6): 193–200. [DOI: 10.3969/j.issn.1002-6819.2015.06.026] ( 杨贵军, 孙晨红, 历华. 2015. 黑河流域ASTER与MODIS融合生成高分辨率地表温度的验证. 农业工程学报, 31 (6): 193–200. [DOI: 10.3969/j.issn.1002-6819.2015.06.026] )
-
Ye X, Ren H Z, Liu R Y, Qin Q M, Liu Y and Dong J J. 2017. Land surface temperature estimate from chinese gaofen-5 satellite data using split-window algorithm. IEEE Transactions on Geoscience and Remote Sensing, 55 (10): 5877–5888. [DOI: 10.1109/TGRS.2017.2716401]
-
Zhou J, Zhan W F, Hu D Y and Zhao X. 2010. Improvement of mono-window algorithm for retrieving land surface temperature from HJ-1B satellite data. Chinese Geographical Science, 20 (2): 123–131. [DOI: 10.1007/s11769-010-0123-z]
