
|
收稿日期: 2018-03-20; 预印本: 2018-09-08
基金项目: 国家重点研发计划(编号:2017YFC1500900);国家自然科学基金(编号:41830108)
第一作者简介: 林昱坤,1991年生,女,博士研究生,研究方向为时空谱变化检测方法及应用。E-mail:linyk@radi.ac.cn
通信作者简介: 张立福,1967年生,男,研究员,研究方向为高光谱遥感机理及典型应用。E-mail:zhanglf@radi.ac.cn
|
摘要
遥感探测到的小目标信号一般是弱信号,利用传统的高光谱异常变化检测方法直接抑制背景来突出异常变化目标,往往导致小目标弱信号同时被抑制,造成目标探测率低、虚警率高。基于独立成分分析方法,研究了弱信号小目标的高光谱变化检测模型,该模型首先通过投影寻踪将异常变化影像投影到独立成分,突出异常变化目标,然后再抑制背景,从而达到异常变化目标和背景的有效分离。该模型可以有效降低虚警率,提高探测率。利用模拟数据和真实数据进行了精度验证,结果表明,利用模拟数据得到的探测精度为99%,利用真实数据得到的检测精度为86%,与传统异常变化检测算法相比,精度最高提高了9%。本文研究方法适用于弱信号小目标的高光谱异常变化检测。
关键词
独立成分分析, 异常变化检测, 投影寻踪, 亚像元, 遥感, 高光谱
Abstract
Small target signals detected through remote sensing are typically weak signals. The traditional hyperspectral anomaly change detection method directly suppresses the background. However, it frequently causes small targets to be suppressed simultaneously, thereby resulting in a low target detection rate and a high false alarm rate. In this study, a hyperspectral anomaly change detection model based on independent component analysis is used. The proposed model is projected on an independent component, which first highlights the anomaly changes and then suppresses the background to achieve the effective separation of anomaly changes and background. This model can effectively reduce the false alarm rate and improve the detection rate. The accuracy is verified by simulation and real data. Results show that the detection accuracy is 99% using simulated data, and the detection accuracy is 86% using real data. The accuracy is increased by 9% in comparison with the traditional anomaly change detection algorithm. The proposed hyperspectral anomaly change detection method is suitable for processing weak targets. Remote sensing image change detection is the process of quantitatively analyzing the surface changes in remote sensing images that are not obtained in the same surface area simultaneously. However, change detection frequently fails to highlight the change in interest given the differences in atmospheric environment and radiation difference caused by various sensors. We aim to find the small changes that are rare and different from the overall background trend. Traditional hyperspectral anomaly detection methods are generally used to highlight abnormal changes by directly suppressing the background. However, the three methods mentioned above cannot effectively eliminate the radiation differences in the case of complex objects and cannot guarantee the consistency of the background. The background is difficult to suppress, and the anomaly changes cannot be highlighted. Abnormal change detection method based on Independent Component Analysis (ICA) through the abnormal changes in RX anomaly detection method of pixels selects the anomalies with strong changes in abnormal pixels for initial projection direction and to all pixels to initialize the orthogonal projection of projection direction and abnormal pixel labeling for a second projection direction until the number of iterations to achieve independent component. The visual discrimination results after joining LCRA anomaly change detection results effectively restrain the false alarm rates and highlight the anomaly change targets, and abnormal change detection obtains accurate results. The ICA results show that the accuracy of anomaly change detection is superior to other methods. The result shows the quantitative evaluation result of abnormal change detection. ICA realizes the highest accuracy. The ICA anomaly change detection method achieves a low false alarm rate and favorable detection effect, and this method can obtain the highest accuracy with or without the LCRA matching strategy. Considering the evident geometric matching error of real data, the accuracies of all methods improve by approximately 0.2 after the LCRA matching strategy is adopted. The result shows the corresponding accuracy of the ICA anomaly detection method for analyzing the number of different independent components. Moreover, the result accuracy of this method is the highest when the number of independent components is moderate and between 7 and 14, thereby reflecting its robustness. The accuracy of the proposed method is better than other methods when the parameter size is reasonable. This study presents an ICA model, which determines the abnormal changes in projection on an independent component and the prominent changes in the target and restrains the background to achieve the effective separation of target and background, effectively improve the detection rate, and achieve low false alarm rates. The conclusions are summarized as follows: (1)The proposed method that uses simulated data achieves abnormal change detection accuracy of 99% and real data detection accuracy of 86% in comparison with the traditional abnormal change detection algorithm, which accuracy reaches 9%; (2) Aiming at the abnormal change target of a subpixel level, the proposed method has a 1% improvement in accuracy in comparison with traditional abnormal change detection. (3) The proposed method has only one parameter, and the selection of parameters slightly impact accuracy, which has strong robustness.
Key words
independent component analysis, anomaly change detection, projection pursuit, subpixel, remote sensing, hyperspectral
1 引 言
遥感影像变化检测是从不同时相获取的覆盖同一地表区域的遥感影像中,定量分析地表变化的过程(Singh 1989;Vongsy 等,2007;Wang 等,2015)。然而由于不同时相影像获取时的大气环境差异,以及不同传感器带来的辐射差异,变化检测往往无法突出人们感兴趣的变化(Theiler,2008b)。通过高光谱遥感影像所提供的丰富且详细的光谱特征和高维数据(童庆禧 等,2016),异常变化检测能够寻找到数量稀少、与整体背景变化趋势不同的、难以发现的感兴趣的变化(Eismann 等,2008;Theiler和Matsekh 2010;彭波 等,2017)。近年来,高光谱异常变化检测技术在很多领域中得到成功应用,如边境监察、搜索营救等,因此得到有关学者的高度重视(Matteoli 等,2010)。
当前异常变化检测方法相对较少,异常变化检测方法通常先将两幅影像进行中心化,然后确定两幅影像的线性关系,将参考影像与线性变换后的测试影像做差,最后用异常探测算子计算异常变化(Pieper 等,2015b)。其中典型相关分析CCA(Canonical Correlation Analysis)方法首先将两幅影像分别采用典型相关分析进行线性变换,将变换后的影像作差后用RX算法(Reed和Yu,1990;Schweizer和Moura,2000)计算异常变化;PCA方法采用相同流程,差别在于分别对两幅影像分别提取相同数量的主成分,再检测其异常变化(Pieper 等,2015a)。异常变化检测中常用的CC(Chronochrome)方法首先采用最小二乘法将一景影像向另一景影像投影,并对投影后的两景影像进行差值异常变化检测(Theiler,2008a);CE(Covariance Equation)方法通过对两景影像进行白化处理,消除影像之间的辐射差异后检测异常像元(Theiler和Perkins,2006;Rotman和Shalev,2017)。然而这类高光谱异常变化检测方法都是通过直接抑制背景的方式来突出异常变化,在地物较为复杂的情况下,无法有效消除辐射差异,无法保证背景的一致性,难以整体抑制背景,突出异常变化像元(Acito 等,2014)。
本文针对变化的弱信号小目标的探测模型和方法进行了研究。通过先突出异常变化再抑制背景的方式对异常变化像元进行检测,与上述直接抑制背景的异常变化检测方法相比,更加达到突出异常变化目标的效果。由于异常变化在影像中相对独立,每一个异常成分都处于一个投影空间中,因此采用独立成分分析方法将异常变化投影到独立子空间中,进而突出异常。再通过异常探测方法将投影后的影像进行背景抑制,突出变化像元,达到异常变化目标和背景的有效分离,可以有效降低虚警率,提高探测率。
2 基于独立成分分析的小目标异常变化检测方法
基于独立成分分析的异常变化检测方法通过RX异常探测方法判定异常变化像素,选定异常变化强度最大的异常像素为初始投影方向,而后对所有像素向初始化投影方向进行正交投影,并将最异常的像素标记为第二次投影方向,直到迭代次数达到独立成分个数。原理图如图1所示。方法具体步骤如下。


基于独立成分分析的原理,需首先对差分影像进行白化预处理。白化的步骤如下:将差分后的高光谱影像记为R,该高光谱数据共有L个波段,每个波段共有I个像素,mR和
| ${{Z = }}{{{D}}^{ - {\rm{1/2}}}}{{{U}}^{\rm T}}\left({{{R - }}{{{m}}_{\rm{R}}}{{{V}}_{{\rm{1}},I}}} \right)$ | (1) |
式中,
基于独立成分分析的原理,采用投影寻踪策略寻找与最大异常变化强度对应的正交投影方向
投影方向初始化就是寻找影像中异常变化像元,其光谱就是初始化的投影方向。对于某一给定像元i,其原始假设H0和备择假设H1之间的广义似然比由RX异常探测算法给出式(2)
| ${L_{{\rm{RX}}}}\left({{{{r}}_i}} \right){{ = }}{\left({{{{r}}_i}{{ - m}}} \right)^{\rm T}}{{\hat{ \varGamma }}^{ - {\rm{1}}}}\left({{{{r}}_i}{{ - m}}} \right)$ | (2) |
式中,
| ${\Lambda _{{\rm{RX}}}}\left({{{z}_i}} \right) = {{z}}_i^{\rm T}{{{z}}_i} = \left\| {{{z}}_i} \right\|_2^2$ | (3) |
在对投影方向进行初始化后,则可以用该初始化投影矩阵提取异常变化像元。异常变化强度最大的像素的索引表示如下
| ${i^ * } = \arg \;\mathop {\rm{max}}\limits_i \left({{\Lambda _{{\rm{RX}}}}\left({{{z}}_i} \right)} \right)$ | (4) |
计算像元的投影方向如下
| ${{w}^ * } = \frac{{{{z}}_{{i^ * }}}}{{{{\left\| {{{z}}_{{i^ * }}} \right\|}_2}}}$ | (5) |
假设白化后影像Z的像元光谱符合标准正态分布,并且
在第
| ${{\tilde Z}} = {{P}}_{{W}}^ \bot {{Z}}$ | (6) |
生成的新影像
针对异常变化检测易受配准误差影响这一问题,Theiler和Wohlberg(2012)提出局部匹配策略LCRA(Local Coregistration Adjustment)进一步减小不同时相影像带来的匹配误差。由于不同时相的真实数据中常存在配准误差,异常变化检测方法与LCRA相结合,进一步降低虚警率。由于LCRA方法的计算量与窗口大小成平方倍(Theiler和Wohlberg,2012),同时对于变化检测而言,首先都需要对影像进行粗略的几何校正,保证两景影像的偏差在一像素左右,因此窗口大小为3既可减少计算量,又可取得较高精度。图2是完整的算法流程。

3 实验结果与分析
共采用两组实验数据验证该方法的有效性,其中模拟数据为其中一幅影像加入影像中并不存在的其他地物光谱,并以一定的比例与原始像元混合,作为异常变化;真实数据即采用最新发布的公开数据集对异常变化检测方法进行评估(Rossi 等,2014)。
采用ROC曲线和ROC曲线下的面积AUC值进行精度评价。其中,ROC曲线常用来评价高光谱异常变化检测算法中对异常变化的识别能力(Vongsy 等,2009;Wohlberg和Theiler,2010)。ROC曲线的横轴为虚警率,纵轴为探测率,在相同虚警率的情况下,探测率越高,算法的检测精度越好(Wang 等,2013)。AUC值(Jin和Ling,2005)方法通过计算ROC曲线下的面积来反映算法的检测精度,数值越大,精度越好。
3.1 基于模拟数据的实验结果
第1组实验高光谱数据拍摄自EO-1卫星搭载的Hyperion传感器,影像地点为中国内蒙古自治区兴安盟。如图3所示,两幅高光谱影像大小为400×400,且影像拍摄时间分别为2010年4月和2010年6月,在去除了水吸收波段和高噪声波段后,两幅影像的波段数变为155个。由于两幅原始影像获取时间相近,可以假设影像中地物并未发生变化,而影像中的像素差异均来自辐射误差和噪声。因此对原始影像植入异常像元,作为异常变化目标,异常像元的光谱为城市光谱,与周围的植被像元具有明显的光谱差异,植入的异常像元共有5×5个,每一行代表一种城市光谱,每一列代表植入异常像素所占整个像素的比例,从左到右依次为100%、80%、60%、40%、20%。
图4(a)—(h)对应下列异常变化检测方法的结果图,分别为差值RX法、基于LCRA的差值RX法、CC法、基于LCRA的CC法、方差均衡化法、基于LCRA的方差均衡化法、ICA异常变化检测法、基于LCRA的ICA异常变化检测法,结果图为ENVI中经过相同的25个异常像元ROI拉伸后的效果。
从结果中可以看出,SD方法整体要优于CC方法,而CC方法整体要优于方差均衡化异常变化检测方法(CE),然而AICA方法与以上3种方法相比,不仅在探测率上表现优异,能够检测到最多的异常像素,而且对背景的抑制效果也是最优的。所有加入LCRA匹配策略后的结果在第1组数据实验中,并没有表现出优势,因为这两幅影像经过了很好的几何校正,因此LCRA匹配策略在两景影像对应像素发生偏移的情况下,才能起到作用。
将模拟数据中不同时相影像通过变化向量分析CVA(Change Vector Analysis),计算得到变化强度图(图5(a))。其中,强度图中越靠近白色,表明发生变化,越靠近黑色代表没发生变化。局部放大图(图5(b))表明,模拟影像中异常变化的像素点就叠加在变化的背景地物之上;而从模拟数据的异常变化检测结果(图5(c))中看出,本文方法能够有效抑制背景变化,突出异常变化。


如图6所示,在不同背景地物中共添加了50个异常变化点,分别为场景A、B、C、D,采用LCRA校正后的ICA异常变化检测方法进行异常变化检测,检测结果图表明,在场景A、B、C、D中,尽管各自的背景变化不同,都能够将异常变化探测到。

从图7的ROC曲线图和AUC精度结果中也可以得出一致的结论。图7中ROC曲线结果看出,ICA异常变化检测方法在虚警率处于1e−3—1e−2的情况下,探测率就已经达到0.9,并且在相同虚警率的情况下,探测率一直处于最高。AUC面积也同样可以看出基于投影寻踪的异常变化检测方法的总体精度最高,但是由于该原始影像已经经过精确的几何校正,因此未经过LCRA校正的投影寻踪异常变化检测方法精度更高。
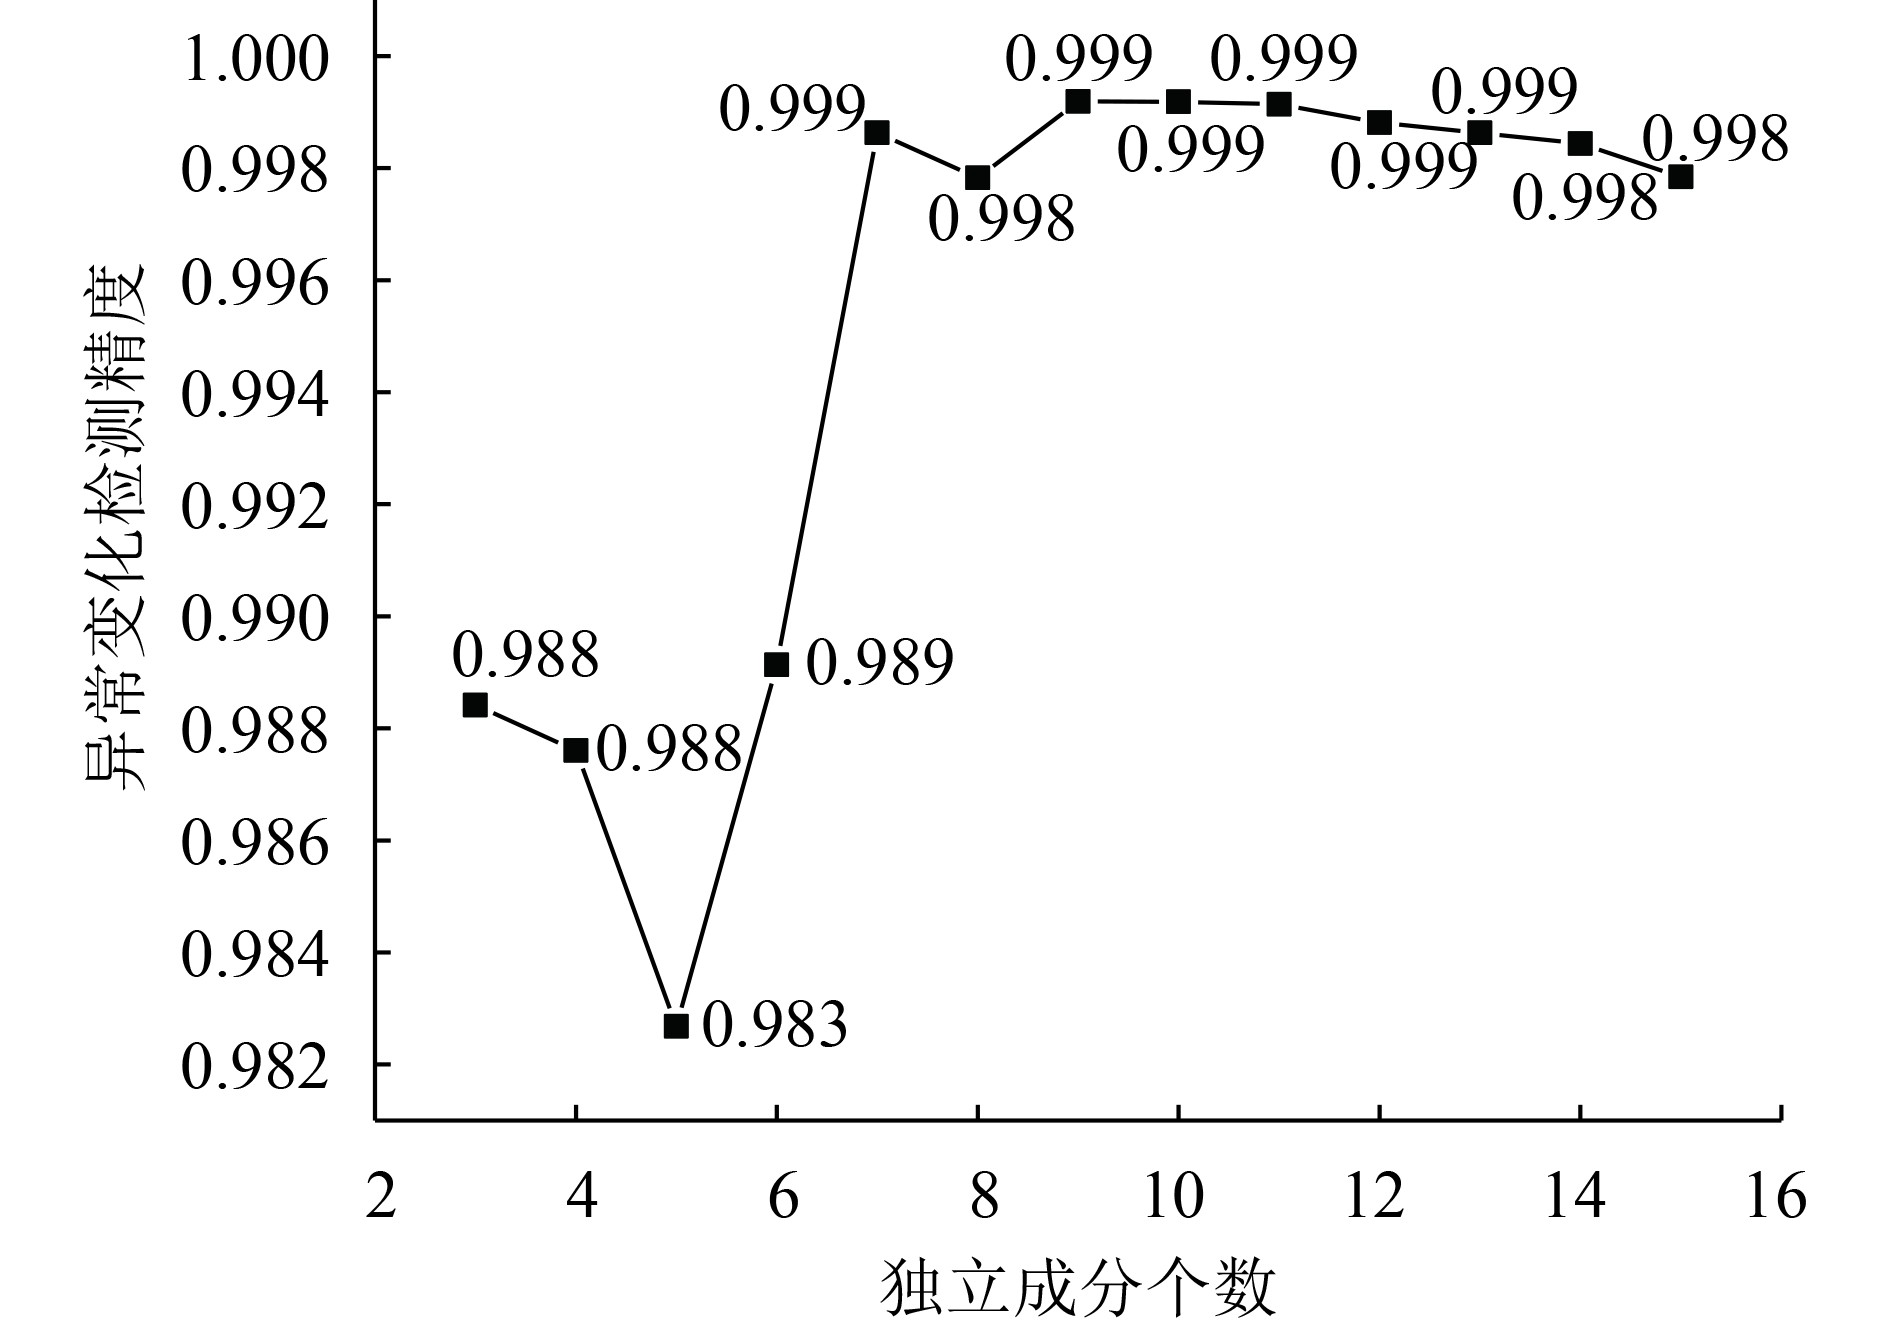
本文方法中仅存在一个参数—独立成分个数,因此图8分析了不同独立成分个数的情况下,ICA异常变化检测方法对应的结果精度,结果表明,当独立成分个数处于7—14,该方法的结果精度均处于最高,也就是说,独立成分个数对本方法的精度影响不大。即使在使用本方法过程中,独立成分个数设置不合理,过小或者过大,本文方法的精度也优于其他方法。
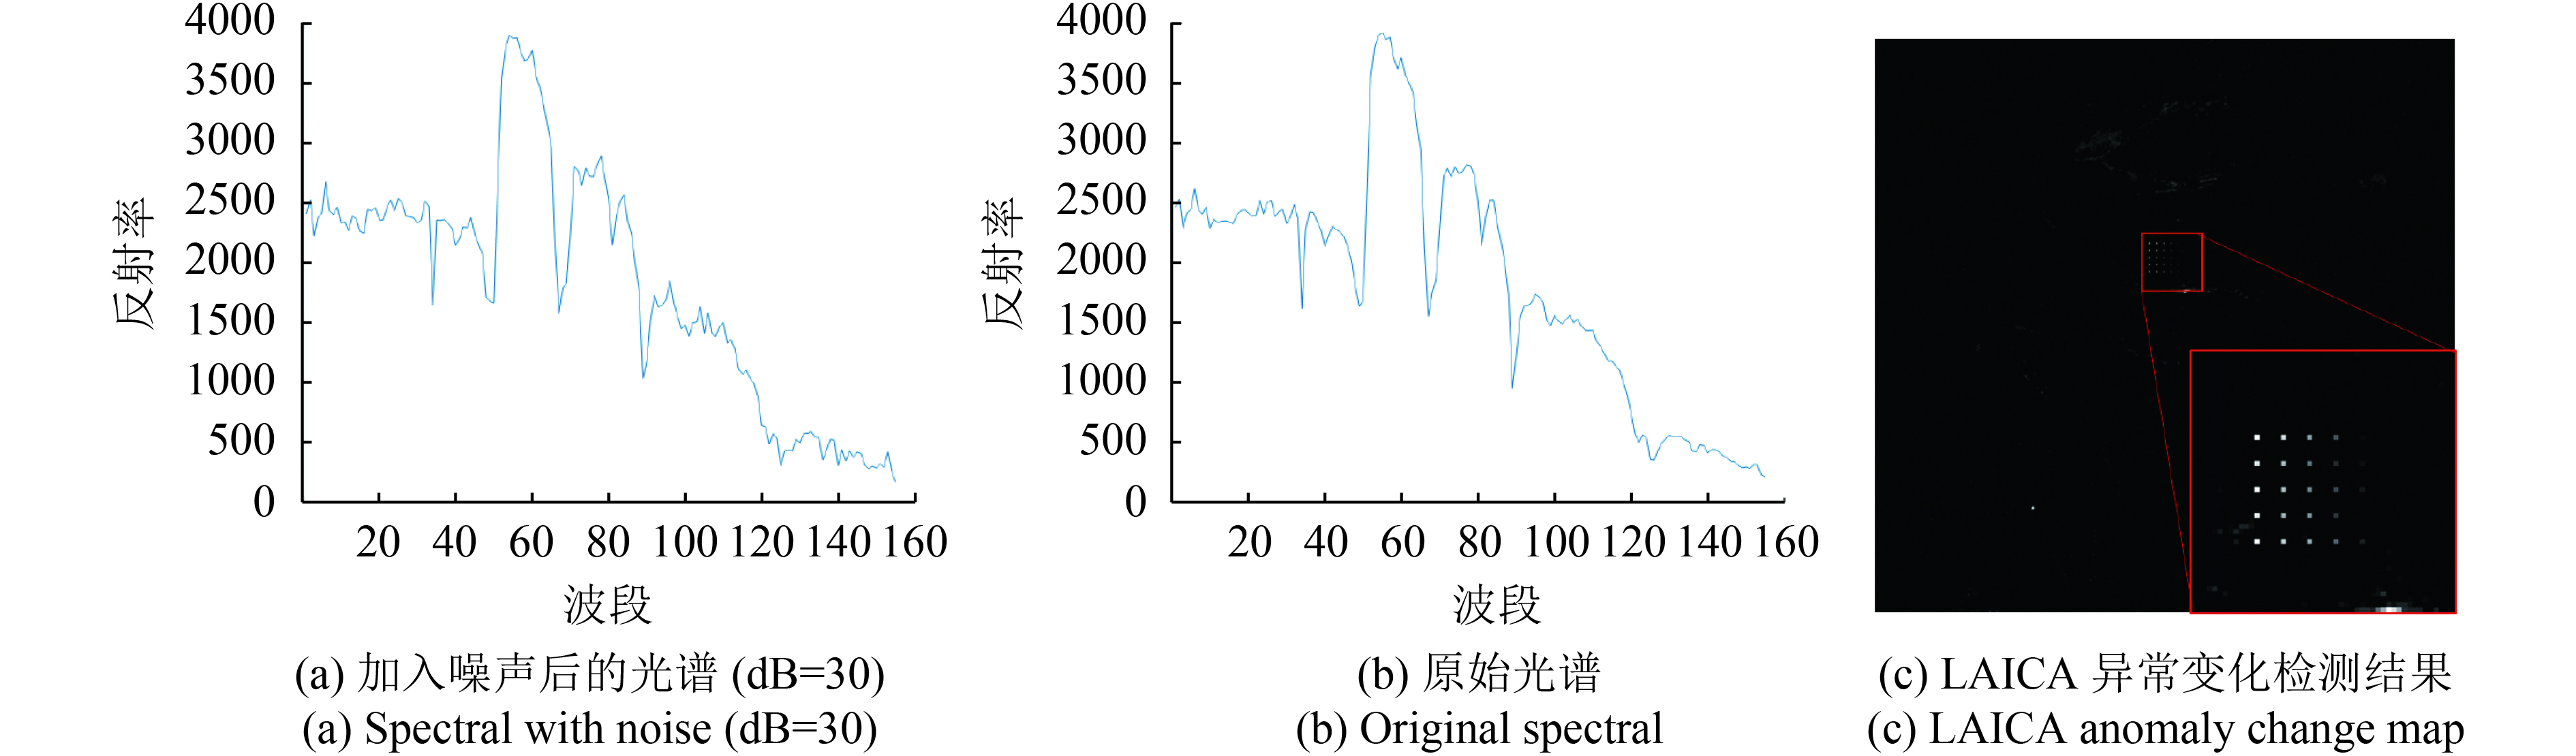
在原始的模拟影像,图3(a)中加入高斯白噪声,信噪比为30 dB,光谱差异如图9所示,采用LAICA异常变化检测方法仍然能够得到异常变化目标,本文方法的鲁棒性较好。
3.2 基于真实数据的实验结果
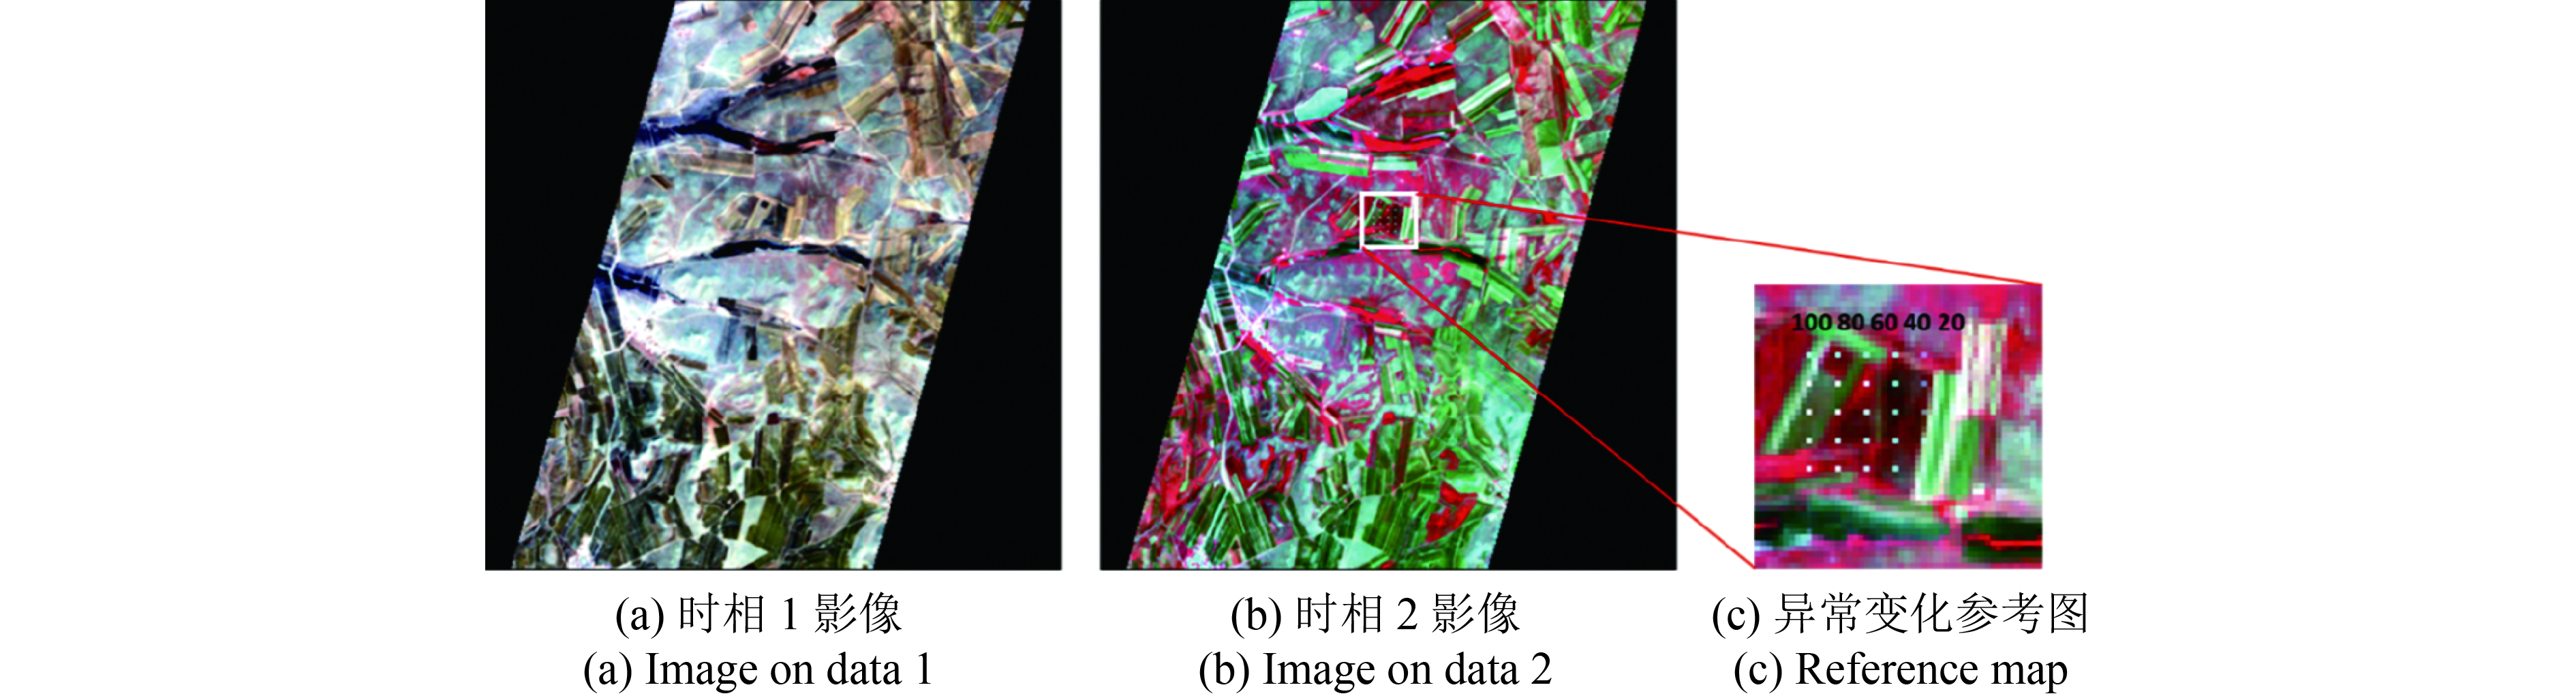
该数据集采集计划由CISAM主办,并与多个大学同时合作完成,该数据集采集于2013年5月,拍摄地点在意大利的维亚雷焦市,因此数据集被命名为Viareggio 2013 trial(Rossi 等,2014)。在高光谱异常变化检测中需要有准确的参考影像对各种异常变化检测方法进行精度评价,但是目前公开的高光谱异常变化检测数据较少,因此本实验采用该数据集进行高光谱异常变化检测。
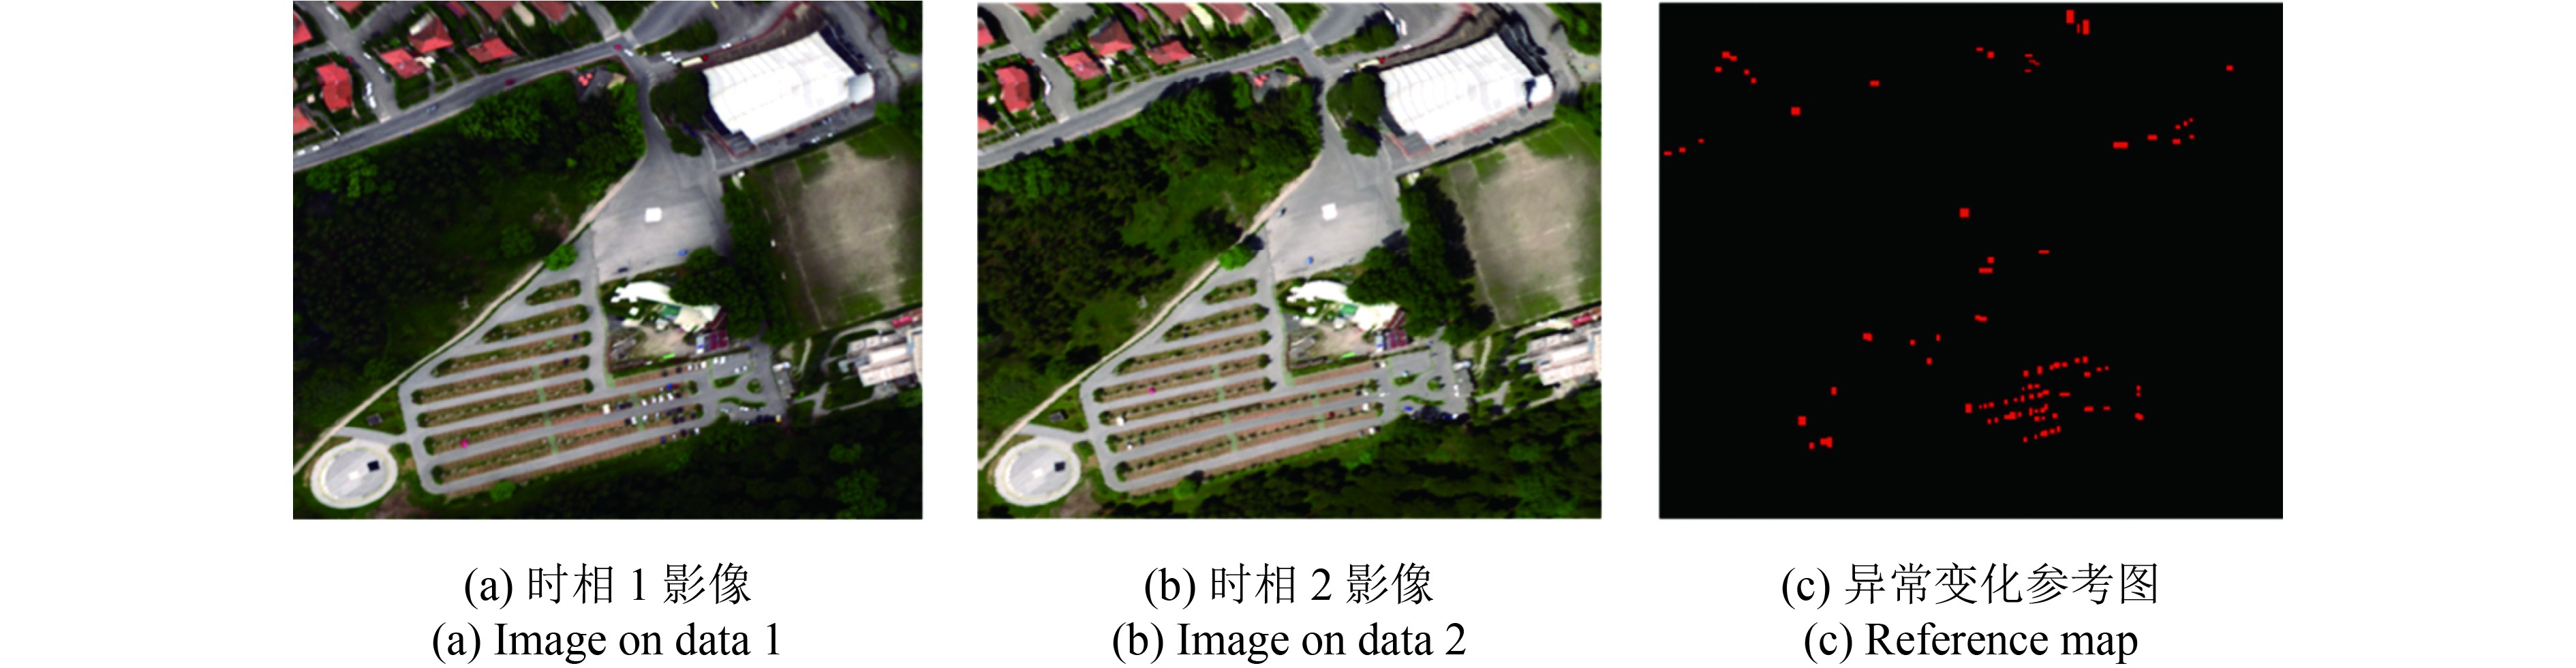
如图10中两幅影像分别拍摄于2013年5月8日和2013年5月9日,影像大小为450×375,共有128个波段。该数据集中的两幅影像经过几何校正和去除条带噪声等预处理后,影像数据中噪声为高斯白噪声。影像a(图10(a))在成像过程中受到了云的影响,而影像b(图10(b))拍摄期间晴朗无云,因而两幅影像由于天气原因产生辐射差异,造成背景像元的变化。该影像的场景为停车场,其中异常变化目标为停车场和道路上的车辆,影像c(图10(c))为参考异常变化目标。
从原始影像中可以看出,该高光谱影像在几何校正后影像左上角的房屋造成了较大的变形,在对两幅影像进行比对后发现,影像中房屋处仍然存在几何误差,因此本组实验中加入LCRA几何校正的异常变化检测方法均取得了较好的精度结果,同时该影像异常像元邻域内的背景像元光谱较为一致,因此采用LCRA方法可以有效抑制匹配误差从而得到更加准确的异常变化目标。图11中各异常变化检测结果所对应的方法与模拟数据的一致,局部放大结果图为ENVI中经过图10(c)中ROI拉伸后的效果。

从目视判别结果中可以看出加入LCRA后的异常变化检测结果的确有效抑制了很多的伪变化像元,CC和LCC方法的结果对比最为明显,而且从AICA和LAICA结果的对比来看,AICA红框左边检测出了很多的异常目标,然而这些目标并没有变化,而LAICA则有效抑制了这些异常目标,得到了更为准确的异常变化检测结果。与其他方法的对比来看,ICA异常变化检测方法的结果精度要明显优于其他方法,在放大的细节图中可以看出,ICA异常变化检测方法与LCC、CE、LCE方法相比,检测出了更多的异常目标,而与SD、LSD、CC方法相比,该方法有效的抑制了背景,虚警像元更少。
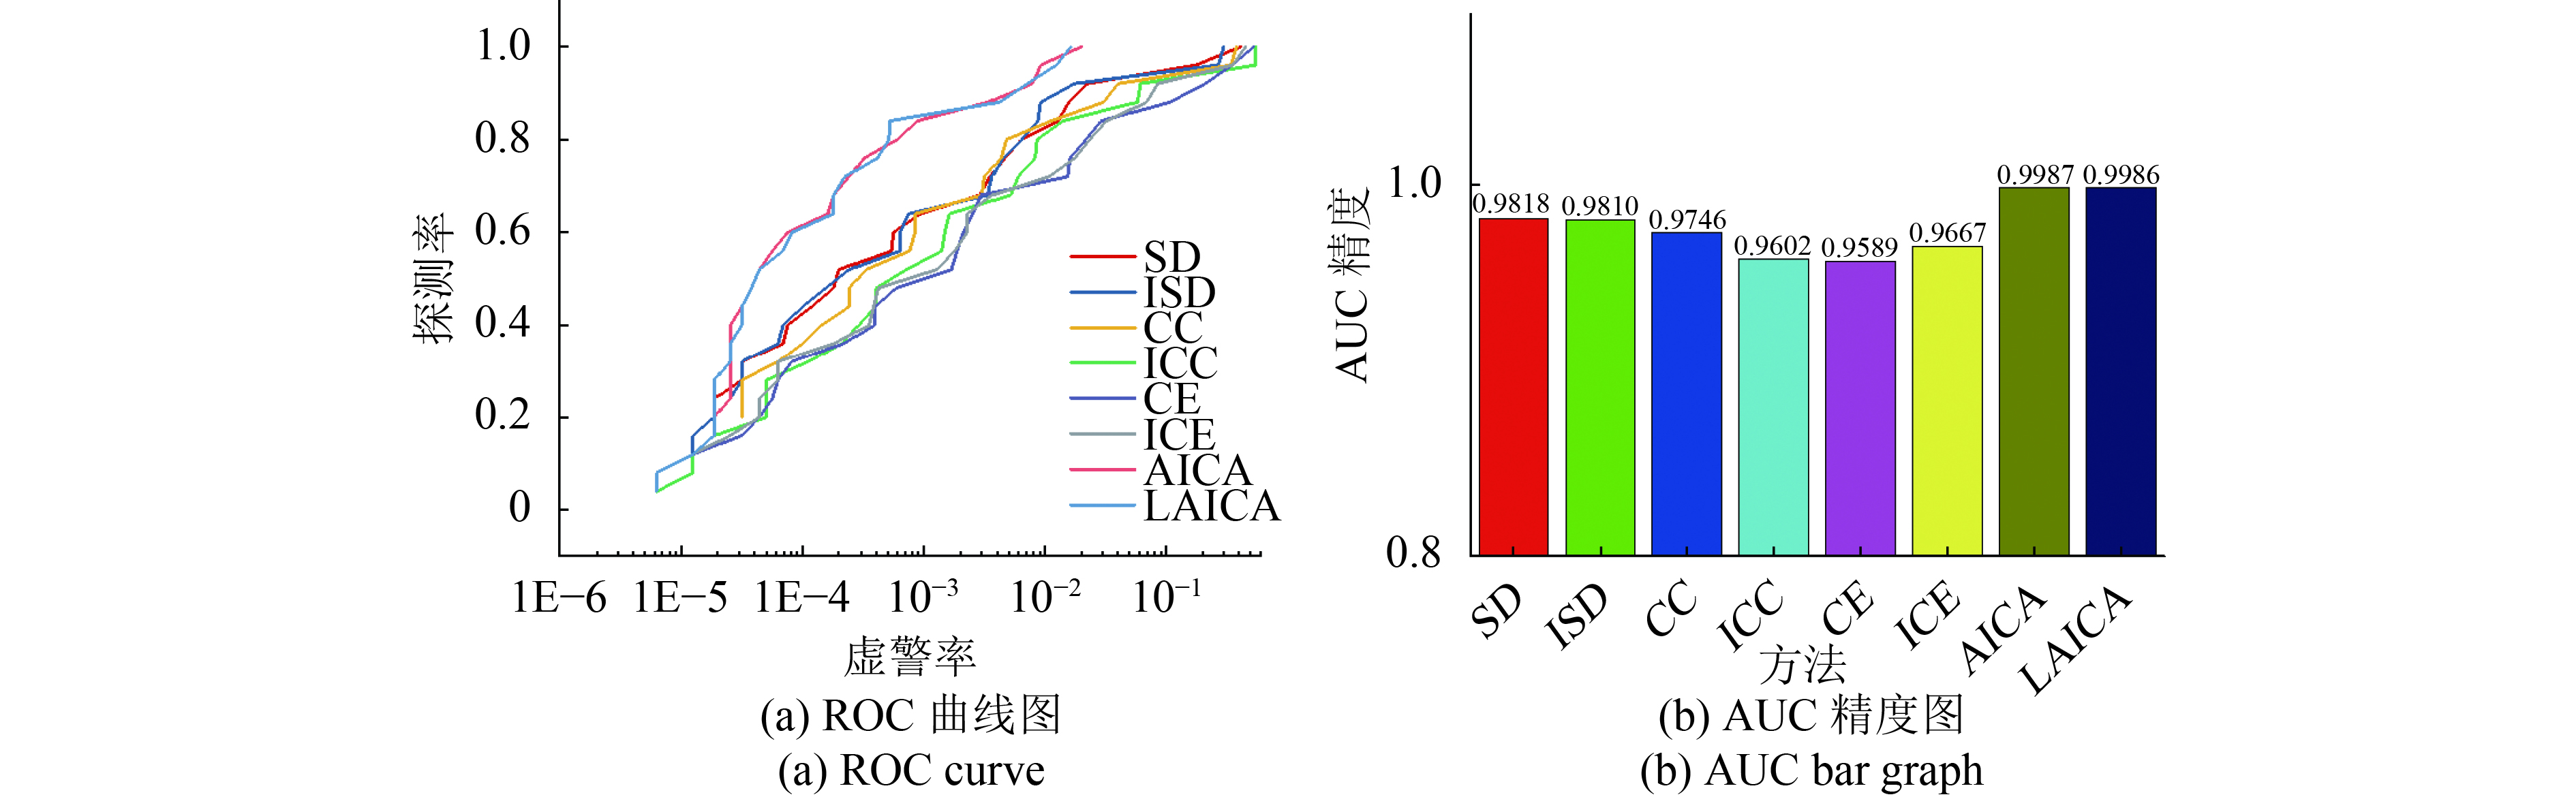
图12为异常变化检测的定量评价结果。从图12中可以看出,其中投影寻踪异常变化检测方法精度最高。与第1组实验不同的是,CE异常变化检测方法要好于CC法和SD异常变化检测法,原因是该数据集地物种类较少,且每种背景地物的分布较为连续,因此当进行方差均衡化操作时,背景像素可以更好地聚集在球面中。ICA异常变化检测方法仍然在较低虚警率的情况下,就能够达到很好的探测效果,且无论是否加入LCRA匹配策略,该方法都能得到最高的精度。由于真实数据存在较为明显的几何匹配误差,因此采用LCRA匹配策略后,所有方法的精度均提升了0.2左右。
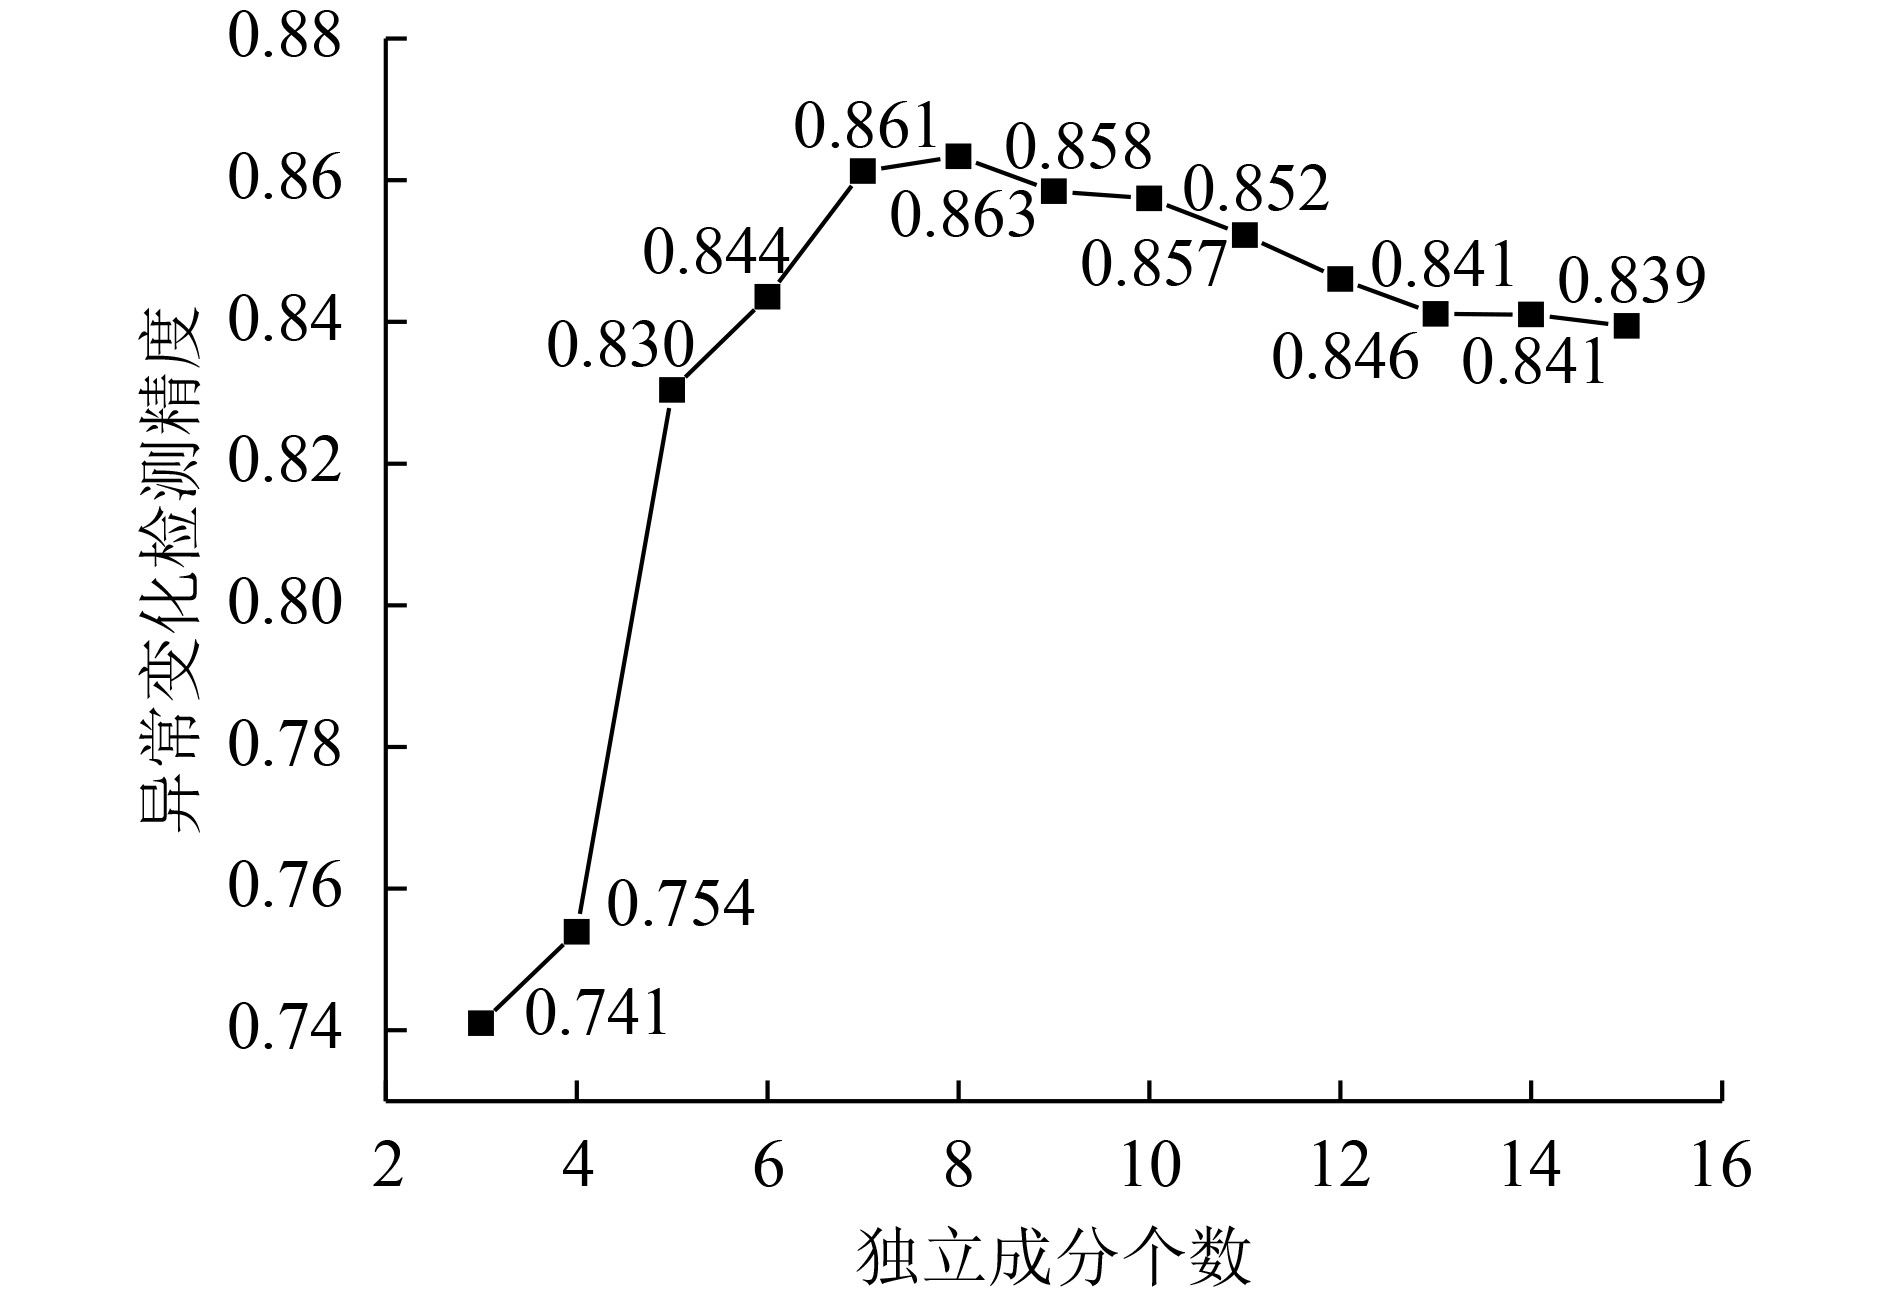
图13为分析不同独立成分个数的情况下,ICA异常变化检测方法对应的结果精度。结果表明,当独立成分个数大小适中,处于7—14之间时,该方法的结果精度均处于最高,体现了该方法的鲁棒性。只要在使用本文方法过程中参数大小设置合理,不要过小或者过大,本方法的精度都会优于其他方法。

4 结 论
本文研究了针对弱信号小目标的高光谱异常探测模型和方法,通过研究,并利用模拟数据和真实数据进行比较验证,得到如下结论:
(1)传统的变化检测方法是直接抑制来发现异常变化信息,针对弱信号小目标,目标信号往往一起被抑制,造成探测精度低,虚警率高,本文方法是通过利用投影寻踪方法,将小目标信号投影到独立成分,强化小目标信号,然后再抑制背景,有效避免了弱信号小目标被抑制,从而可以提高弱信号小目标的检测精度。
(2)利用模拟数据和真实数据多探测精度进行了比较验证,得到结论为:利用模拟数据得到的检测精度为99%,利用真实数据得到的检测精度为86%,与传统异常变化检测算法相比,探测精度最高提高了9%。
(3)针对亚像元级异常变化目标,该方法与传统异常变化检测方法相比,精度提高了1%。
(4)本文研究方法仅有一个参数,且参数的选择对精度影响不大,表明该方法具有较强的鲁棒性。
参考文献(References)
-
Acito N, Diani M, Rossi A and de Ceglie S U. 2014. Hyperspectral anomalous change detection in the presence of non-stationary atmospheric/illumination conditions//Proceedings of SPIE 9244, Image and Signal Processing for Remote Sensing XX. Amsterdam, Netherlands: SPIE [DOI: 10.1117/12.2067314]
-
Eismann M T, Meola J and Hardie R C. 2008. Hyperspectral change detection in the presenceof diurnal and seasonal variations. IEEE Transactions on Geoscience and Remote Sensing, 46 (1): 237–249. [DOI: 10.1109/TGRS.2007.907973]
-
Jin H and Ling C X. 2005. Using AUC and accuracy in evaluating learning algorithms. IEEE Transactions on Knowledge and Data Engineering, 17 (3): 299–310. [DOI: 10.1109/TKDE.2005.50]
-
Matteoli S, Diani M and Corsini G. 2010. A tutorial overview of anomaly detection in hyperspectral images. IEEE Aerospace and Electronic Systems Magazine, 25 (7): 5–28. [DOI: 10.1109/MAES.2010.5546306]
-
Peng B, Zhang L F, Zhang P, Peng X M and Cen Y. 2017. Real-time sample-wise hyperspectral anomaly detection algorithm using Cholesky decomposition. Journal of Remote Sensing, 21 (5): 739–748. ( 彭波, 张立福, 张鹏, 邓贤明, 岑奕. 2017. Cholesky分解的逐像元实时高光谱异常探测. 遥感学报, 21 (5): 739–748. )
-
Pieper M, Manolakis D, Cooley T, Brueggeman M, Weisner A and Jacobson J. 2015a. New insights and practical considerations in hyperspectral change detection//Proceedings of 2015 IEEE International Geoscience and Remote Sensing Symposium (IGARSS). Milan, Italy: IEEE: 4161-4164 [DOI: 10.1109/IGARSS.2015.7326742]
-
Pieper M, Manolakis D, Truslow E, Cooley T, Brueggeman M, Weisner A and Jacobson J. 2015b. Comparison of hyperspectral change detection algorithms//Proceedings of SPIE 9611, Imaging Spectrometry XX. San Diego, California, United States: SPIE [DOI: 10.1117/12.2188316]
-
Reed I S and Yu X. 1990. Adaptive multiple-band CFAR detection of an optical pattern with unknown spectral distribution. IEEE Transactions on Acoustics, Speech, and Signal Processing, 38 (10): 1760–1770. [DOI: 10.1109/29.60107]
-
Rossi A, Acito N, Diani M, Corsini G, De Ceglie S U, Riccobono A and Chiarantini L. 2014. Hyperspectral data collection for the assessment of target detection algorithms: the Viareggio 2013 trial//Proceedings of SPIE 9250, Electro-Optical Remote Sensing, Photonic Technologies, and Applications VIII; and Military Applications in Hyperspectral Imaging and High Spatial Resolution Sensing II. Amsterdam, Netherlands: SPIE [DOI: 10.1117/12.2067313]
-
Rotman S and Shalev H. 2017. Evaluating hyperspectral imaging change detection methods//Proceedings of 2017 IEEE International Geoscience and Remote Sensing Symposium (IGARSS). Fort Worth, TX, USA: IEEE: 1946-1949 [DOI: 10.1109/IGARSS.2017.8127360]
-
Schweizer S M and Moura J M F. 2000. Hyperspectral imagery: clutter adaptation in anomaly detection. IEEE Transactions on Information Theory, 46 (5): 1855–1871. [DOI: 10.1109/18.857796]
-
Singh A. 1989. Review article digital change detection techniques using remotely-sensed data. International Journal of Remote Sensing, 10 (6): 989–1003. [DOI: 10.1080/01431168908903939]
-
Theiler J. 2008a. Quantitative comparison of quadratic covariance-based anomalous change detectors. Applied Optics, 47 (28): F12–F26. [DOI: 10.1364/AO.47.000F12]
-
Theiler J. 2008b. Subpixel anomalous change detection in remote sensing imagery//Proceedings of 2008 IEEE Southwest Symposium on Image Analysis and Interpretation. Santa Fe, NM, USA: IEEE: 165-168 [DOI: 10.1109/SSIAI.2008.4512311]
-
Theiler J and Matsekh A M. 2010. Total least squares for anomalous change detection//Proceedings of SPIE 7695, Algorithms and Technologies for Multispectral, Hyperspectral, and Ultraspectral Imagery XVI. Orlando, Florida, United States: SPIE [DOI: 10.1117/12.851935]
-
Theiler J and Perkins S. 2006. Proposed framework for anomalous change detection//Workshop on Machine Learning Algorithms for Surveillance and Event Detection at the 23rd International Conference on Machine Learning. Los Alamos, NM: Los Alamos National Laboratory
-
Theiler J and Wohlberg B. 2012. Local coregistration adjustment for anomalous change detection. IEEE Transactions on Geoscience and Remote Sensing, 50 (8): 3107–3116. [DOI: 10.1109/TGRS.2011.2179942]
-
Tong Q X, Zhang B and Zhang L F. 2016. Current progress of hyperspectral remote sensing in China. Journal of Remote Sensing, 20 (5): 689–707. ( 童庆禧, 张兵, 张立福. 2016. 中国高光谱遥感的前沿进展. 遥感学报, 20 (5): 689–707. )
-
Vongsy K, Karimkhan S, Shaw A K and Wicker D. 2007. Change detection for hyperspectral imagery//Proceedings of SPIE 6565, Algorithms and Technologies for Multispectral, Hyperspectral, and Ultraspectral Imagery XIII. Orlando, Florida, United States: SPIE [DOI: 10.1117/12.723161]
-
Vongsy K, Mendenhall M J, Hanna P M and Kaufman J. 2009. Change detection using synthetic hyperspectral imagery//Proceedings of the 1st Workshop on Hyperspectral Image and Signal Processing: Evolution in Remote Sensing. Grenoble, France: IEEE: 1-6 [DOI: 10.1109/WHISPERS.2009.5289016]
-
Wang B, Choi S K, Han Y K, Lee S K and Choi J W. 2015. Application of IR-MAD using synthetically fused images for change detection in hyperspectral data. Remote Sensing Letters, 6 (8): 578–586. [DOI: 10.1080/2150704X.2015.1062155]
-
Wang T, Du B and Zhang L P. 2013. A kernel-based target-constrained interference-minimized filter for hyperspectral sub-pixel target detection. IEEE Journal of Selected Topics in Applied Earth Observations and Remote Sensing, 6 (2): 626–637. [DOI: 10.1109/JSTARS.2013.2251863]
-
Wohlberg B and Theiler J. 2010. Symmetrized local co-registration optimization for anomalous change detection//Proceedings of SPIE 7533, Computational Imaging VIII. San Jose, California, United States: SPIE: 753307 [DOI: 10.1117/12.845210]