

|
收稿日期: 2018-03-12
基金项目: 国家重点研发计划(编号:2017YFB0503903)
第一作者简介: 涂宽,1992年生,男,硕士研究生,研究方向为遥感地质、极化SAR应用。E-mail:tukuan@21at.com.cn
通信作者简介: 文强,1964年生,男,高级工程师,研究方向为遥感技术应用、遥感数据处理、影像信息提取、遥感大数据管理与服务。E-mail:wenqiang@21at.com.cn
|
摘要
地质构造信息对地质矿产调查具有重要意义,野外实测和光学遥感等常规手段在一些地表浅覆盖区获取的地质构造信息十分有限,而合成孔径雷达(SAR)对地表具有一定的穿透性,在探测地表浅层覆盖区域的地质构造特征中具有独特优势。利用高分三号(GF-3)全极化影像,在典型的地表浅层覆盖区域,开展了断裂构造等信息的解译探索,提出了一种地表浅覆盖区域地质构造解译的新方法。首先对西藏改则、林芝、贵阳、北京千家店等4个研究区内的断裂构造和环带构造进行分析;接着,提出了GF-3全极化影像用于浅覆盖区地质解译的处理流程,通过引入DEM数据对GF-3影像进行地形校正,充分利用微地形微地貌特征,并采用不同极化方式的RGB合成,增强了影像的判读性,并进行地质构造解译;最后,将解译结果与1∶5万实测数据进行对比,断层的位置和方向与实测结果基本一致,同时获取了大量野外实测未能探明的浅覆盖层以下的断层信息,进一步丰富了研究区的地质构造信息。结果表明,GF-3全极化影像可用于浅覆盖区的地质构造解译,并且具有野外实测和光学遥感等常规手段所不能替代的独特优势。
关键词
高分三号, 全极化SAR, 浅覆盖区, 断裂构造, 环带构造
Abstract
Synthetic aperture radar (SAR) has been adopted in this study to compensate for the shortage of obtaining structural information below the meadow covering. Structural information is obtained through field surveying and special remote sensing images. Influenced by weathering and meadow covering, the structural information in the meadow covering environment acquired through these methods is limited. Given its long wavelength, SAR has the advantage of penetrability, which can help in detecting structural information below the meadow covering. The technology can efficiently compensate for the disadvantage of spatial remote sensing and field observing in meadow covering area. This study aims (1) to establish a new method of structural interpretation in meadow covering based on GaoFen (GF)-3 Pol-SAR images; (2) to verify the application of GF-3 Pol-SAR images in four different atmosphere districts, namely, Gerze in Tibet, Nyingchi in Tibet, Qianjiadian in Beijing, and Sinan County in Guizhou Province; and (3) to interpret the faults and circular structures systematically in these areas and verify the authenticity and accuracy of interpretation through GF-3 SAR images by comparing with the 1∶50000 field mapping. GF-3 C-band SAR images have been used in detecting geology structures in this study because of its penetrability. GF-3 SAR images have the most observing modes worldwide. GF-3 full polarization mode images are utilized in this study to optimize the use of information in different polarization modes. To use the GF-3 SAR images effectively and accurately, the data processing procedure, including focusing, multi-looking, filtering, and geocoding, has been completed. The effect from speckle in the images can be effectively reduced by Lee filtering. Geocoding can ensure the accuracy of spatial information. The 90 m SRTM DEM data are obtained in the geocoding process to eliminate the topographic influence, which helps in optimizing the use of micro-topographic features to interpretation structures. On the contrary, the structures have different features in various polarization images. To optimize the use of features in different polarization images, the R-G-B combination of various polarization directions is used in the study. As the cross polarization has more peak features than the straight polarization, the cross polarization images have been merged as R channel and the straight polarization images have been merged as G and B channels. The interpretation capability of GF-3 SAR images has been increased by combining different polarization images. In this work, four study areas in different covering environments have been selected. The interpretation keys of faults and circular structures in study areas can be established on the basis of the combination of different polarization images, by analyzing the unique color, topography, and hydrographic features of faults and circular structures. The structural features have been systematically interpreted on the basis of the interpretation keys in four study areas. To analyze the authenticity and accuracy of interpretation through GF-3 SAR images, the structural features have been compared with the faults in 1∶50000 mapping. The color combination of different polarization images in four study areas has been acquired through data processing. Interpretation keys of faults and circular structures in study areas have been established by analyzing the unique color, topography, and hydrographic features of faults and circular structures. The structures in study areas have been interpreted systematically. Structural feature maps interpreted through GF-3 SAR images in study areas have been drawn. The faults in 1∶50000 field maps are contained in the structures interpreted through GF-3 SAR images, compared with 1∶50000 field mapping. The position of faults in 1∶50000 mapping fits the position of faults interpreted through GF-3 SAR images. The number of faults interpreted through GF-3 SAR images is largely increased. In this study, SAR has been adopted to detect geology structures. GF-3 SAR images have been used in four study areas, namely, Gerze in Tibet, Nyingchi in Tibet, Qianjiadian in Beijing, and Sinan County in Guizhou Province. By investigating structural interpretation through GF-3 SAR images in study areas, the following conclusions can be obtained: (1) A new method of structural interpretation in meadow covering based on GF-3 Pol-SAR images has been established. (2) The interpretation keys of faults and circular structures in four study areas, namely, Gerze in Tibet, Nyingchi in Tibet, Qianjiadian in Beijing, and Sinan County in Guizhou Province, based on GF-3 SAR images have been established. (3) The faults and circular structures in study areas have been interpreted systematically through GF-3 SAR images. The faults in 1∶50000 map have been contained in structural features interpreted through GF-3 SAR images, compared with 1∶50000 field mapping. The number of faults interpreted through GF-3 SAR images is largely increased. These increased faults are mostly structures below the meadow covering that cannot be observed through field work and special remote sensing images. The structural interpretation in four study areas demonstrates its authenticity and accuracy through GF-3 SAR images. The method based on GF-3 SAR images can effectively compensate for the disadvantage of field work and spatial remote sensing in meadow covering.
Key words
GF-3, Pol-SAR, meadow covering, structure interpretation, Loop structure
1 引 言
地质构造在地质调查、矿产勘察等地质工作中具有重要意义,对反映地质构造格架、地质背景、成矿背景、成矿机制都有重要意义(侯增谦 等,2008;许志琴 等,2012)。为查明研究区的地质构造特征,大量的野外调查、槽探、光学遥感、地球物理等手段被应用在地质填图及矿产调查工作中(王根厚 等,2009;刘德长 等,2017;向杰 等,2016)。在实际地质调查工作中,受植被、第四系沉积物、风化物等地表覆盖影响,野外测量及光学遥感无法获取浅覆盖层以下的构造信息(Carter和Clift,2008), 而槽探因环境原因无法大范围开展。另一方面,地球物理手段不能详细的反映地质构造特征。目前,在覆盖区地质构造填图技术瓶颈亟待突破。
合成孔径雷达(SAR)对地表覆盖区具有一定的穿透性,具有全天时全天候工作的能力(Woodhouse,2006),能穿透地表浅覆盖层,对覆盖层以下的地质特征进行有效探测(Pour 等,2016),穿透深度与波长、地表介电常数、地表粗糙度有关(Spatz,1997)。SAR影像多用于对冰川、火山、地质灾害的探测及地表形变监测等方面(Wadhams 等,2004;Saepuloh 等,2012;Pour 等,2014;Pour和Hashim, 2014, 2015a, 2015b;邢学敏 等,2016),在地质中应用较少,Pour等人(2018)运用PALSAR影像系统地解译出了马来西亚中心成矿区的断裂构造。利用SAR影像对浅覆盖区地质构造解译相关研究成果极少,而利用GF-3全极化SAR影像在地表浅覆盖区进行地质构造解译的相关研究成果在国内未见有公开发表。
本文利用高分三号(GF-3)全极化影像,开展了典型地表浅层覆盖区域断裂构造等信息的解译探索,提出了一种地表浅覆盖区域地质构造解译的新方法,利用SAR的穿透性对地表浅覆盖区地质构造进行解译,丰富在浅覆盖区获取的地质构造信息。
2 试验区及数据源介绍
本次试验选取藏北阿里地区改则县北部、西藏林芝地区东北部、贵阳市思南县、北京市千家店镇为试验区,分别验证GF-3全极化SAR影像地质构造解译在不同环境背景下的适用性。藏北阿里地区第四系及风化物覆盖,藏南林芝地区常年积雪及寒带植被覆盖,贵州市常年多云多雨且热带植被覆盖,北京千家店镇温带植被覆盖区域,均为不同类型的浅覆盖区,地表露头出露少。
GF-3卫星有12种成像模式,是目前世界上成像模式最多的SAR卫星(张庆君,2017)。基于极化SAR的成像机理,为综合利用地质构造在各极化方式影像上的特征,本文选取GF-3全极化条带成像模式(QPSⅠ)影像,所采用的数据为L1A级数据,影像编号见表1。
表 1 影像参数
Table 1 Image parameters
| 研究区位置 | 景序列号 | 成像模式 | 分辨率/m | 采集时间 |
| 西藏阿里地区 | 3340221 | QPSⅠ | 8 | 2017-03-17 |
| 西藏山南地区 | 4351717 | QPSⅠ | 8 | 2017-11-20 |
| 北京千家店 | 2223438 | QPSⅠ | 8 | 2017-03-06 |
| 贵州省贵阳市思南县 | 3143618 | QPSⅠ | 8 | 2016-12-21 |
3 数据处理
3.2 数据处理
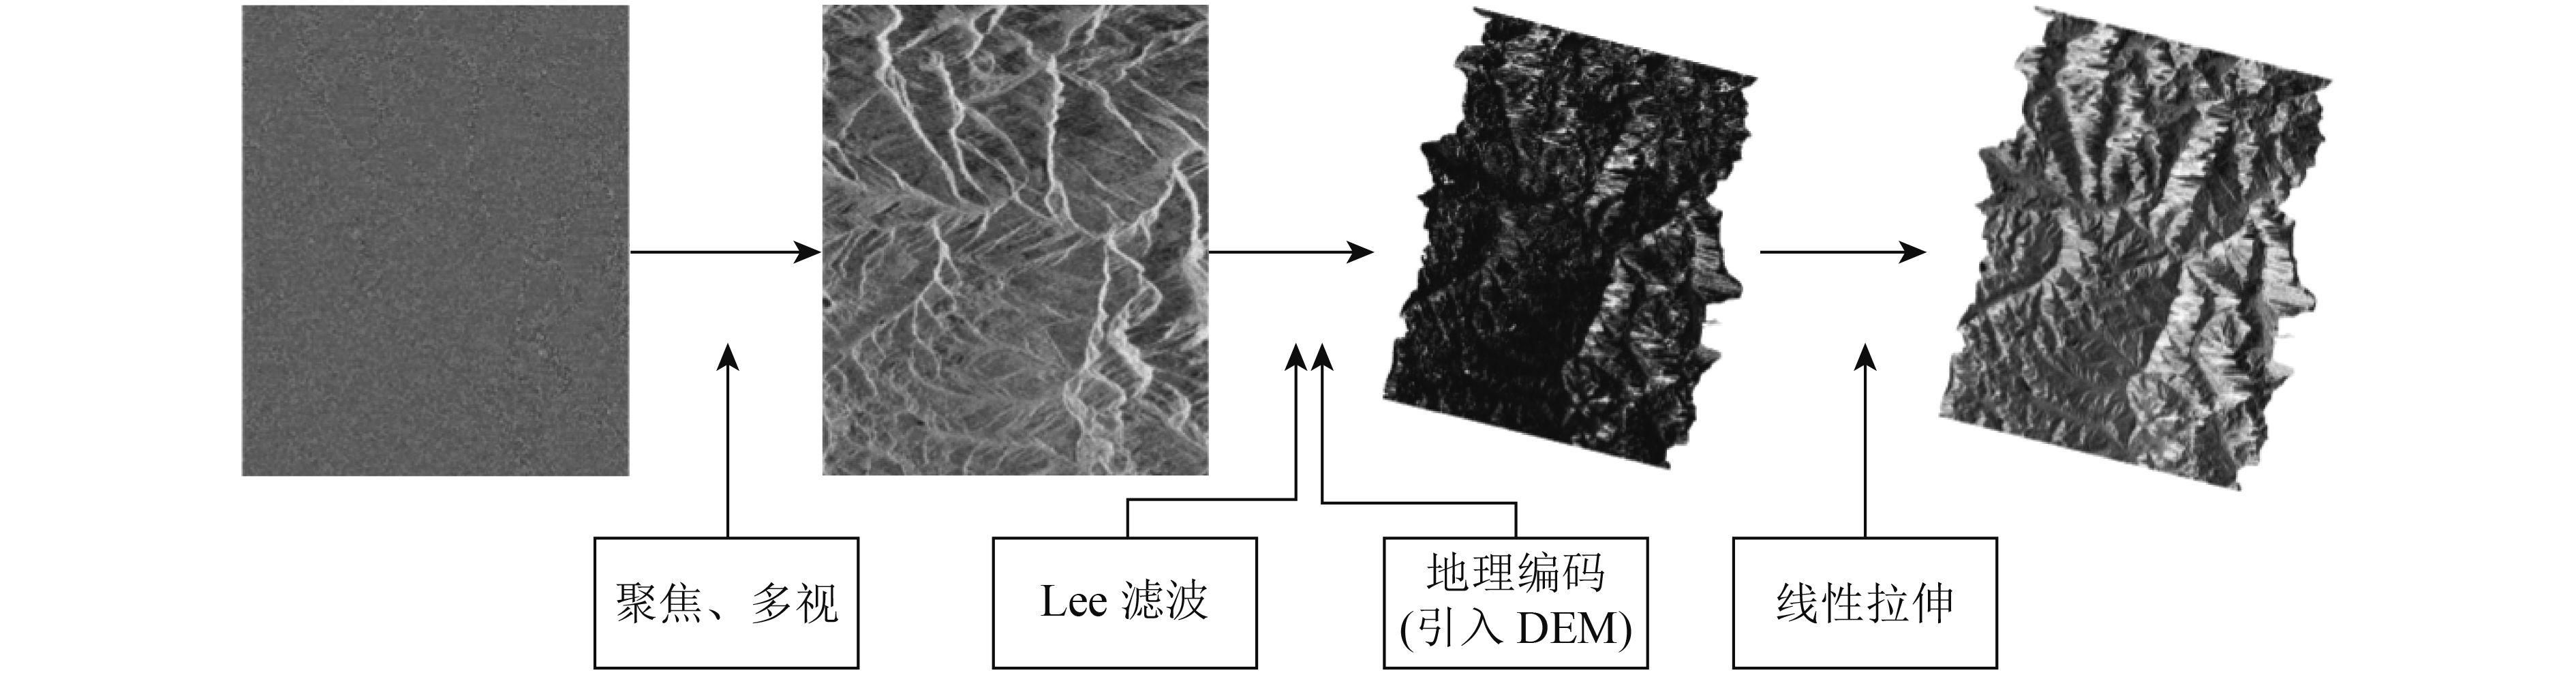
SAR影像的四种极化方式(HH、HV、VH、VV)分为单极化(HH、VV)和交叉极化(HV、VH)。其中单极化峰值特征表现为高峰值、高陡度,峰值较集中;交叉极化峰值特征表现为低峰值、低陡度,峰值较分散。为了充分利用地质特征在不同极化方式下的峰值差异,本文通过对不同极化模式的影像进行RGB合成(Pradipta 等,2016),将灰度影像转变为假彩色影像,以提高影像的解译性。交叉极化方式的峰值更分散,具有更多更明显的峰值信息,故选择其中一个为红色组成,绿色和蓝色由单极化(VV、HH)组成,这样在合成影像上可以显示出更多样化的特征。经过多次的试验,本文最终选择用HV-VV-HH作为R-G-B的组合方式进行彩色合成(图2)。


利用SAR影像的穿透性及其对微地形微地貌的灵敏性,多极化合成后影像可清晰地反映地表覆盖层下的地质特征。通过对比分析线性构造两侧的色彩、纹理、地形地貌、水系特征,本文建立了GF-3全极化影像下的断层解译标志(表2)。
表 2 解译标志
Table 2 Interpretation keys
| 直接解译标志 | 间接解译标志 | |||
| 断裂构造 | 颜色 | 地形地貌 | 水系特征 | |
| 地质体及两侧纹理的
交切关系 |
统一颜色背景下的异色线性; 两侧颜色存在明显差异且边 界呈线性分割 |
线性分布的断层崖、断层
三角面。线性河谷。线性 分布的低洼或泉眼 |
水系沿一定方向规则的折
曲。串珠状泉眼、湖泊 |
|
| 环带构造 | 呈圆形、椭圆形出露
的穹窿或凹陷 |
圆形或椭圆形出露的颜色与
围岩存在明显差异的区域 |
圆形或椭圆形出露的穹
窿、凹陷、沟谷等 |
河流呈环形或近环形 |
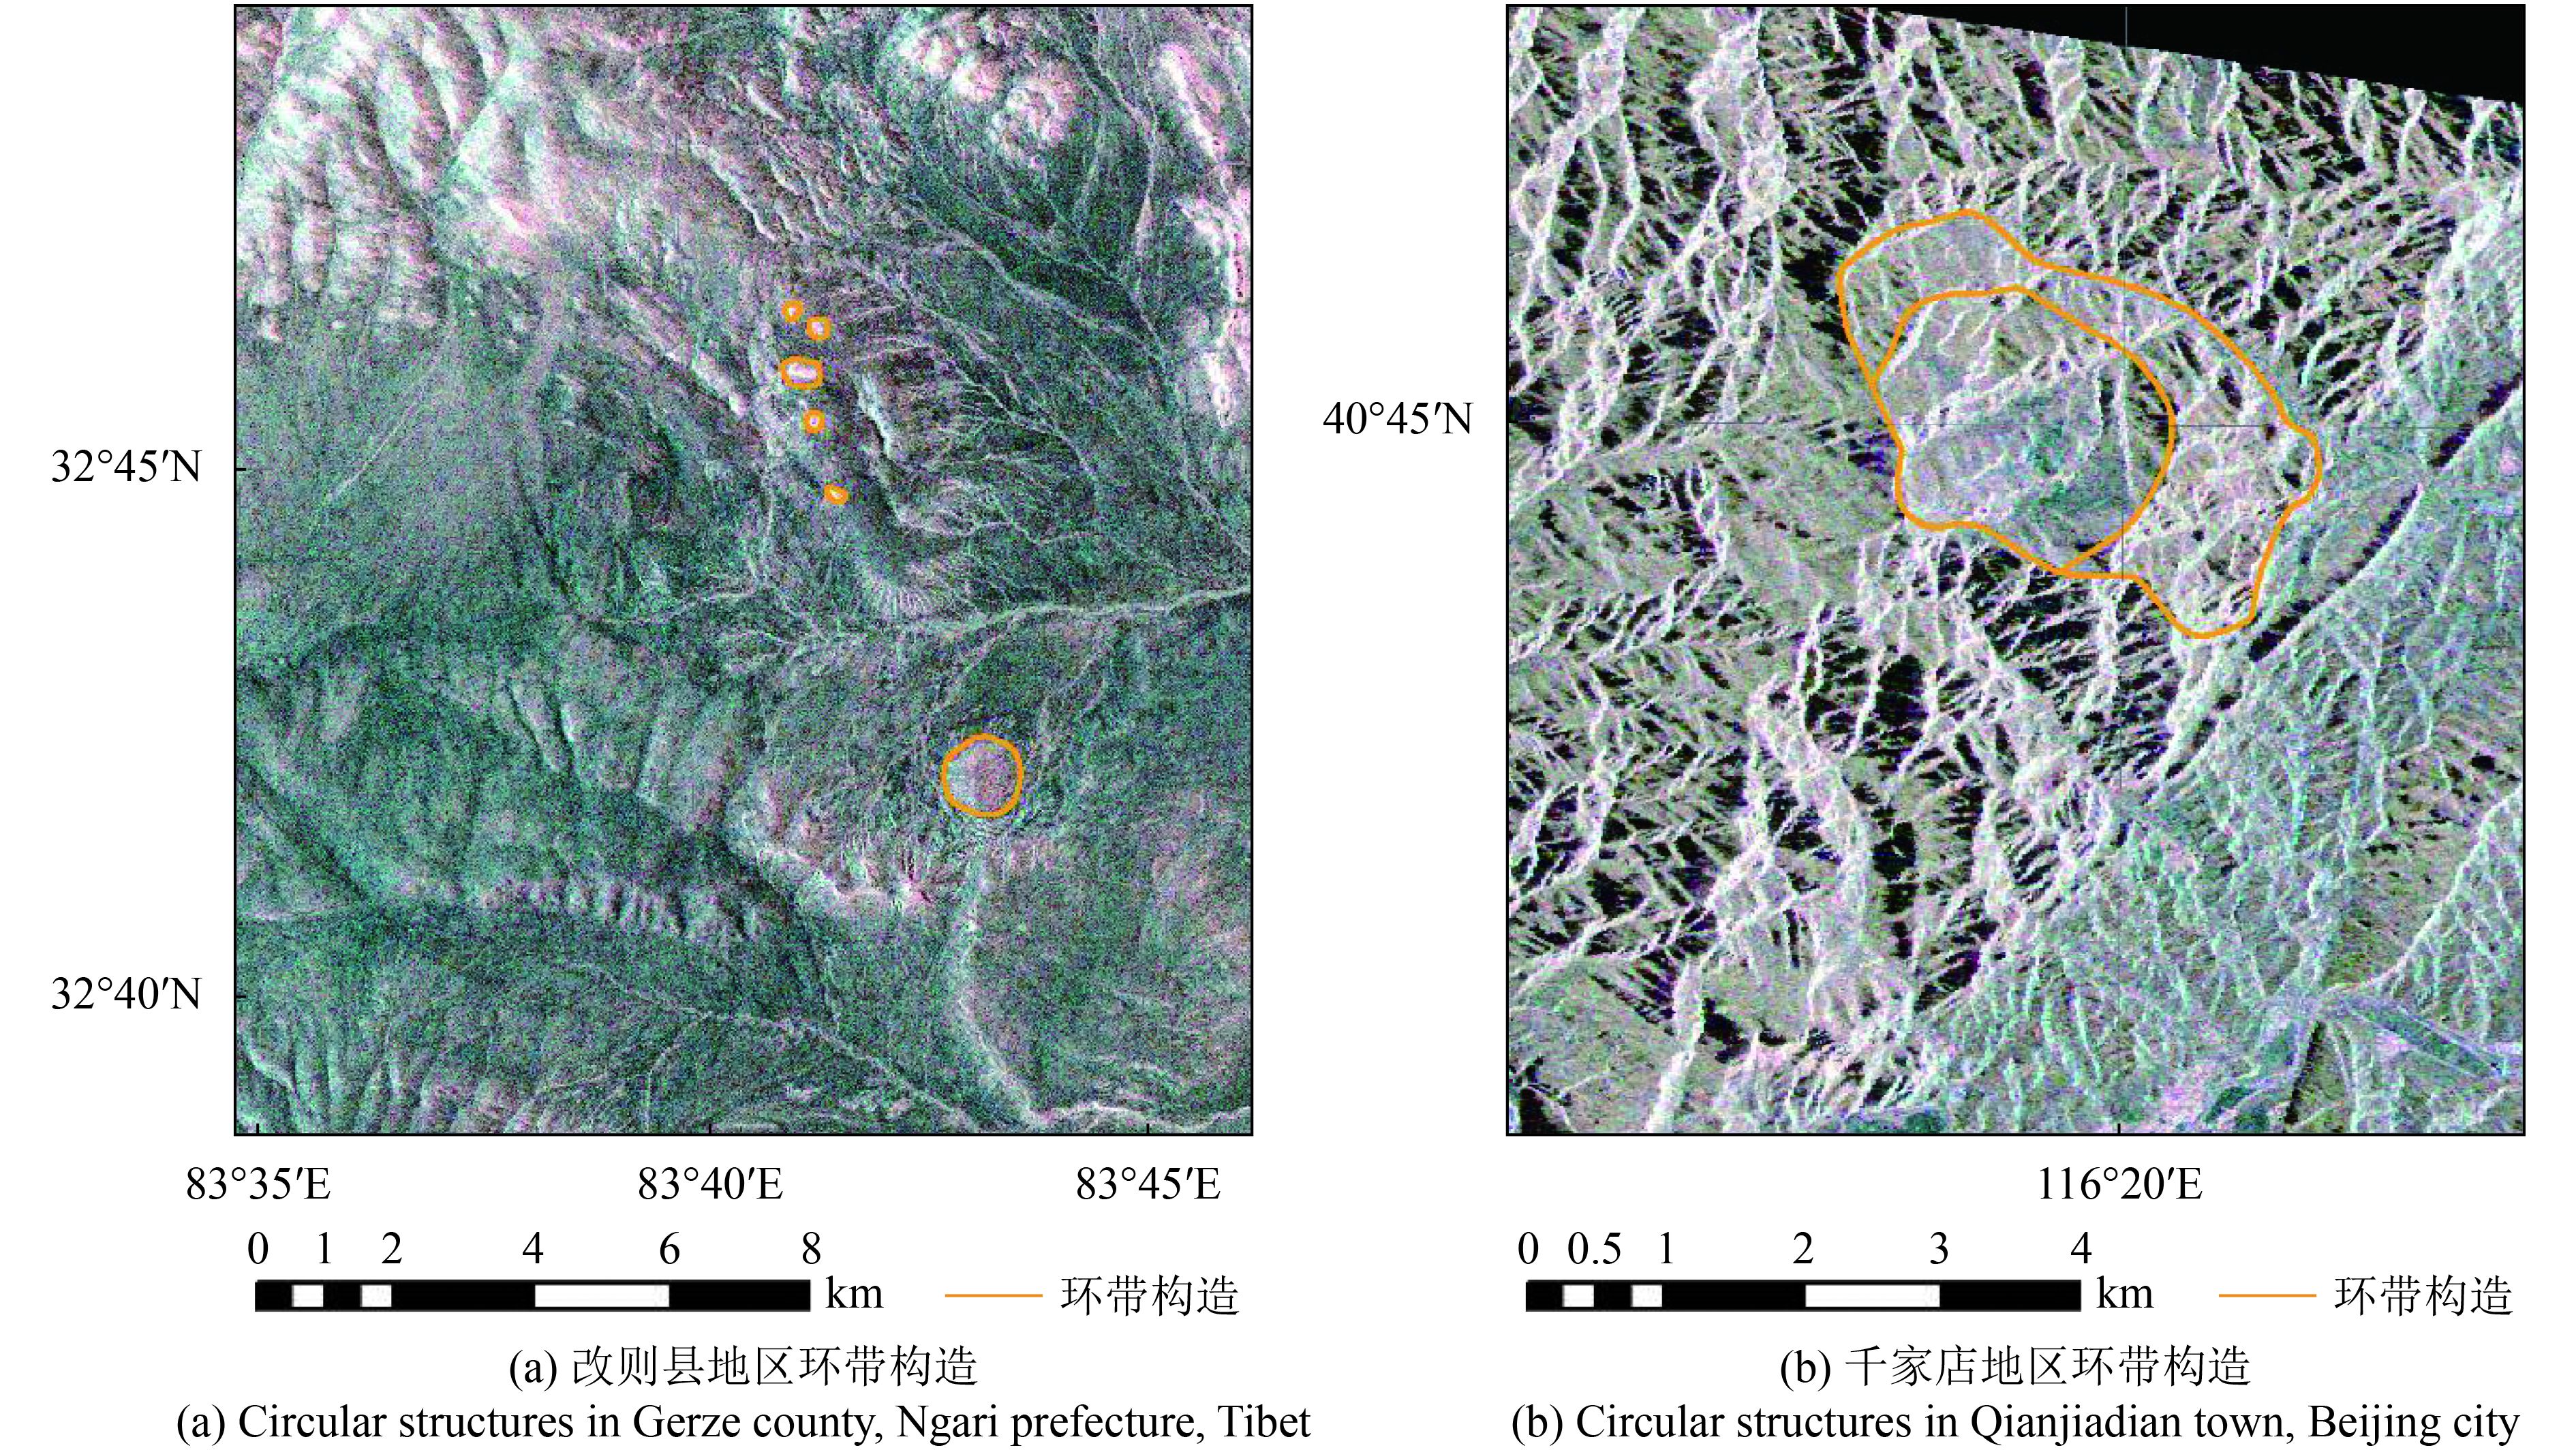
通过对地质体的切割及纹理交错等直接解译标志和颜色、地形地貌、水系特征等间接解译标志的识别,本文对研究区内的断裂构造和环带构造进行了系统地解译(图6)。断裂构造的局部放大图见图3,环带构造的局部放大图见图4。


4 结果分析
GF-3为C波段极化SAR卫星,具有多种极化方式。微波的地表穿透能力、成像效果与地表介电常数、地表粗糙度有关(Spatz,1997)。不同地区的地表介电常数和地表粗糙度不一样,GF-3的探测效果也不一样。根据中国高分辨率地表粗糙分布图(李沁怡 等,2014),西藏阿里地区为高原草甸地表粗糙度最低约为0.01—0.05 m,林芝地区地表粗糙度约为0.05—0.1 m,北京地区地表粗糙度约为0.1—0.2 m,贵州地区地表粗糙度约为0.2—0.4 m。观测地表的介电常数与该区的含水量及地表土壤成分有关。综合比较各研究区的图像目视效果(图2)及构造解译效果(图6),GF-3全极化影像在西藏阿里地区(图2(a))、西藏林芝地区(图2(b))的图像效果和解译效果最好,贵州贵阳市(图2(c))和北京千家店镇(图2(d))图像效果次之。
以林芝地区为例,高原冻土地区地表植被稀少,地表覆盖物多为积雪、浅草、裸土、矮树,风化作用强,浅覆盖区域广。如图5(a)所示,GF-3全极化影像在高原冻土地区探测效果最为明显,GF-3能有效的穿透地表的积雪及风化壳并对浅覆盖层以下的地质构造特征进行有效探测,而同区的光学影像(图5(b))受积雪等覆盖物的影响,地质构造特征在影像上反映不明显。相较于同区光学影像(图5(b)),GF-3全极化影像对构造特征的反映能力更强,构造局部特征反映的更加清晰,在浅覆盖区的地表构造信息获取能力明显增强。
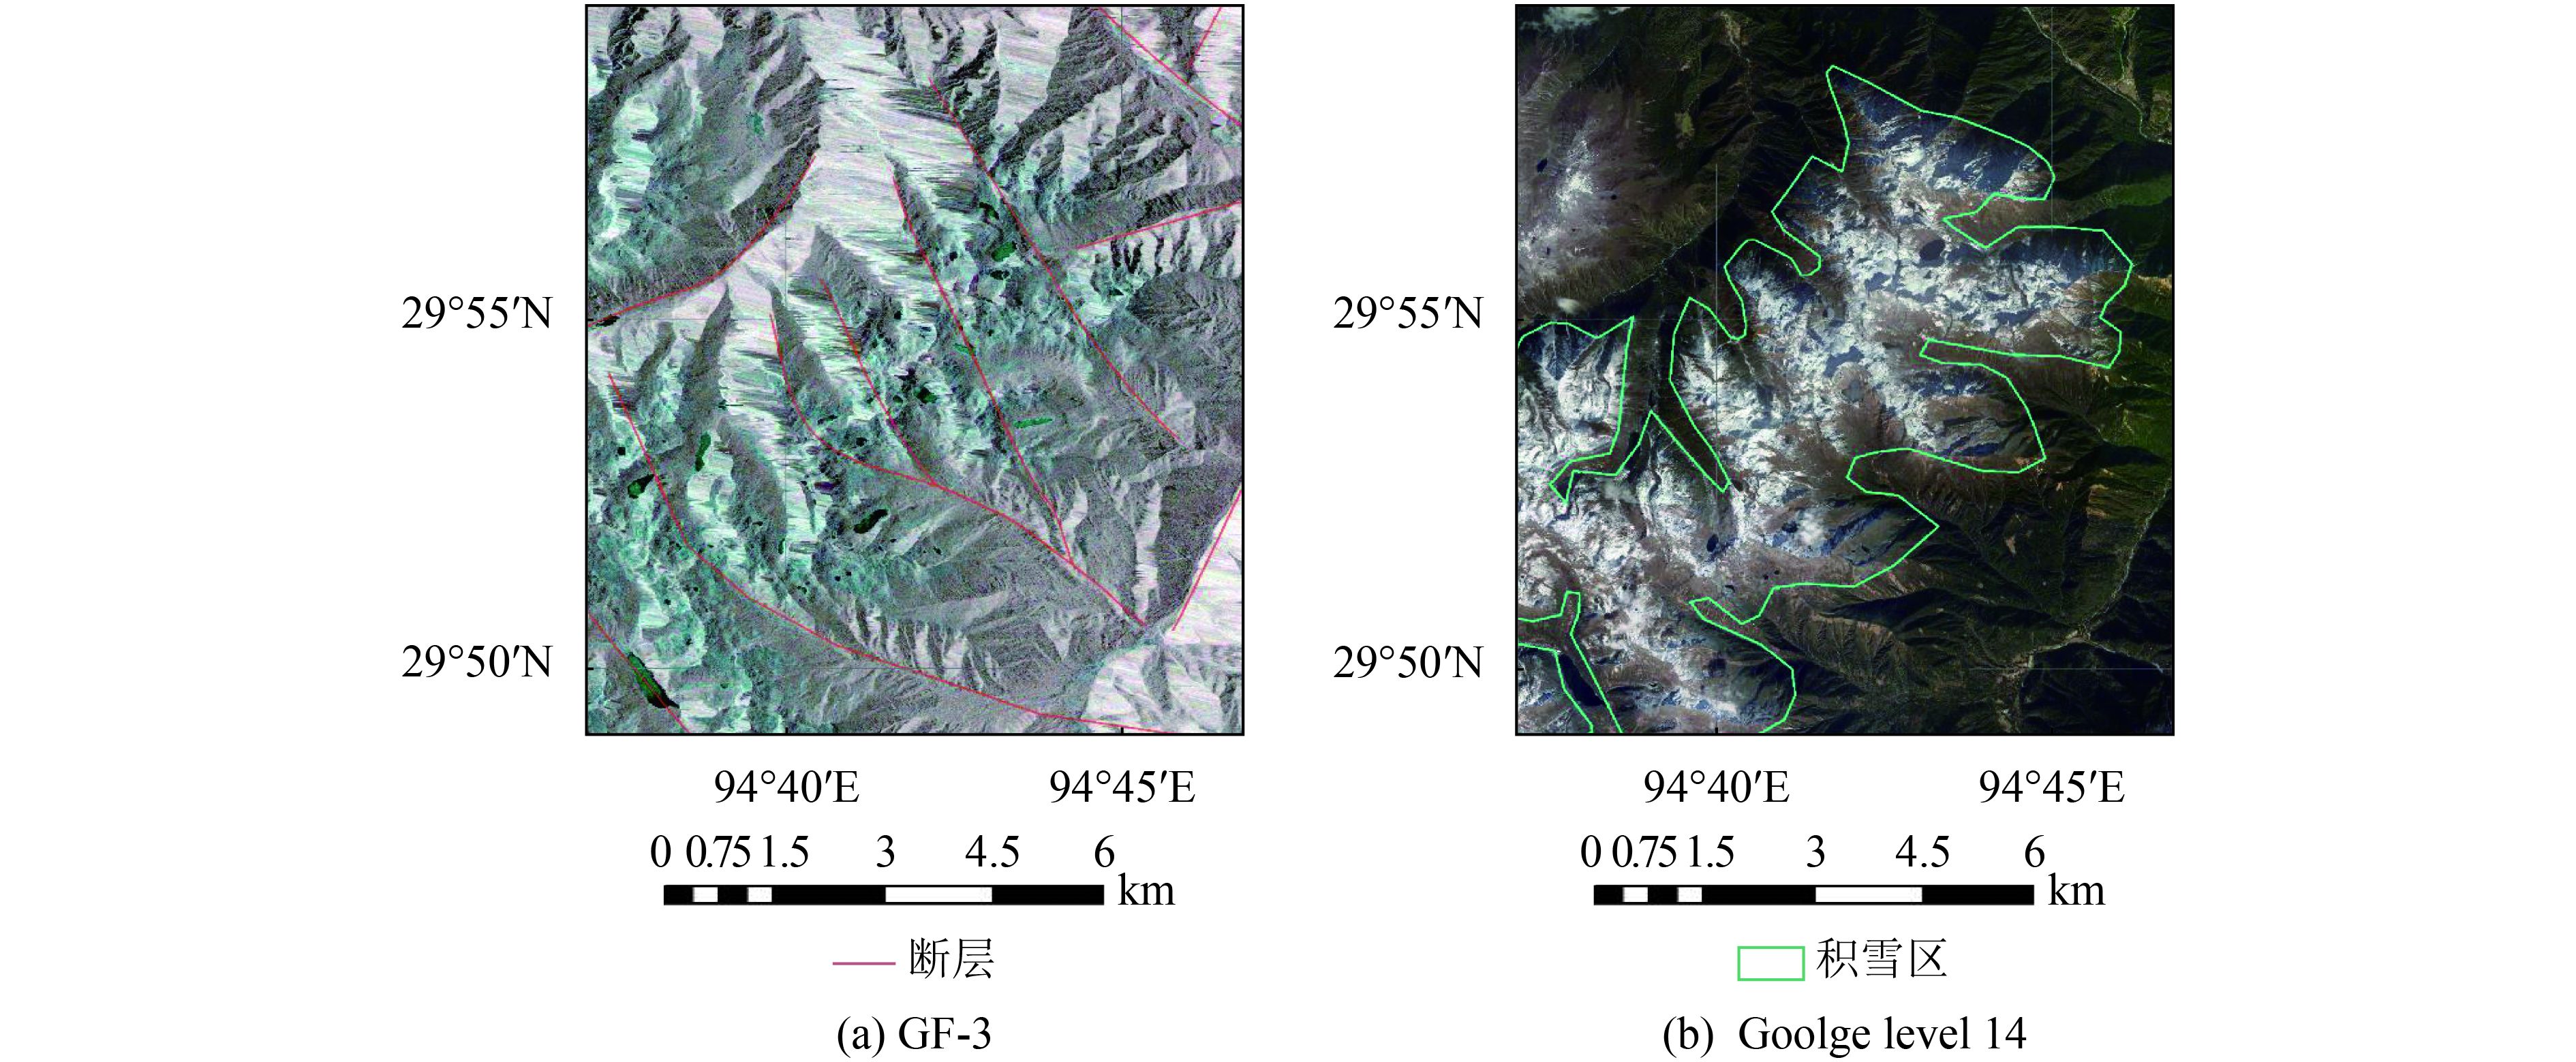
利用SAR的穿透性,GF-3全极化影像(图3)对断裂构造的交切关系反映的更加清晰,通过影像可直接反映浅覆盖层下的断层交切关系,对构造的细节特征更灵敏。通过不同方向的断裂构造交切关系,可以进一步划定断裂构造的期次,对分析浅覆盖区的地质构造背景有重要意义。相较于GF-3全极化影像,受后期的风化作用及地表覆盖物的影响,断裂构造之际间的交切关系在光学影像(图5(b))上并不清晰。
通过GF-3全极化影像,浅覆盖层之下的断裂构造和环带构造可以被有效解译(图4)。通过GF-3全极化影像解译出的构造特征(图6中红色细线)与1∶50000地质图中的对应构造特征(图6中蓝色细线)在位置及方向上基本一致(图6)。同时大量在实际填图过程中因地表浅覆盖层而未能识别的构造特征在GF-3全极化影像上可有效识别。GF-3全极化影像大大提高了识别的构造数量(图6),提高了在浅覆盖区的构造信息获取能力,对进一步的地质分析及成矿预测具有重要意义。
5 结 论
藏北阿里地区第四系及风化物覆盖,藏南林芝地区常年积雪及寒带植被覆盖,贵州市常年多云多雨且热带植被覆盖,北京千家店镇温带植被覆盖区域,4个试验区均为不同类型的浅覆盖区,地表露头出露少。常规手段在4个试验区内难以探测第四系风化物、植被、积雪等覆盖物下的地质构造。本文利用SAR的穿透性,首次提出了基于GF-3全极化影像在浅覆盖区进行地表地质构造解译的新方法。
本次研究以西藏阿里地区、林芝地区、贵州思南县、北京千家店镇4个试验区为例,提出了GF-3全极化影像用于浅覆盖区地质解译的处理流程,并总结了构造特征在GF-3全极化影像中的解译标志,对相似气候环境及覆盖条件区域的GF-3全极化地质构造解译研究具有参考意义。通过将基于GF-3全极化影像的解译结果与同区1∶5万实测数据对比,有效验证了GF-3号卫星全极化影像在浅覆盖区构造解译的可行性。试验同时获取了大量野外实测未能探明的浅覆盖层以下的断层信息,进一步丰富了研究区的地质构造信息。试验结果表明:GF-3全极化影像不仅可用于浅覆盖区的地质构造解译,并且具有野外实测和光学遥感等常规手段所不能替代的独特优势。该方法是对浅覆盖区的常规工作手段的有效补充,对地质矿产调查具有重要意义。
利用高分辨率SAR影像进行地质构造解译研究是遥感地质领域一个全新的研究方向。本文首次验证了GF-3号卫星全极化影像的在浅覆盖区进行构造解译的可行性和优势性。本次研究在解译方式上尚采用人工目视解译,解译效率较低,下一步拟在分析地质构造特征的基础上研究基于GF-3全极化影像的地质构造自动化提取方法。
参考文献(References)
-
Carter A and Clift P D. 2008. Was the Indosinian orogeny a Triassic mountain building or a thermotectonic reactivation event?. Comptes Rendus Geoscience, 340 (2/3): 83–93. [DOI: 10.1016/j.crte.2007.08.011]
-
Hou Z Q, Song Y C, Li Z, Wang Z L, Yang Z M, Yang Z S, Liu Y C, Tian S H, He L Q, Chen K X, Wang F C, Zhao C X, Xue W W and Lu H F. 2008. Thrust-controlled, sediments-hosted Pb-Zn-Ag-Cu deposits in eastern and northern margins of Tibetan orogenic belt: geological features and tectonic model. Mineral Deposits, 27 (2): 123–144. [DOI: 10.16111/j.0258-7106.2008.02.001] ( 侯增谦, 宋玉财, 李政, 王召林, 杨志明, 杨竹森, 刘英超, 田世洪, 何龙清, 陈开旭, 王富春, 赵呈祥, 薛万文, 鲁海峰. 2008. 青藏高原碰撞造山带Pb-Zn-Ag-Cu矿床新类型: 成矿基本特征与构造控矿模型. 矿床地质, 27 (2): 123–144. [DOI: 10.16111/j.0258-7106.2008.02.001] )
-
Li Q Y, Cai X H and Song Y. 2014. Research of the distribution of national scale surface roughness length with high resolution in China. Plateau Meteorology, 33 (2): 474–482. [DOI: 10.7522/j.issn.1000-0534.2012.00191] ( 李沁怡, 蔡旭晖, 宋宇. 2014. 中国高分辨率地表粗糙度分布研究. 高原气象, 33 (2): 474–482. [DOI: 10.7522/j.issn.1000-0534.2012.00191] )
-
Liu D C, Zhao Y J, Ye F W, Tian F and Qiu J T. 2017. Study on the metallogenic background of the Liuyuan–Fangshankou area by using airborne hyperspectral remote sensing. Journal of Remote Sensing, 21 (1): 136–148. [DOI: 10.11834/jrs.20175186] ( 刘德长, 赵英俊, 叶发旺, 田丰, 邱骏挺. 2017. 航空高光谱遥感区域成矿背景研究—以甘肃柳园—方山口地区为例. 遥感学报, 21 (1): 136–148. [DOI: 10.11834/jrs.20175186] )
-
Liu L, Yang X Z, Zhou F and Lang W H. 2017. Non-local filtering for polarimetric SAR data based on three dimensional patch matching wavelet transform. Journal of Remote Sensing, 21 (2): 218–227. [DOI: 10.11834/jrs.20176257] ( 刘留, 杨学志, 周芳, 郎文辉. 2017. 3维块匹配小波变换的极化SAR非局部均值滤波. 遥感学报, 21 (2): 218–227. [DOI: 10.11834/jrs.20176257] )
-
Pour B A and Hashim M. 2014. Structural geology mapping using PALSAR data in the Bau gold mining district, Sarawak, Malaysia. Advances in Space Research, 54 (4): 644–654. [DOI: 10.1016/j.asr.2014.02.012]
-
Pour A B and Hashim M. 2015a. Structural mapping using PALSAR data in the Central Gold Belt, Peninsular Malaysia. Ore Geology Reviews, 64 : 13–22. [DOI: 10.1016/j.oregeorev.2014.06.011]
-
Pour A B and Hashim M. 2015b. Integrating PALSAR and ASTER data for mineral deposits exploration in tropical environments: a case study from Central Belt, Peninsular Malaysia. International Journal of Image and Data Fusion, 6 (2): 170–188. [DOI: 10.1080/19479832.2014.985619]
-
Pour A B, Hashim M, Makoundi C and Zaw K. 2016. Structural mapping of the Bentong-Raub Suture Zone using PALSAR remote sensing data, Peninsular Malaysia: implications for sediment-hosted/orogenic gold mineral systems exploration. Resource Geology, 66 (4): 368–385. [DOI: 10.1111/rge.12105]
-
Pour B A, Hashim M and Marghany M. 2014. Exploration of gold mineralization in a tropical region using Earth observing-1 (EO1) and JERS-1 SAR data: a case study from Bau gold field, Sarawak, Malaysia. Arabian Journal of Geosciences, 7 (6): 2393–2406. [DOI: 10.1007/S12517-013-0969-3]
-
Pour A B, Hashim M and Park Y. 2018. Gondwana-derived terranes structural mapping using PALSAR remote sensing data. Journal of the Indian Society of Remote Sensing, 46 (2): 249–262. [DOI: 10.1007/s12524-017-0673-y]
-
Pradipta R A, Saepuloh A and Suryantini. 2016. Geology structure identification based on Polarimetric SAR (PolSAR) data and field based observation at Ciwidey geothermal field. IOP Conference Series: Earth and Environmental Science, 42 (1): 012008 [DOI: 10.1088/1755-1315/42/1/012008]
-
Saepuloh A, Koike K and Omura M. 2012. Applying Bayesian decision classification to Pi-SAR polarimetric data for detailed extraction of the geomorphologic and structural features of an active volcano. IEEE Geoscience and Remote Sensing Letters, 99 (4): 554–558. [DOI: 10.1109/LGRS.2011.2174611]
-
Spatz D M. 1997. Remote sensing characteristics of the sediment-and volcanic-hosted precious metal systems: imagery selection for exploration and development. International Journal of Remote Sensing, 18 (7): 1413–1438. [DOI: 10.1080/014311697218205]
-
Wadhams P, Parmiggiani F F, de Carolis G, Desiderio D and Doble M J. 2004. SAR imaging of wave dispersion in Antarctic pancake ice and its use in measuring ice thickness. Geophysical Research Letters, 31 (15): L15305 [DOI: 10.1029/2004GL020340]
-
Wang G H, Han F L, Yang Y J, Li Y Q and Cui J L. 2009. Discovery and geologic significance of Late Paleozoic accretionary complexes in central Qiangtang, northern Tibet, China. Geological Bulletin of China, 28 (9): 1181–1187. [DOI: 10.3969/j.issn.1671-2552.2009.09.003] ( 王根厚, 韩芳林, 杨运军, 李元庆, 崔江利. 2009. 藏北羌塘中部晚古生代增生杂岩的发现及其地质意义. 地质通报, 28 (9): 1181–1187. [DOI: 10.3969/j.issn.1671-2552.2009.09.003] )
-
Woodhouse I H. 2006. Introduction to Microwave Remote Sensing. Boca Raton: CRC Press
-
Xiang J, Chen J P, Hu B, Hu Q and Yang W. 2016. 3D metallogenic prediction based on 3D geological-geophysical model: a case study in Tongling mineral district of Anhui. Advances in Earth Science, 31 (6): 603–614. [DOI: 10.11867/j.issn.1001-8166.2016.06.0603] ( 向杰, 陈建平, 胡彬, 胡桥, 杨伟. 2016. 基于三维地质—地球物理模型的三维成矿预测—以安徽铜陵矿集区为例. 地球科学进展, 31 (6): 603–614. [DOI: 10.11867/j.issn.1001-8166.2016.06.0603] )
-
Xing X M, He Y G, Wu F, Wen D B, Zhu J J and Xu P. 2016. Time series of subsidence inversion on mining area using PSInSAR. Journal of Remote Sensing, 20 (3): 491–501. [DOI: 10.11834/jrs.20165104] ( 邢学敏, 贺跃光, 吴凡, 闻德保, 朱建军, 徐鹏. 2016. 永久散射体雷达差分干涉反演矿区时序沉降场. 遥感学报, 20 (3): 491–501. [DOI: 10.11834/jrs.20165104] )
-
Xu Z Q, Yang J S, Li W C, Zeng L S and Xu C P. 2012. Tectonic background of important metallogenic belts in the southern and southeastern Tibetan Plateau and ore prospecting. Acta Geologica Sinica, 86 (12): 1857–1868. [DOI: 10.3969/j.issn.0001-5717.2012.12.001] ( 许志琴, 杨经绥, 李文昌, 曾令森, 许翠萍. 2012. 青藏高原南部与东南部重要成矿带的大地构造定格与找矿前景. 地质学报, 86 (12): 1857–1868. [DOI: 10.3969/j.issn.0001-5717.2012.12.001] )
-
Zhang Q J. 2017. System design and key technologies of the GF-3 satellite. Acta Geodaetica et Cartographica Sinica, 46 (3): 269–277. [DOI: 10.11947/j.AGCS.2017.20170049] ( 张庆君. 2017. 高分三号卫星总体设计与关键技术. 测绘学报, 46 (3): 269–277. [DOI: 10.11947/j.AGCS.2017.20170049] )


