|
收稿日期: 2017-03-16
基金项目: 国家国防科工局高分专项(民用部分)卫星应用共性关键技术项目(编号: 32-Y20A22-9001-15/17);中国科学院重点资助项目(编号: KGFZD-125-13-006);国家大科学工程航空遥感系统资助项目;中国资源卫星中心资助项目
第一作者简介: 陈震霆,1979年生,男,博士研究生,研究领域为卫星偏振遥感、云偏振特性研究。E-mail:cztgis@qq.com
通信作者简介: 孙晓兵,1966年生,男,研究员,研究领域为大气偏振遥感、地物偏振特性研究。E-mail:xbsun@aiofm.ac.cn
|
摘要
太阳光入射海表特定区域形成海洋耀光,呈强反射和偏振特性。在卫星海洋遥感中,海洋耀光对遥感成像质量有较大影响,尤其对海洋上空云、气溶胶及海色等研究干扰较大,因此剔除海洋耀光是卫星遥感数据处理过程中首先要解决的重要问题。以PARASOL卫星的POLDER3载荷数据为研究对象,获取载荷成像时刻太阳及观测几何、海表风速风向及气溶胶光学厚度等参数,采用海气辐射传输相关理论,结合耀光角和多角度NIR偏振辐射信息(865 nm),构建基于近红外偏振辐射特性规则的OGDD模型,获取耀光角临界值实现耀光动态检测。以印度洋某海区为研究对象,获取实测耀光区NIR通道的大气层顶反射率和偏振反射率,利用OGDD模型将耀光角判别临界值调整为34°。相比MODIS经验临界值(40°),标记耀光像元相对减少了30%。结果表明,该方法不仅能通过动态调整临界值准确识别海洋耀光,为云检测及云物理特性反演提供可靠的源数据,还能为高分五号卫星多角度偏振载荷在轨定标及气溶胶反演提供支持。
关键词
PARASOL, 海气辐射, 海洋耀光, 辐射信息, 偏振反射率, 动态检测, 高分五号, 偏振遥感
Abstract
Sunlight incoming sea surface forms ocean glint (OG) in a special area and shows strong reflection and polarization characteristics. OG significantly influences the imaging quality of ocean remote sensing, especially because the interference is large for clouds and aerosols above the ocean surface. Therefore, eliminating OG is the key problem to be solved in the process of remote sensing data. At present, most OG detections of sensors are utilized by a rough sea surface polarization model combined with an empirical threshold. Orbit height and resolution is different from various sensors available. Thus, the result is quite inaccurate using the same threshold to discriminate glint pixels, thereby resulting in several pixels being utilized ineffectively. The Chinese GF-5 satellite has been scheduled for launch in 2017. It carries a Directional Polarimetric Camera (DPC) sensor for the atmospheric polarization research at a global scale. Similarly, the OG detection is essential to DPC data processing. The traditional method cannot achieve the dynamic detection of OG for different satellite data. Thus, the problem of accurately obtaining a threshold angle has become the key difficulty of OG dynamic detecting research. OG dynamic detecting (OGDD) method was proposed on the basis of near-infrared (NIR) polarized data, which were not easily affected by atmospheric disturbance under a clear sky. From these data, several parameters, such as the geometry conditions of solar and observation and sea surface wind speed and direction, could be obtained. According to ocean–atmosphere coupled radiative transfer theory, the OGDD model, combined with the OG and multi-directional NIR-polarized radiation information (865 nm), was developed on the basis of the regular performance of the NIR-polarized radiation characteristic. The OGDD was realized by obtaining the dynamic threshold of a glint angle. A calibration layer was selected by using the polarized characteristic tendency of an OG center from detecting layers, and after cloudy pixels have been removed, a slope dynamic analysis was conducted on the basis of an OG-polarized radiative regular variety on top of the atmosphere. Finally, the ocean pixels were marked as glint pixels using the dynamic threshold of the glint angle. This study used PARASOL/POLDER3 satellite data as the research object for the DPC simulation and selected the Indian Ocean as the study area. The NIR channel utilized the OGDD model to acquire apparent and polarization reflectivity (865 nm) of the sea surface. The glint threshold was adjusted dynamically to 34° using the OGDD model. In comparison with MODIS 40°, the glint angle was reduced by approximately 15%, and the pixel-marked glint was relatively decreased by 30%. Similarly, in comparison with POLDER3 30°, the glint angle was relatively improved by nearly 13%, and the pixel-marked glint was increased by 30%. The model can effectively distinguish the glint and non-glint pixels through a dynamically adjusted threshold and significantly improve the utilization rate of the pixels by reducing the interference of aerosol retrieval at the clear sky area. Furthermore, this model can generate reliable data for cloud detection and microphysical characteristic retrieval and provide support to developing the in-flight calibration and aerosol inversion of the GF-5 satellite multi-angle polarization sensor.
Key words
PARASOL, ocean-atmosphere coupled radiation, ocean glint, radiation information, polarized reflectance, Ocean Glint Dynamic Detecting, GF-5, polarization remote sensing
1 引 言
地球表面约3/4被海洋覆盖,海洋在大气辐射传输、水循环和全球气候变化中起着至关重要的作用(陈兴峰 等,2011)。在海洋遥感中卫星接收的辐射信息主要包括大气散射、波浪镜面反射、海面白沫辐射和离水辐射等,其获取和处理方式直接影响海洋辐射信息探测的精度。特别是太阳光入射海表特定区域因波浪菲涅尔反射形成海洋耀光,对载荷成像质量影响巨大。该强反射区域通常称为海洋耀光区,具有显著的偏振辐射特性。研究海洋耀光辐射及偏振辐射特性与这些参数的关系,建立海洋耀光的检测方法,可以为卫星遥感影像的后续处理和高质量数据生产提供重要技术支持(毛志华 等,1996)。
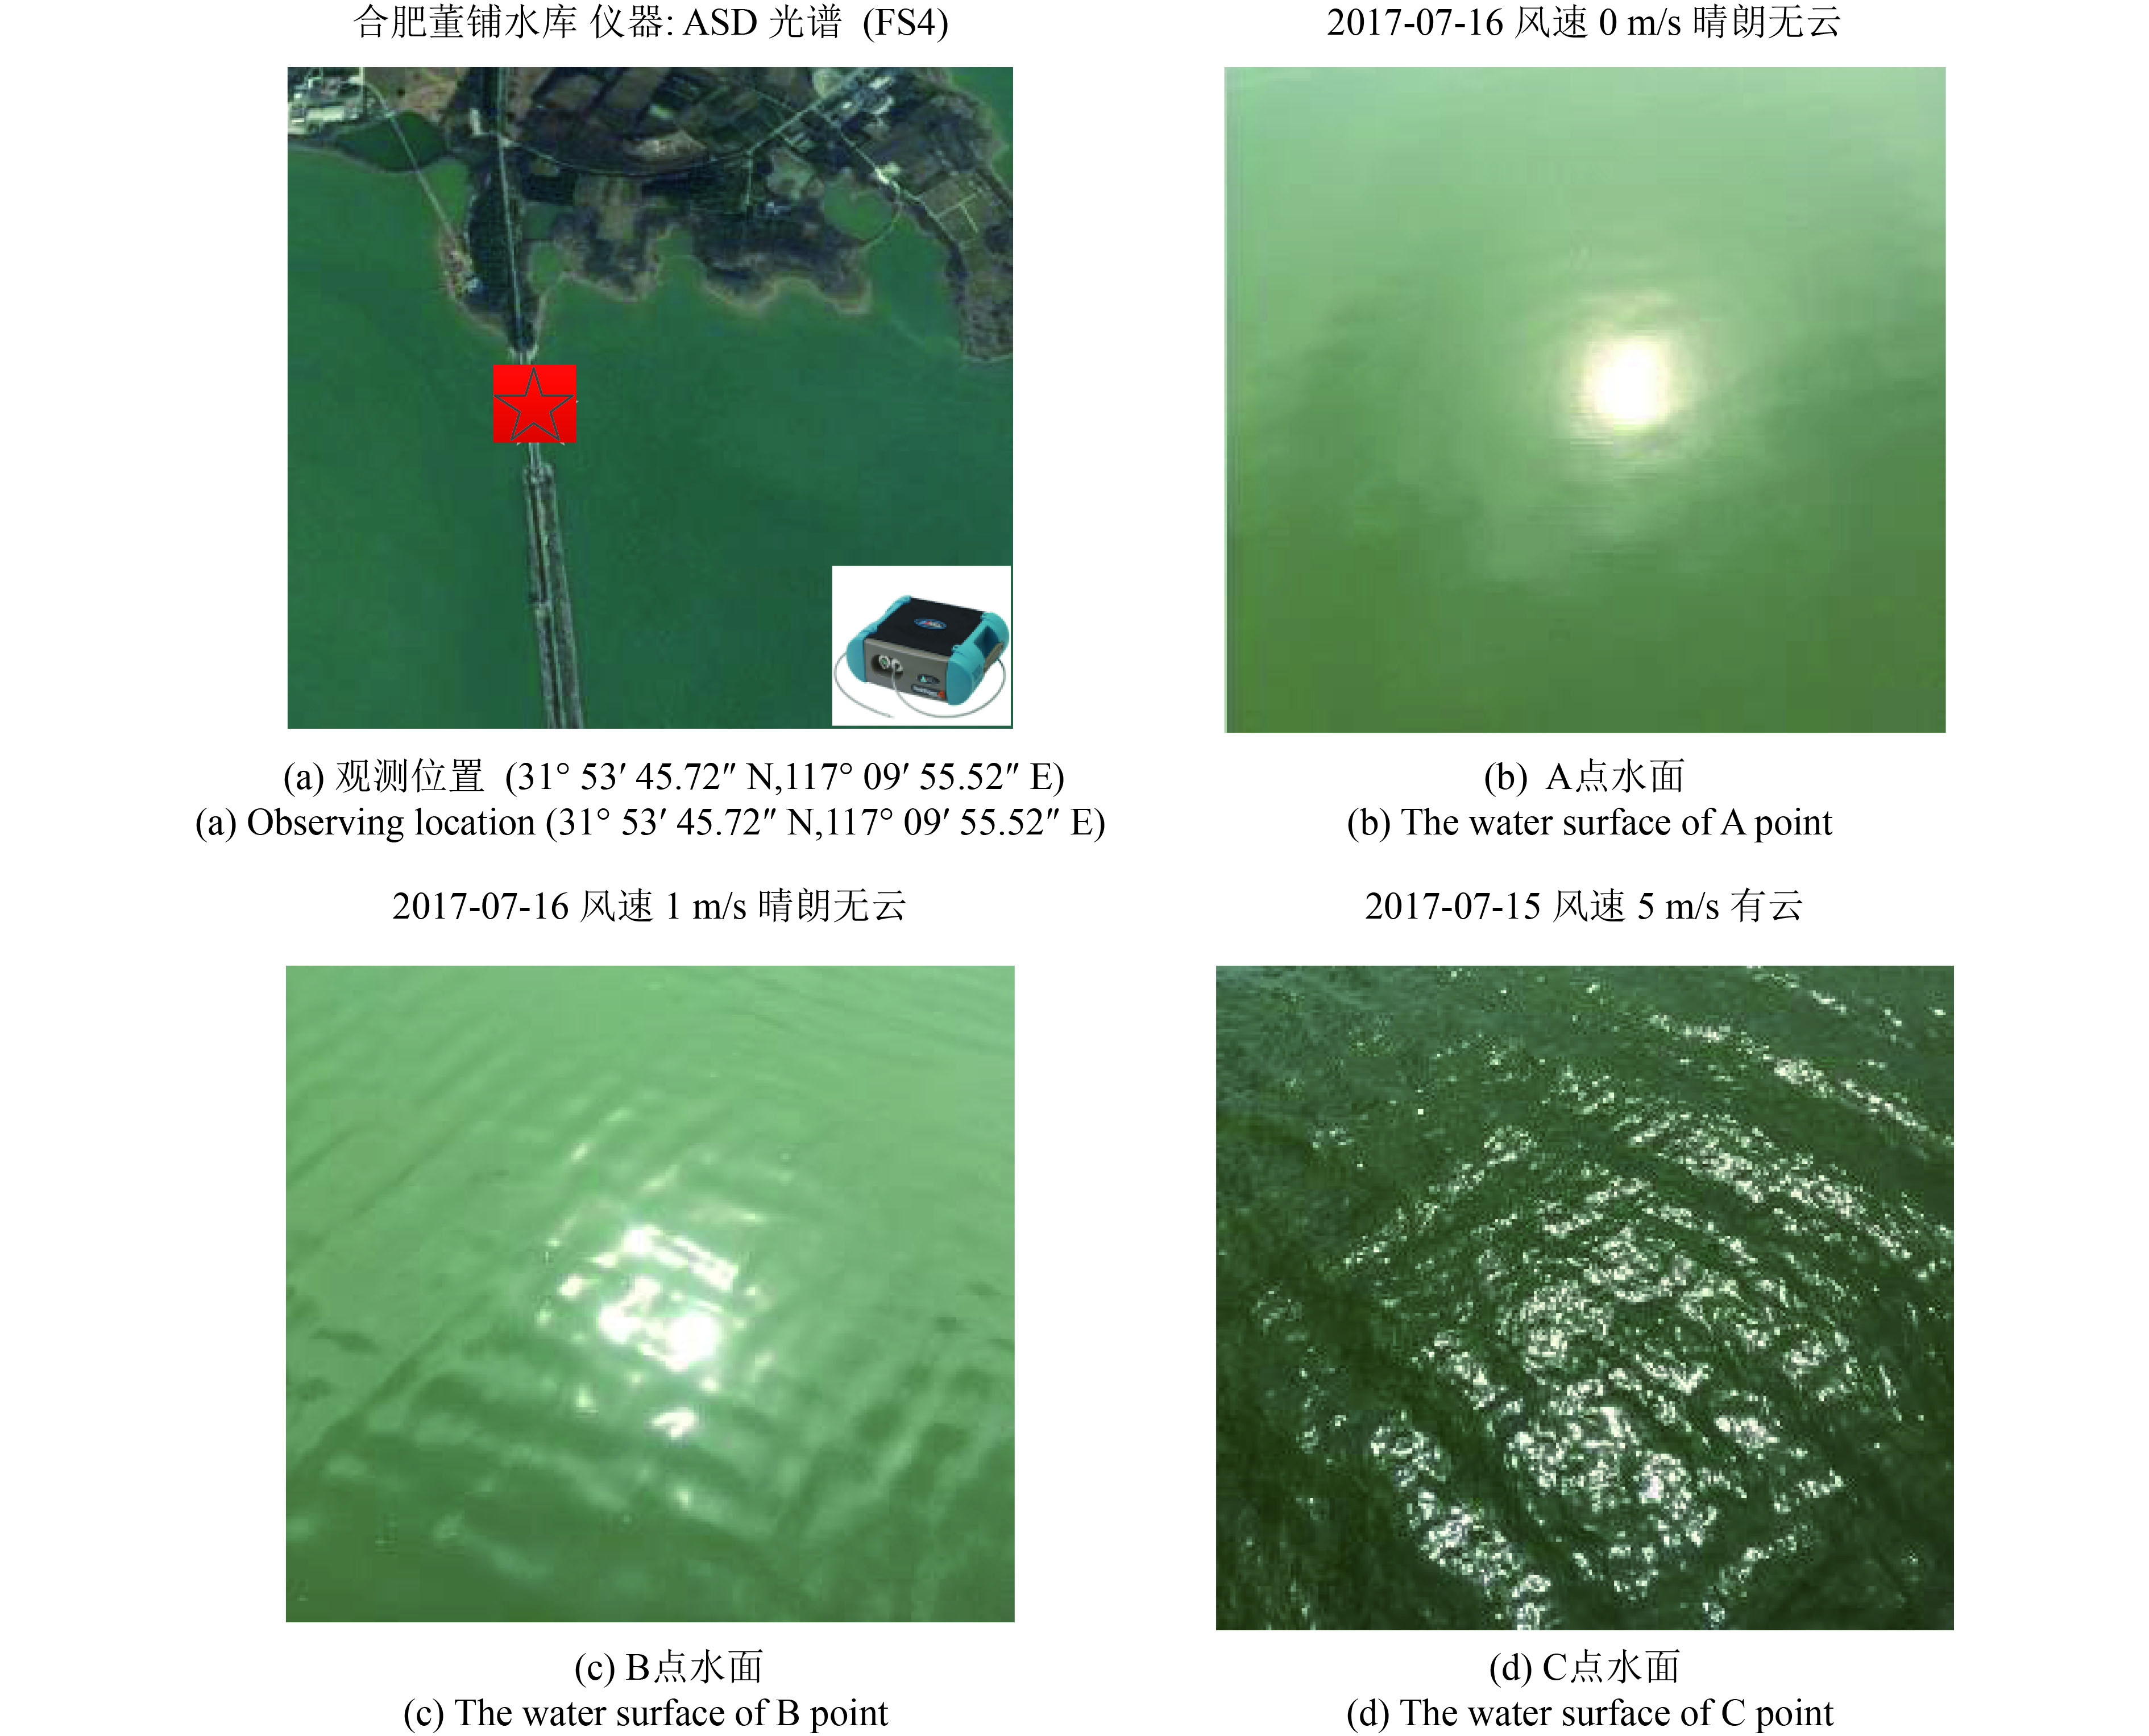
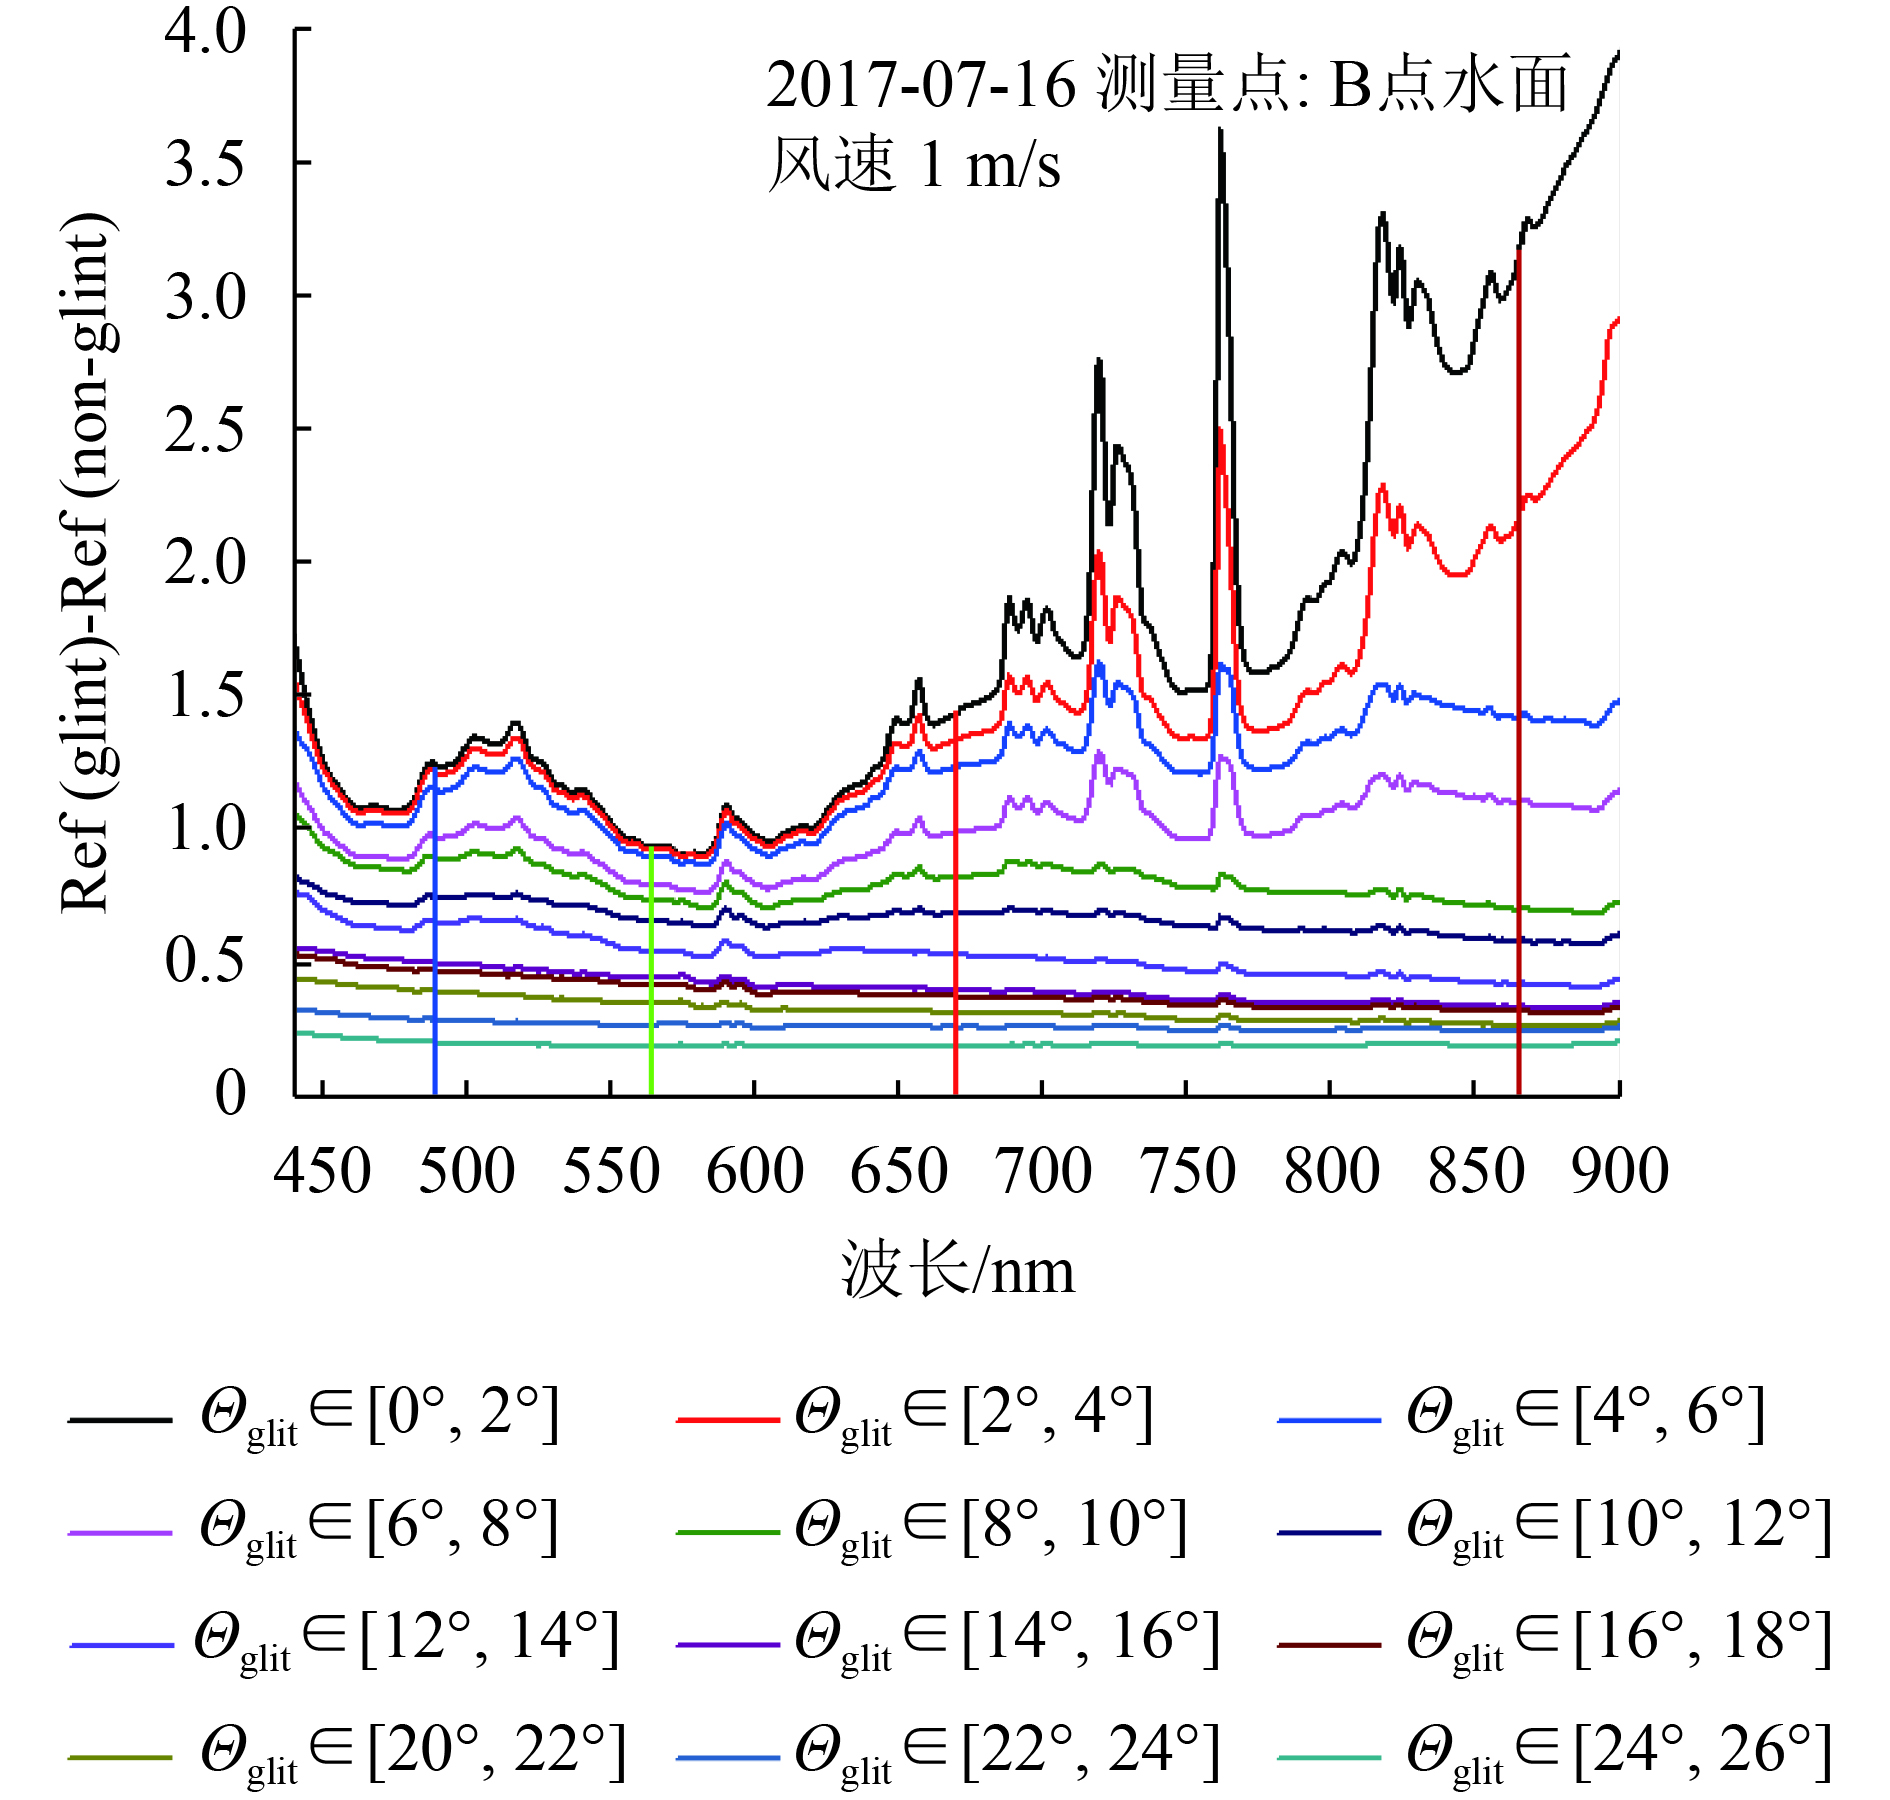
研究光学载荷接收到的耀光区辐射信息主要考虑来自水体贡献(Cox和Munk,1954a)。为进一步研究耀光区的辐射特性,作者在合肥董铺水库进行了水面耀光光谱实验研究(图1),可以看出耀光区的形状、大小和辐射特性与水面风速风向、太阳及观测几何等相关。通过对比可见光—近红外波段耀光区和非耀光区的反射率差异(图2),发现近红外(NIR)波段对耀光区辐射信息更加敏感,可有效用于耀光检测。通常大气层顶的偏振辐射信息受大气分子、云和气溶胶的影响,尤其在近红外波段更为突出。研究大气分子、云和气溶胶对偏振敏感性不同的特性(Li 等,2006;顾行发 等,2015;伽丽丽 等,2016),使偏振遥感在海洋和大气研究中更具优势。法国科学家从1996年—2004年先后发射3颗POLDER(Polarization and Directionality of Earth’s Reflectances)偏振载荷用于对地观测研究,在海气系统研究中提出了一些新方法。Bréon和Henriot(2006)在不考虑大气分子和气溶胶影响的情况下,利用NIR波段的POLDER数据研究了海洋耀光区辐射特性与海表波浪之间的关系,建立了海浪斜率分布的辐射特性模型。Goloub等人(1995, 1997)利用NIR波段偏振辐射信息进行了海洋上空云微物理特性研究和气溶胶参数反演(Bréon 等,1995;Deuzé 等,2001)。美国国家航空航天局为提高全球气溶胶特性探测精度,研发了APS(Aerosol Polarimetry Sensor)载荷。中科院安光所科研团队研制了星载多角度偏振探测仪 (DPC),高分五号卫星(GF-5)用于全球尺度的对地偏振遥感研究(顾行发 等,2015)。DPC在轨运行时,获取的观测数据需要经过一系列处理才能进行云和气溶胶特性反演,海洋耀光检测是数据处理的重要环节。目前国内外学者针对海洋耀光的检测提出了一系列方法,主要有Cox-Munk模型法(Cox和Munk,1954b)和经验值法。现有大多数载荷参考MODIS(Moderate Resolution Imaging Spectroradiometer) 40°耀光角经验值去除耀光(Remer 等,2005),法国的POLDER载荷联合粗糙海表偏振模型与经验临界值对耀光进行检测,其业务化处理采用30°经验值判别(Toubbe 等,1999)。以上方法虽然能一定程度检测出海洋耀光,但是采用上述经验临界值用于DPC载荷的海洋耀光检测并不十分准确,会导致一些像元漏检或误判为耀光像元,反演过程中像元的有效利用率降低。因此如何动态获取耀光角判别临界值是实现海洋耀光动态检测的关键,本文将针对此研究难点开展研究。
考虑DPC的主要技术指标参照法国POLDER载荷,本文以PARASOL(Polarization and Anisotropy of Reflectances for Atmospheric Sciences coupled with Observations from a Lidar)卫星搭载的POLDER3载荷一级数据产品为研究对象,结合海气辐射传输相关理论,考虑大气分子和气溶胶的影响,选取近红外(865 nm)偏振通道数据,提出基于NIR偏振辐射卫星数据的海洋耀光动态检测(OGDD)模型。该模型首先对海洋耀光的相关参量(耀光角和偏振辐射特性)进行计算,再利用耀光区偏振辐射特性规则表现的OGDD算法,获取准确的耀光角判别临界值,最后进行算法实验验证和结果分析。
2 海气辐射传输相关理论
在平面平行大气近似下,假设大气的光学和微物理特性水平均一不变(潘德炉 等,1997)。晴朗天气下海洋上空太阳辐射入射大气层,一部分经气体分子及气溶胶散射和吸收形成上行辐射,一部分下行到达海表,经海表吸收和镜面反射重新返回大气,另一部分透过海表,在海水次表面受叶绿素、悬浮颗粒和水溶物质等后向散射经海面折射再次返回大气,返回大气的辐射再次透过大气到达大气层顶(TOA)。可得卫星载荷入瞳处接收到海洋耀光区的总辐射量计算公式
| ${L_{\rm{tot}}} = t({L_{\rm{ray}}} + {L_{\rm{aer}}} + {L_{\rm{wat}}} + {L_{\rm{f}}}{\rm{ + }}{L_{\rm{glit}}})$ | (1) |
式中,
通常海洋耀光区的海气辐射传输按能量贡献大小分为耀光辐射、大气程辐射、离水辐射和白沫辐射等,其中后3者称为非耀光辐射。
2.1 非耀光辐射
大气程辐射由大气分子散射和气溶胶散射构成。考虑单次散射,其偏振光大气散射近似表示为(Toubbe 等,1999)
| $\rho _{\rm{pol}}^{\rm{X}} = \frac{{{\text{π}} L_{\rm{pol}}^{\rm{X}}}}{{E\cos {\theta _s}}} = \frac{{{\text{π}} \cdot {\tau ^{\rm{X}}}q_\lambda ^{\rm{X}}(\Theta)}}{{4E\cos {\theta _s}\cos {\theta _v}}}$ | (2) |
式中,
离水辐射包括可见光离水辐射和荧光离水辐射。即一部分太阳光透过海表向下传输时受水色因子(叶绿素、悬浮颗粒等)后向散射经水面折射出射,另一部分受叶绿素影响产生荧光出射海表(潘德炉 等,1997)。
白沫辐射由海洋表面泡沫覆盖比率决定。海洋白沫贡献同样采用各向同性朗伯反射
2.2 耀光辐射
由上述海气辐射传输理论可知,相对于海洋耀光区卫星载荷接收到的总辐射能量,离水辐射和白沫辐射贡献较小,因此主要考虑贡献较大的粗糙海表太阳反射辐射。海面受海风的影响变得粗糙不平,可视其为微面元结构。微面元反射辐射利用理想菲涅尔反射相关理论计算,而粗糙海表反射辐射则利用Cox-Munk海表偏振反射模型来获取(Cox和Munk, 1955, 1956)。
2.2.1 菲涅尔反射
考虑理想平静海面,太阳光入射海表将发生折射和反射,反射光的反射率和偏振度可由Fresnel公式计算。根据Fresnel定理,设
| $\left\{ \begin{aligned} & {{R}_\parallel } = \frac{{{m^2} \cdot \cos {\theta _i} - \sqrt {{m^2} - {{\sin }^2}{\theta _i}} }}{{{m^2} \cdot \cos {\theta _i} + \sqrt {{m^2} - {{\sin }^2}{\theta _i}} }}{{A}_\parallel } \\ & {{R}_ \bot } = \frac{{\cos {\theta _i} - \sqrt {{m^2} - {{\sin }^2}{\theta _i}} }}{{\cos {\theta _i} + \sqrt {{m^2} - {{\sin }^2}{\theta _i}} }}{{A}_ \bot } \end{aligned} \right.$ | (3) |
式中,
| $\left\{ \begin{gathered} {\rho _{fr}} = {{|r_\parallel ^2 + r_ \bot ^2|}/2} \\ \rho _{fr}^P = {{|r_\parallel ^2 - r_ \bot ^2|}/2} \\ \end{gathered} \right.$ | (4) |
考虑入射海表的太阳光线部分被海水吸收
| $\begin{aligned} & \rho _{fr}^P(n, {\theta _s}, {\theta _v}, {\varphi _s}, {\varphi _v}) = \\ & \frac{1}{2}\left[ { - \frac{{{{(\cos {\theta _i} - u)}^2} + {v^2}}}{{{{(\cos {\theta _i} + u)}^2} + {v^2}}} + } \right. \\ & \left. {\frac{{{{[(n_r^2 - n_i^2)\cos {\theta _i} - u]}^2} + {{(2{n_r}{n_i}\cos {\theta _i} - v)}^2}}}{{{{[(n_r^2 - n_i^2)\cos {\theta _i} + u]}^2} + {{(2{n_r}{n_i}\cos {\theta _i} + v)}^2}}}} \right] \end{aligned} $ | (5) |
式中,
2.2.2 粗糙海表反射
实际上,因受海风的影响海表变得粗糙不平,理想菲涅尔反射不再适用。Cox和Munk通过航空影像研究太阳光入射粗糙海表的反射辐射,结合海表风速建立了微面元斜率各向同性和异性的高斯分布粗糙海表模型。该模型将粗糙海表看作由不同倾斜斜率的微面元组成,太阳光在单个微面元呈镜面反射。考虑这样一个坐标系(P;X, Y, Z),P为观测点,Z为海拔,PY为太阳方向,PX为垂直太阳主平面方向。面元倾斜度由
| $\left\{ \begin{gathered} {Z_x} = \partial Z/\partial X = \sin (\alpha)\tan (\beta) \\ {Z_y} = \partial Z/\partial Y = \cos (\alpha)\tan (\beta) \\ \end{gathered} \right.$ | (6) |
| $\beta {\rm{ = }}\tan{^{ - 1}}{(Z_x^2 + Z_y^2)^{{1/2}}}$ | (7) |
式中,
| $\left\{ \begin{aligned} & {Z_x} = - \sin {\theta _v}\sin ({\varphi _s} - {\varphi _v})/(\cos {\theta _s} + \cos {\theta _v}) \\ & {Z_y} = (\sin {\theta _s} + \sin {\theta _v}\cos ({\varphi _s} - {\varphi _v}))/(\cos {\theta _s} + \cos {\theta _v}) \end{aligned} \right.$ | (8) |
| $\left\{ \begin{aligned} & {{Z'}_x} = \cos ({\varphi _s} - {\varphi _w}) \cdot {Z_x} + \sin ({\varphi _s} - {\varphi _w}) \cdot {Z_y} \\ & {{Z'}_y} = - \sin ({\varphi _s} - {\varphi _w}) \cdot {Z_x} + \cos ({\varphi _s} - {\varphi _w}) \cdot {Z_y} \end{aligned} \right.$ | (9) |
式中,
倾斜面元的概率分布用Gram-Charlier级数展开(Cox和Munk, 1954a, b,1955,1956)
| $\begin{aligned} P({{Z'}_x},{{Z'}_y}) = & {(2{\text{π}} {{\sigma '}_x}{{\sigma '}_y})^{ - 1}}\exp (\frac{{ - {\xi ^2} - {\eta ^2}}}{2})\{ 1 - \\ & \frac{1}{2}{c_{21}}({\xi ^2} - 1)\eta - {\textstyle{1 \over 6}}{c_{03}}({\eta ^3} - 3\eta ) + \\ & \frac{1}{{24}}{c_{40}}({\xi ^4} - 6{\xi ^2} + 3) + \\ & \frac{1}{{24}}{c_{04}}({\eta ^4} - 6{\eta ^2} + 3) + \\ & \frac{1}{4}{c_{22}}({\xi ^2} - 1)({\eta ^2} - 1)\} \end{aligned}$ | (10) |
式中,
可得粗糙海表的耀光反射率
| ${R_{\rm{glit}}} = \frac{{{\text{π}} {L_{\rm{glit}}}}}{{{E_0}\cos {\theta _s}}} = \frac{{{\text{π}}{\rho _{fr}}(n, {\theta _s}, {\theta _v}, {\varphi _s}, {\varphi _v})}}{{4\cos {\theta _s}\cos {\theta _v}{{\cos }^4}\beta }}P({Z'_x}, {Z'_y})$ | (11) |
式中,
由上可知,TOA海洋耀光辐射不仅需要考虑太阳辐射入射到海洋耀光区经海水吸收的粗糙海表反射,还要兼顾上行辐射透过大气层时的分子散射和气溶胶散射,即卫星载荷入瞳处的总辐射只考虑海面耀光辐射和大气程辐射。从式(1)和式(11)可推出海洋耀光区的TOA总偏振反射率
| $R_{\rm{tot}}^P = t(R_{\rm{glit}}^P{\rm{ + }}R_{\rm{ray}}^P + R_{\rm{aer}}^P)$ | (12) |
式中,
3 海洋耀光动态检测模型
海洋耀光区TOA总偏振辐射不仅受海表风速风向及大气的影响,而且海表微面元倾斜形成的耀光角与太阳及观测几何相关。因此,检测海洋耀光首先必须获取耀光角值,再结合海气辐射传输理论推导海洋耀光相关参量计算方法,对获取的各参量值进行动态分析。
3.1 海洋耀光相关参量计算
3.1.1 耀光角计算
太阳光入射粗糙海表微面元时发生折射和反射,定义入射光和反射光之间的夹角(考虑光线方向)为散射角
| ${\varTheta _{\rm{sca}}}{\rm{ = }}{\text{π}} {\rm{ - co}}{{\rm{s}}^{ - 1}}{\rm{(cos}}{\theta _s}{\rm{cos}}{\theta _v}{\rm{ + sin}}{\theta _s}{\rm{sin}}{\theta _v}{\rm{cos}}\phi)$ | (13) |
式中,相对方位角
| ${\varTheta _{\rm{glit}}}{\rm{ = co}}{{\rm{s}}^{ - 1}}{\rm{(cos}}{\theta _s}{\rm{cos}}{\theta _v}{\rm{ - sin}}{\theta _s}{\rm{sin}}{\theta _v}{\rm{cos}}\phi)$ | (14) |
利用耀光角计算公式可对卫星遥感数据进行耀光检测。MODIS海洋耀光的检测主要以40°耀光角经验值判别,满足
| $\left\{ \begin{gathered} {\theta _s} - 20^\circ < {\theta _{\rm{glit}}} < {\theta _s} + 20^\circ \\ - 40^\circ < {\phi _{\rm{glit}}} < 40^\circ \\ \end{gathered} \right.$ | (15) |
参考上述海洋耀光检测方法,本文OGDD模型的耀光角参量采用式(14)计算获取,耀光角临界值以[20°, 40°]为参考进行动态调整。
3.1.2 海洋耀光偏振辐射特性计算
(1) 耀光像元NIR波段大气层顶反射率和偏振反射率计算。考虑晴空条件下,TOA海洋耀光偏振辐射特性主要受海表耀光辐射、大气分子辐射、气溶胶辐射(不考虑白沫和离水辐射)影响。根据式(2)、式(11)和式(12)可得到海洋耀光NIR波段(865 nm) TOA反射率
| $\left\{\begin{aligned} & R_{{\rm{glit}}}^{TOA} = t\left\{ {\frac{{{\text{π}} {\rho _{fr}}(n,{\theta _s},{\theta _v},{\varphi _s},{\varphi _v})}}{{4\cos {\theta _s}\cos {\theta _v}{{\cos }^4}\beta }}P({{Z'}_x},{{Z'}_y}) + } \right. \\ & \qquad\quad \left. {\frac{{{\text{π}} {\tau _r}{P_r}(\varTheta )}}{{4E\cos {\theta _s}\cos {\theta _v}}} +\frac{{{\text{π}} {\tau _a}{P_a}(\varTheta )}}{{4E\cos {\theta _s}\cos {\theta _v}}}} \right\}\\ & PR_{{\rm{glit}}}^{TOA} = t\left\{ {\frac{{{\text{π}} \rho _{fr}^P(n,{\theta _s},{\theta _v},{\varphi _s},{\varphi _v})}}{{4\cos {\theta _s}\cos {\theta _v}{{\cos }^4}\beta }}P({{Z'}_x},{{Z'}_y}) + } \right. \\ & \qquad\qquad \left. {\frac{{{\text{π}} {\tau _r}{q_r}(\varTheta )}}{{4E\cos {\theta _s}\cos {\theta _v}}} +\frac{{{\text{π}} {\tau _a}{q_a}(\varTheta )}}{{4E\cos {\theta _s}\cos {\theta _v}}}} \right\} \end{aligned} \right. $ | (16) |
式中,
当满足海洋像元耀光角值
| $\begin{aligned} cetR_{\rm{glit}}^{TOA} = & t\left\{ {\frac{{{\text{π}}{\rho _{fr}}(n, {\theta _s}, {\theta _v}, {\varphi _s}, {\varphi _v})}}{{4{{\cos }^2}{\theta _s}{{\cos }^4}\beta }}P({{Z'}_x}, {{Z'}_y})} \right. + \\ & \left. {\frac{{{\text{π}} ({\tau _r}{P_r}(\varTheta) + {\tau _a}{P_a}(\varTheta))}}{{4E{{\cos }^2}{\theta _s}}}} \right\} \end{aligned} $ | (17) |
同样将
(2) 海洋耀光区NIR波段偏振辐射特性均值计算。假定待检测图像海洋耀光区域为
| $\overline R_{\rm{glit}}^{TOA} = (\sum\limits_{I = 0}^M {\sum\limits_{J = 0}^N {R_{\rm{glit}}^{TOA}(I, J, Z)} })/(I \times J)$ | (18) |
| $\overline {PR} _{\rm{glit}}^{TOA} = (\sum\limits_{I = 0}^M {\sum\limits_{J = 0}^N {PR_{\rm{glit}}^{TOA}(I, J, Z)} })/(I \times J)$ | (19) |
式中,
NIR波段(865 nm)耀光中心TOA反射率及偏振反射率的实测值与模拟值之间绝对偏差
| $\left\{ \begin{aligned} & \varDelta _{I, J, Z}^R = TR_{\rm{glit}}^{TOA}(I, J, Z) - cetR_{\rm{glit}}^{TOA}(I, J, Z) \\ & \varDelta _{I, J, Z}^{PR} = TPR_{\rm{glit}}^{TOA}(I, J, Z) - cetPR_{\rm{glit}}^{TOA}(I, J, Z) \end{aligned} \right.$ | (20) |
式中,
3.2 本文方法原理
通过上述海洋耀光相关参量的计算方法,不仅可以准确获取晴空条件下耀光像元的NIR波段(865 nm)TOA反射率和偏振反射率,还可以对耀光区进行NIR波段偏振辐射特性均值计算。由于上述参量与耀光角之间存在一定关联,可建立它们之间关系表达式。根据球面几何条件建立耀光角临界值
| $\left\{ \begin{aligned} & \varTheta _{\rm{glit}}^{lin} = \beta \cdot (\sum {\bar \varTheta _{\rm{glit}}^{{Z}}})/Z \pm \varDelta \\ & \overline \varTheta _{\rm{\rm{glit}}}^Z = (\sum {\sum {{\varTheta _{\rm{glit}}}(I, J, Z)} })/(I \times J) \end{aligned} \right.$ | (21) |
式中,
由前面已知耀光角临界值满足
| $R_{\rm{glit}}^{TOA}(I, J, Z;{\varTheta _{\rm{glit}}};k) = \alpha \cdot \overline R_{\rm{glit}}^{TOA}(I, J, Z;{\overline \varTheta _{\rm{glit}}};k) \pm \varDelta '$ | (22) |
式中,
在耀光区域范围内,以角度均值
| $K = \frac{{\overline R_{\rm{glit}}^{TOA}(I, J, Z;{{\overline \varTheta }_{\rm{glit}}}(c + k)) - \overline R_{\rm{glit}}^{TOA}(I, J, Z;{{\overline \varTheta }_{\rm{glit}}}(c))}}{k}$ | (23) |
研究发现耀光区域内辐射特性呈规则变化:从耀光中心(晴空区)开始随着
3.3 OGDD算法流程
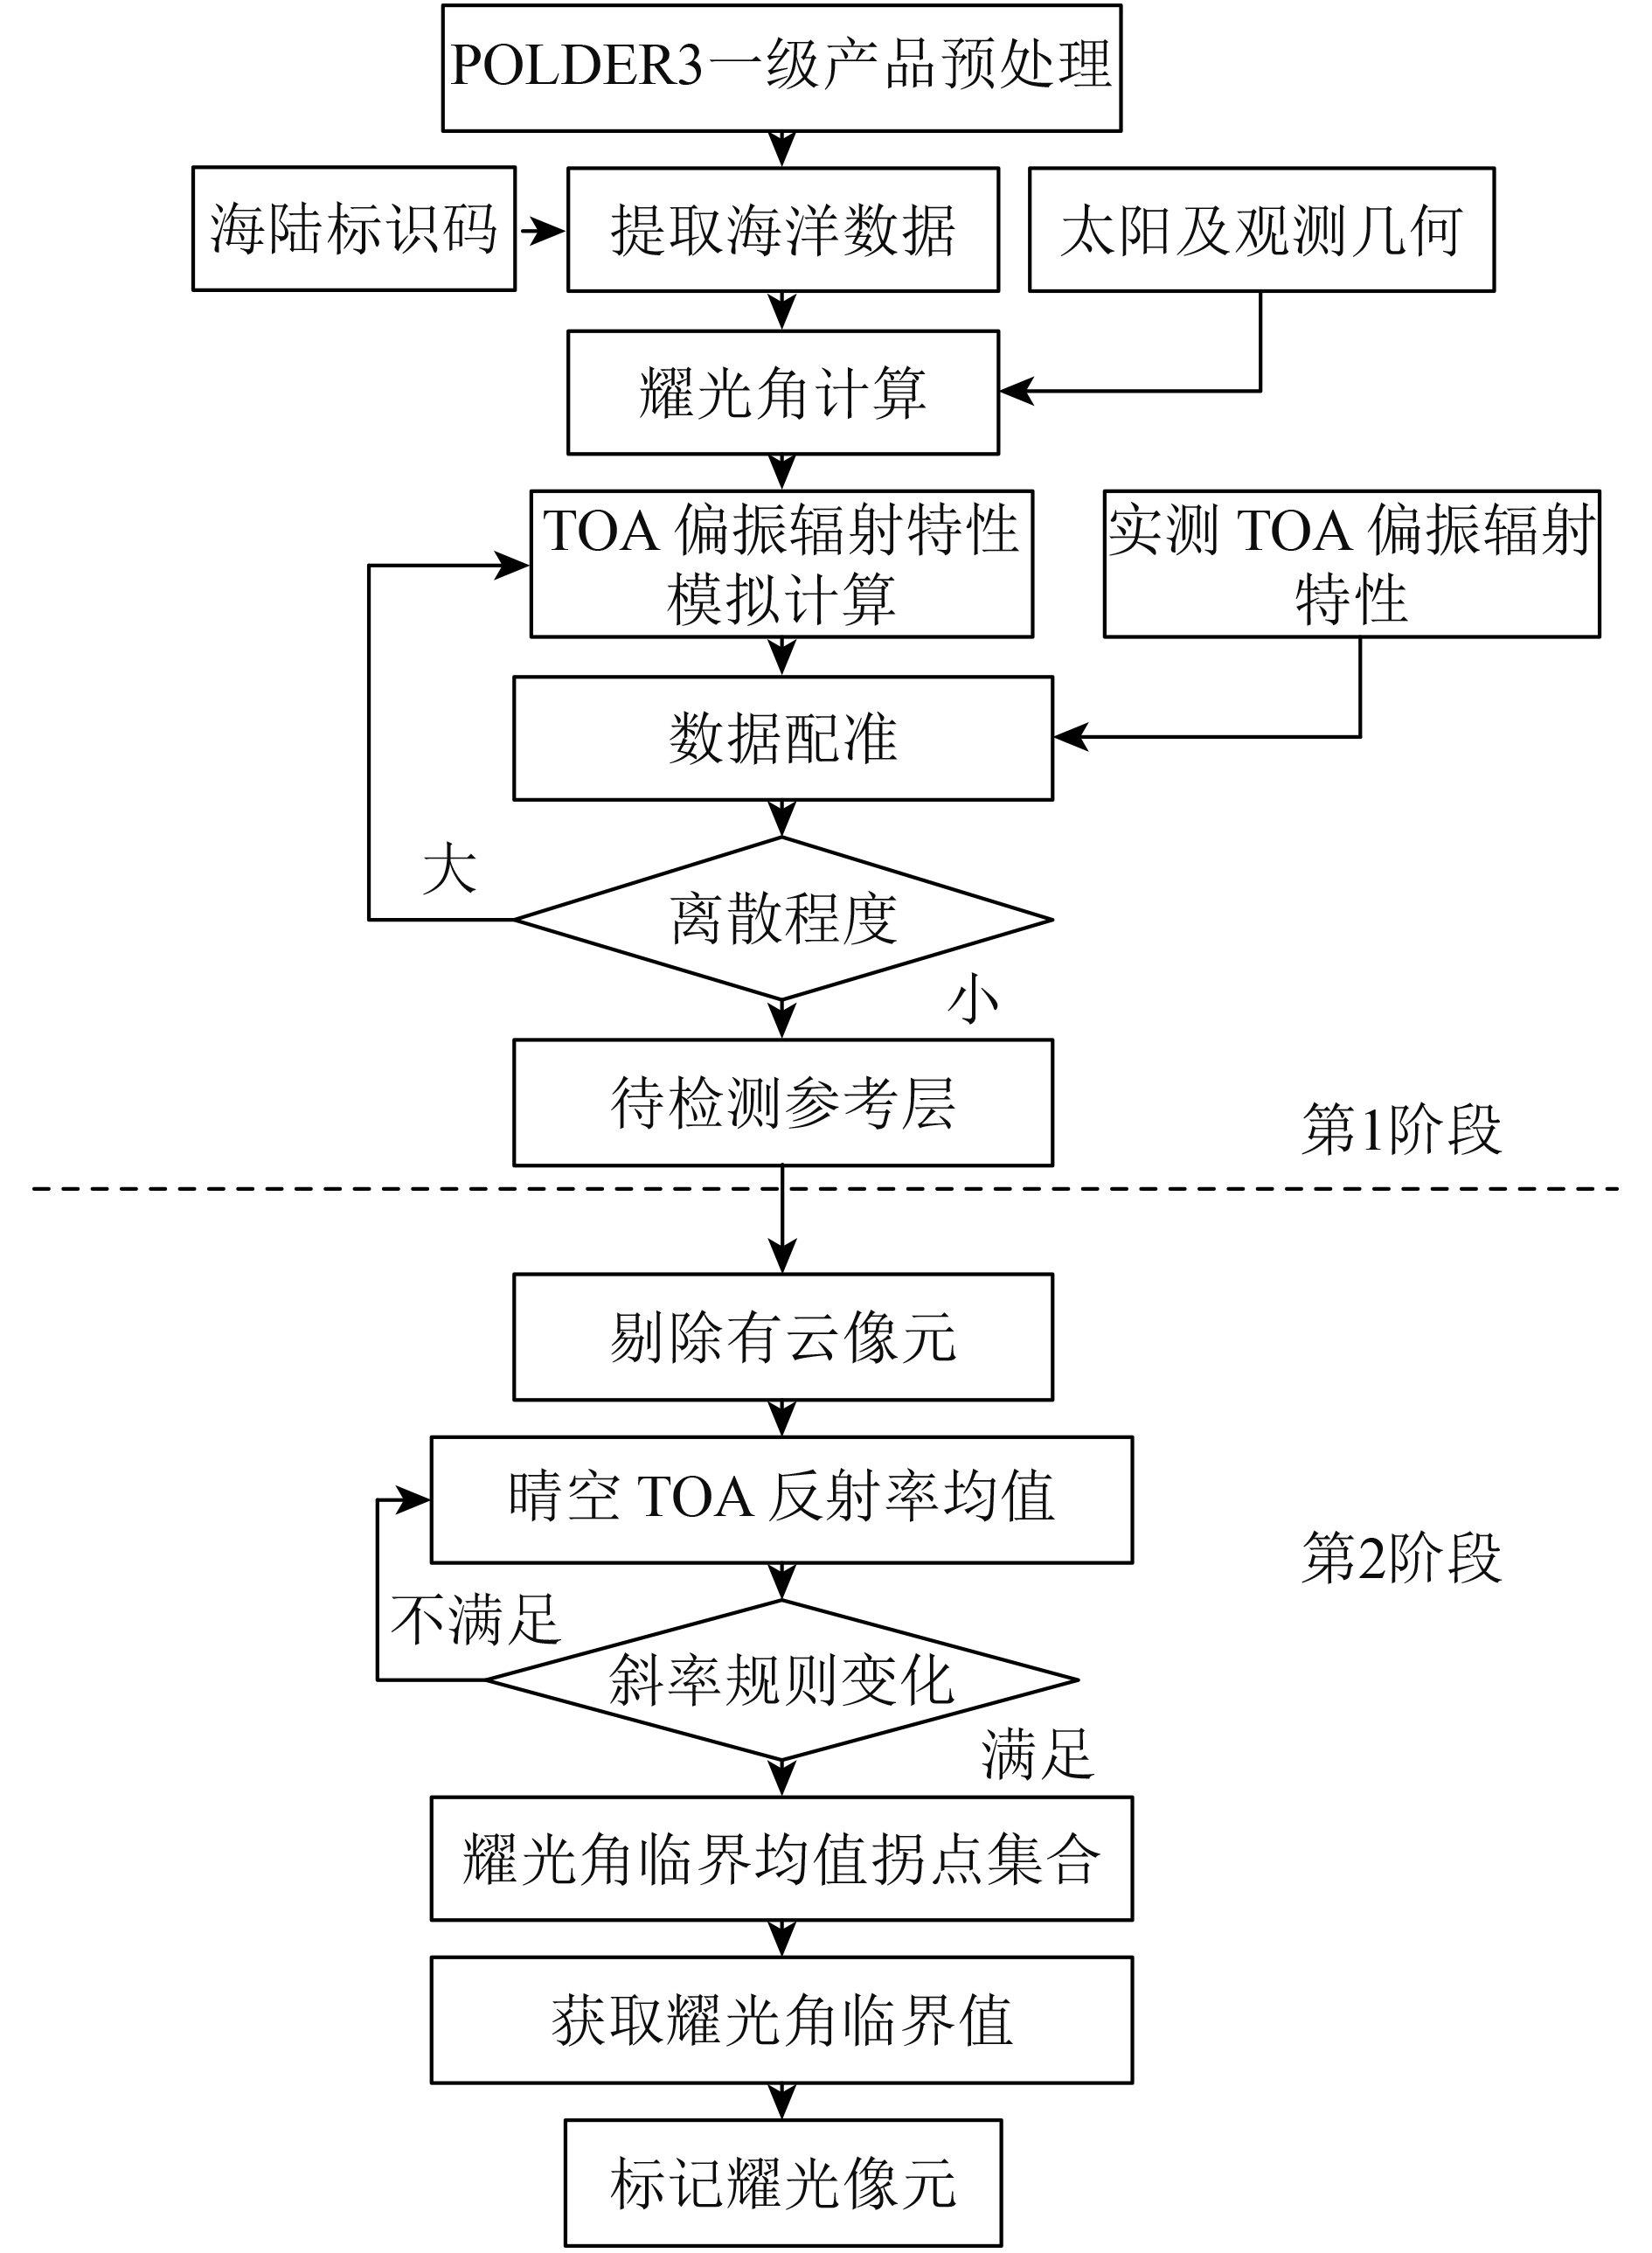
卫星在轨运行时,其目标辐射特性会随着时间和空间变化而发生一定改变,不同载荷间的差异特别明显,既有仪器的原因也可能是由算法的差异而引起。为统一实现单一或多个载荷不同轨道高度、不同经纬度及不同仪器的海洋耀光动态检测,本文结合偏振辐射特性规则表现,设计OGDD算法流程(如图3)。该流程分两个阶段,第1阶段获取待检测参考层,第2阶段动态获取耀光角临界值检测耀光。具体步骤如下:
步骤1 POLDER3一级产品预处理。首先读取POLDER3一级产品数据,再逐像元提取经纬度信息,并对照同经纬度的海陆标识码,从而获取海洋像元,最后形成研究区域的海洋一级衍生数据;
步骤2 读取研究海洋区域的一级产品衍生数据,获取每个像元的太阳及观测几何
步骤3 利用耀光角计算式(14)获得每个像元的耀光角
步骤4 利用辐射传输软件和辐射特性计算公式,结合外部数据(风速、风向、气溶胶光学厚度等),模拟得到晴空条件下TOA海洋耀光区NIR波段的
步骤5 用最邻近法进行数据配准,获取同样几何条件下,待检测海区耀光中心像元实测
(1)
(2)
步骤6 利用Buriez云检测算法(Buriez 等,1997)剔除待检测层海区的有云像元;
步骤7 选定待检测参考层,计算角度区间
步骤8 TOA反射率均值的斜率K变化检测。计算角度区间
步骤9 经过系列优化筛选后,得到Z层的耀光角临界均值拐点集合
步骤10 对所有像元进行耀光角规则判别,满足
4 实验数据及结果分析
4.1 数据源选择及耀光角计算
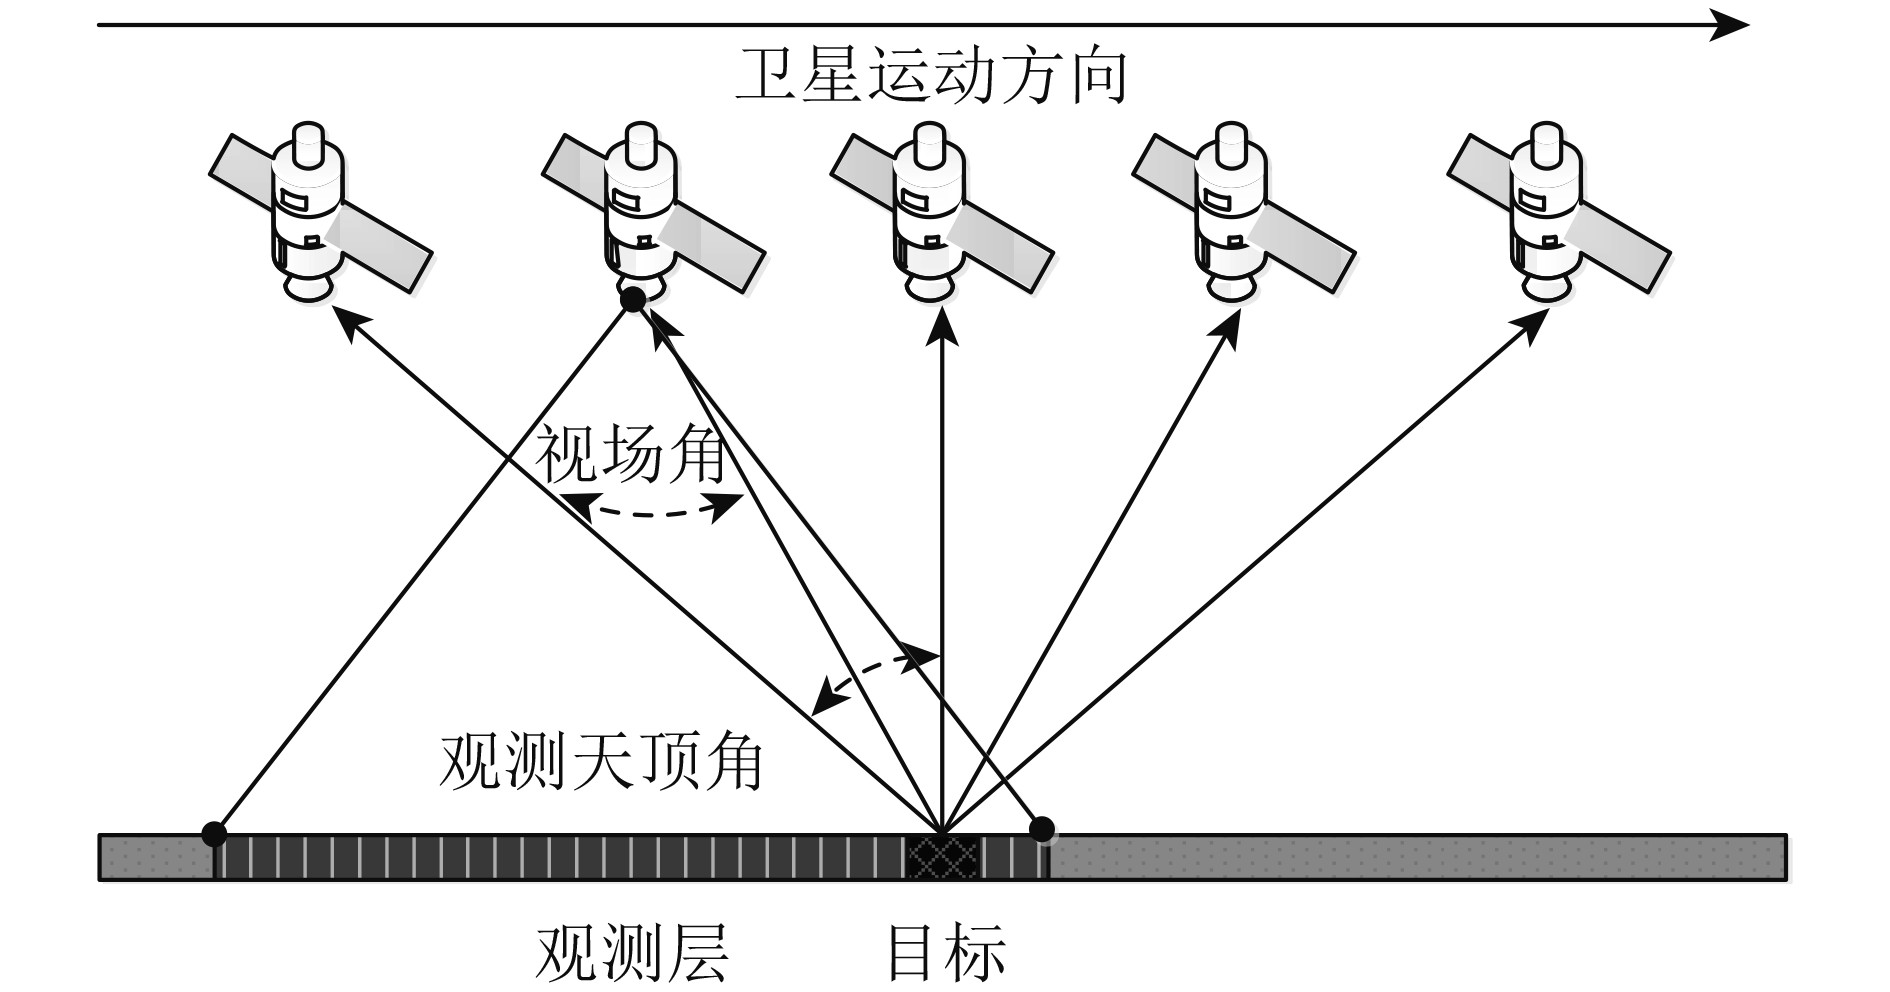
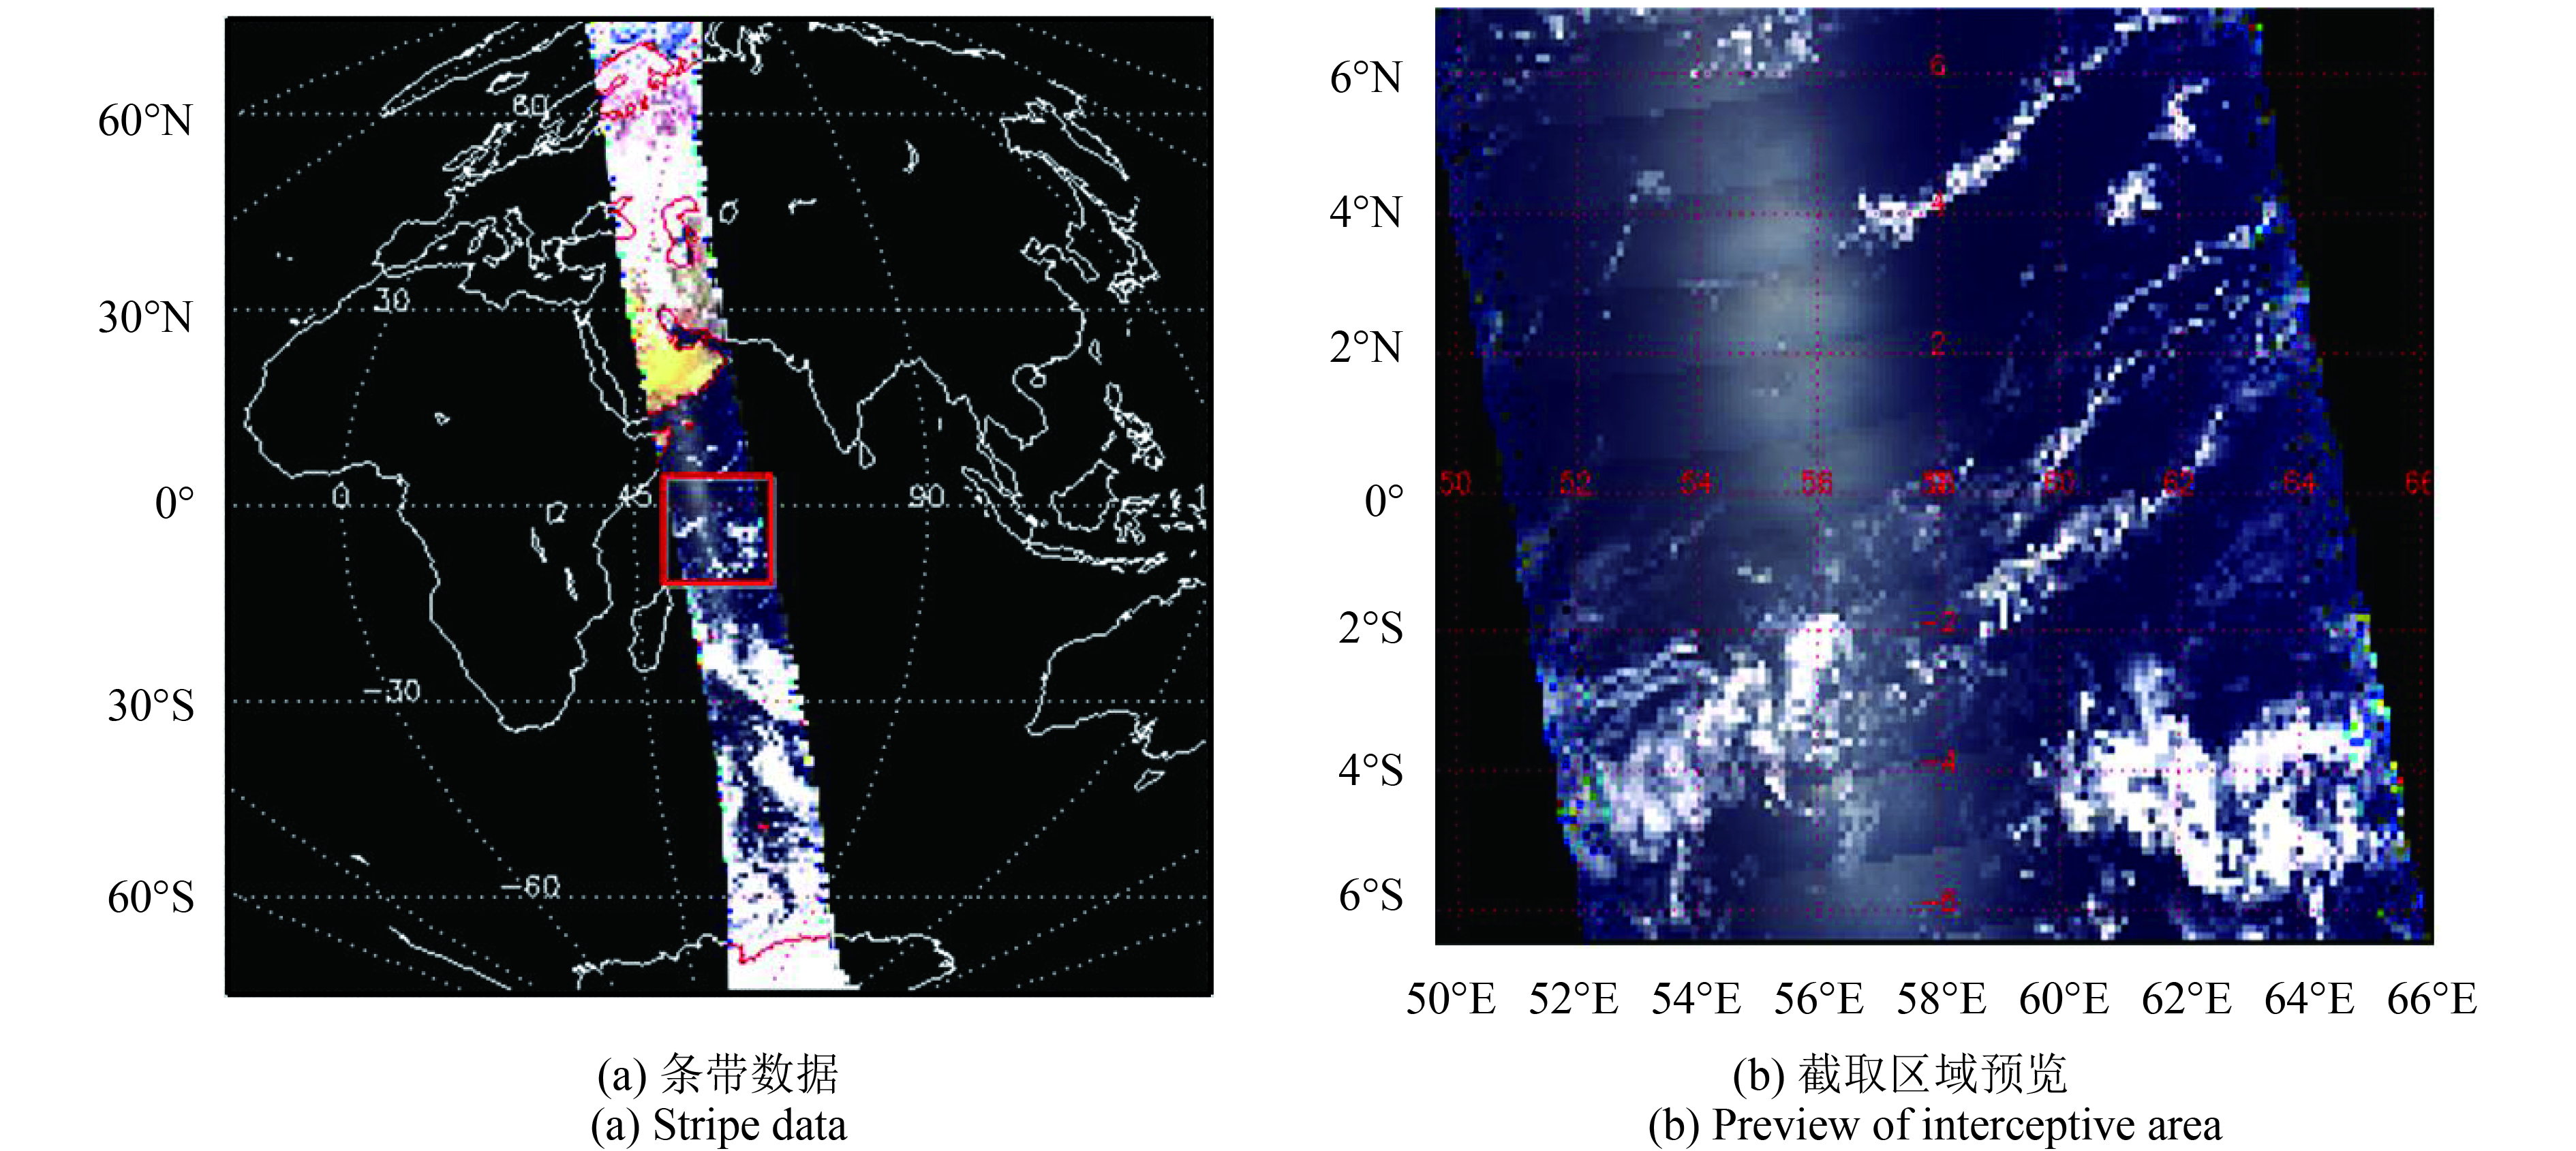
法国于2004年12月成功发射PARASOL/POLDER3卫星载荷后,其观测波段由3个偏振和6个非偏振波段组成(表1), 沿太阳同步轨道由南向北进行成像观测(图4),对同一目标进行连续多次重复观测(多角度观测)。由法国国家空间研究中心(CNES)面向全球用户提供3级业务化产品,现其数据产品可以从法国里尔第一大学的ICARE数据服务中心(www.icare.univ-lille1.fr[2017-03-16])下载。本文针对高分五号卫星DPC载荷数据预处理中如何动态检测海洋耀光进行研究,数据源选择POLDER3一级产品作为实验对象,空间分辨率为6×6 km, 投影方式为Sinusoidal投影(Riédi 等,2010)。筛选日期为2005-03-04的单条带历史数据,文件名为P3L1TBG1006137SD和P3L1TBG1006137SL,该实验数据位于印度洋区域,耀光特征明显且天气相对晴朗少云,能有效减少云层对耀光的干扰。该条带实验数据总共进行了129次多角度成像观测,依据波段生成存储数据组,每个波段组由3维结构组成(行×列×观测层)。用Anapol软件(POLDER和PARASOL数据可视化及分析的IDL图形界面工具,可从ICARE网站下载)打开该条带数据并预览(如图5(a)所示),发现该条带数据海洋区域靠近赤道以南部分有大量的云层覆盖,而赤道以北靠近非洲东海岸附近的印度洋海区相对晴朗少云,因此截取该海区一个相对晴朗的实验区域作为研究对象。该区域共有29个观测层(55—83层),坐标经度为49.6°E—66.0°E,纬度为6.6°S—7.0°N,如图5(b)所示。
表 1 POLDER3波段特征
Table 1 Characteristics of the POLDER3 bands
| 波段 | 中心波长/nm | 波段宽度/nm | 是否偏振 |
| 443 | 443.9 | 13.5 | NO |
| 490 | 491.5 | 16.5 | Yes |
| 565 | 563.9 | 15.5 | NO |
| 670 | 669.9 | 15.0 | Yes |
| 763 | 762.8 | 11.0 | NO |
| 765 | 762.5 | 38.0 | NO |
| 865 | 863.4 | 33.5 | Yes |
| 910 | 906.9 | 21.0 | NO |
| 1020 | 1019.4 | 17.0 | NO |
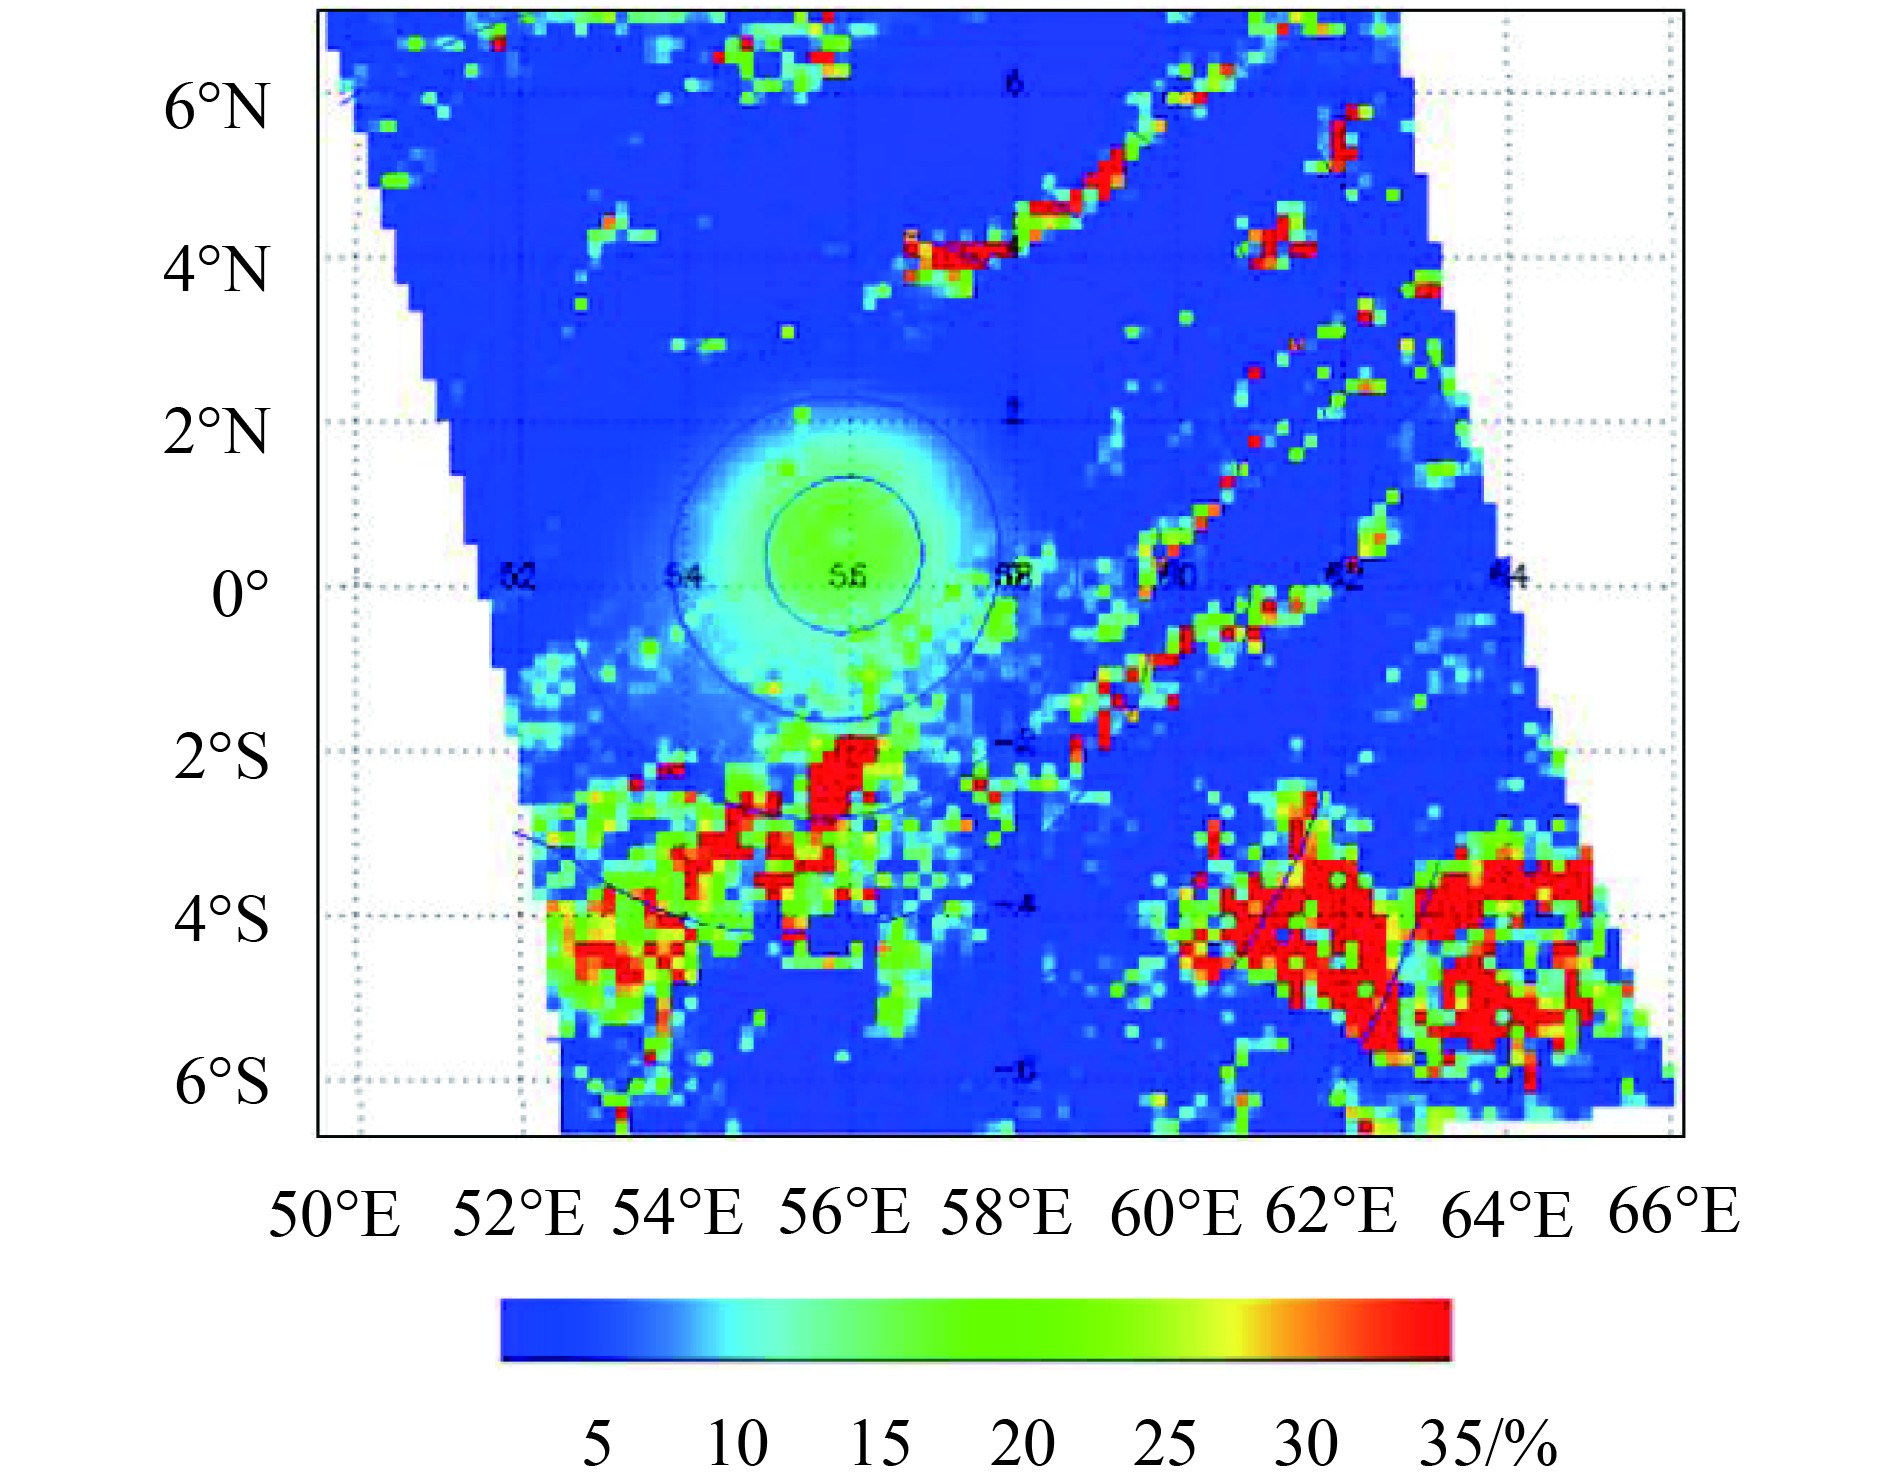
从图5(b)截取的实验海区可知海洋耀光随着卫星轨道方向移动,不同观测角度下耀光位置不同,利用OGDD模型中的计算公式对所有观测层进行有云耀光角计算和实测偏振辐射信息提取,可得到如图4所示研究区域NIR波段(865 nm)的反射率值(以69层为例)。
图6中,蓝色线表示等角线(耀光角),最内环线表示耀光角值为10°,线与线间隔10°,反射率值以百分数形式表示。从图中可以看到耀光角值在20°范围内确定全部为耀光,在20°—30°耀光对比并不是很明显,且耀光与薄云间的辐射信息会有重叠。分析实验海区NIR波段的伪彩色图,发现耀光区耀光角值由内向外逐渐增加,可看成由等间距值的环线(等角线)构成,且等角线递增的角度值与反射率递减趋势一致,通过耀光区像元的偏振辐射特性与耀光角间的规则变化这一规律可以构建它们之间的线性关系表达(式(21))。剔除实验海区受云层干扰较大的区域,减少有云海区的范围,将优化后的数据利用OGDD模型进一步处理。
4.2 耀光偏振辐射特性计算及分析
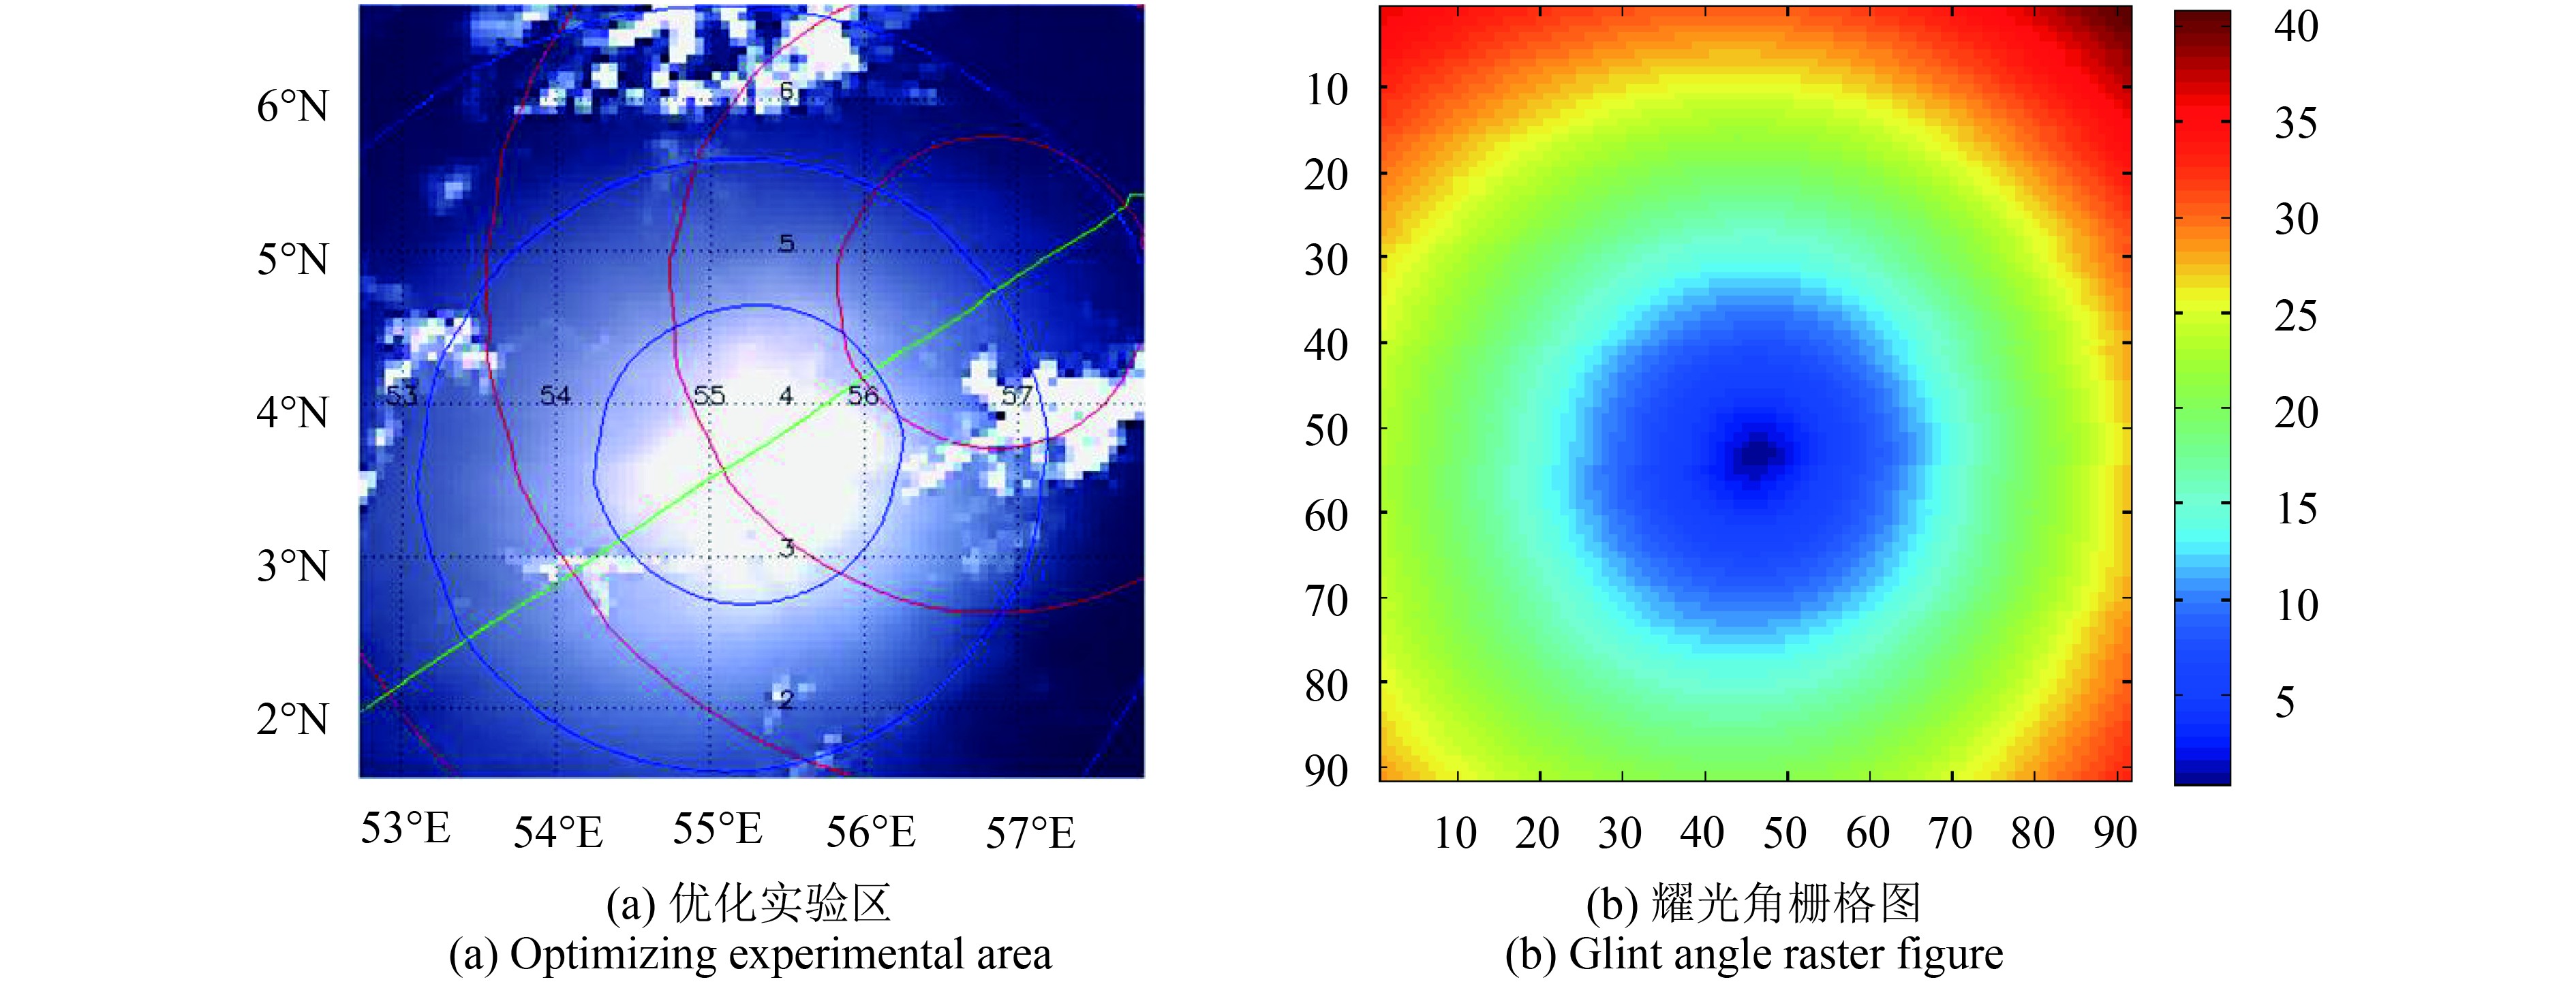
从图6实验海区中优化选取赤道以北云污染较小的相对晴空区(经度为52.7°E—57.8°E, 纬度为1.2°N—6.2°N),得到如图7所示(第73观测层)少量云污染的实验区域。对该区域所有观测层数据,用耀光角及散射角计算公式,获取每层数据所有像元的耀光角值和散射角值,并以数据表形式存储。图7(a)中的蓝色线为耀光角等角线,红色线为散射角等值线。将实验区域第73层所有像元的耀光角值生成如图7(b)所示的角度值栅格图,纵轴和横轴对应像元所处行列号。图7(b)中蓝色为角度值较小的耀光区,蓝色和黄色分界线在20°左右,大于40°耀光角的像元比较少。若采用MODIS经验临界值来判(40°)别耀光像元,则该实验区几乎全部被标记为耀光像元,显然降低了有效像元的比率。
由前可知,在获取耀光角值后,计算耀光区偏振辐射特性模拟值,并与实测值进行数据配准,比较分析其离散程度确定待检测参考层。逐像元获取对应经纬度坐标的海表风速风向
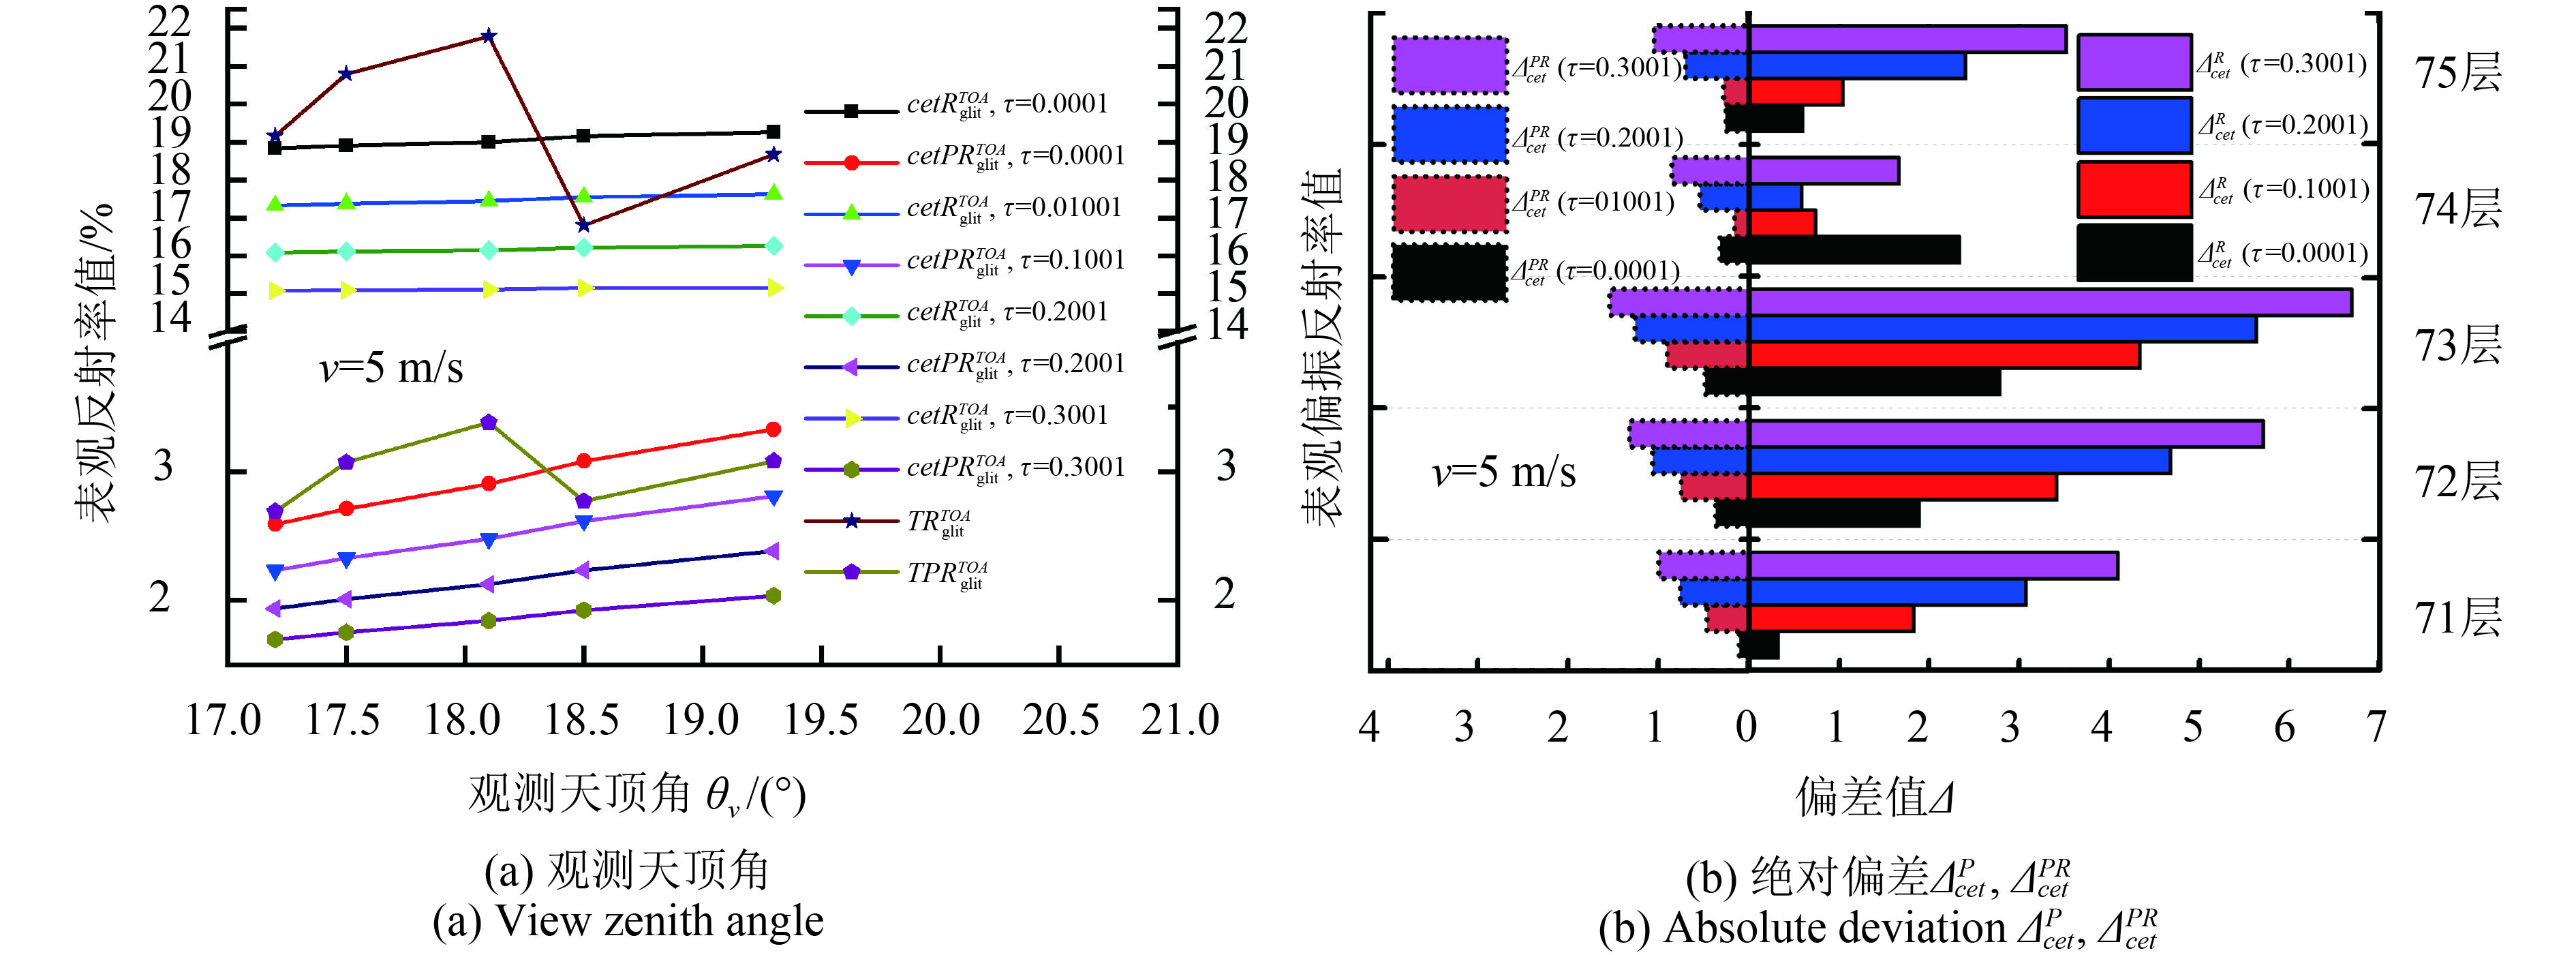
根据TOA耀光中心偏振辐射特性计算方法,获得如图8(a)所示实验区域第71—75层耀光中心点(观测天顶角依次为:17.2°,17.5°,18.1°,18.5°,19.3°;太阳天顶角依次为:17.1°,17.5°,18.0°,18.5°,19.0°)在风速为5 m/s,气溶胶光学厚度
图8(a)中五角星线和五边形线分别表示POLDER3实测的
4.3 OGDD算法结果分析
考虑耀光区通常有大量的云层覆盖,云层对TOA反射率和偏振反射率值有较大影响。由前面分析耀光中心偏振辐射特性方法获取耀光区的参考层,再利用OGDD算法来判别耀光角临界值。由于云层和大气干扰了辐射信息,选择受大气干扰较少的NIR波段(865 nm)来提取辐射特性均值。先对分析区域进行去云处理(Buriez 等,1997)。为了使统计更具有普遍性,利用以上原则选取如图3(b)所示的位于印度洋西部靠近沙特的实验海区对耀光区进行OGDD算法结果分析。该选取的实验海区数据共有29个观测层,编号从55层始至83层。利用耀光区偏振辐射特性计算方法对每层的数据进行计算和结果分析,可以获得不同间隔的数据统计情况。由前述可知将第71、75层选作参考层,本实验选定第71层数据作为参考层进行计算(取
表 2 第71层耀光角区域参量变化统计
Table 2 Statistics of parameter’s variety at glint angle area for 71 level
| [
|
|
Tpix(N) | pix_c(N1) | pix(N2) | pix(N2)/Tpix(N) | pix_c(N1)/pix_40(N3) |
|
| [20, 21] | 1 | 493 | 52 | 24 | 0.002927 | 0.025145 | 6.776249 |
| [21, 22] | 2 | 546 | 53 | 0 | 0 | 0.025629 | 0 |
| [22, 23] | 3 | 595 | 49 | 6 | 0.000732 | 0.023694 | 4.911666 |
| [23, 24] | 4 | 655 | 60 | 13 | 0.001585 | 0.029014 | 4.550000 |
| [24, 25] | 5 | 713 | 58 | 13 | 0.001585 | 0.028046 | 4.373846 |
| [25, 26] | 6 | 781 | 68 | 17 | 0.002073 | 0.032882 | 3.867059 |
| [26, 27] | 7 | 844 | 63 | 18 | 0.002195 | 0.030464 | 3.775556 |
| [27, 28] | 8 | 920 | 76 | 26 | 0.003171 | 0.036750 | 3.767692 |
| [28, 29] | 9 | 995 | 75 | 29 | 0.003537 | 0.036267 | 3.684482 |
| [29, 30] | 10 | 1072 | 77 | 33 | 0.004024 | 0.037234 | 3.467879 |
| [30, 31] | 11 | 1160 | 88 | 35 | 0.004268 | 0.042553 | 3.252000 |
| [31, 32] | 12 | 1244 | 84 | 28 | 0.003415 | 0.040619 | 3.235714 |
| [32, 33] | 13 | 1341 | 97 | 31 | 0.003780 | 0.046905 | 3.156129 |
| [33, 34] | 14 | 1436 | 95 | 28 | 0.003415 | 0.045938 | 2.971071 |
| [34, 35] | 15 | 1532 | 96 | 40 | 0.004878 | 0.046422 | 2.804750 |
| [35, 36] | 16 | 1638 | 106 | 53 | 0.006463 | 0.051257 | 2.715660 |
| [36, 37] | 17 | 1753 | 115 | 53 | 0.006463 | 0.055609 | 2.662076 |
| [37, 38] | 18 | 1854 | 101 | 34 | 0.004146 | 0.048839 | 2.625589 |
| [38, 39] | 19 | 1960 | 106 | 40 | 0.004878 | 0.051257 | 2.406500 |
| [39, 40] | 20 | 2068 | 108 | 44 | 0.005366 | 0.052224 | 2.372727 |
对实验海区29层数据进行初步筛选,统计第62—78层所有参量数据,获取每个层在不同耀光角临界值约束条件下的无云像元的TOA反射率均值(图9(a))。在耀光角20°—21°范围内第62—78层(73层除外)由于受云的干扰较大,该临界值区域内的无云像元TOA反射率均值为0。第62、63、77、78层由于处于卫星观测视场进入和离开的观测层,耀光角选择区域未进入观测视场导致无云像元TOA反射率均值为0的情况比较多。由于受观测视场范围和云干扰的影响,使得耀光角临界值的获取较为困难。
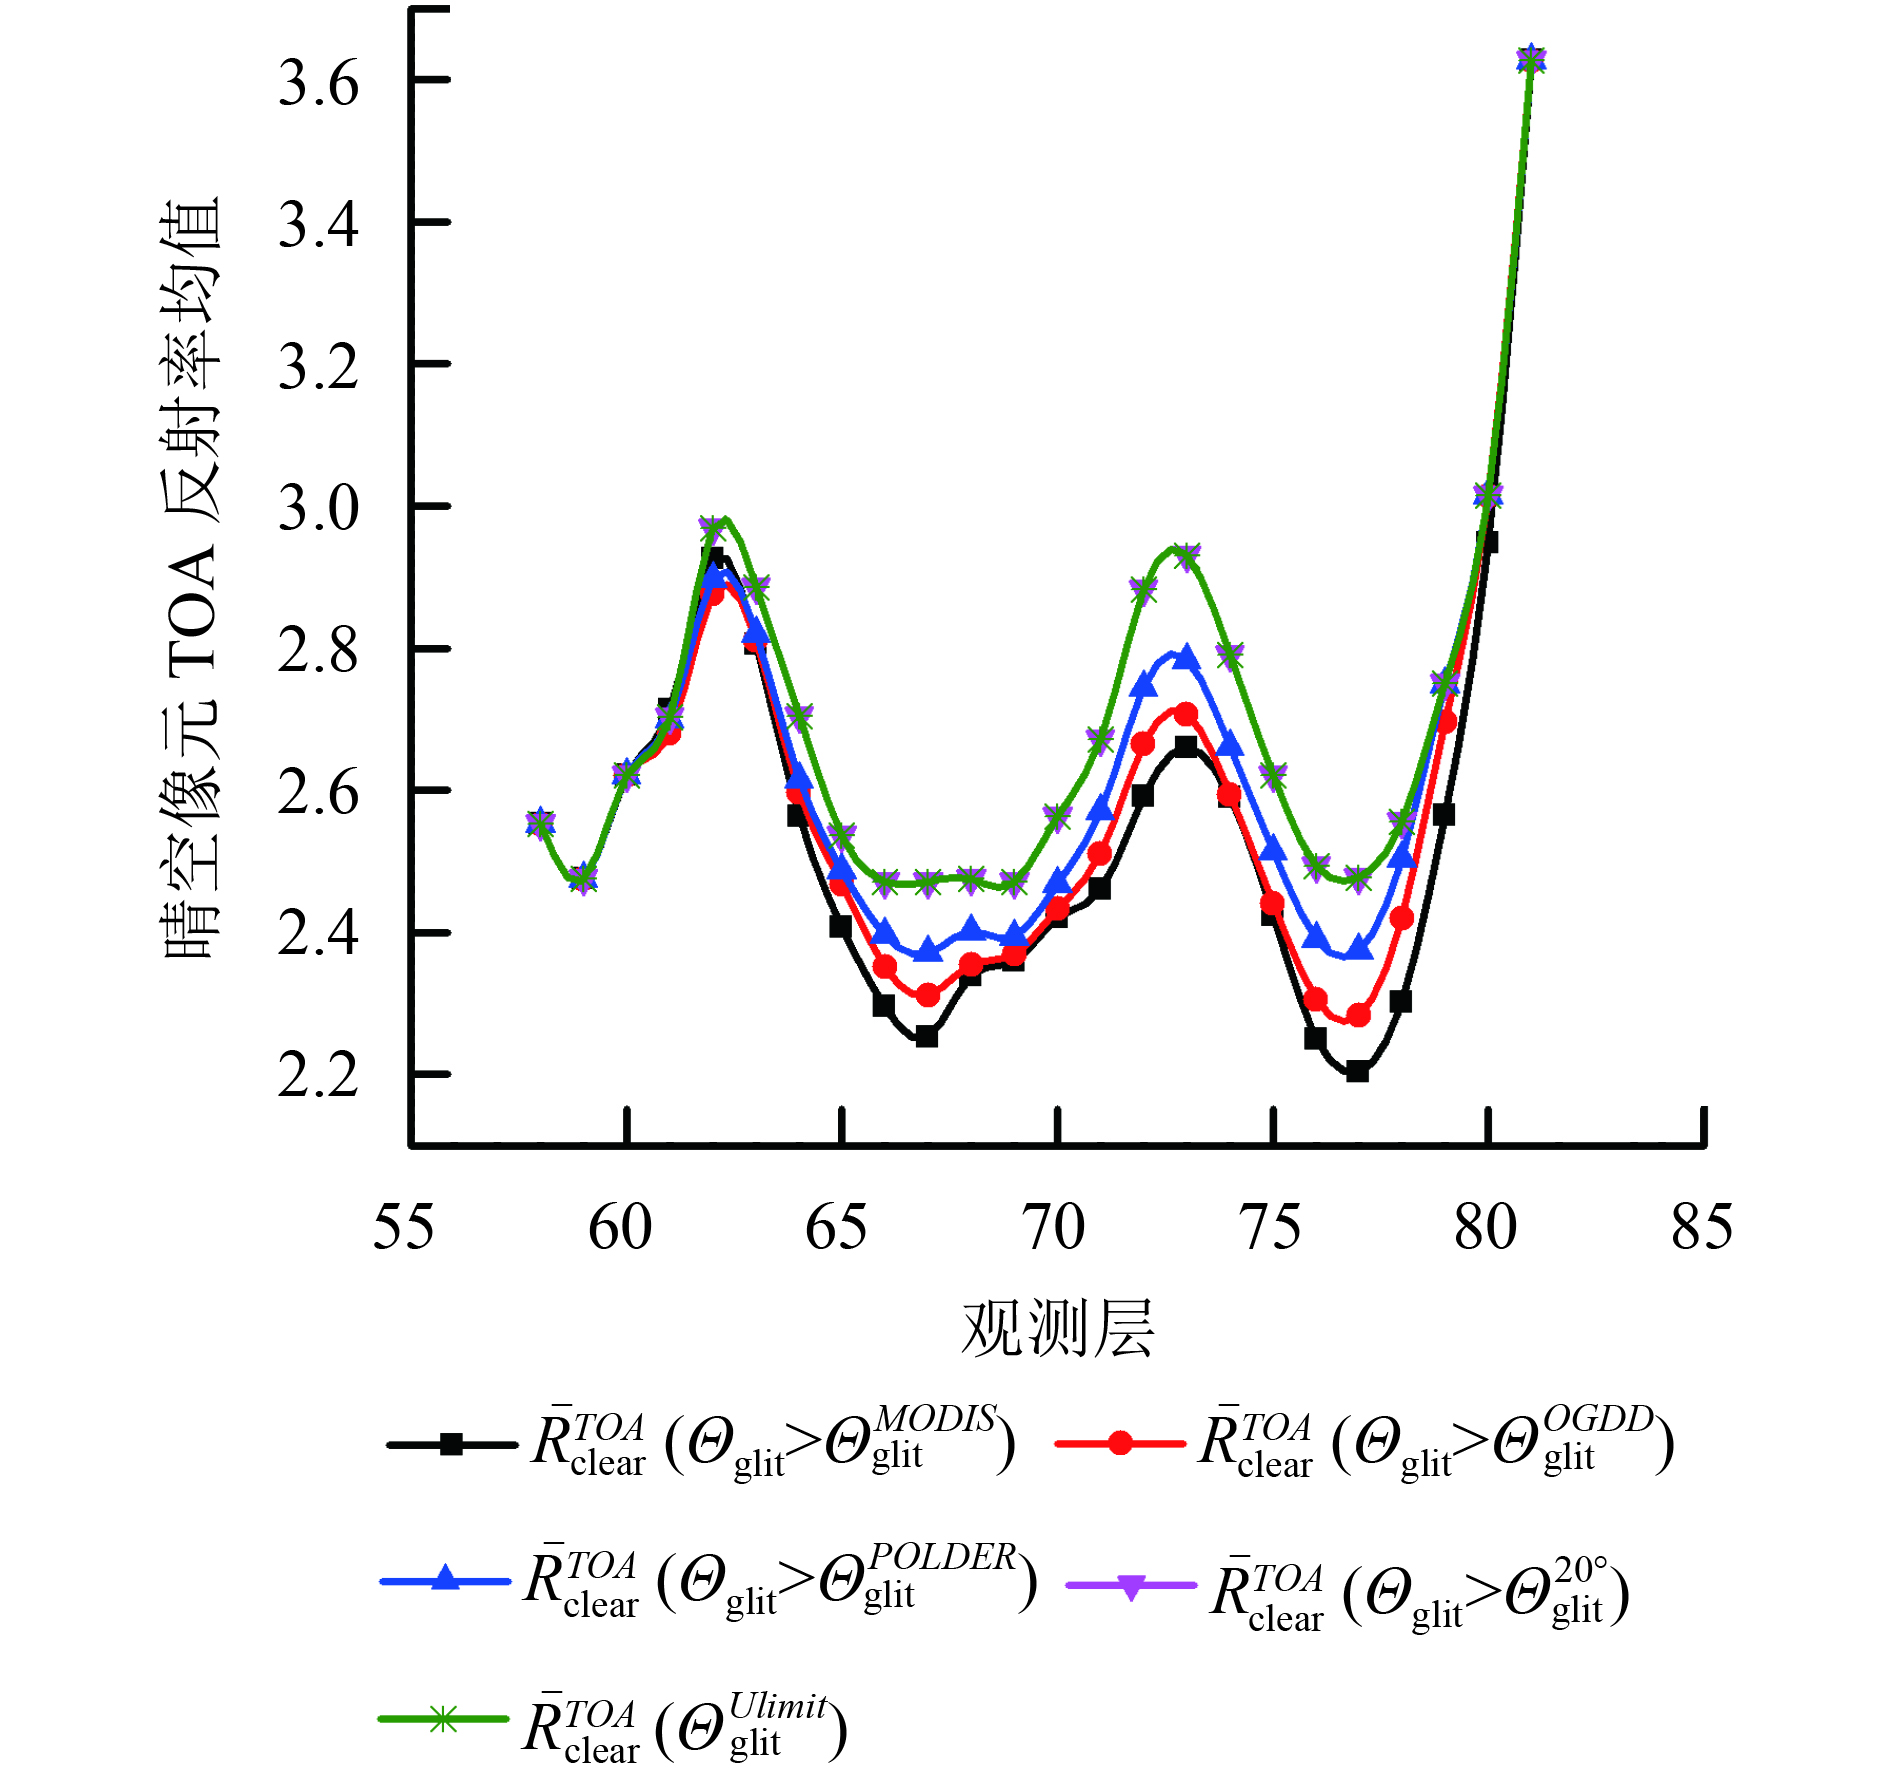
据上可知,考虑载荷在对地观测时,其成像质量受视场范围限定和云干扰,需对观测层及TOA反射率数据进一步优化,依据TOA反射率值有效(非0)原则删除第62、71、72、74—78层TOA反射率均值,获取图9(b)所示筛选优化后的第63—73层(不含71, 72层)30°—40°范围的TOA反射率均值。从第71、75参考层中计算无云像元(限定耀光角大于20°) TOA反射率均值,取其最大值2.9%,将其作为所有观测层反射率均值的参考值(图9(b)水平方向红色虚线)。对每层小于参考值的TOA反射率均值保留,再对每层保留的反射率均值进行变化趋势分析。计算耀光角均值
为客观评价OGDD方法效果,选取图5(b)中的实验海区,分别用OGDD方法与POLDER3方法及MODIS方法对实验海区进行58—81层耀光检测。以耀光角临界值
(1) 不限定耀光角及耀光角满足
(2) 利用POLDER3经验值满足
(3) 利用MODIS经验值满足
(4) 通过本文OGDD算法获取
因此使用OGDD方法可以动态获取印度洋海区的最优化耀光角临界值,通过该值能比较准确的检测出海洋耀光,从而大大的提高了有效像元的比率,为后续云和气溶胶特性反演提供更加准确的数据产品。
5 结 论
海洋耀光对海洋上空云和气溶胶研究干扰较大,准确识别耀光对卫星数据的高效处理及高质量生产至关重要。现有耀光检测方法大都利用经验值进行判别且不考虑波段选择。利用这些经验值检测不同载荷的耀光,往往会降低有效像元的利用率,导致云和气溶胶反演误差增大,故不适于DPC的海洋耀光检测。因此,动态获取耀光角判别临界值是实现海洋耀光的动态检测的关键。
本文针对海洋耀光动态检测这一难题,提出了NIR偏振辐射数据的OGDD模型。现有的耀光检测基本不考虑波段的选择,而作者通过水面耀光实验发现耀光和非耀光区NIR反射率差异显著,表明利用NIR波段检测耀光更准确。该模型的第1阶段结合菲涅尔反射和粗糙海表偏振辐射理论,构建了耀光区TOA偏振辐射特性的计算公式。利用其获取相应参量的数值,对比耀光中心参量实测值与模拟值的离散程度,进而确定待检测参考层。在第2阶段剔除有云像元后,建立TOA反射率均值斜率规律变化准则,并利用其进行斜率动态分析,生成每层耀光角临界值集合并求均值,得到待检测耀光区的耀光角临界值,通过动态获取该临界值最终实现海洋耀光的动态检测。
利用OGDD模型可动态获取实验海区的最优化耀光角临界值,并对比分析5种不同耀光角临界值条件下获取的晴空TOA反射率均值。研究发现该模型能有效的区分耀光像元和非耀光像元,大大提高像元的利用率,降低耀光对晴空区气溶胶反演的干扰。此外,该模型还克服了现有耀光检测方式单一、适用性差的问题,可用于不同载荷耀光临界值的动态调整,实现跨平台检测,为高分5号卫星DPC载荷的海洋耀光处理提供理论和技术支持。
志 谢 本文的研究数据和工具由法国ICARE数据服务中心提供,在此表示衷心的感谢!
参考文献(References)
-
Born M and Wolf E. 1975. Principles of Optics. 7th ed. New York: Pergamon Press: 50–65
-
Bréon F M. 1993. An analytical model for the cloud-free atmosphere/ocean system reflectance. Remote Sensing of Environment, 43 (2): 179–192. [DOI: 10.1016/0034-4257(93)90007-K]
-
Bréon F M and Henriot N. 2006. Spaceborne observations of ocean glint reflectance and modeling of wave slope distributions. Journal of Geophysical Research: Oceans, 111 (C6): C06005 [DOI: 10.1029/2005JC003343]
-
Bréon F M, Tanré D, Lecomte P and Herman M. 1995. Polarized reflectance of bare soils and vegetation: measurements and models. IEEE Transactions on Geoscience and Remote Sensing, 33 (2): 487–499. [DOI: 10.1109/36.377949]
-
Buriez J C, Vanbauce C, Parol F, Goloub P, Herman M, Bonnel B, Fouquart Y, Couvert P and Seze G. 1997. Cloud detection and derivation of cloud properties from POLDER. International Journal of Remote Sensing, 18 (13): 2785–2813. [DOI: 10.1080/014311697217332]
-
Chen X F, Gu X F, Cheng T H, Li Z Q, Yu T and Xie D H. 2011. Simulation and analysis of polarization characteristics for real sea surface sunglint. Spectroscopy and Spectral Analysis, 31 (6): 1648–1653. [DOI: 10.3964/j.issn.1000-0593(2011)06-1648-06] ( 陈兴峰, 顾行发, 程天海, 李正强, 余涛, 谢东海. 2011. 真实海洋表面的太阳耀光偏振辐射特性仿真与分析. 光谱学与光谱分析, 31 (6): 1648–1653. [DOI: 10.3964/j.issn.1000-0593(2011)06-1648-06] )
-
Cox C and Munk W. 1954a. Measurements of the roughness of the sea surface from photographs of the sun’s glitter. Journal of the Optical Society of America, 44 (11): 838–850. [DOI: 10.1364/JOSA.44.000838]
-
Cox C and Munk W. 1956. Slopes of the sea surface deduced from photographs of sun glitter. Bulletin of the Scripps Institution of Oceanography, 6 (9): 401–488.
-
Cox C and Munk W. 1955. Some problems in optical oceanography. Journal of Marine Research, 14 : 63–78.
-
Cox C and Munk W H. 1954b. Statistics of the sea surface derived from sun glitter. Journal of Marine Research, 13 : 198–227.
-
Deschamps P Y, Bréon F M, Leroy M, Podaire A, Bricaud A, Buriez J C and Seze G. 1994. The POLDER mission: instrument characteristics and scientific objectives. IEEE Transactions on Geoscience and Remote Sensing, 32 (3): 598–615. [DOI: 10.1109/36.297978]
-
Deuzé J L, Bréon F M and Devaux C, Goloub P, Herman M, Lafrance B, Maignan F, Marchand A, Nadal F, Perry G and Tanré D. 2001. Remote sensing of aerosols over land surfaces from POLDER-ADEOS-1 polarized measurements. Journal of Geophysical Research, 106 (D5): 4913–4926. [DOI: 10.1029/2000JD900364]
-
Goloub P, Chepfer H, Herman M, Brogniez G and Parol F. 1997. Use of polarization for cloud study//Proceedings of Polarization: Measurement, Analysis, and Remote Sensing. San Diego, CA, United States: SPIE, 3121: 330–341 [DOI: 10.1117/12.283865]
-
Goloub P, Herman M and Parol F. 1995. Polarization of clouds//Proceedings of Atmospheric Sensing and Modeling II. Paris, France: SPIE, 2582: 21–31 [DOI: 10.1117/12.228551]
-
Gordon H R and Wang M. 1994. Influence of oceanic whitecaps on atmospheric correction of ocean-color sensors. Applied Optics, 33 (33): 7754–7763. [DOI: 10.1364/AO.33.007754]
-
Gu X F, Cheng T H, Li Z Q, Qiao Y L. 2015. Atmospheric aerosol polarized remote sensing. Beijing: Higher Education Press: 1–22 (顾行发, 程天海, 李正强, 乔延利. 2015. 大气气溶胶偏振遥感. 北京: 高等教育出版社: 1–22)
-
Hagolle O, Nicolas J M, Fougnie B, Cabot F and Henry P. 2004. Absolute calibration of VEGETATION derived from an interband method based on the sun glint over ocean. IEEE Transactions on Geoscience and Remote Sensing, 42 (7): 1472–1481. [DOI: 10.1109/TGRS.2004.826805]
-
Harmel T and Chami M. 2013. Estimation of the sunglint radiance field from optical satellite imagery over open ocean: multidirectional approach and polarization aspects. Journal of Geophysical Research: Oceans, 118 (1): 76–90. [DOI: 10.1029/2012JC008221]
-
Koepke P. 1984. Effective reflectance of oceanic whitecaps. Applied Optics, 23 (11): 1816–1824. [DOI: 10.1364/AO.23.001816]
-
Kotchenova S Y and Vermote E F. 2007. Validation of a vector version of the 6S radiative transfer code for atmospheric correction of satellite data. Part II. Homogeneous Lambertian and anisotropic surfaces. Applied Optics, 46 (20): 4455–4464. [DOI: 10.1364/AO.46.004455]
-
Li Z Q, Goloub P, Devaux C, Gu X F, Deuzé J L, Qiao Y L and Zhao F S. 2006. Retrieval of aerosol optical and physical properties from ground-based spectral, multi-angular, and polarized sun-photometer measurements. Remote Sensing of Environment, 101 (4): 519–533. [DOI: 10.1016/j.rse.2006.01.012]
-
Liou K N. 2002. An Introduction to Atmospheric Radiation. 2nd ed. USA: Elsevier: 200–255
-
Mao Z H, Guo D F and Pan D L. 1996. A study of sun glitter obtaining and removing in air-borne ocean color remote sensing. Remote Sensing Technology and Application, 11 (4): 15–20. ( 毛志华, 郭德方, 潘德炉. 1996. 航空水色遥感中太阳耀光信息提取及消除方法的研究. 遥感技术与应用, 11 (4): 15–20. )
-
Pan D L, Li S J and Mao T M. 1997. Study on radiance models for ocean colour remote sensing. Oceanologia et Limnologia Sinica, 28 (6): 652–658. [DOI: 10.3321/j.issn:0029-814X.1997.06.015] ( 潘德炉, 李淑菁, 毛天明. 1997. 卫星海洋水色遥感的辐射模式研究. 海洋与湖沼, 28 (6): 652–658. [DOI: 10.3321/j.issn:0029-814X.1997.06.015] )
-
Qie L L, Ma Y, Chen X F, Li L, Li Z Q and Zhang Y. 2016. Aerosol model assumption: the retrievals of aerosol optical depth from satellite near-infrared polarimetric measurements. Journal of Infrared and Millimeter Waves, 35 (5): 569–577. [DOI: 10.11972/j.issn.1001-9014.2016.05.011] ( 伽丽丽, 马䶮, 陈兴峰, 李莉, 李正强, 张洋. 2016. 卫星近红外偏振通道反演气溶胶光学厚度的气溶胶模型影响. 红外与毫米波学报, 35 (5): 569–577. [DOI: 10.11972/j.issn.1001-9014.2016.05.011] )
-
Remer L A, Kaufman Y J, Tanré D, Mattoo S, Chu D A, Martins J V, Li R R, Ichoku C, Levy R C, Kleidman R G, Eck T F, Vermote E and Holben B N. 2005. The MODIS aerosol algorithm, products, and validation. Journal of the Atmospheric Sciences, 62 (4): 947–973. [DOI: 10.1175/JAS3385.1]
-
Riédi J, Marchant B, Platnick S, Baum B A, Thieuleux F, Oudard C, Parol F, Nicolas J M and Dubuisson P. 2010. Cloud thermodynamic phase inferred from merged POLDER and MODIS data. Atmospheric Chemistry and Physics, 10 (23): 11851–11865. [DOI: 10.5194/acp-10-11851-2010]
-
Toubbe B, Bailleul T, Deuze J L Goloub P, Hagolle O and Herman M. 1999. In-flight calibration of the POLDER polarized channels using the sun’s glitter. IEEE Transactions on Geoscience and Remote Sensing, 37 (1): 513–524. [DOI: 10.1109/36.739104]
