
|
收稿日期: 2017-02-15; 优先数字出版日期: 2018-01-01
基金项目: 国家自然科学基金(编号:41171326,40771198);中南大学中央高校基本科研业务费专项资金(编号:2016zzts087)
第一作者简介: 张猛(1987— ),男,博士研究生,研究方向为环境遥感。E-mail:251zhangmeng@sina.com
通讯作者简介: 曾永年(1959— ),男,教授,研究方向为遥感与地理信息系统及其环境变化。E-mail:ynzeng@mail.csu.edu.cn
中图分类号: TP751
文献标识码: A
|
摘要
植被净初级生产力NPP(Net Primary Production)遥感估算与分析,有赖于高时空分辨率的遥感数据,但目前中高分辨率的遥感数据受卫星回访周期及天气的影响,在中国南方地区难以获取连续时间序列的数据,从而影响了高精度的区域植被净初级生产力的遥感估算。为此,提出一种基于多源遥感数据时空融合技术与CASA模型估算高时空分辨率NPP的方法。首先,利用多源遥感数据,即Landsat 8 OLI数据与MODIS13Q1数据,采用遥感数据时空融合方法,获得了时间序列的Landsat 8 OLI融合数据;然后,基于Landsat 8 OLI时空融合数据,并采用CASA模型,以长株潭城市群核心区为例,进行区域植被NPP的遥感估算。研究结果表明,基于时间序列Landsat融合数据估算的30 m分辨率的NPP具有良好的空间细节信息,且估算值与实测值的相关系数达0.825,与实测NPP数据保持了较好的一致性。
关键词
Landsat 8 OLI, MODIS, 时空融合, 高时空分辨率, 净初级生产力, 遥感估算
Abstract
High-precision and rapidly changing Net Primary Production (NPP) monitoring in regions depends on remote sensing data with high spatial and temporal resolution. However, high-quality remote sensing data with high spatial and temporal resolution are difficult to acquire with a single remote sensor. To solve the problem of missing data, we used the Spatial and Temporal Adaptive Reflectance Fusion Model (STARFM) algorithm in blending MODIS and Landsat data. We obtained high-frequency temporal information from the MODIS data and high-resolution spatial information from the Landsat8 OLI data to predict NPP with high spatial and temporal resolution. Using the STARFM model, we obtained the time series data with 30 m spatial resolution and 16 day temporal resolution. Then, the fused time series NDVI data combined with meteorological data were used as inputs to the Carnegie–Ames–Stanford approach model to estimate the NPP in the Chang–Zhu–Tan urban agglomerations. An area with 500×500 pixels was randomly selected from true Landsat images and fused Landsat images. The correlation coefficient and RMSE between the true Landsat8 NDVI and fused Landsat NDVI image were above 0.7 and 0.08, respectively. This result indicates that the true data and fused data maintained good consistency. The NPP estimated with the fused Landsat NDVI data showed better detailed spatial information than that obtained with the MODIS data. The fused NPP data showed distinct boundaries between water, road, and building, whereas the NPP simulated from the MODIS did not. The mean values of the NPP data obtained with the fused Landsat NDVI and MODIS NDVI data were 323.01 and 260.88 gC·m–2·a–1, respectively. The mean value of the NPP from the fused Landsat NDVI data was higher than that of the NPP from the MODIS data due to the spectral difference between the MODIS and Landsat images. To further validate the fused NPP data, we employed the measured value of NPP. The correlation coefficients, RMSEs, and relative errors of the fused NPP and measured NPP were 0.89, 4.83 gC·m–2·a–1, and 9.82%, respectively, which indicated that the fused NPP had a good consistency with the measured data. The fused NPP was consistent with the NPP obtained with the MODIS data in terms of pixels; the vegetation coverage accounted for more than 80% of the mixed pixels. Meanwhile, the fused NPP was significantly higher than the NPP estimated from the MODIS data in terms of pixels; the vegetation coverage accounted for less than 20% of the mixed pixels. At the same time, the fused NPP data retained the time features of the time series MODIS data. With the rapid development of regions, remote sensing data from a single date cannot meet the requirements of the monitoring of dynamic vegetation growth in urban areas. A spatial–temporal fusion technique is an effective way to blend images from different sensors for applications that require high resolutions in both time and space. This technique should be able to support time series remote data with high spatial and temporal resolution for NPP monitoring in regional areas. However, due to the rapid expansion of cities and unreasonable planning of regions, vegetation patches become increasingly fragmented with high spatial heterogeneity. Therefore, on the one hand, we should improve the spatial resolution of remote sensing data. On the other hand, we have to solve spatial heterogeneity, which is the focus of our follow-up research.
Key words
Landsat 8 OLI, MODIS, data fusion, high spatial and temporal, net primary production, remote sensing estimation
1 引 言
净初级生产力NPP(Net Primary Production)是指绿色植被在单位时间与单位面积上所产生的有机干物质总量,是生态系统功能状况的重要指标和碳循环中的关键要素,反映气候变化与人类活动对陆地植被综合作用的结果(Singh,2011;张镱锂 等,2014;陈晓玲 等,2016)。近年来,快速的城镇化过程在带来巨大经济与物质利益的同时,严重地影响了区域生态系统的功能,并带来了一系列的区域生态环境问题,如生物多样性减少和植被破坏(张骞 等,2017;李梦桃 等,2016),城市热岛效应增强(孙泽祥 等,2016;刘新 等,2013),环境污染加重(杜江 等,2008),在一定程度上影响了区域生态系统的碳循环(孙昌龙 等,2013;朱士华 等,2016)。因此,适时地估算区域的净初级生产力,对区域生态系统评估、碳循环研究及可持续发展评价均具有重要的意义。
遥感数据具有时间序列长、覆盖范围广等特点,从而使利用遥感数据驱动生态学模型成为全球NPP模拟估算的重要方法之一(Gitelson 等,2012;Matsushita 等,2002)。在基于遥感数据的NPP模拟估算模型中(统计模型、参数模型和过程模型),基于光能利用率的CASA (Carnegie-Ames-Stanford Approach)模型在全球范围不同时空尺度的NPP模拟估算中得到较为广泛的应用(孙鸿烈 等,2012;高清竹 等,2007;Field 等,1995)。MODIS数据因其较高的时间分辨率及获取成本低廉性,使其成为目前区域NPP模拟估算的主要遥感数据源之一(Turner 等,2006;孙政国 等,2012;王伦澈 等,2013;Zhao 等,2014)。尽管基于MODIS数据(250—500 m)的NPP遥感模型模拟与估算可以反映出生产力的时序变化,但受空间分辨率的限制,其NPP估算结果的空间表达不够精细,难以满足区域植被生态环境及碳循环研究的需求。为此,有学者基于中高分辨率影像对区域植被净初级生产力(NPP)进行了模拟。管小彬等人(2015)基于Landsat TM/ETM+影像对武汉市冬季NPP进行了模拟与监测;胡小飞等人(2016)基于单时相Landsat ETM+数据估算了广州市森林净初级生产力。然而,目前中高分辨率NPP模拟估算中,受中高分辨率遥感数据获取时间序列数据的限制,缺乏高时空分辨率遥感的支持,只能做单时相或单一季节的NPP模拟估算。因此,基于高时空分辨率数据的区域NPP模拟研究尚显不足。
随着遥感技术的发展,中高空间分辨遥感数据类型逐渐增多,为区域NPP估算提供了多源遥感数据。由于受时间分辨率及云雨天气的影响,难以获取完整时间序列的中高空间分辨率遥感影像。为解决中高空间分辨率卫星数据缺失的问题,基于多源遥感数据时空融合技术得到发展,并已在植被、土地覆盖与土地利用中得到较多的应用(Gao 等,2006;Hilker 等,2009;Zhu 等,2010;Wu 等,2012;Hiker 等,2009;牛忠恩 等,2016)。因此,利用遥感数据时空融合技术,获到高时空分辨率的遥感数据,并基于其长时间序列的历史记录数据,模拟区域植被NPP及其时空演化是值得研究的问题。
基于以上分析,本文以快速发展的长株潭城市群为实验区,探讨基于多源遥感数据时空融合技术获取高时空分辨率遥感数据的全年逐月植被NPP的估算方法,并进行方法的有效性检验,以此为改善与提高区域生态系统生产力的估算与模拟提供有效的技术方法与途径。
2 实验区与数据
2.1 实验区概况
长株潭城市群位于长江以南、南岭以北,介于27°36′—28°33′N,112°36′—113°16′E之间,是长江中游城市群的重要组成部分,也是中国资源节约型和环境友好型社会建设综合配套改革试验区(邓楚雄 等,2013)。研究区大部分地区海拔低于50 m,多丘陵、山地和山间平原,属亚热带季风气候,年均气温约为16—18 ℃,年均降水量约为1814 mm。本文选择的长株潭城市群核心区为实验区,包括长沙市、株洲市、湘潭市及周围城镇共15个县(区),土地面积约为8640 km2。

2.2 数据与处理
实验所需遥感数据为Landsat 8 OLI、MODIS13Q1和MODIS09Q1均下载于美国地质调查局USGS(United States geological survey)。覆盖研究区Landsat 8 OLI行列号为123/40与123/41,MODIS行列号为h28v06,具体数据说明见表1。
表 1 遥感数据类型及获取日期
Table 1 Remote sensing data types and acquisition date
| 数据类型 | 行列号 | 影像类型 |
| Landsat 8 OLI | 123/40 123/41 | 云量<5%的所有影像 |
| MODIS13Q1 | h28v06 | 2015年全年共23期 |
获取的Landsat 8 OLI数据质量较好,云覆盖率均小于5%。利用ENVI5.1软件对数据进行辐射定标,并经FLAASH模块进行大气校正,之后基于1∶10000的土地利用数据采用二次多项式进行几何精校正(张猛 等,2015)。
研究主要实验数据为MODIS13Q1产品中的NDVI(Normalized Difference Vegetation Index)数据,获取时间范围均为2015年1月1日—12月19日,共23期,分辨率为250 m,投影为Sinusoidal(正弦投影)(孙佩军 等,2016;张猛 等,2017)。MODIS13Q1为16天合成数据,降低了非植被效应(云、雾及气溶胶)的影响。利用ENVI5.1图像处理软件对MODIS NDVI数据进行无效值处理,并对所有数据经投影转换后按研究区范围进行裁剪,与Landsat 8 OLI进行配准。
研究区的DEM数据来源于地理空间数据云(http://www.gscloud.cn/[2017-02-15]),分辨率为30 m。气象数据来源于中国气象科学数据共享网(http://cdc.nmic.cn[2017-02-15]),选取2015年研究区及周边地区气象站点的月平均温度、月总降水量以及6个气象站点观测的月总太阳辐射数据。为提高气象数据的精度,利用研究区DEM数据及气象站点的经纬度信息,在SPSS及ArcGIS环境下,采用多元线性回归法实现气象要素的空间化,获取空间分辨率为30 m的气象要素栅格数据。
土地覆盖产品来源于地球系统科学数据共享网(http://www.geodata.cn/[2017-02-15])提供的中国1∶25万土地覆盖遥感调查与监测数据库,对其进行裁剪并重采样到30 m,投影方式与Landsat 8相同。
在研究区植被状况调查的基础上,根据植被长势并兼顾典型植被的分布情况,选取NPP实际观测数据包括23个样地,样地大小为30 m×30 m。在每个样地内,设置5个2 m×2 m的小样方,并使用GPS记录样地的坐标值。在小样方内采集生物量标本,在室内烘干处理、称重得到样方的生物量,然后利用生物量与初级生产力的关系将其换算成NPP值并用于验证本文城市区域NPP估算与模拟的精度。
3 研究方法
基于MODIS数据与中高空分辨率遥感数据,利用STARFM模型融合得到23期空间分辨率为30 m、时间间隔为16天的时间序列遥感数据,结合空间化的气象数据(气温与降水)与太阳辐射数据、土地覆盖数据,驱动CASA模型获得到研究区时间序列NPP模拟数据,并基于NPP实测数据验证NPP估算值的精度,具体流程见图2。
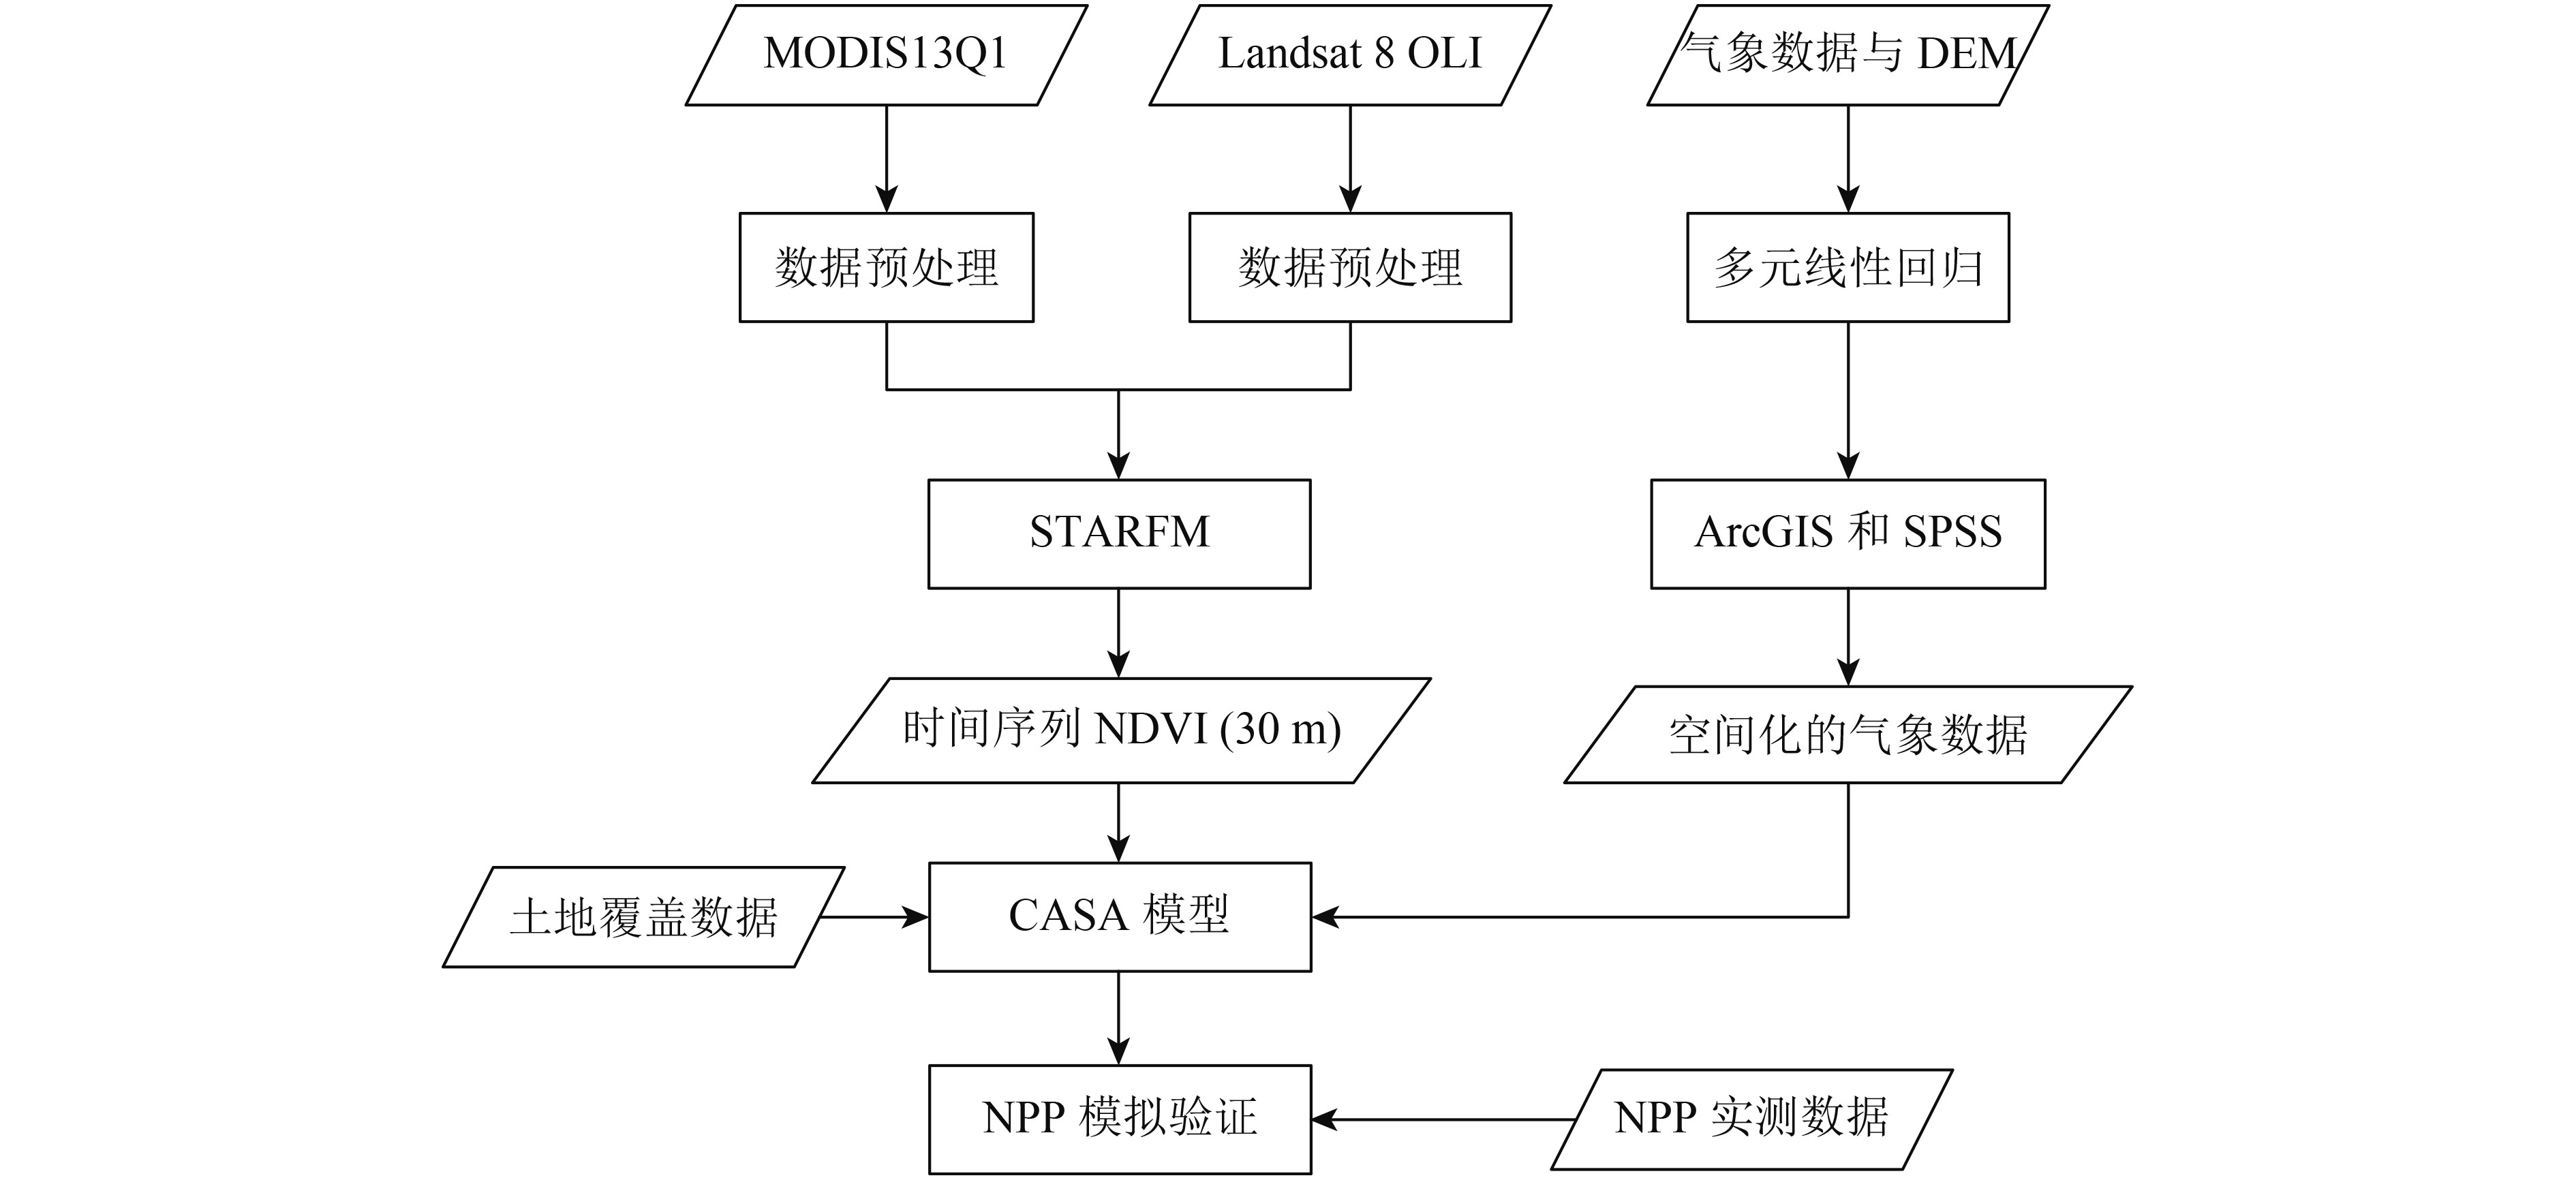
适用本方法的中高空分辨率影像包括HJ-1/CCD、GF-1以及Landsat等卫星影像等遥感数据,以Landsat 8 OLI数据为例进行实验研究。
3.1 遥感数据融合方法
基于STARFM(Spatial and Temporal Adaptive Reflectance Fusion Model)模型(Gao 等,2006),通过融合Landsat 8 OLI与MODIS13Q1数据来构建时间序列的Landsat 8 NDVI数据。该模型通过一对或两对t0时刻Landsat、MODIS数据以及t1时刻的MODIS数据,并结合不同的空间权重融合计算出t1时刻的Landsat数据,其计算公式如下
| $\begin{aligned}L({x_{w/2}},{y_{w/2}},{t_1}) = & \sum\limits_{i = 1}^w {\sum\limits_{j = 1}^w {\sum\limits_{k = 1}^n {{W_{ijk}} \times (M({x_i},{y_j},{t_1}) + } } } \\ &L({x_i},{y_j},{t_0}) - M({x_i},{y_j},{t_0}))\end{aligned}$ | (1) |
式中,L和M分别表示Landsat与MODIS像元的NDVI值;W表示权重函数,决定了滑动窗口内各像元对预测值的贡献大小,常利用光谱距离、时间距离与空间距离来确定函数权重;(xi, yj , t0)表示t0时刻位置为(xi, yj)处的像元;(xi, yj, t1)表示t1时刻位置为(xi, yj)处的像元;(xw/2, yw/2, t1)表示t1时刻移动窗口的中心像元。
3.2 NPP估算模型
利用的NPP估算模型为朱文泉等人(2005)改进的CASA光能利用率模型,模型研究方法与公式如下
| ${\rm{NPP}}(x,t) = A_{\rm{apar}}(x,t) \times \varepsilon (x,t)$ | (2) |
式中,NPP(x, t)为像元x在第t月内的净初级生产力,单位是g C(m–2×month–1);Aapar(x, t)为像元x在第t月吸收的光合有效辐射,单位是MJ(m–2×month–1);ε(x, t)为像元x在第t月的实际光能利用率,单位是g C·MJ–1。
| $A_{\rm{APAR}}(x,t) = S_{\rm{sol}}(x,t) \times F_{\rm{FPAR}}(x,t) \times 0.5$ | (3) |
式中,Ssol(x, t)为第t月在像元x处的太阳总辐射量,单位是MJ/(m2×月);FFPAR(x, t)为植被层对入射光合有效辐射的吸收比例,具体计算参考文献(朱文泉,2005);常数0.5表示植被所能利用的太阳有效辐射(波长为0.4—0.7 μm)占太阳总辐射的比例。
| $\varepsilon (x,t) = {\varepsilon _{\max }} \times T(x,t) \times W(x,t)$ | (4) |
式中,εmax是理想条件下的最大光能利用率,单位是g·MJ–1;T(x, t)、W(x, t)分别为像元x在第t时间内的温度和水分胁迫因子,具体计算参考文献(朱文泉 等,2005)。
由于朱泉文改进的CASA光能利用率模型需要计算每个月的净初级生产力(NPP),为此,利用最大值合成法将全年23期融合的Landsat NDVI合成为12个月的NDVI值(合成时,第145天的Landsat NDVI需要用到两次)。同时,本文结合研究区土地覆盖类型,基于融合的高空间分辨率NDVI数据(30 m),建立了使用于研究区NPP估算模型的参数,具体说明见表2。
表 2 研究区土地覆盖类型及NPP模型输入参数
Table 2 Land cover types and NPP model parameters in study area
| 一级类型 | 类型代码 | 二级类型 | NDVImax | NDVImin | εmax |
| 森林 | 11 | 常绿针叶林 | 0.745 | 0.560 | 0.38 |
| 12 | 常绿阔叶林 | 0.732 | 0.527 | 0.98 | |
| 13 | 落叶针叶林 | 0.741 | 0.554 | 0.49 | |
| 14 | 落叶阔叶林 | 0.736 | 0.549 | 0.68 | |
| 15 | 针阔混交林 | 0.735 | 0.572 | 0.48 | |
| 16 | 灌丛 | 0.742 | 0.615 | 0.44 | |
| 草地 | 21 | 草甸草地 | 0.723 | 0.306 | 0.54 |
| 22 | 典型草地 | 0.719 | 0.522 | 0.54 | |
| 26 | 灌丛草地 | 0.728 | 0.608 | 0.54 | |
| 农田 | 31 | 水田 | 0.662 | 0.512 | 0.54 |
| 32 | 水浇地 | 0.678 | 0.489 | 0.54 | |
| 33 | 旱地 | 0.683 | 0.499 | 0.54 | |
| 建设用地 | 41 | 城镇建设用地 | 0.564 | 0.263 | 0.54 |
| 42 | 农村建设用地 | 0.652 | 0.417 | 0.54 | |
| 其他土地 | 51 | 沼泽 | 0.647 | 0.405 | 0.54 |
| 53 | 内陆水体 | — | — | — | |
| 54 | 河湖滩地 | 0.626 | 0.278 | 0.54 | |
| 61 | 裸岩 | — | — | — | |
| 62 | 裸地 | — | — | — |
4 实验结果
4.1 数据融合效果
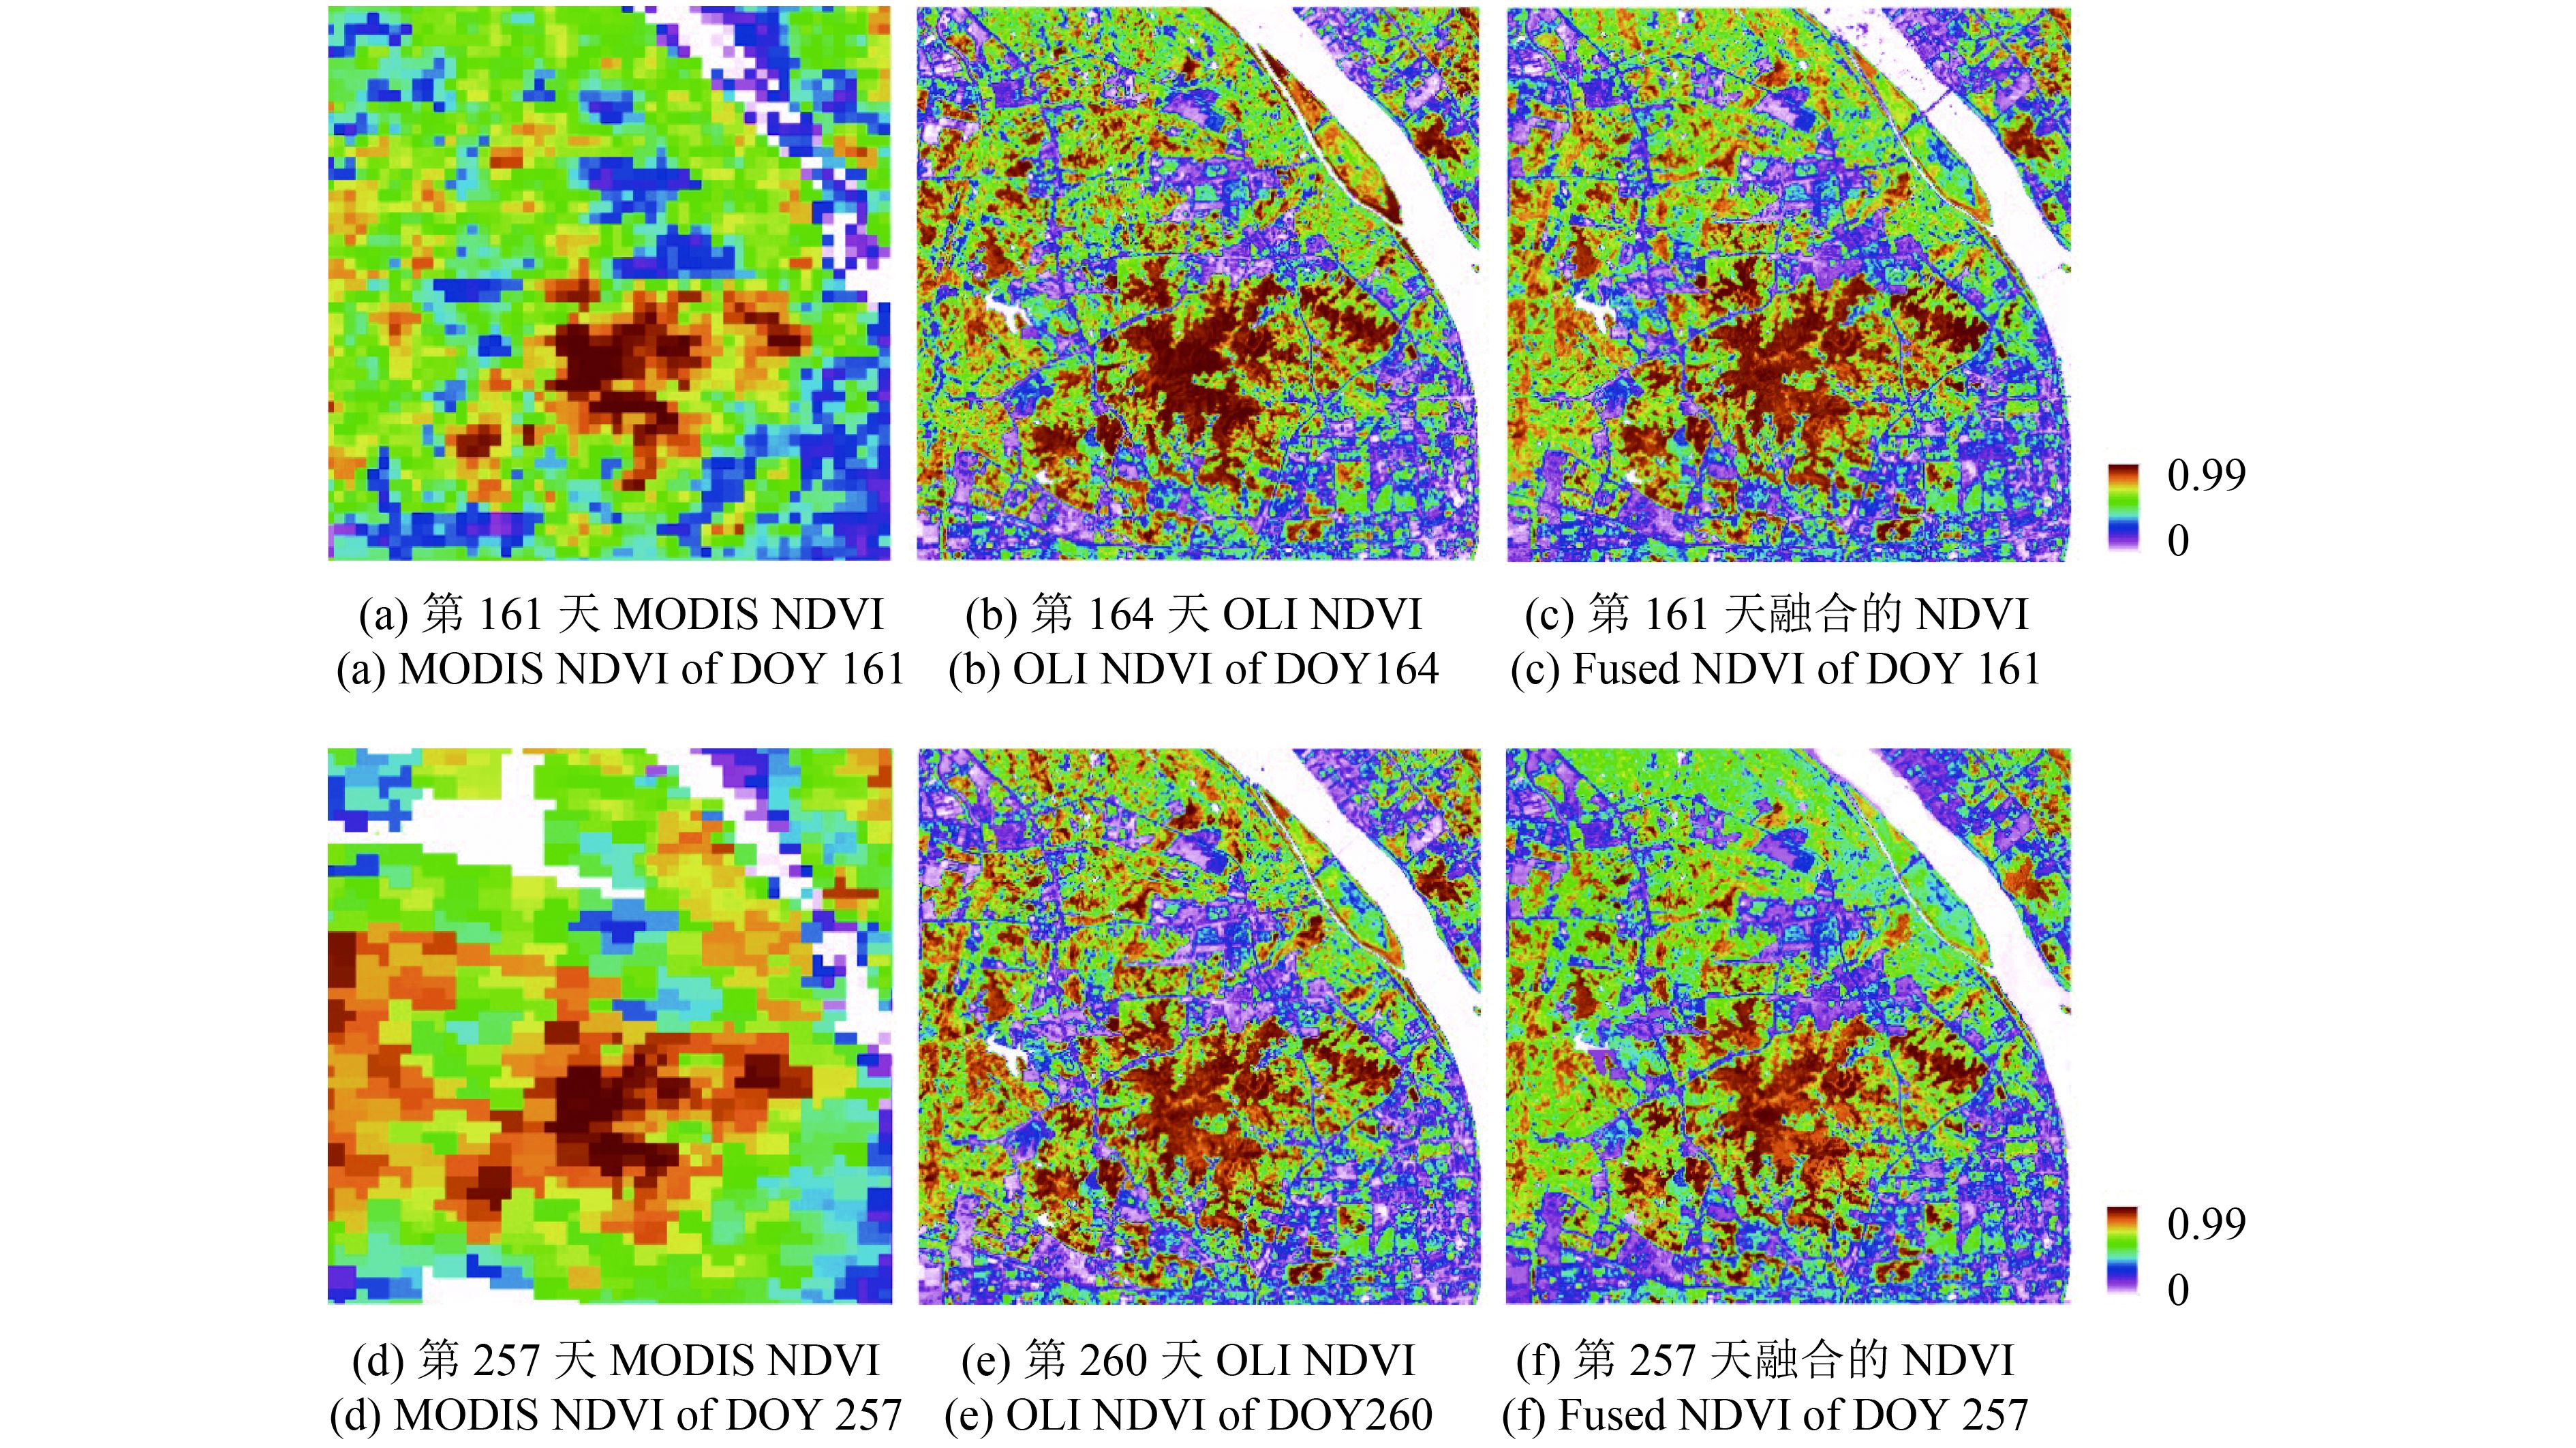
为验证基于STARFM模型融合MODIS数据与Landsat 8 OLI数据生成的时间序列NDVI数据的精度,利用2015年第212天的OLI NDVI和第209天的MODIS NDVI为基础数对,分别融合出第161与257天的OLI NDVI,并与对应时期的真实OLI NDVI数据进行比较,因为MODIS NDVI为16天合成数据,因此选择数据时尽量使MODIS NDVI数据的日期与真实OLI NDVI数据接近;DOY表示一年中的天数,即day of year。图3为同一时期的MODIS NDVI、OLI NDVI及基于STARFM模型融合的NDVI数据。融合的NDVI数据与MODIS NDVI数据相比,空间分辨率显著提高,空间细节信息更为明显;与真实OLI NDVI数据相比,空间分辨率与空间信息分布趋势都基本一致。
选择相关系数与均方根误差进一步检验融合NDVI数据的精度。第161天融合的NDVI与第164天真实OLI NDVI影像之间的相关系数为0.863,均方根误差(RMSE)为0.08(图4(a));第257天融合的NDVI与第260天真实OLI NDVI影像之间的相关系数为0.749,均方根误差(RMSE)为0.09(图4(b))。

多期融合影像与对应真实影像间的相关系数与均方根误差(表3)表明,融合影像与真实影像的相关系数均在0.7以上,均方根误差(RMSE)也基本稳定在0.08、0.09左右,变化幅度≤0.02。说明应用STARFM融合生成的NDVI数据与真实数据具有较高的一致性,可用于后续研究。
表 3 融合影像与真实影像间的相关系数与均方根误差
Table 3 Correlation and RMSE between fused and true images
| DOY17 | DOY49 | DOY97 | DOY129 | DOY161 | DOY225 | DOY257 | DOY289 | |
| 相关系数(R) | 0.728 | 0.784 | 0.815 | 0.826 | 0.836 | 0.762 | 0.749 | 0.828 |
| 均方根误差(RMSE) | 0.10 | 0.09 | 0.08 | 0.08 | 0.08 | 0.09 | 0.09 | 0.08 |
4.2 NPP模拟结果与验证
4.2.1 NPP模拟结果
基于CASA模型与250 m分辨率的MODIS NDVI数据估算的2015年NPP总量(图5(a)),NPP影像空间分辨率较低,具体到小范围时则不够精细,缺乏空间纹理等细节信息;基于融合得到的30 m空间分辨率估算的NPP影像,影像空间分辨率相对较高,纹理等空间细节信息清晰,可以表现出较小地物间的差异(图5(b))。基于MODIS数据估算的2015年长株潭城市群核心区的NPP均值为260.88 gC·m–2·a–1,而基于融合数据估算的NPP均值为323.01 gC·m–2·a–1,两者相差较大,融合数据估算的NPP值较MODIS数据高了近20%,因为通过遥感时空融合模型(STARFM)得到的Landsat NDVI均值要高于MODIS NDVI均值,这与MODIS与Landsat数据存在一定的光谱特征差异有关。利用MODIS NDVI数据估算的NPP大部分像元值在200—600 gC·m–2·a–1之间,很难表现出不同地物的空间异质性;利用融合数据估算的NPP像元值的峰值在300 gC·m–2·a–1左右,近似正态分布。从图5(b)中可以看出,基于融合数据估算的NPP空间信息较为丰富,河流、农业用地、建设用地和林地等不同地物间的NPP差异明显,且边界清晰。

4.2.2 基于CASA模型与融合数据估算NPP的精度验证
为验证基于CASC模型与融合数据估算的NPP的精度,采用研究区2015年23个样本实际观测值与模拟值进行相关性检验。由于实际观测值为生物量,因此利用生物量与初级生产力的关系(Johnson和Sharpe,1983)来验证NPP模拟的精度。通过统计分析,NPP模拟值与对应NPP实测值之间的相关系数R为0.89,NPP估算值与实测值显著相关(图6)。同时,模拟值与实测值之间的均方根误差(RMSE)为4.83 gC·m–2·a–1,平均相对误差为9.82%,说明本文基于CASA模型与融合的高空间分辨率数据(30 m)模拟得到的NPP结果较为可靠,可以用于后续分析。

4.2.3 不同植被覆盖度下的NPP模拟值分析
为进一步分析数据融合前后NPP的差异,将基于融合数据(30 m)估算的NPP重采样为250 m×250 m分辨率,与MODIS数据相匹配。然后,基于不同像元植被覆盖度比较两种NPP估算结果的差异。结果表明,当像元植被覆盖度小于20%时,融合数据估算的NPP值明显大于MOIDS估算的NPP值(图7(a))。主要原因是由于MODIS数据分辨率较低,加之植被覆盖度小,导致部分混合像元直接被视为无植被覆盖。而融合数据的植被与河流、裸地等地类具有较明细的边界,因此其估算的NPP值要大于MODIS估算的NPP值。当像元植被覆盖度>80%时,融合数据估算的NPP值与MOIDS估算的NPP值则保持了较好的一致性(图7(b))。表明像元植被覆盖度越大,两者的差异越小。

5 结 论
本文提出了一种基于遥感时空融合技术与CASA模型估算高空间分辨率NPP的方法,研究结果表明,基于STARFM模型,融合Landsat 8 OLI数据与MODIS数据,获得了空间分辨率为30 m、时间间隔为16天的Landsat NDVI融合数据,可有效提高城市复杂区域植被NPP估算的时空分辨率精度,试验结果表明:
(1)利用时空融合模型(STARFM)得到的时间序列NDVI效果较好,能够用于后续NPP模拟与计算。
(2)基于融合的时间序列NDVI模拟得到的NPP较基于MODIS数据模拟得到的NPP具有更精细的空间信息。
(3)基于融合的时间序列NDVI模拟得到的NPP与实际观测数据具有较好的相关性,说明本文提出的高时空分辨率城市区域NPP模拟估算方法NPP可靠、有效。
(4)时间序列NPP在一定程度上较好地保留了MODIS数据的时间过程信息。同时,在植被覆盖度不同的情况下,基于两种数据模拟得到的NPP变化趋势也不一样。
在中国南方阴雨天气较多的地区,在无法从单一传感器获取高时空分辨率遥感数据的前提下,通过遥感数据时空融合技术融合不同传感器数据的特征,生成一种具备高分辨率影像的高空间分辨率特征与低分辨率的高时间分辨率特征,可以为区域植被动态监测与生产力模拟估算提供高时空分辨率的遥感数据。尽管基于融合Landsat数据的NPP模拟估算提高了区域NPP估算的精度,但对于空间异质性较高的复杂地表分布区域,可基于更高分辨率的GF-1多光谱数据,利用本文提供的技术方法获得高精度的NPP的模拟与估算结果。
另外,本文NPP模拟估算结果的验证数据为基于野外生物量的实测方法,在后续研究中会利用多种方法来验证NPP模拟值的可靠性,如目前全球使用较为广泛的涡度观测(刘敏 等,2014)等方法。
参考文献(References)
-
Chen X L and Zeng Y N. 2016. Spatial and temporal variability of the net primary production (NPP) and its relationship with climate factors in subtropical mountainous and hilly regions of China: a case study in Hunan province. Acta Geographica Sinica, 71 (1): 35–48. [DOI: 10.11821/dlxb201601003] ( 陈晓玲, 曾永年. 2016. 亚热带山地丘陵区植被NPP时空变化及其与气候因子的关系——以湖南省为例. 地理学报, 71 (1): 35–48. [DOI: 10.11821/dlxb201601003] )
-
Deng C X, Xie B G, Li X Q, Liu L K and Xiang Y B. 2013. Evaluation of intensive cultivated land use based on a projection pursuit model in Changsha-Zhuzhou-Xiangtan urban agglomeration. Geographical Research, 32 (11): 2000–2008. [DOI: 10.11821/dlyj201311003] ( 邓楚雄, 谢炳庚, 李晓青, 刘利科, 向云波. 2013. 基于投影寻踪法的长株潭城市群地区耕地集约利用评价. 地理研究, 32 (11): 2000–2008. [DOI: 10.11821/dlyj201311003] )
-
Du J and Liu Y. 2008. Urbanization and environmental pollution: empirical study based on provincial panel data of China. Resources and Environment in the Yangtze Basin, 17 (6): 825–830. [DOI: 10.3969/j.issn.1004-8227.2008.06.002] ( 杜江, 刘渝. 2008. 城市化与环境污染: 中国省际面板数据的实证研究. 长江流域资源与环境, 17 (6): 825–830. [DOI: 10.3969/j.issn.1004-8227.2008.06.002] )
-
Field C B, Randerson J T and Malmströem C M. 1995. Global net primary production: combining ecology and remote sensing. Remote Sensing of Environment, 51 (1): 74–88. [DOI: 10.1016/0034-4257(94)00066-V]
-
Gao F, Masek J, Schwaller M and Hall F. 2006. On the blending of the Landsat and MODIS surface reflectance: predicting daily Landsat surface reflectance. IEEE Transactions on Geoscience and Remote Sensing, 44 (8): 2207–2218. [DOI: 10.1109/TGRS.2006.872081]
-
Gao Q Z, Wan Y F, Li Y E, Sheng W P, Jiangcun W Z, Wang B S and Li W F. 2007. Trends of grassland NPP and its response to human activity in northern Tibet. Acta Ecologica Sinica, 27 (11): 4612–4619. [DOI: 10.3321/j.issn:1000-0933.2007.11.029] ( 高清竹, 万运帆, 李玉娥, 盛文萍, 江村旺扎, 王宝山, 李文福. 2007. 藏北高寒草地NPP变化趋势及其对人类活动的响应. 生态学报, 27 (11): 4612–4619. [DOI: 10.3321/j.issn:1000-0933.2007.11.029] )
-
Gitelson A A, Peng Y, Masek J G, Rundquist D C, Verma S, Suyker A, Baker J M, Hatfield J L and Meyers T. 2012. Remote estimation of crop gross primary production with Landsat data. Remote Sensing of Environment, 121 : 404–414. [DOI: 10.1016/j.rse.2012.02.017]
-
Guan X B, Shen H F, Gan W X and Zhang L P. 2015. Estimation and spatiotemporal analysis of Winter NPP in Wuhan based on Landsat TM/ETM+ images. Remote Sensing Technology and Application, 30 (5): 884–890. [DOI: 10.11873/j.issn.1004-0323.2015.5.0884] ( 管小彬, 沈焕锋, 甘文霞, 张良培. 2015. 基于Landsat TM/ETM+影像的武汉市冬季NPP估算及其时空变化分析. 遥感技术与应用, 30 (5): 884–890. [DOI: 10.11873/j.issn.1004-0323.2015.5.0884] )
-
Hilker T, Wulder M A, Coops N C, Linke J, McDermid G, Masek J G, Gao F and White J C. 2009. A new data fusion model for high spatial-and temporal-resolution mapping of forest disturbance based on Landsat and MODIS. Remote Sensing of Environment, 113 (8): 1613–1627. [DOI: 10.1016/j.rse.2009.03.007]
-
Hiker H, Wulder M A, Coops N C, Seitz N, White J C, Gao F, Masek J G and Stenhouse G. 2009. Generation of dense time series synthetic Landsat data through data blending with MODIS using a spatial and temporal adaptive reflectance fusion model. Remote Sensing of Environment, 113 (9): 1988–1999. [DOI: 10.1016/j.rse.2009.05.011]
-
Hu X F, Tang X, Hu Y M, Fan S D and Wang L. 2016. Estimation of net primary productivity of urban forest ecological system in Guangzhou city. Journal of Central South University of Forestry and Technology, 36 (5): 19–25. [DOI: 10.14067/j.cnki.1673-923x.2016.05.004] ( 胡小飞, 唐宪, 胡月明, 樊舒迪, 王璐. 2016. 广州市城市森林净初级生产力遥感估算. 中南林业科技大学学报, 36 (5): 19–25. [DOI: 10.14067/j.cnki.1673-923x.2016.05.004] )
-
Johnson W C and Sharpe D M. 1983. The ratio of total to merchantable forest biomass and its application to the global carbon budget. Canadian Journal of Forest Research, 13 (3): 372–383. [DOI: 10.1139/x83-056]
-
Li M T and Zhou Z X. 2016. Positive and negative ecosystem services evaluation and its spatial pattern analysis on urban landscape: a case study of Xi’an City. Acta Geographica Sinica, 71 (7): 1215–1230. [DOI: 10.11821/dlxb201607010] ( 李梦桃, 周忠学. 2016. 西安市城市景观的正负生态系统服务测算及空间格局. 地理学报, 71 (7): 1215–1230. [DOI: 10.11821/dlxb201607010] )
-
Liu M, Fu Y L and Yang F. 2014. Research progress on urban carbon fluxes based on eddy covariance technique. Chinese Journal of Applied Ecology, 25 (2): 611–619. [DOI: 10.13287/j.1001-9332.2013.0007] ( 刘敏, 伏玉玲, 杨芳. 2014. 基于涡度相关技术的城市碳通量研究进展. 应用生态学报, 25 (2): 611–619. [DOI: 10.13287/j.1001-9332.2013.0007] )
-
Liu X, Liu S D, Zhao X Y and Wang Y W. 2013. A preliminary research of urbanization process and heat island effect in Nanjing. Resources and Environment in the Yangtze Basin, 22 (12): 1543–1549. ( 刘新, 刘寿东, 赵小艳, 王咏薇. 2013. 南京城市化进程与热岛效应的初步研究. 长江流域资源与环境, 22 (12): 1543–1549. )
-
Matsushita B and Tamura M. 2002. Integrating remotely sensed data with an ecosystem model to estimate net primary productivity in East Asia. Remote Sensing of Environment, 81 (1): 58–66. [DOI: 10.1016/S0034-4257(01)00331-5]
-
Niu Z E, Yan H M, Huang M, Hu Y F and Chen J Q. 2016. Agricultural productivity estimation with MODIS-OLI fusion data. Journal of Natural Resources, 31 (5): 875–885. [DOI: 10.11849/zrzyxb.20150632] ( 牛忠恩, 闫慧敏, 黄玫, 胡云锋, 陈静清. 2016. 基于MODIS-OLI遥感数据融合技术的农田生产力估算. 自然资源学报, 31 (5): 875–885. [DOI: 10.11849/zrzyxb.20150632] )
-
Singh D. 2011. Generation and evaluation of gross primary productivity using Landsat data through blending with MODIS data. International Journal of Applied Earth Observation and Geoinformation, 13 (1): 59–69. [DOI: 10.1016/j.jag.2010.06.007]
-
Sun C L, Jin N, Zhang X L and Du H R. 2013. The impact of urbanization on the CO2 emission in the various development stages . Scientia Geographica Sinica, 33 (3): 266–272. [DOI: 10.13249/j.cnki.sgs.2013.03.006] ( 孙昌龙, 靳诺, 张小雷, 杜宏茹. 2013. 城市化不同演化阶段对碳排放的影响差异. 地理科学, 33 (3): 266–272. [DOI: 10.13249/j.cnki.sgs.2013.03.006] )
-
Sun H L, Zheng D, Yao T D and Zhang Y L. 2012. Protection and construction of the national ecological security shelter zone on Tibetan Plateau. Acta Geographica Sinica, 67 (1): 3–12. [DOI: 10.11821/xb201201001] ( 孙鸿烈, 郑度, 姚檀栋, 张镱锂. 2012. 青藏高原国家生态安全屏障保护与建设. 地理学报, 67 (1): 3–12. [DOI: 10.11821/xb201201001] )
-
Sun P J, Zhang J S, Pan Y Z, Xie D F and Yuan Z M Q. 2016. Temporal-spatial-fusion model for area extraction of paddy rice using multi-temporal remote sensing images. Journal of Remote Sensing, 20 (2): 328–343. [DOI: 10.11834/jrs.20165008] ( 孙佩军, 张锦水, 潘耀忠, 谢登峰, 袁周米琪. 2016. 构建时空融合模型进行水稻遥感识别. 遥感学报, 20 (2): 328–343. [DOI: 10.11834/jrs.20165008] )
-
Sun Z G, Yang Q and Li J L. 2012. The influence of land use and cover change on net primary productivity of middle-sized and small cities. Chinese Agricultural Science Bulletin, 28 (15): 291–296. [DOI: 10.3969/j.issn.1000-6850.2012.15.055] ( 孙政国, 杨齐, 李建龙. 2012. 土地利用与土地覆盖变化对中小城市净初级生产力的影响. 中国农学通报, 28 (15): 291–296. [DOI: 10.3969/j.issn.1000-6850.2012.15.055] )
-
Sun Z X, Liu Z F, He C Y and Wu J G. 2016. Multi-scale analysis of ecosystem service trade-offs in urbanizing drylands of China: a case study in the Hohhot-Baotou-Ordos-Yulin region. Acta Ecologica Sinica, 36 (15): 4881–4891. [DOI: 10.5846/stxb201507051423] ( 孙泽祥, 刘志锋, 何春阳, 邬建国. 2016. 中国快速城市化干燥地区的生态系统服务权衡关系多尺度分析——以呼包鄂榆地区为例. 生态学报, 36 (15): 4881–4891. [DOI: 10.5846/stxb201507051423] )
-
Turner D P, Ritts W D, Cohen W B, Gower S T, Running S W, Zhao M S, Costa M H, Kirschbaum A A, Ham J M, Saleska S R and Ahl D E. 2006. Evaluation of MODIS NPP and GPP products across multiple biomes. Remote Sensing of Environment, 102 (3/4): 282–292. [DOI: 10.1016/j.rse.2006.02.017]
-
Wang L C, Gong W, Zhang M and Ma Y Y. 2013. Dynamic monitoring of vegetation NPP in Wuhan based on MODIS. Geomatics and Information Science of Wuhan University, 38 (5): 548–552. [DOI: 10.13203/j.whugis2013.05.004] ( 王伦澈, 龚威, 张淼, 马盈盈. 2013. 武汉地区植被NPP动态监测研究. 武汉大学学报(信息科学版), 38 (5): 548–552. [DOI: 10.13203/j.whugis2013.05.004] )
-
Wu M Q, Niu Z, Wang C Y, Wu C Y and Wang L. 2012. Use of MODIS and Landsat time series data to generate high-resolution temporal synthetic Landsat data using a spatial and temporal reflectance fusion model. Journal of Applied Remote Sensing, 6 (1): 063507 [DOI: 10.1117/1.JRS.6.063507]
-
Zhang M and Zeng Y N. 2015. Mapping paddy fields of Dongting lake area by fusing Landsat and MODIS data. Transactions of the Chinese Society of Agricultural Engineering, 31 (13): 178–185. [DOI: 10.11975/j.issn.1002-6819.2015.13.025] ( 张猛, 曾永年. 2015. 基于多时相Landsat数据融合的洞庭湖区水稻面积提取. 农业工程学报, 31 (13): 178–185. [DOI: 10.11975/j.issn.1002-6819.2015.13.025] )
-
Zhang M, Zeng Y N and Zhu Y S. 2017. Wetland mapping of Dongting Lake Basin based on time-series MODIS data and object-oriented method. Journal of Remote Sensing, 21 (3): 479–492. [DOI: 10.11834/jrs.20176129] ( 张猛, 曾永年, 朱永森. 2017. 面向对象方法的时间序列MODIS数据湿地信息提取——以洞庭湖流域为例. 遥感学报, 21 (3): 479–492. [DOI: 10.11834/jrs.20176129] )
-
Zhang Q, Gao M, Yang L, Chen C L, Sun Y and Wang J Z. 2017. Changes in the spatial structure of ecological land and ecosystem service values in nine key districts of Chongqing City over the past 25 years. Acta Ecologica Sinica, 37 (2): 566–575. [DOI: 10.5846/stxb201508081672] ( 张骞, 高明, 杨乐, 陈成龙, 孙宇, 王金柱. 2017. 1988–2013年重庆市主城九区生态用地空间结构及其生态系统服务价值变化. 生态学报, 37 (2): 566–575. [DOI: 10.5846/stxb201508081672] )
-
Zhang Y L, Qi W, Zhou C P, Ding M J, Liu L S, Gao J G, Bai W Q, Wang Z F and Zhen D. 2014. Spatial and temporal variability in the net primary production (NPP) of alpine grassland on Tibetan Plateau from 1982 to 2009. Acta Geographica Sinica, 68 (9): 1197–1211. [DOI: 10.11821/dlxb201309004] ( 张镱锂, 祁威, 周才平, 丁明军, 刘林山, 高俊刚, 摆万奇, 王兆锋, 郑度. 2014. 青藏高原高寒草地净初级生产力(NPP)时空分异. 地理学报, 68 (9): 1197–1211. [DOI: 10.11821/dlxb201309004] )
-
Zhao F, Xu B, Yang X C, Jin Y X, Li J Y, Xia L, Chen S and Ma H L. 2014. Remote sensing estimates of grassland aboveground biomass based on MODIS net primary productivity (NPP): a case study in the Xilingol grassland of Northern China. Remote Sensing, 6 (6): 5368–5386. [DOI: 10.3390/rs6065368]
-
Zhu S H, Yan Y, Hu Y F and Zhang C. 2016. The impact of urbanization on ecosystem carbon storage in arid area. Journal of Natural Resources, 31 (7): 1086–1099. [DOI: 10.11849/zrzyxb.20150731] ( 朱士华, 艳燕, 胡云锋, 张弛. 2016. 干旱区城市化对生态系统碳库的影响—以乌鲁木齐市为例. 自然资源学报, 31 (7): 1086–1099. [DOI: 10.11849/zrzyxb.20150731] )
-
Zhu W Q. 2005. Estimation of net primary productivity of Chinese terrestrial vegetation based on remote sensing and its relationship with global climate change. Beijing: Beijing Normal University (朱文泉. 2005. 中国陆地生态系统植被净初级生产力遥感估算及其与气候变化关系的研究. 北京: 北京师范大学)
-
Zhu W Q, Pan Y Z, Long Z H, Chen Y H, Li J and Hu H B. 2005. Estimating net primary productivity of terrestrial vegetation based on GIS and RS: a case study in Inner Mongolia, China. Journal of Remote Sensing, 9 (3): 300–307. [DOI: 10.3321/j.issn:1007-4619.2005.03.012] ( 朱文泉, 潘耀忠, 龙中华, 陈云浩, 李京, 扈海波. 2005. 基于GIS和RS的区域陆地植被NPP估算——以中国内蒙古为例. 遥感学报, 9 (3): 300–307. [DOI: 10.3321/j.issn:1007-4619.2005.03.012] )
-
Zhu X L, Chen J, Gao F, Chen X H and Masek J G. 2010. An enhanced spatial and temporal adaptive reflectance fusion model for complex heterogeneous regions. Remote Sensing of Environment, 114 (11): 2610–2623. [DOI: 10.1016/j.rse.2010.05.032]