

|
收稿日期: 2016-09-30; 优先数字出版日期: 2018-01-01
基金项目: 国家重点研发计划项目(编号:2016YFA0600102);中央高校基本科研业务费专项资金资助(编号:312231103)
第一作者简介: 田信鹏(1990— ),男,博士研究生,研究方向为大气定量遥感。E-mail:tian_xp@mail.bnu.edu.cn
通讯作者简介: 孙林(1975— ),男,教授,研究方向为定量遥感、大气校正及气溶胶遥感。E-mail:sunlin6@126.com
中图分类号: TP79/P407.4
文献标识码: A
|
摘要
卫星气溶胶光学厚度(AOD)反演中,传统暗目标方法在反射率较低的水体、浓密植被覆盖区域取得了较好效果,在反射率较高且结构复杂的高反射地表上空目前多采用深蓝算法,但存在空间分辨率较低,对细节分布描述性较差等问题。为解决这一问题,本文首先以5年(2008年—2012年)长时间序列MODIS地表反射率产品为基础,采用最小值合成法建立500 m分辨率逐月地表反射率产品数据集,然后利用地物波谱库中典型地物波谱数据,分析建立MODIS与Landsat 8 OLI传感器蓝光波段反射率转换模型,最后北京地区AERONET地基观测数据确定了气溶胶光学物理参数,并反演获取了北京地区上空500 m分辨率的AOD分布。为验证反演算法的精度,分别将反演结果同AERONET及MODIS/Terra气溶胶产品(MOD04)进行交叉对比,同时利用相关系数R,均方根误差RMSE,平均绝对误差MAE以及MODIS AOD产品预期误差EE共4个指标进行衡量。结果表明:算法反演获取的AOD与AERONET观测值具有较高的一致性,各指标分别为R=0.963,RMSE=0.156,MAE=0.097,EE=85.3%,稍优于MOD04产品(R=0.962,RMSE=0.158,MAE=0.101,EE=75.8%),并且有效的对比点数也高于MOD04。通过与地基观测相比,卫星遥感获取的高分辨率城市地区AOD精度可作为定量评估城市空气质量的有效依据。
关键词
气溶胶光学厚度, 光谱转化, 地表反射率数据库, Landsat 8 OLI, AERONET
Abstract
Satellite remote sensing has been widely used to retrieve Aerosol Optical Depth (AOD), which is an indicator of air quality and radiative forcing. The Dark Target (DT) algorithm is applied to low reflectance areas, such as vegetated or water areas, and the Deep Blue (DB) algorithm is adopted over bright-reflecting source regions. However, the spatial resolutions of the AOD products obtained with the DT and DB algorithms are relatively low, and the distribution details for urban areas are poor. In this study, a modified retrieval algorithm is proposed for the retrieval of AOD at a spatial resolution of 500 m over Beijing, China, on the basis of Landsat 8 OLI data. The key points are the accurate estimation of surface reflectance and the reasonable assumptions of the aerosol model. We developed a new algorithm to improve the accuracy of land surface reflectance for urban areas. A monthly Minimum Land Surface Reflectance (MLSR) database for China was established using Moderate Resolution Imaging Spectroradiometer (MODIS) surface reflectance products. The construction of this database was based on the principle of minimum synthesis technique. The conversion model from the blue band reflectance of MODIS to Landsat 8 OLI was established using the ASTER spectrum database to compensate for the difference between the spectral settings of the two sensors. AErosol RObotic NETwork (AERONET) data were adopted to determine aerosol optical properties, such as Ångström exponent, complex refractive index, Single Scattering Albedo (SSA), and asymmetric factor (g). The AODs retrieved from the 36 OLI images were validated with the AERONET data and the NASA/MODIS Collection 6 aerosol products at a 10 km resolution. For this purpose, the DT and DB (DT/DB) algorithms were combined. Results indicated that the proposed algorithm accurately retrieved AODs over the Beijing area and that the retrieved aerosol distribution contained more spatial details and variability than the DT/DB AOD products. Ground-based AERONET observations from four sites (Beijing, Xianghe, Beijing_CAMS, and Beijing_RADI) were used to validate the retrieved AODs. The results from the proposed algorithm demonstrated the highest accuracy, with an average correlation coefficient (R) and Root-Mean-Square Error (RMSE) of approximately 0.963 and 0.156, respectively. Approximately 85.3% of the points fell within the expected error (EE) ± (0.05+0.15 AOD) envelope defined by NASA. The DT/DB AODs showed a small R (0.962) and slightly large RMSE (0.158), with 75.8% of the collocations falling within the EE. An aerosol retrieval algorithm for Landsat 8 OLI 500 m data was proposed in this study. The assumptions in this algorithm are as follows: the variation of surface reflectance needs to be small for a month, and the SSA and g are regionally constant for a particular day. The method can also be used to achieve AOD inversion of other terrestrial observation satellite data. However, according to the uncertainty analysis, the proposed algorithm has some limitations that must be addressed. (1) Errors may arise from the use of constant SSA and g values for the day of retrieval. (2) The MLSR database approach was sometimes unsuccessful over snow surfaces, particularly when seasonal changes such as the snow melting in March and the accumulation of snow in Novembers are significant. These factors will be explored in our future studies.
Key words
aerosol optical depth, spectrum conversion, surface reflectance database, Landsat 8 OLI, AERONET
1 引 言
大气气溶胶浓度变化不仅给人们身体健康及生存环境带来直接影响(Gent 等,2009;Pope 等,2002);并通过其直接和间接辐射强迫作用,对区域和全球气候变化起着重要作用(李剑东 等,2015;Tollefson,2010;Penner 等,2004)。大气气溶胶主要来源可分为人为源和自然源,由于来源多样、组成复杂,并且受人类和自然活动影响显著,其辐射强迫作用仍有较大的不确定性,这也是造成目前地气总净辐射强迫估计值不准确性的主要原因(IPCC,2013)。随着卫星遥感技术的发展,使从大范围空间尺度上获取气溶胶光学特性成为可能,尤其是表征气溶胶粒子对电磁辐射消光作用的气溶胶光学厚度AOD(Aerosol Optical Depth)。目前大多数传感器发布的AOD产品空间分辨率普遍偏低(例如,NASA发布的MxD04_L2产品空间分辨率为10/3 km)。在下垫面结构复杂的城市等区域则需要更详细的AOD空间分布信息,以满足环境监测预报、气候分析等方面的应用。
目前可发布AOD产品的卫星传感器主要有:POLDER(Herman 等,1997);ATSR-2(North,2002);TOMS(Torres 等,2002);OMI(Torres 等,2007);GOES(Prados 等,2007);MERIS(Vidot 等,2008);AVHRR(Hauser 等,2005);MISR(Kahn 等,2010);SeaWIFS(Sayer 等,2012);MODIS(Levy 等,2010)以及VIIRS(Jackson 等,2013)等。值得注意的是,NASA/MODIS气溶胶反演算法经过几十年的发展,目前已到第6版本(C6)。C6较C5在诸多方面都有较大改进,可以说是一个全新的算法版本。在C6中,针对不同区域采用不同的反演算法:(1) 海洋及浓密植被覆盖上空仍使用暗目标算法DT(Dark Target),但在云检测、瑞利散射影响、大气分子吸收及气溶胶类型确定等方面都有较大的完善和更新(Levy 等,2013;Remer 等,2013);(2) 针对在可见光波段表现为高反射率特征的干旱/半干旱等地区,则采用深蓝算法DB(Deep Blue)(Hsu 等,2004, 2013),该算法利用构建先验反射率数据库解决AOD反演中地气解耦问题。同时,为了获取更完整的全球AOD空间分布信息,C6将两种算法“融合”,提供一种新的DT/DB组合产品(Levy 等,2013)。Hyer等人(2011)和Sayer等人(2013)分别在局域及全球范围内对DT、DB算法的精度进行验证分析,结果表明:DB算法在较亮地区反演结果偏高,在反射率异常低的暗地表区域结果偏低,最高质量产品中平均有72%的结果满足预期误差;而DT算法在预期误差范围的比重约为68%。
由于MxD04产品空间分辨率较低,其对大范围气溶胶描述具有一定意义,在下垫面复杂区域则有一定的局限性,例如城市地区。该类型区域在可见光波段较海洋及浓密植被覆盖地区具有较高的反射率,并且在可见光波段AOD值一般小于0.25(Remer 等,2008),很难从卫星传感器信号中将大气与地表信息分离。因此,地表反射率的精确确定成为提高该类型区域反演精度的关键因素。Sun等人(2015)提出通过1年的MODIS地表反射率产品(MOD09A1)采用最小反射率合成技术MRT(Minimum Reflectivity Technique)构建先验地表反射率数据集确定地表信息支持MODIS传感器的反演方法,但该方法在支持其他传感器反演时需考虑不同传感器间光谱差异带来的影响。本文在此基础上,利用2008年—2012年共5年长时间序列MOD09A1数据,采用MRT技术构建了500 m分辨率全年每月地表反射率数据集。同时通过构建不同传感器间光谱转换模型消除光谱差异误差,提高AOD反演精度。通过AERONET(AErosol RObotic NETwork)地基观测数据确定气溶胶光学物理参数的基础上,利用Landsat 8 OLI传感器获取了北京市500 m分辨率AOD空间分布情况。
2 反演原理与方法
2.1 基本原理
卫星传感器获取的大气顶层辐射能量是电磁波与地气系统相互耦合综合作用的结果。陆地上空气溶胶遥感利用可见光波段波长较短,对气溶胶散射比较敏感的特点实现反演。在可见光波段,卫星传感器接收到的辐射能量中,大气贡献主要来源于大气分子的吸收、瑞利散射以及气溶胶散射,如式(1)
| $\begin{aligned}{{\large{\rho}} _{\text{TOA}}}({\theta _{\rm{s}}},{\theta _{\rm{v}}},\varphi ) = & {\rho _{\rm{Aer}}}({\theta _{\rm{s}}},{\theta _{\rm{v}}},\varphi ) + {\rho _{\rm{Ray}}}({\theta _{\rm{s}}},{\theta _{\rm{v}}},\varphi ) + \\&\frac{{{\rho _{\rm{Sur}}}}}{{1 - {\rho _{\rm{Sur}}} \cdot S}}T({\theta _{\rm{s}}})T({\theta _{\rm{v}}})\end{aligned}$ | (1) |
式中,
卫星气溶胶遥感的实质就是从卫星信号中将地表反射噪声去除,获取大气气溶胶信息的过程。当地表反射率较小且较易确定时,
2.2 地表反射率确定
2.2.1 地表反射率数据集构建
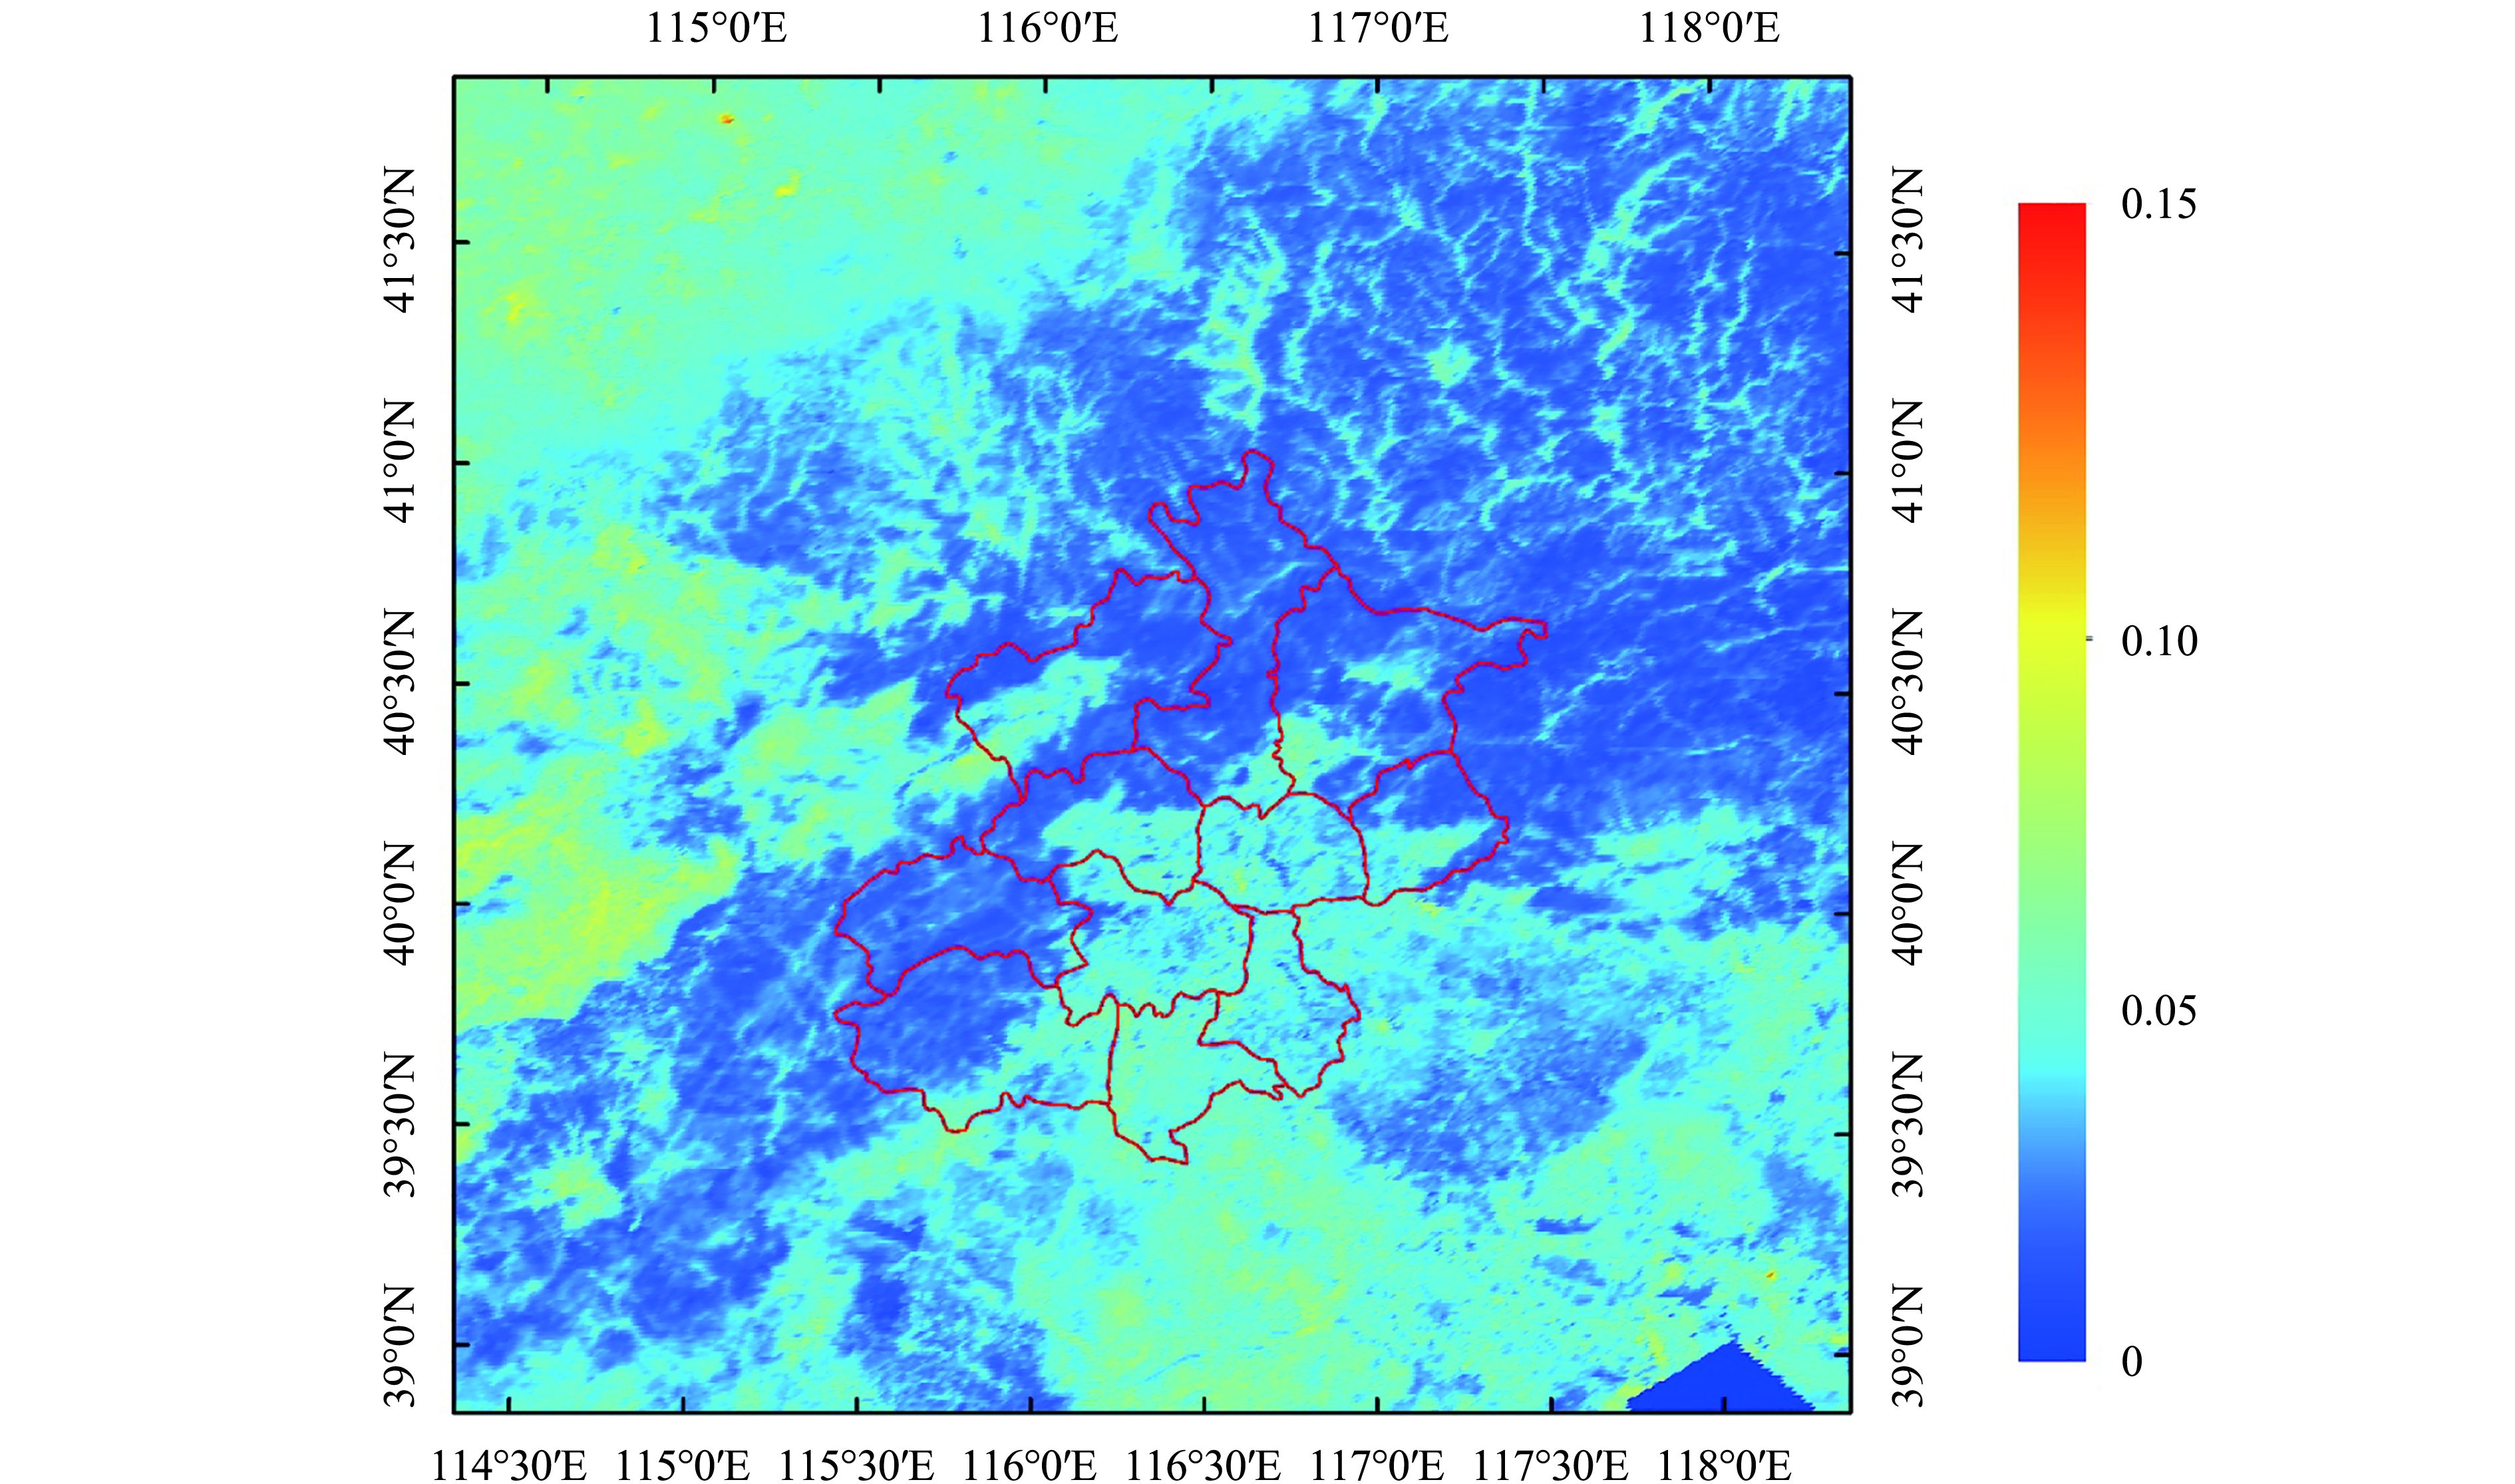
地表反射率的确定精度是气溶胶遥感反演中非常重要的影响因素(Li 等,2009)。Kaufman等人(1997)研究表明,地表反射率0.01的误差会造成AOD(~1.0)0.1的反演误差。本文利用2008年—2012年共5年间覆盖研究区的MOD09A1数据,通过数据合成构建地表信息数据集来确定地表信息。合成过程中首先对5年中每8天数据采用MRT技术获取一年每8天最小值反射率,然后将相邻4个8天的数据继续采用MRT合成获取最终500 m分辨率蓝光波段最小值地表反射率月产品数据集。图1为合成的5月地表反射率数据集。从图1中可以看出,构建的反射率数据集有效地消除了云的影响,通过该数据集可获取指定时空的地表反射率信息。此外,通过对长时间序列的MOD09A1数据分析发现,受自然或人为条件的影响(如冰雪消融、植被生长、落叶以及农作物收割等),地表反射率会发生较大幅度变化,在该时间段内获取精确的地表信息需进一步考虑。

2.2.2 光谱转换
由于不同卫星传感器光谱条件自身差异,导致具有相同反射特性的地物在不同传感器上表现为不同的反射特征。为提高气溶胶反演中地表反射率的确定精度,Sun等人(2010)利用植被指数建立了MODIS与HJ-1 A/B CCD数据之间的反射率转化统计模型,王中挺等人(2012)基于实测地物反射数据提出了将MODIS反射率修正到CCD相机的方法。本文气溶胶反演算法中,为消除传感器间光谱差异,从传感器光谱参数出发,利用ASTER(Baldridge 等,2009)波谱库中大量植被及土壤光谱数据,采用不同比例混合,获取不同植被覆盖度下混合地物光谱曲线,模拟建立MODIS与OLI蓝光波段光谱转化统计模型,回归分析结果如图2所示。从图2中可以看出,两者具有较强的相关性。构建的转换模型为
2.3 气溶胶模型确定
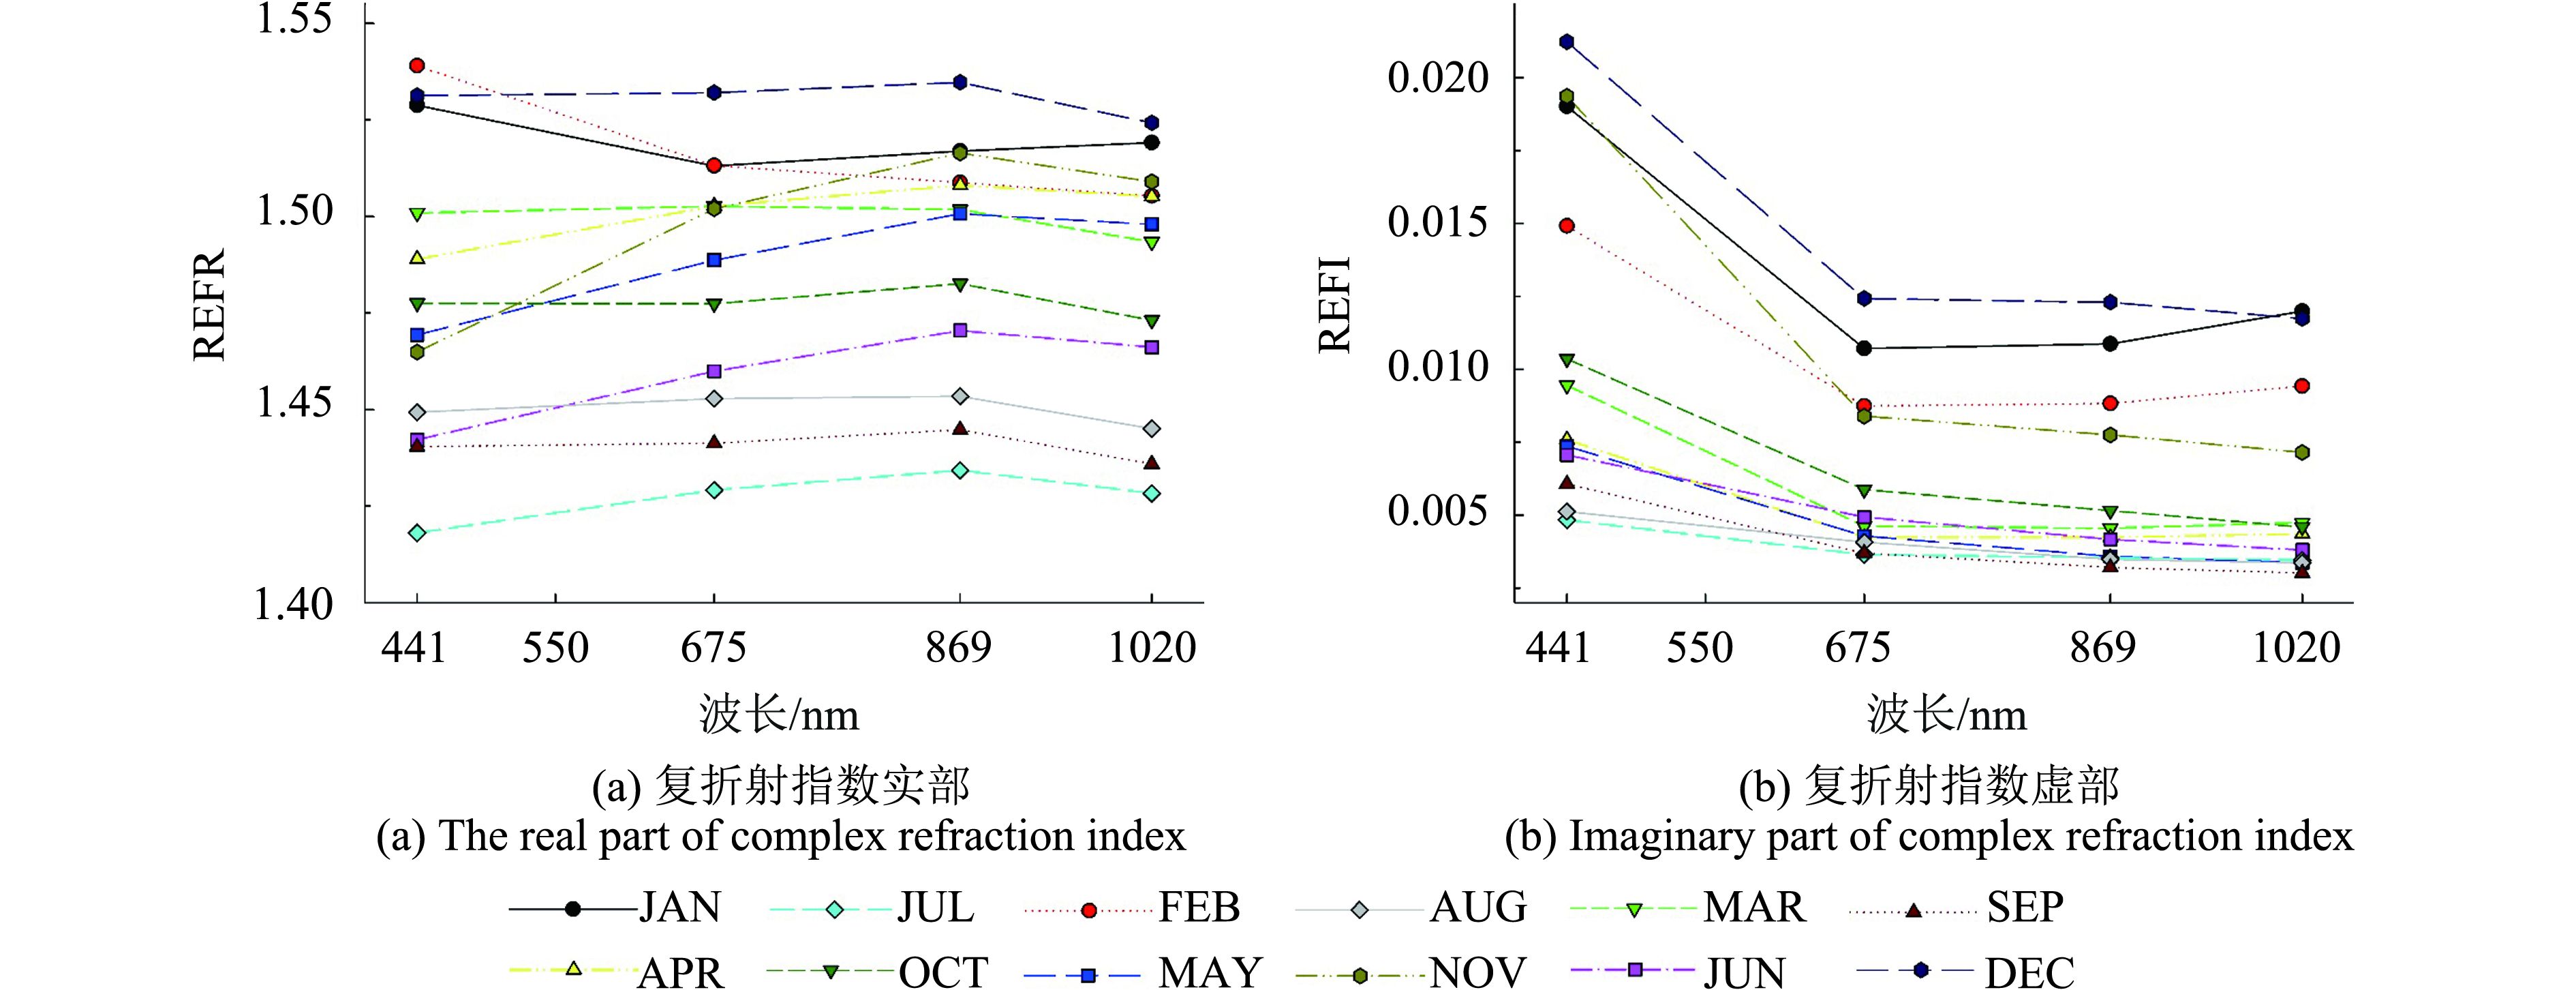
气溶胶遥感反演中另一个关键问题是气溶胶模型的合理假定。研究中利用AERONET发布的每月气溶胶光学参数平均值产品确定北京地区气溶胶光学物理参数,包括单次散射反照率SSA(Single Scattering Albedo)、不对称因子g及复折射指数RI(Refractive Index)。AERONET发布的参数产品为441 nm、675 nm、869 nm及1020 nm处值,本文利用441 nm、675 nm线性插值获取550 nm气溶胶参数信息。图3、4为参数每月统计结果。从图3、4中可以看出,各光学物理参数分季节分布较稳定。因此,在用6SV2.1辐射传输模型构建查找表时,对气溶胶光学参数分季节进行设置。为与6S中大气模式划分一致,研究中分夏季和冬季分别统计出550 nm处光学参数值,结果如表1所示,按照该参数设置构建了适用于不同季节的查找表文件。
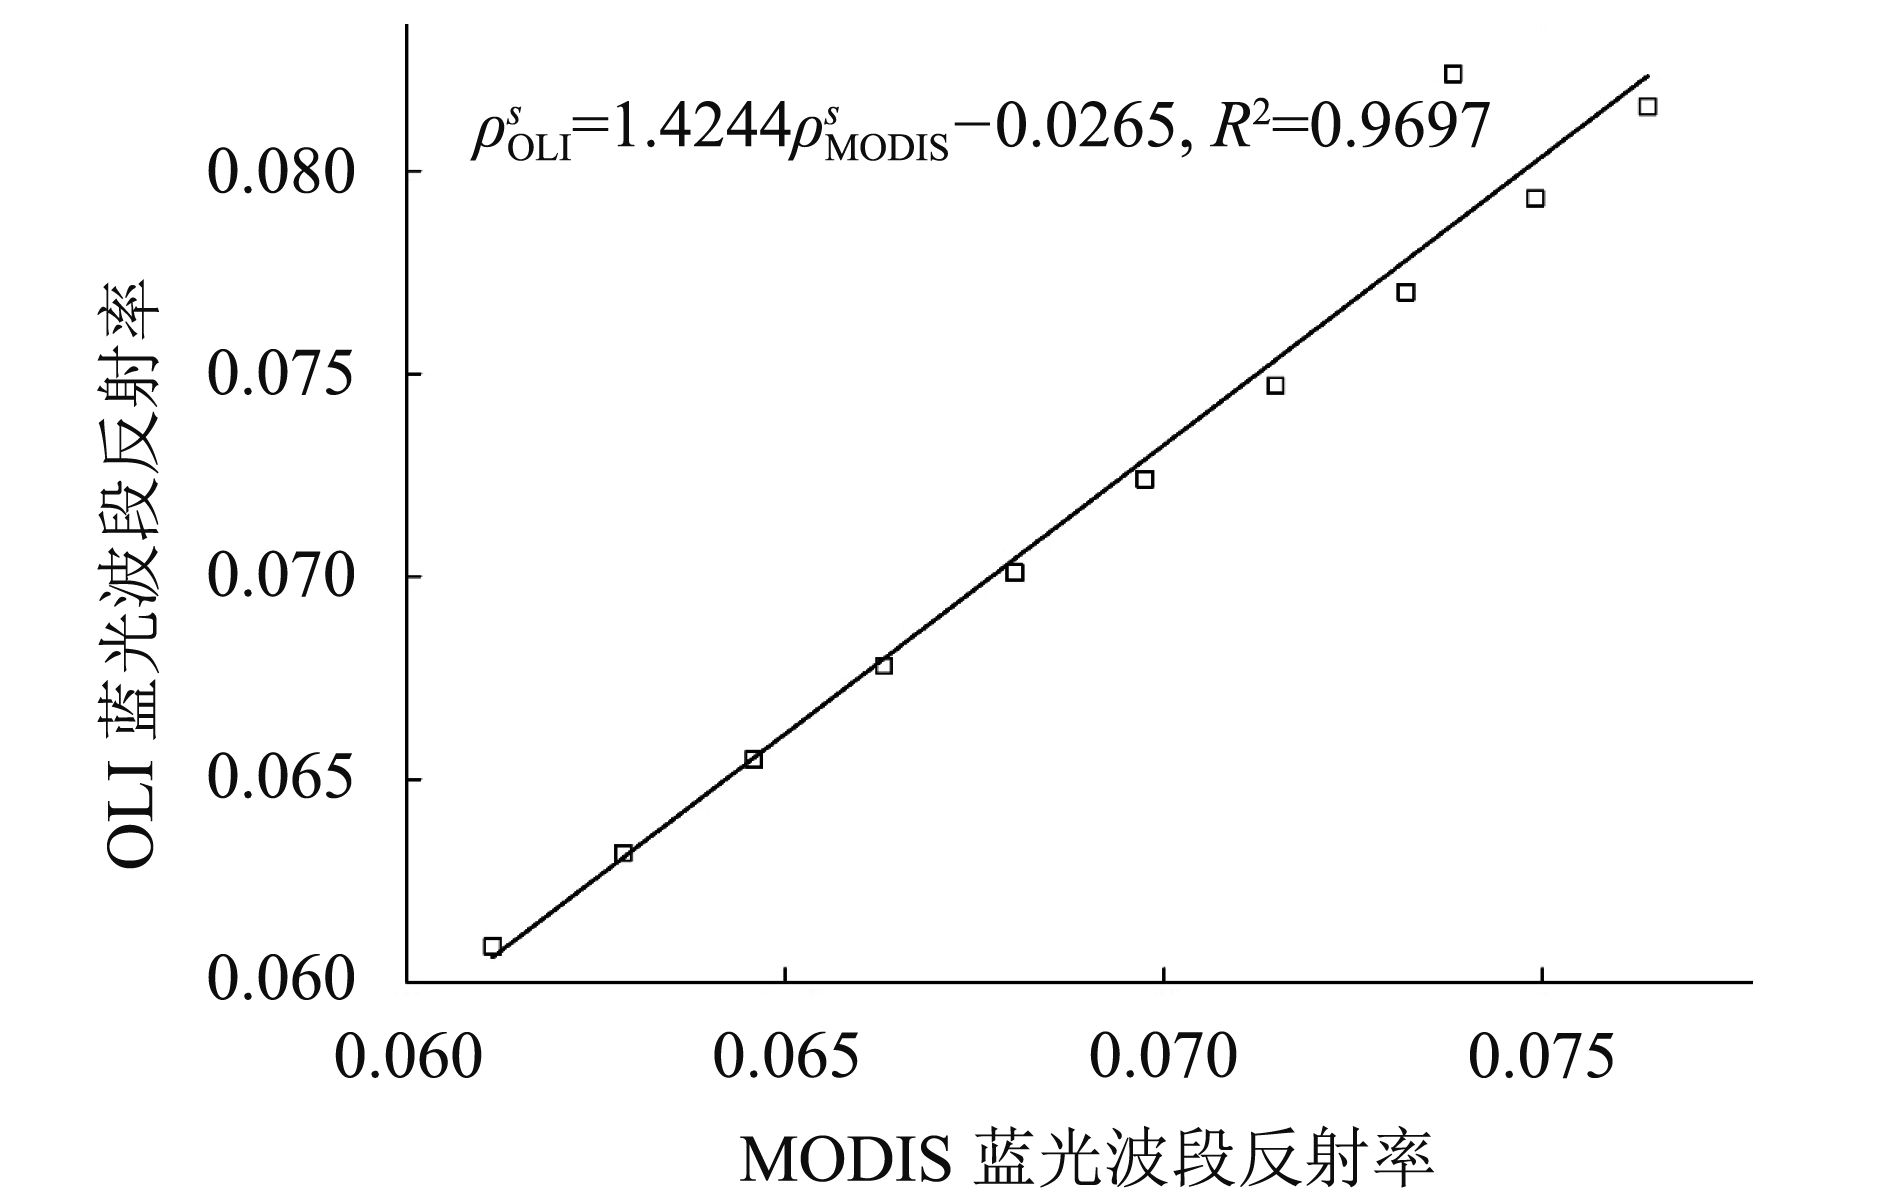
表 1 气溶胶反演中光学参数设置
Table 1 Optical properties setting in AOD retrieval
| 气溶胶模型 | 季节 | RI | SSA | g |
| 大陆型 | 夏季 | 1.443–0.0054i | 0.943 | 0.694 |
| 冬季 | 1.512–0.0084i | 0.879 | 0.664 |

2.4 Rayleigh散射校正
从卫星信号中去除地表信息贡献后,利用式(1)可获取包括大气气溶胶及大气分子在内的所有大气贡献。为从中提取气溶胶信息,需去除大气分子瑞利散射作用,利用下式(2)求解获取AOD
| ${\tau _{\rm{Aer}}} = {\tau _{\rm{Atm}}} - {\tau _{\rm{Ray}}}$ | (2) |
式中,τAer为气溶胶光学厚度,τAtm为大气总光学厚度,τRay为气体分子瑞利散射产生的光学厚度ROT(Rayleigh Optical Thickness)。
在海平面,ROT可估算波长λ的函数(Bodhaine 等,1999)
| ${\tau _{\rm{Ray}}}({\textit{λ}} ,z = 0) = - 0.00877 \cdot {{\textit{λ}} ^{ - 1.05}}$ | (3) |
当地物目标高度为Z(km)时,ROT可表示为高程(或大气压强)的函数(Bucholtz,1995),计算公式如下
| ${\tau _{\rm{Ray}}}({\textit{λ}} ,z = Z) = {\tau _{\rm{Ray}}}({\textit{λ}} ,z = 0)\exp ( - Z/8.5)$ | (4) |
式中,8.5 km为大气标准高度。
研究中利用MODIS地理定位数据(MOD03)中高程信息估算ROT值,去除传感器信息中大气分子瑞利散射贡献项,获取大气气溶胶信息。
3 气溶胶反演
3.1 数据选择及处理
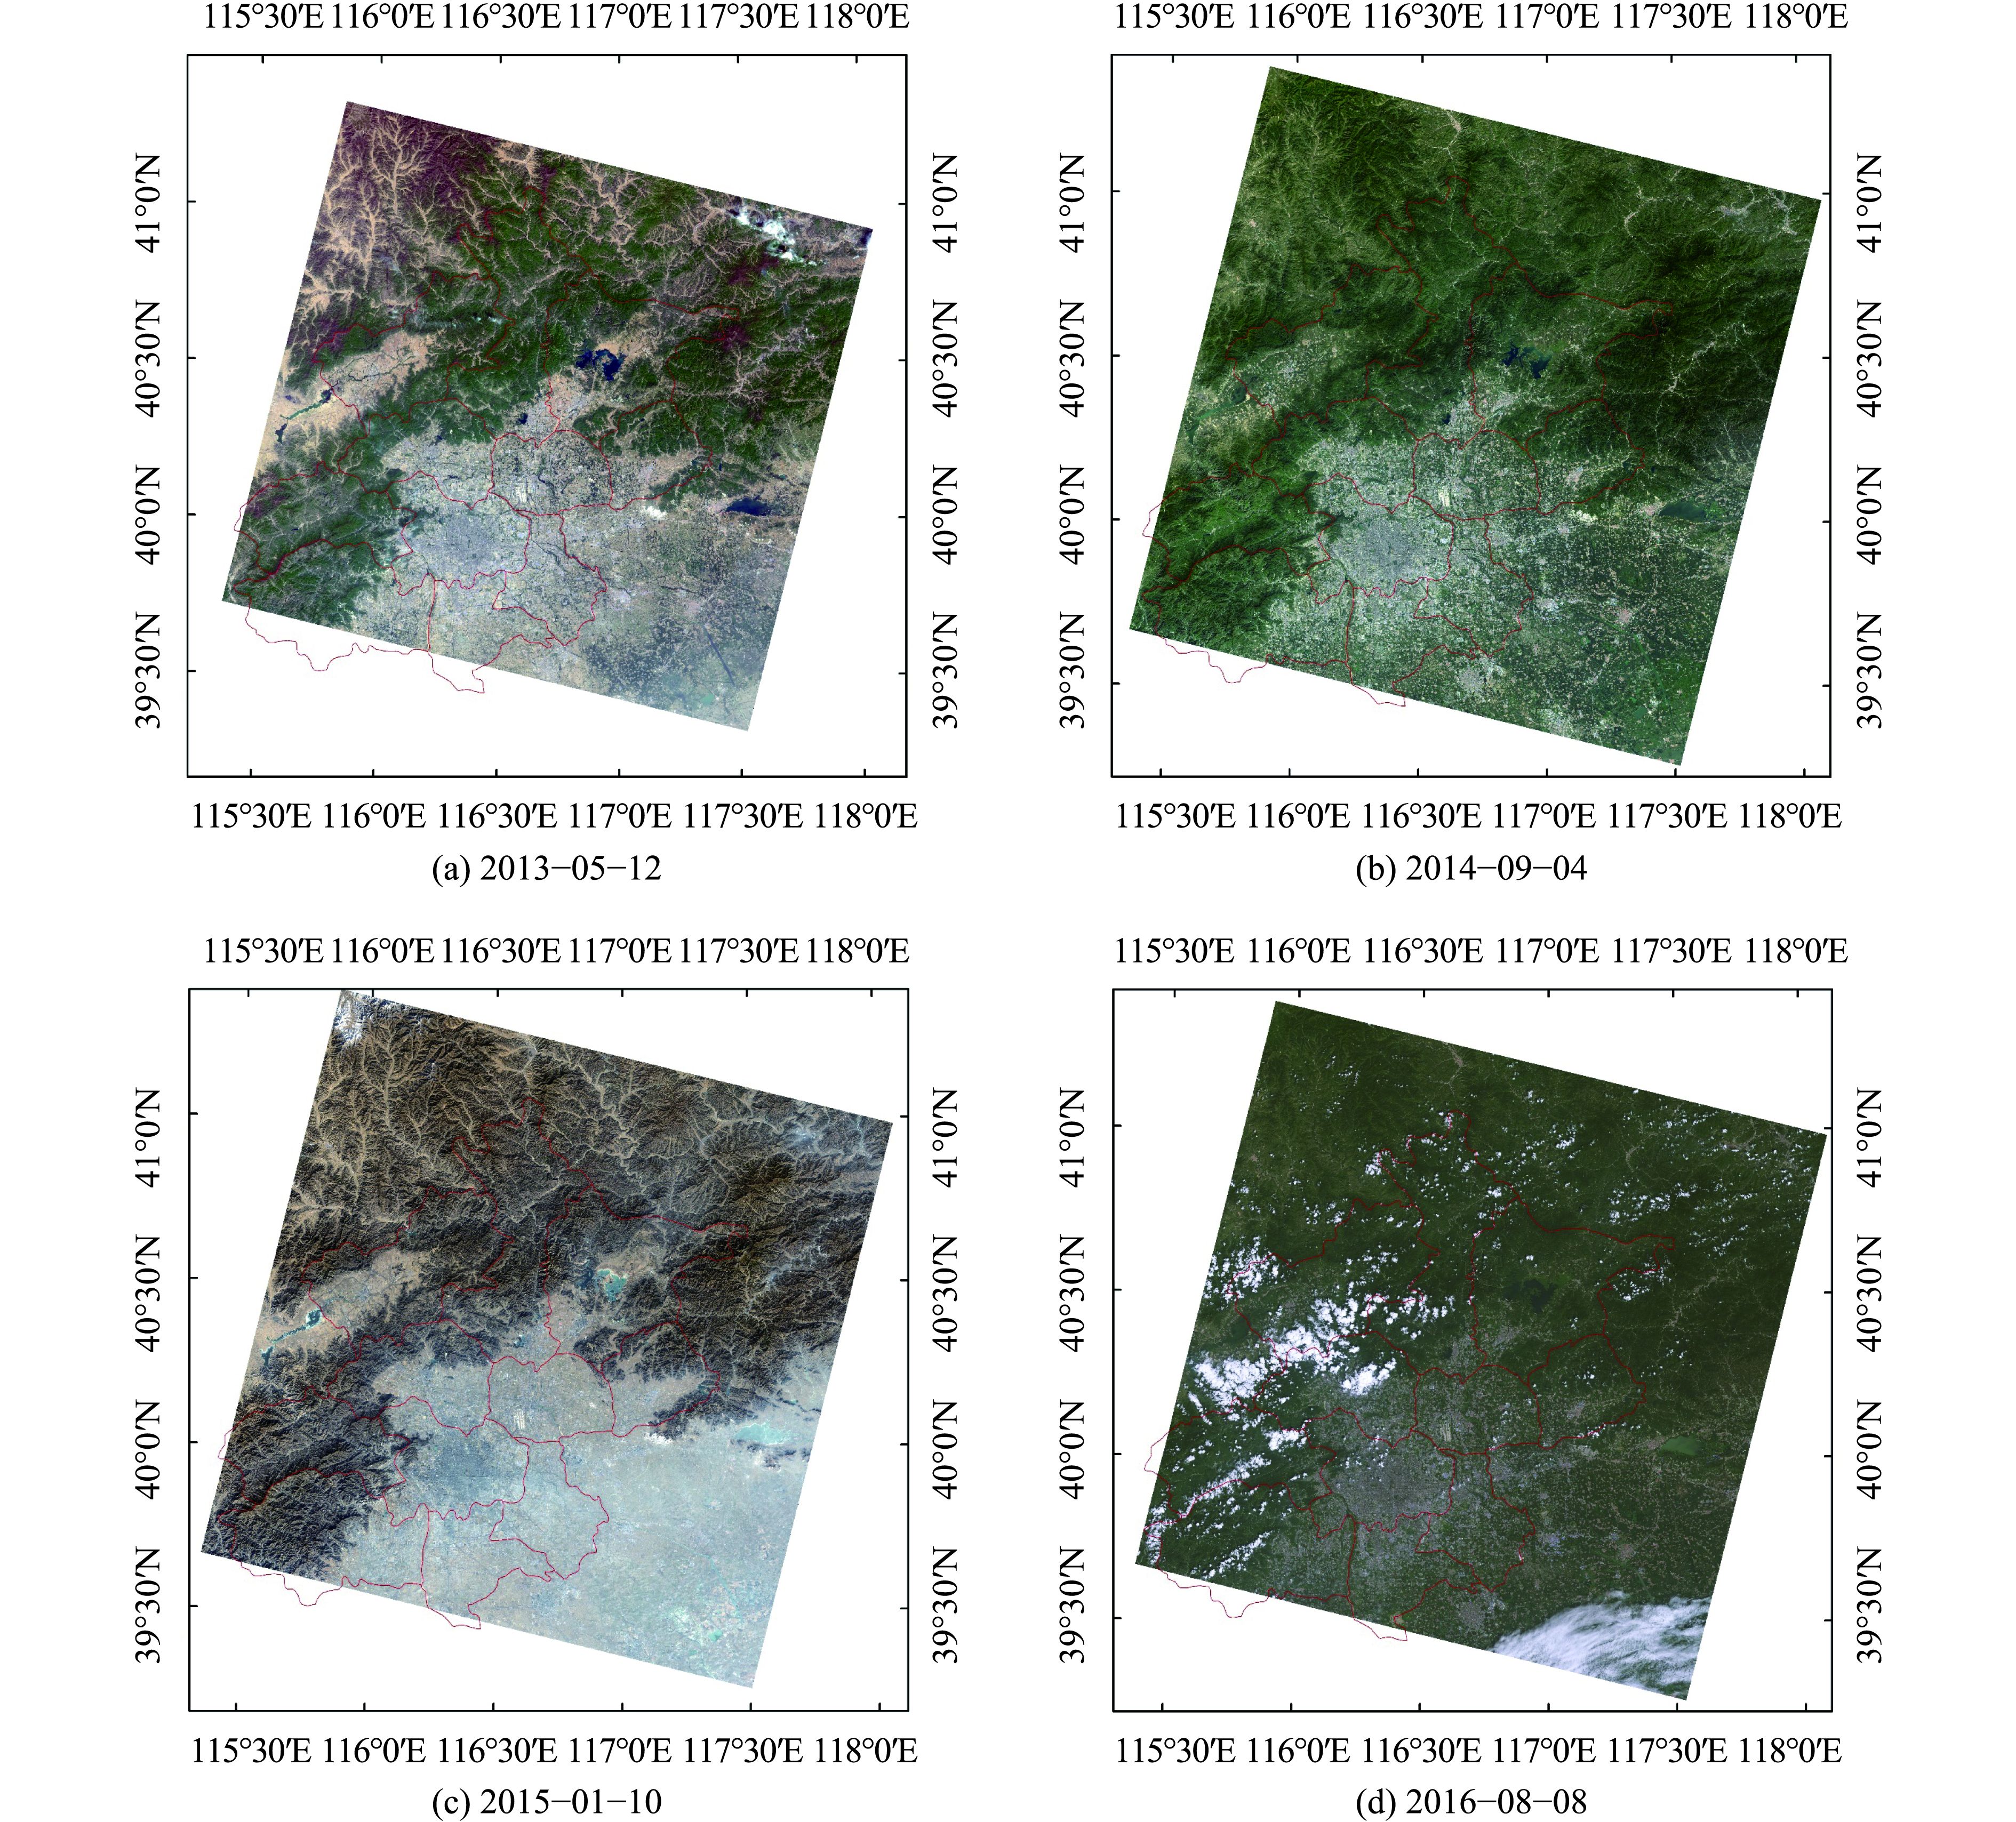
Landsat 8陆地卫星于2013年2月11日发射,是由美国NASA及USGS为继续“陆地卫星数据连续性任务”的后续卫星之一,搭载有两个传感器:陆地成像仪OLI(Operational Land Imager)及热红外传感器TIRS(Thermal Infrared Sensor)。OLI传感器具有从可见光到短波红外的9个波段,幅宽为185 km,详细参数见表2。研究中利用从OLI数据有记录以来的4年内(2013年—2016年)云覆盖较小的北京地区系列数据进行AOD反演实验,共计36景,采用的数据集详细信息如表3所示。图5为2013年5月12日、2014年9月4日、2015年1月10日以及2016年8月8日影像真彩色合成图(R,G,B=4,3,2)。
表 2 Landsat 8 OLI传感器波段参数信息
Table 2 Landsat 8 OLI bands with wavelength, ground sampling distance (GSD), signal-to-noise ratio (SNR); at reference radiance L=40 W·m–2·sr–1·μm–1
| 波段索引 | 波段名 | 波长/nm | GSD/m | SNR |
| 1 | Coastal/Aerosol | 433—453 | 30 | 232 |
| 2 | Blue | 450—515 | 30 | 355 |
| 3 | Green | 525—600 | 30 | 296 |
| 4 | Red | 630—680 | 30 | 222 |
| 5 | NIR | 845—885 | 30 | 199 |
| 6 | SWIR 1 | 1560—1660 | 30 | 261 |
| 7 | SWIR 2 | 2100—2300 | 30 | 326 |
| 8 | PAN | 500—680 | 15 | 146 |
| 9 | CIRRUS | 1360—1390 | 30 | 162 |
表 3 气溶胶反演采用的Landsat 8 OLI数据列表
Table 3 A list of Landsat 8 OLI images used for AOD retrieval
| 成像日期 | 太阳方位角/(°) | 太阳高度角/(°) | 云量/% | 成像日期 | 太阳方位角/(°) | 太阳高度角/(°) | 云量/% | |
| 2013-05-12 | 138.6 | 62.8 | 0.17 | 2015-04-16 | 143.9 | 54.9 | 0.25 | |
| 2013-06-13 | 130.1 | 66.4 | 12.82 | 2015-05-18 | 136.0 | 63.4 | 3.19 | |
| 2013-07-31 | 134.3 | 61.6 | 16.82 | 2015-07-05 | 128.0 | 65.0 | 21.76 | |
| 2013-09-01 | 146.2 | 53.7 | 2.21 | 2015-08-22 | 141.5 | 56.2 | 24.99 | |
| 2013-10-03 | 156.8 | 43.3 | 6.30 | 2015-09-07 | 147.6 | 51.6 | 2.74 | |
| 2013-11-04 | 162.3 | 32.6 | 0.71 | 2015-09-23 | 153.2 | 46.5 | 19.84 | |
| 2013-11-20 | 162.9 | 28.3 | 8.26 | 2015-10-09 | 157.6 | 41.0 | 26.05 | |
| 2013-12-06 | 162.3 | 25.3 | 20.73 | 2015-12-28 | 159.7 | 23.6 | 50.85 | |
| 2014-04-13 | 160.1 | 54.0 | 16.01 | 2016-02-14 | 152.7 | 32.1 | 14.72 | |
| 2014-04-29 | 141.2 | 59.2 | 0.70 | 2016-03-01 | 150.6 | 37.7 | 5.01 | |
| 2014-05-15 | 136.7 | 63.1 | 0.04 | 2016-04-18 | 143.6 | 55.7 | 13.29 | |
| 2014-08-19 | 140.3 | 57.1 | 2.52 | 2016-05-04 | 139.9 | 60.5 | 5.78 | |
| 2014-09-04 | 146.6 | 52.7 | 0.22 | 2016-05-20 | 135.4 | 63.9 | 7.98 | |
| 2014-09-20 | 152.3 | 47.6 | 34.57 | 2016-06-05 | 131.1 | 65.7 | 34.82 | |
| 2014-10-06 | 156.9 | 42.2 | 1.06 | 2016-06-21 | 128.3 | 65.9 | 30.25 | |
| 2015-01-10 | 157.8 | 24.6 | 19.62 | 2016-07-07 | 128.5 | 64.7 | 47.26 | |
| 2015-02-11 | 153.1 | 31.3 | 1.61 | 2016-08-08 | 136.6 | 59.4 | 8.25 | |
| 2015-03-15 | 148.8 | 42.9 | 2.40 | 2016-09-09 | 148.8 | 50.8 | 13.89 |

3.3 精度验证
3.3.1 AERONET站点对比
为验证算法反演精度,利用AERONET数据对AOD反演结果进行对比分析。AERONET是由美国NASA及法国CNRS共同建立的一个全球地基气溶胶观测网络,可提供站点周围长时间序列的AOD时空分布信息,其观测精度为±0.01(Holben 等,2001)。为降低时间尺度的影响,将卫星过境前后半小时内地基观测结果进行平均,利用平均值与卫星反演结果进行比较。由于算法反演获取的为550 nm处AOD值,为统一比较,根据Ångström指数公式(Ångström,1964),利用440 nm、670 nm处地基观测数据计算获取550 nm处AOD值,公式如下
| $\tau ({\textit{λ}}) = \beta \cdot {{\textit{λ}} ^\alpha }$ | (5) |
式中,τ(λ)为波长λ处AOD值,α为Ångström指数,β为大气浑浊度系数。
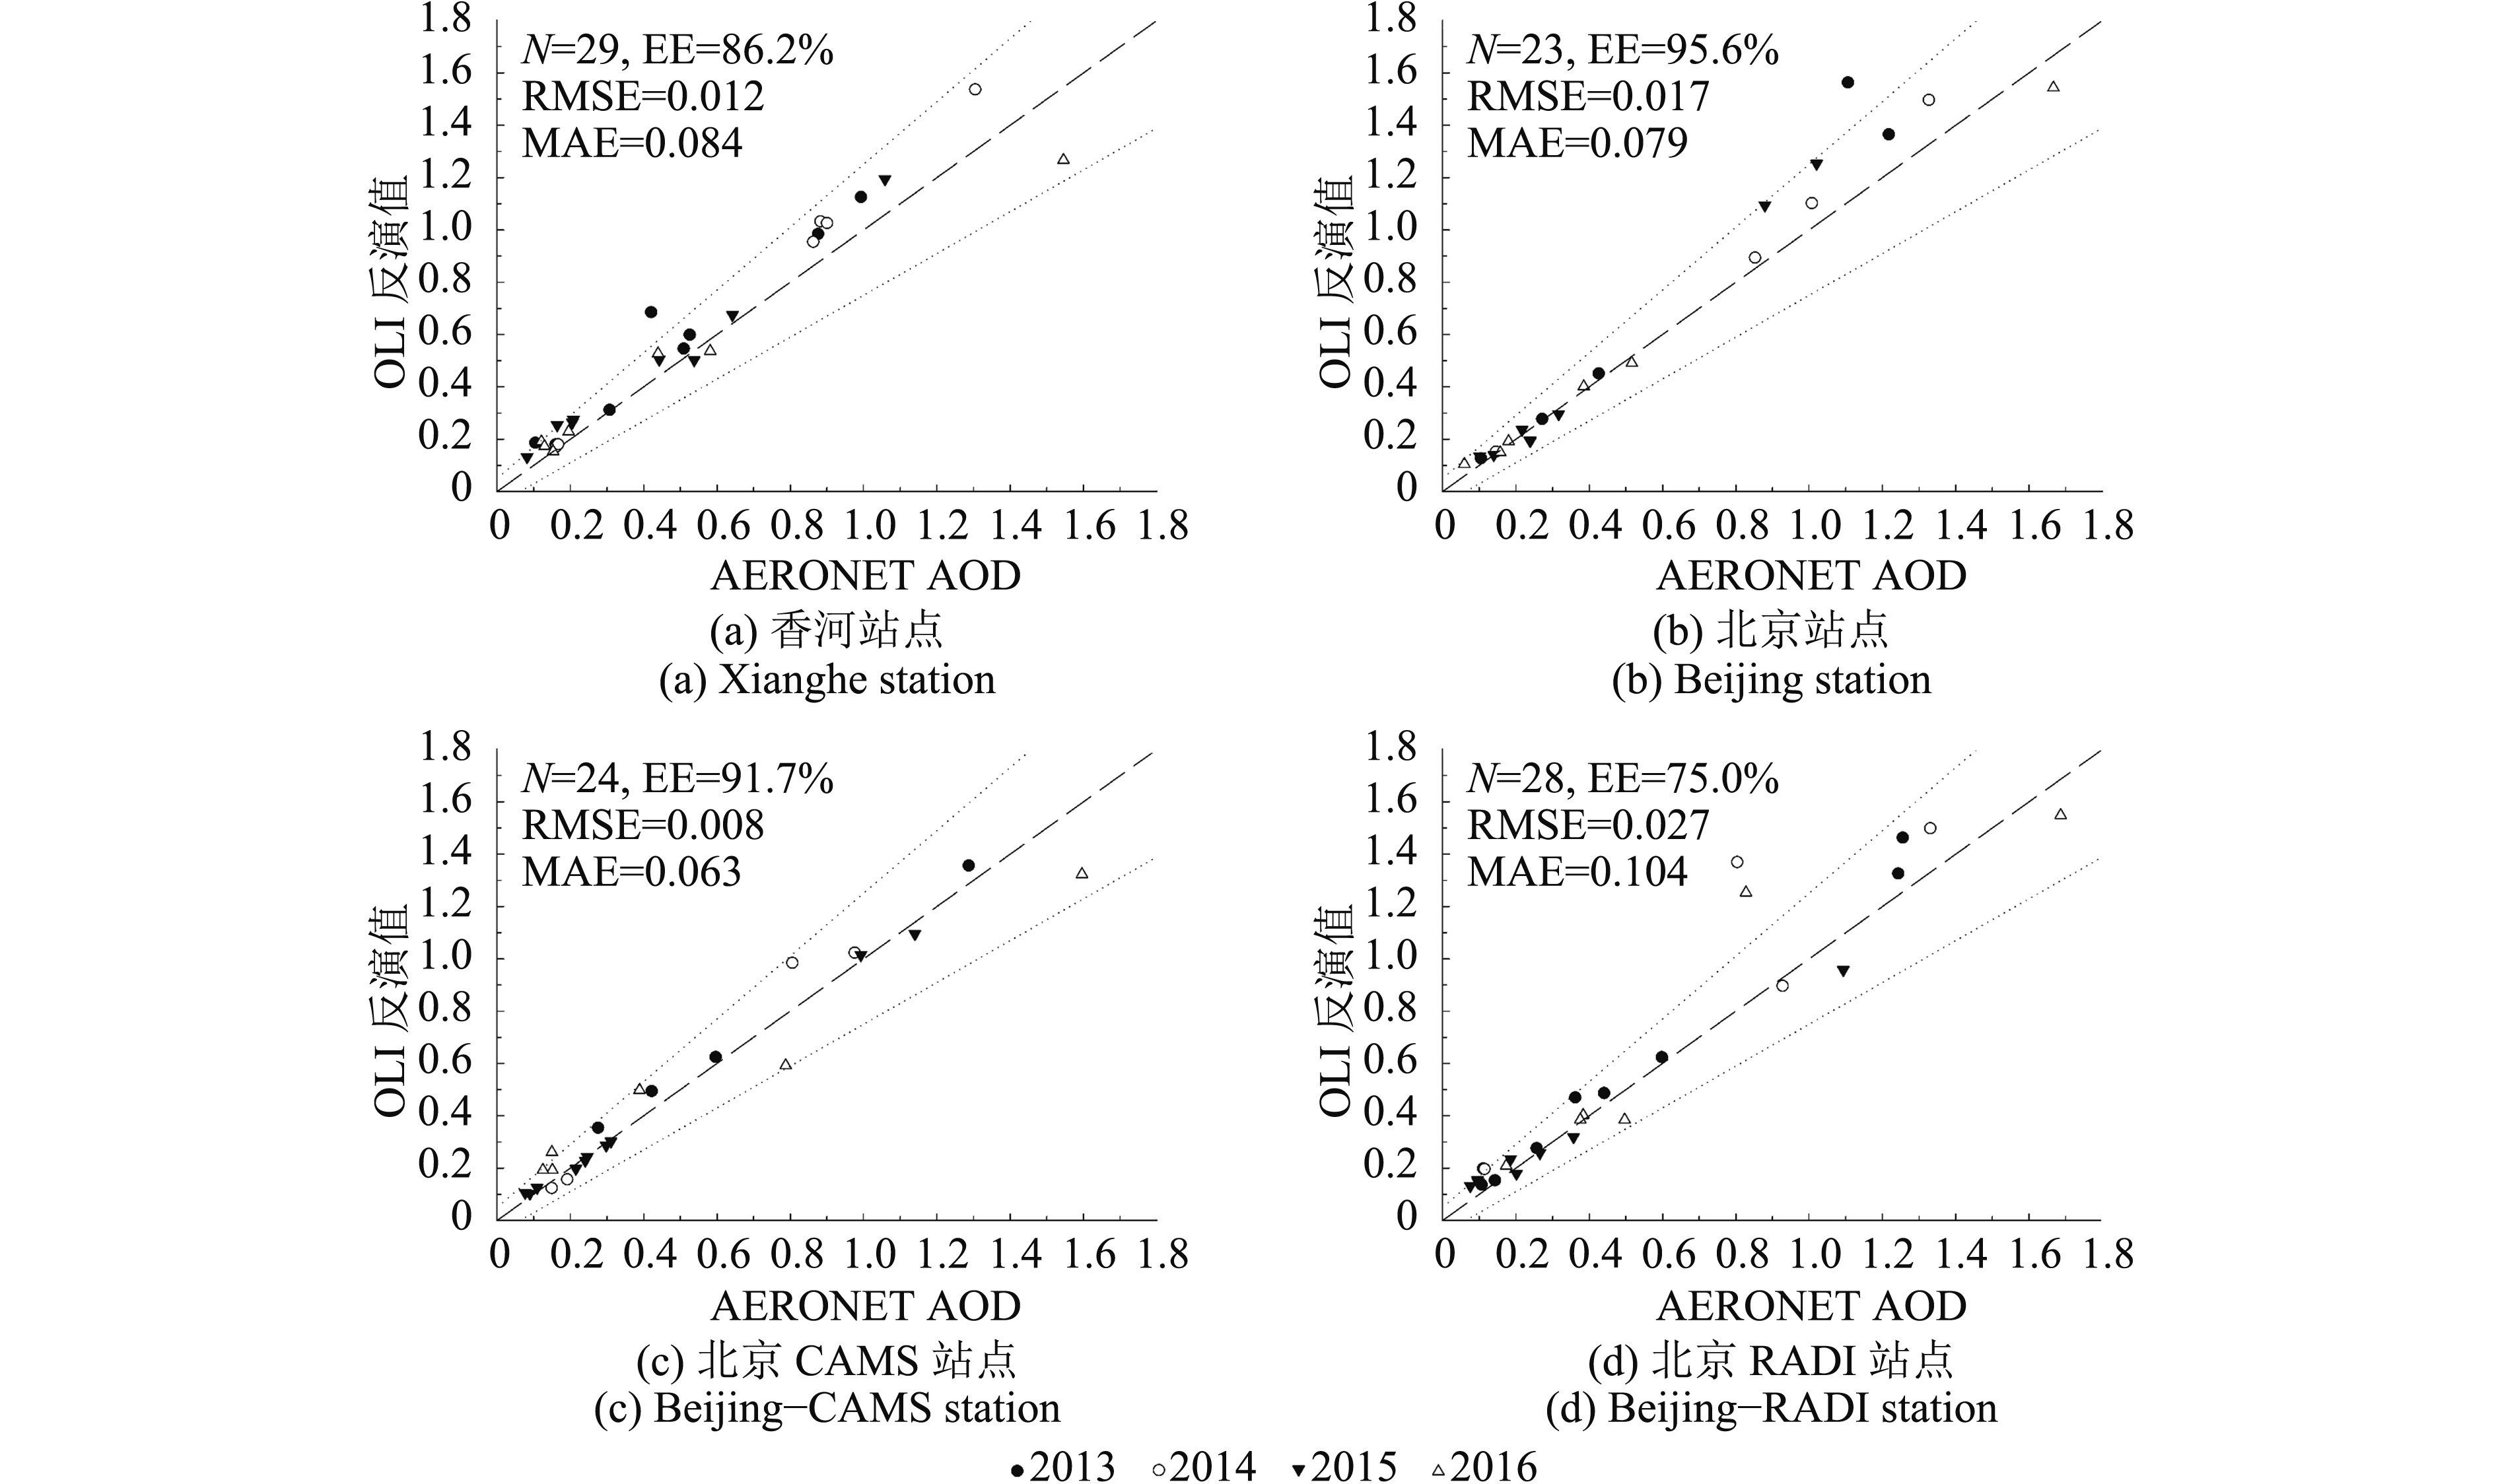
选取北京地区4个AERONET站点(北京站、香河站、北京CAMS及北京RADI站)对反演结果进行验证分析。利用统计指标均方根误差RMSE(Root Mean Square Error)、平均绝对误差MAE(Mean Absolute Error)及NASA预期误差EE(Expected Error)进行分析,各指标计算公式为
| $\begin{aligned}& {{R}} = \frac{{\sum\limits_{i = 1}^n {({x_i} - \bar x)({y_i} - \bar y)} }}{{\sqrt {\sum\limits_{i = 1}^n {{{({x_i} - \bar x)}^2}} \sum\limits_{i = 1}^n {{{({y_i} - \bar y)}^2}} } }}\\& {\rm{RMSE}} = \sqrt {\frac{1}{n}\sum\limits_{i = 1}^n {{{({x_i} - {y_i})}^2}} } ,{\rm{MAE}} = \frac{1}{n}\sum\limits_{i = 1}^n {\left| {{x_i} - {y_i}} \right|} \\& {\rm{EE}} = \pm (0.05 + 0.15{x_i})\end{aligned}$ | (6) |
式中,xi为地基观测AOD值,yi为反演值,
图7为各站点反演获取的AOD与地基观测值对比结果,可以看出,两者具有较好的一致性,各站点反演值总体略大于观测值。RADI站点结果精度相对其他3个站点精度较低,这可能与其所处的地表类型有关(周围主要是道路及住宅区)。由于各站点周围大多为建筑用地(香河站点除外),地物类型年际变化较少。从AOD反演精度的年际变化结果来看,各站点反演精度较一致,没有明显差异。
3.3.2 MOD04 AOD产品对比
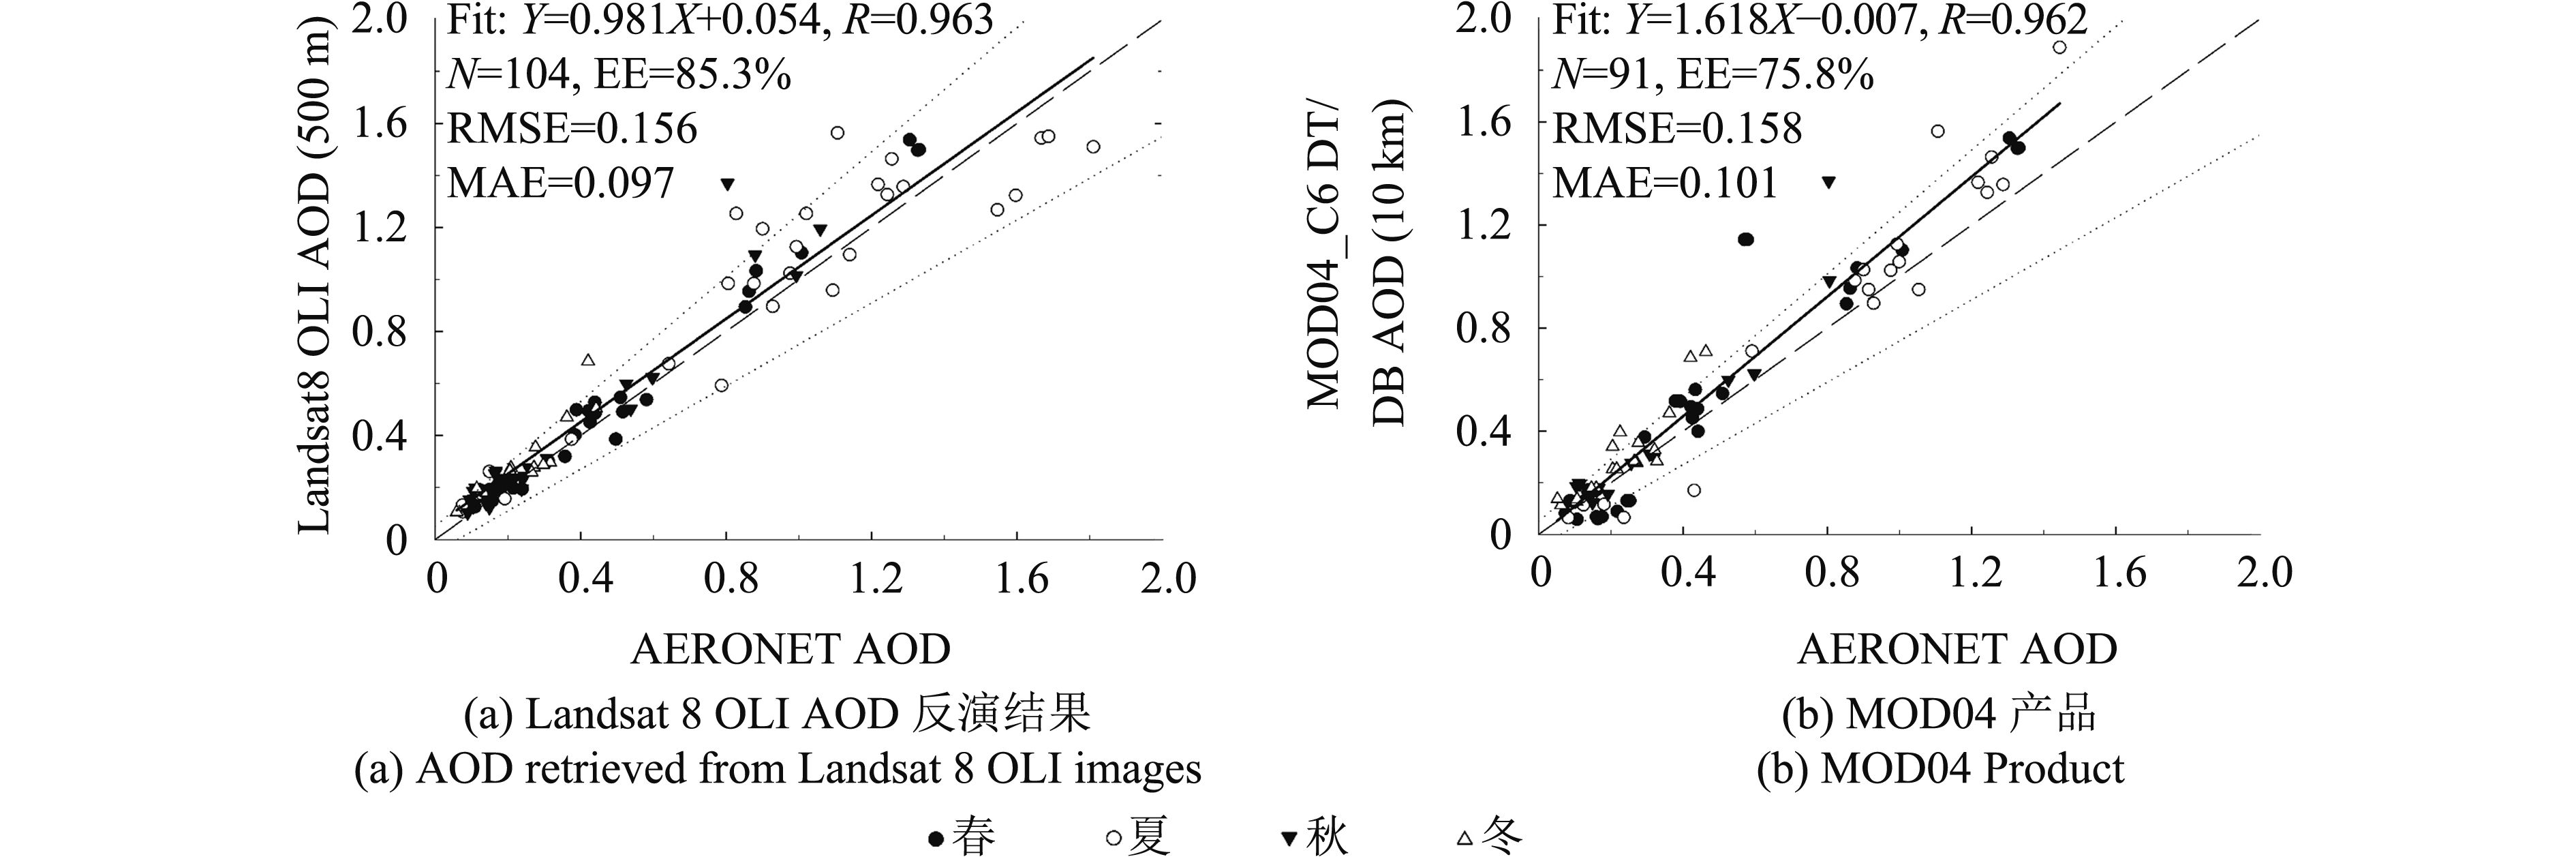
同时将反演结果与MODIS/Terra C6 DT/DB“融合”反演算法生产的空间分辨率为10 km的气溶胶产品进行交叉对比验证。采用相关系数R(correlation coefficient)、RMSE、MAE以及EE统计指标分析,结果如图8所示。从图8中可以看出,两算法反演结果与地基观测值均具有较强的相关性,本文算法的反演结果(图8(a))统计指标分别为R=0.963,RMSE=0.156,MAE=0.097,EE=85.3%,均稍优于MOD04(图8(b))的结果(R=0.962,RMSE=0.158,MAE=0.101,EE=75.8%),并且有效对比点个数(N=104)也高于MOD04算法(N=91)。反演结果及MOD04产品中,夏、秋季节的精度及有效对比点个数要明显优于春、冬季。这与夏、秋地表反射率较低,确定精度相对较高有关。并且,通过地表反射率变化对AOD反演精度的影响分析可知,当反射率较小时,其变化对AOD的影响也相对较小。图8中误差较大的点对,大多发生在下垫面类型发生变化的冬季以及季节交替月份。
4 误差分析
气溶胶反演精度主要由地表反射率精度及气溶胶模型引起。本文气溶胶反演算法的前提是:在一定时间区间内,地表反射率无变化或变化较小。但由于地表覆盖类型变化,以及植被生长等因素影响会带来一定误差。另外,在构建查找表时,不同气溶胶参数设置也会得到不同的模拟结果,对AOD反演产生影响。
4.1 地表反射率变化误差
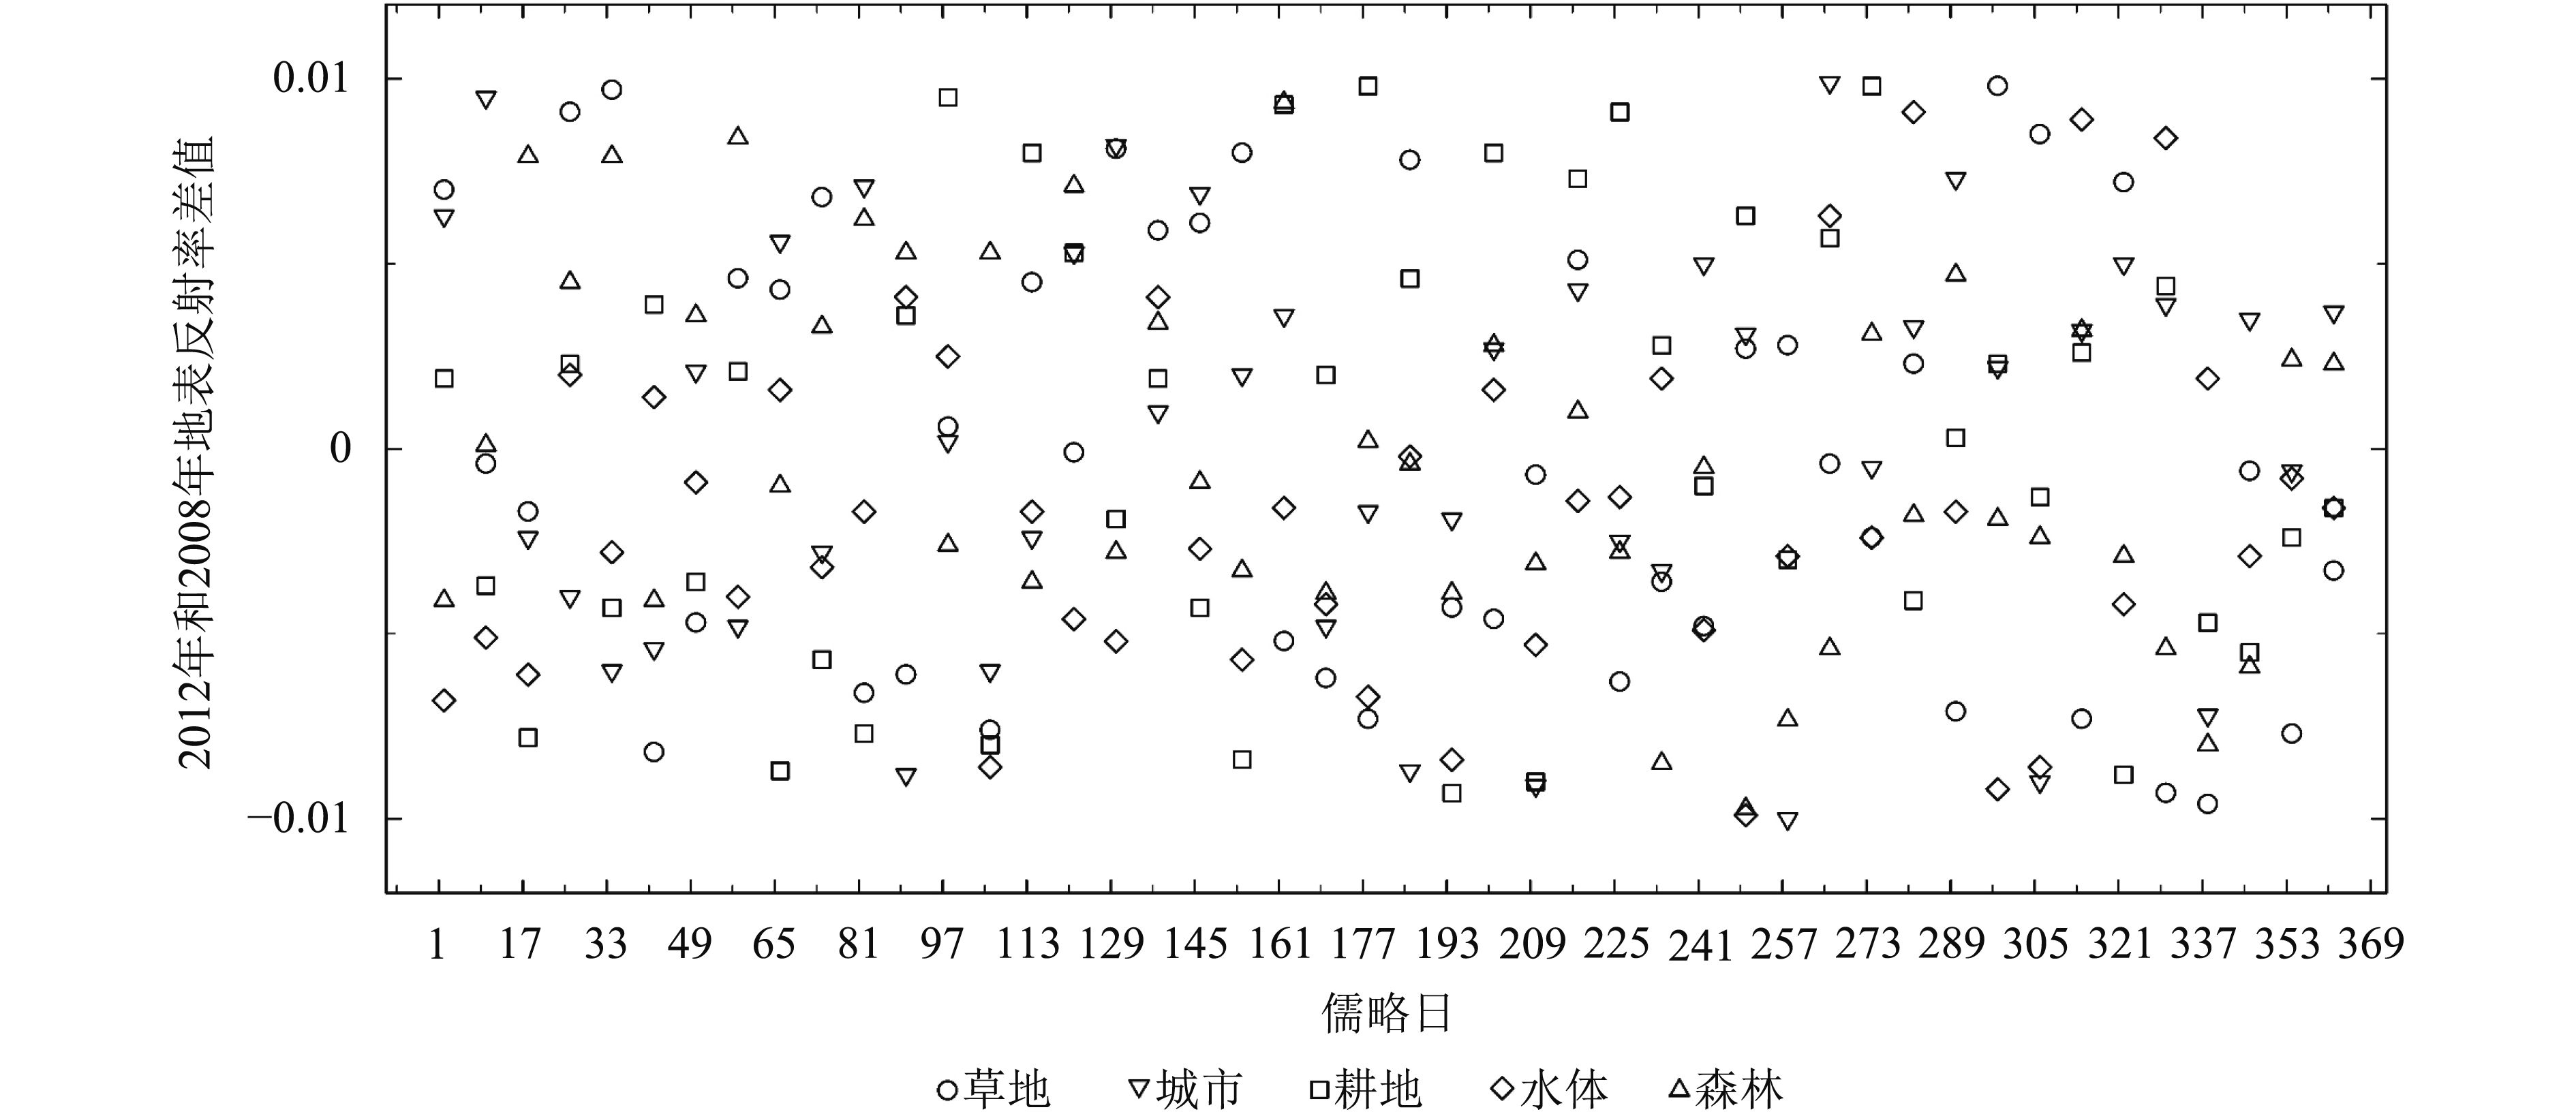
Li等人(2012)通过统计2007年和2008年两年MOD09数据发现,在短时期内,若无异常天气影响,蓝光波段的地表反射率变化小于0.02。为了分析地表反射率在短时期内变化情况,本文利用长时间序列蓝光波段的地表反射率数据,统计研究区草地、水体、耕地、城市建筑用地及森林5种典型下垫面地表反射率的变化情况,统计方式为将图9中A—E 5个区域所有像元反射率进行平均。从图9中可以看出,不同地物类型合成的月反射率变化较稳定,最大绝对差值在0.01以内,平均值最大绝对偏差小于0.005。草地、森林及耕地下垫面在植被生长、落叶以及农作物收割月份反射率会发生较大幅度的变化,呈现出“冬季高,夏季低”的特点。为分析本文采取的MRT合成带来的误差,利用2008年、2012年两年每8天MOD09A1数据,将两年对应天数反射值相减得到5个区域平均值变化情况(图10),可以看出,两年间地表反射率的变化在±0.01之间。
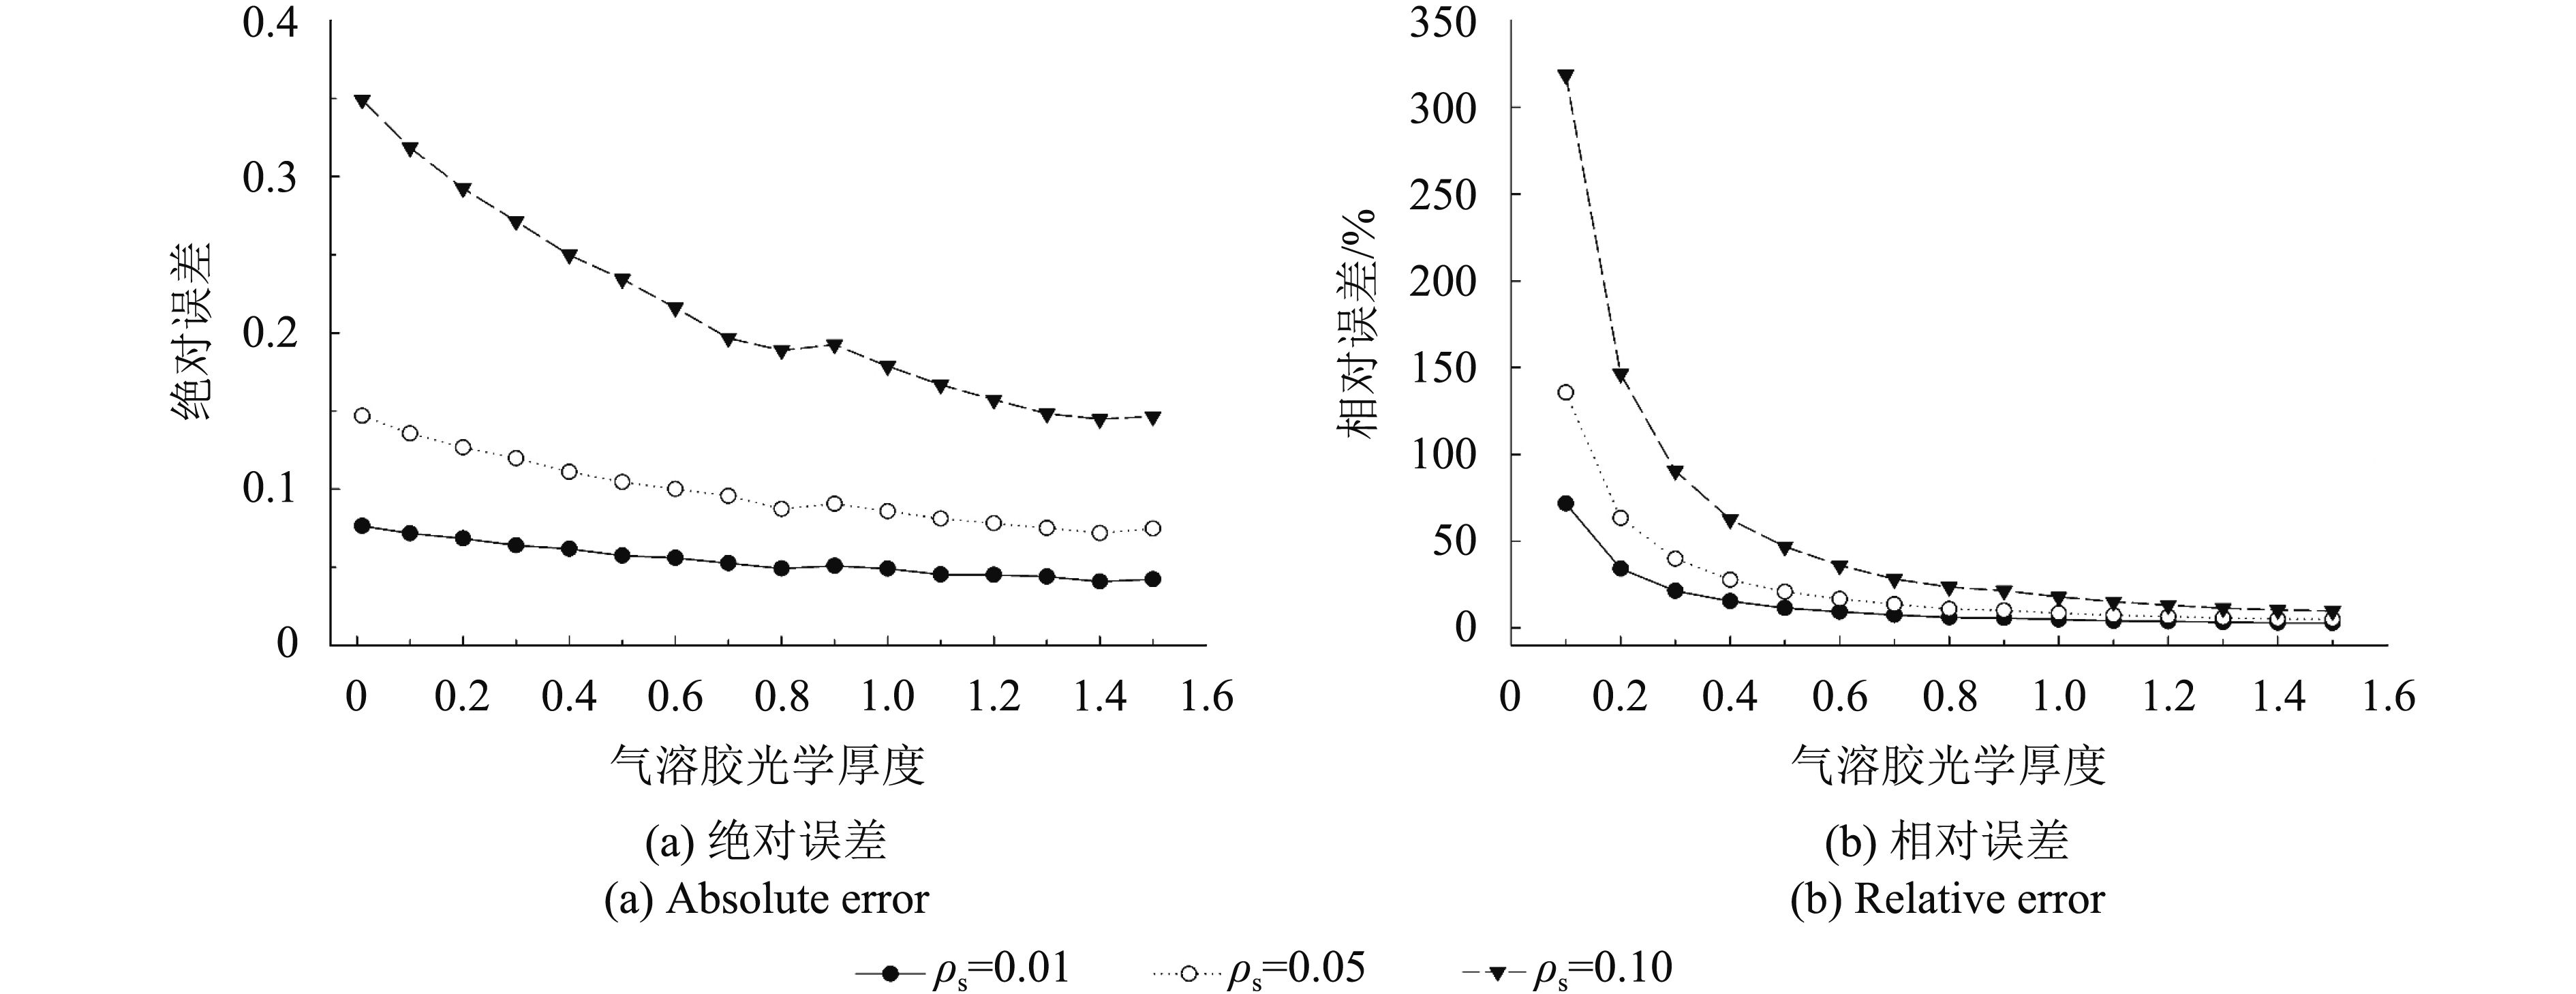
研究表明(Vermote和Kotchenova,2008),MODIS蓝光波段地表反射率产品误差在±(0.005+5%)范围内。本文利用6S模拟不同反射率值下该误差对AOD反演的影响,结果如图11。从图11中可以看出,随着反射率的增加,其误差对AOD的影响也越大。地表反射率产品自身的误差对AOD反演的绝误差大部分小于0.20,相对误差随AOD变化较大。同时,反演误差会随着AOD增大而减小,相对误差可控制在50%以内。根据对北京地区蓝光波段地表反射变化分析,其平均值约0.03,年际间变化在±0.01之间,由此带来的AOD反演的绝对误差可以控制在0.15之内。

4.2 气溶胶SSA参数确定误差
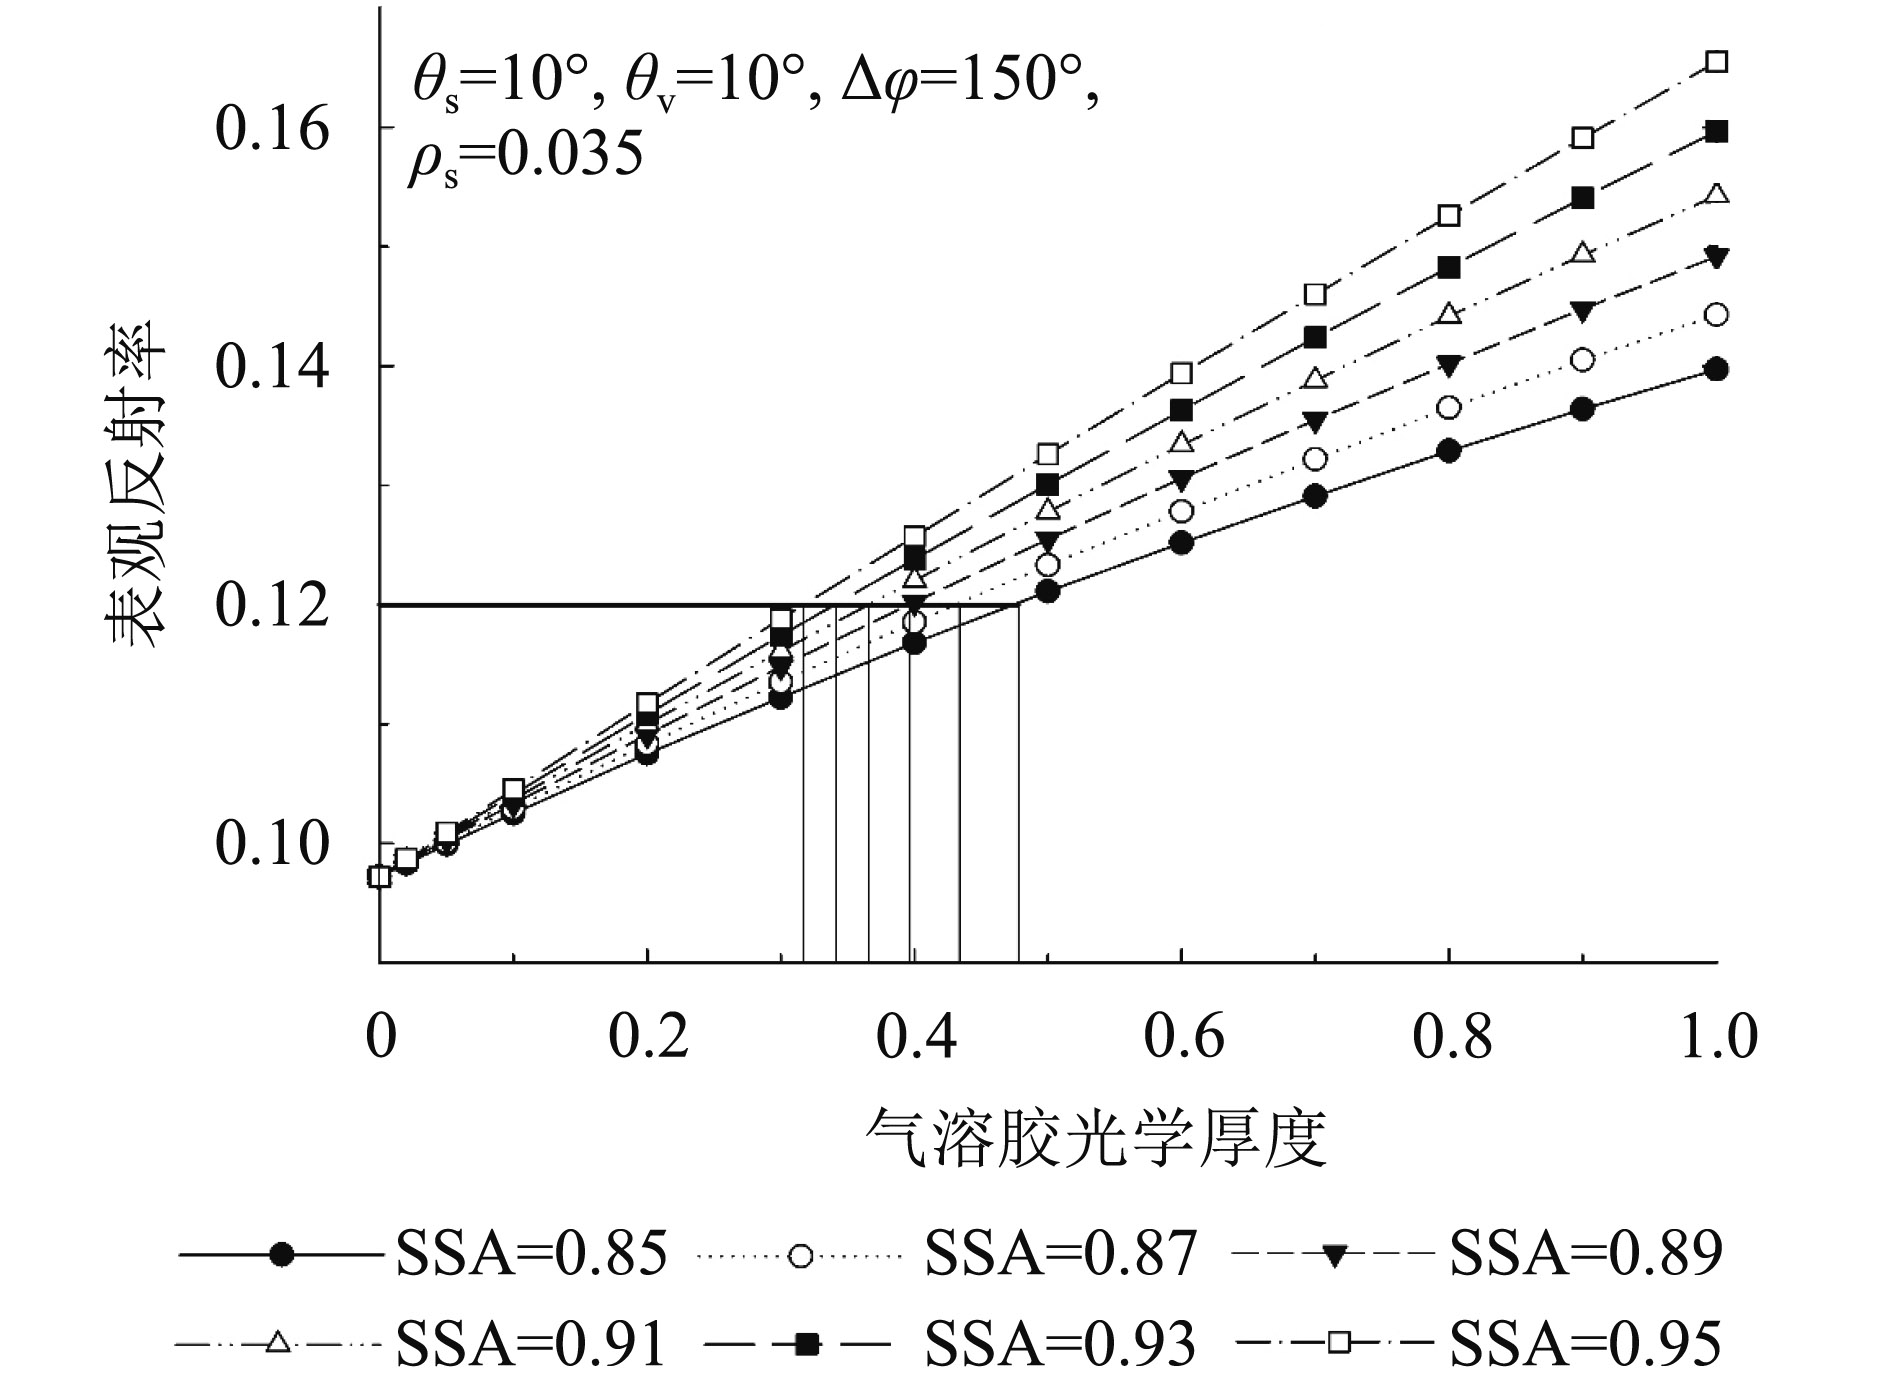
电磁波在大气传播过程中受气溶胶粒子吸收散射的作用存在较大差异,导致相同地表和观测条件下到达传感器的能量不同。这些差异体现在气溶胶光学物理参数上,因此其参数的确定精度是引起气溶胶反演误差的另一个重要因素。图12为利用6S模拟不同SSA参数下,蓝光波段表观反射率随AOD的变化情况。从图12中可以看出,随SSA的增大,卫星表观反射率值随之增大。当表观反射率为0.12时,在构建气溶胶查找表时由0.02的SSA设置不同带来的AOD反演差异为~0.03。
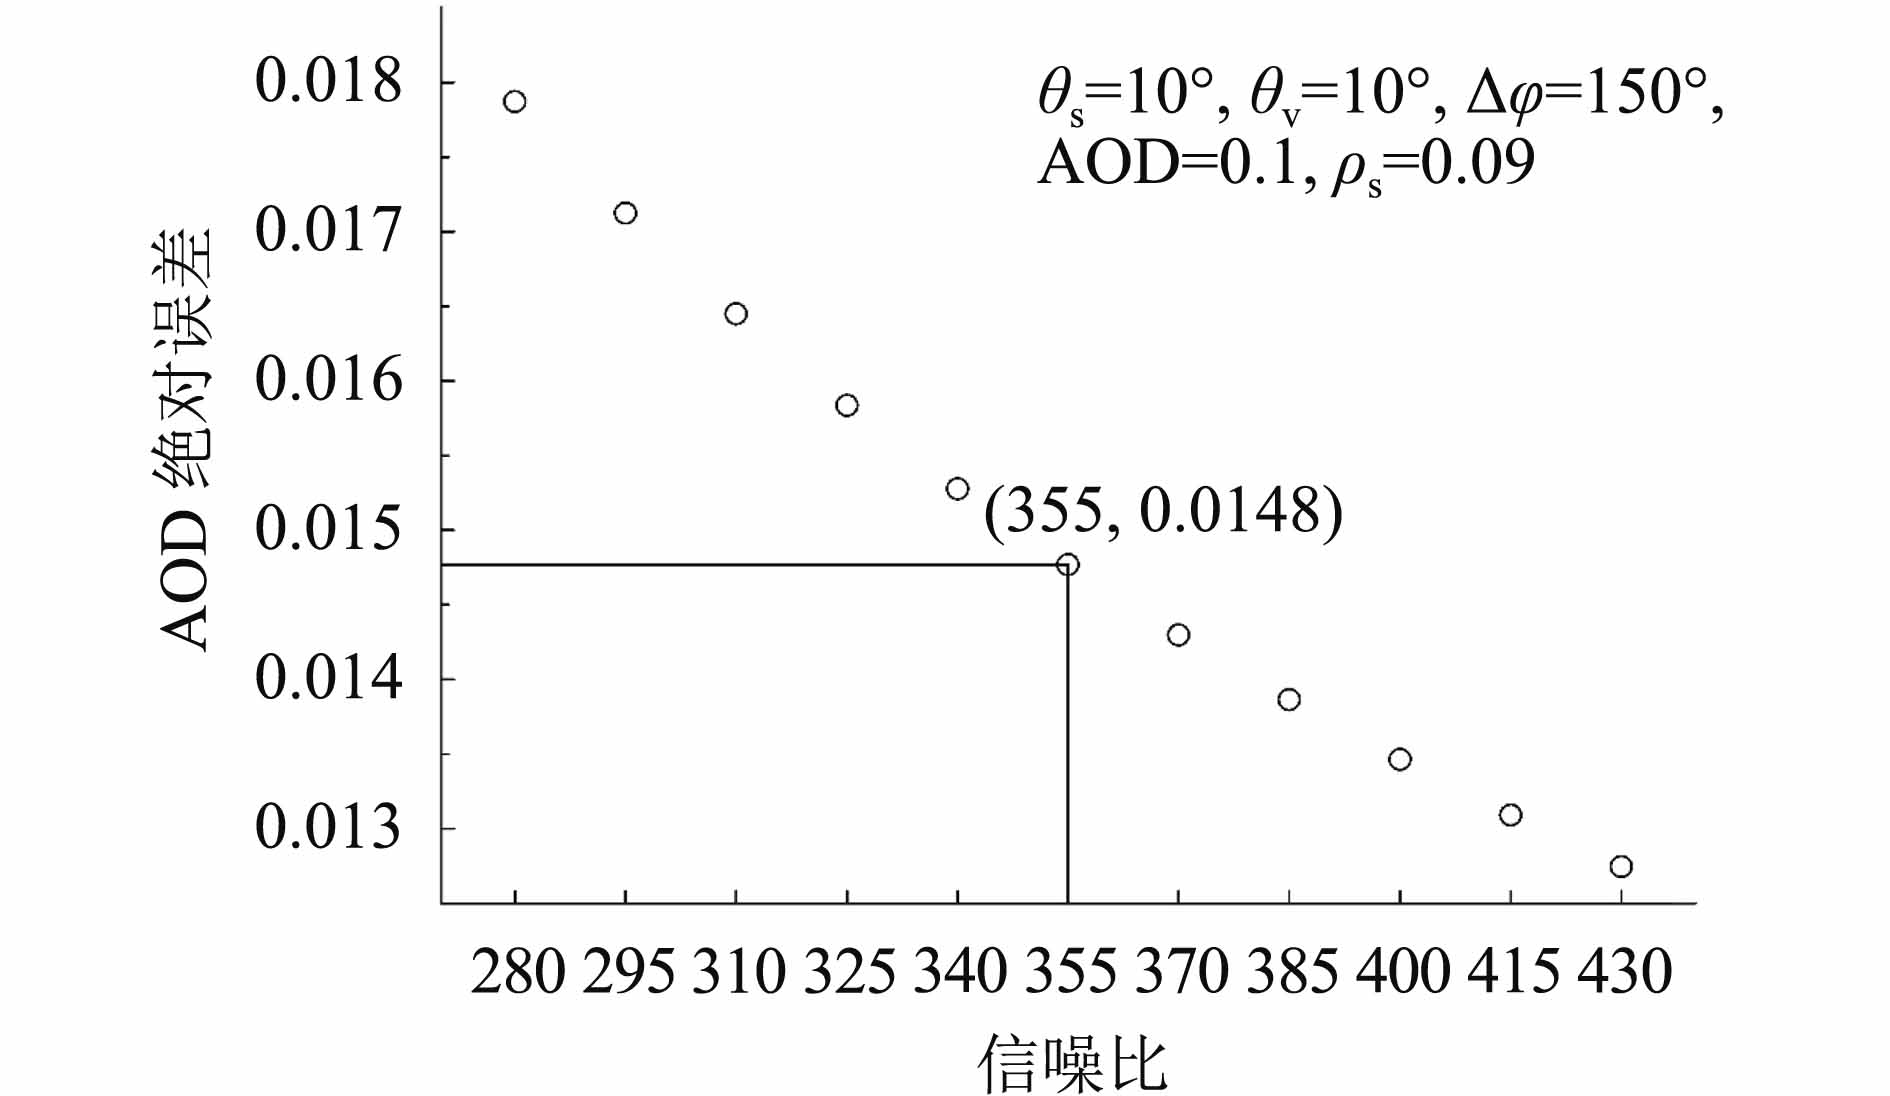
4.3 传感器信噪比误差
5 结 论
本文针对气溶胶反演的传统暗目标法仅在浓密植被区适用,以及深蓝算法空间分辨率较低,不能有效的满足城市地区对气溶胶分布细节描述的要求,提出了一个改进的城市地区气溶胶光学厚度(AOD)估算方法。该方法利用长时间序列的MODIS地表反射率产品数据,采用最小值合成技术构建了500 m分辨率蓝光波段地表反射率月产品数据集,通过该数据集解决AOD反演中地气解耦问题。为了降低不同传感器间光谱差异对地表反射率确定带来的影响,本文通过ASTER波谱库构建了MODIS与OLI传感器间光谱转化模型。并利用北京地区AERONET站点实测数据,精确确定研究区气溶胶光学物理参数信息。利用自Landsat 8发射以来至2016年北京城市地区云覆盖较少的36景OLI数据反演获取500 m空间分辨的气溶胶空间分布情况。
利用AERONET地基观测值及MODIS/Terra C6 DT/DB气溶胶产品对反演结果进行交叉对比验证,结果表明,本文算法气溶胶反演结果与地基观测值具有较高的一致性,算法在城市地区的适用性要优于MODIS气溶胶算法。同时,本文提出的方法也可支持其他传感器的气溶胶光学厚度反演,例如HJ CCD,GF WFV/PMS和资源卫星系列等。
由于城市地区结构复杂,受地表方向性反射影响较大,并且MODIS与OLI数据间存在分辨率差异,本文算法还需进一步考虑地物反射的方向性问题及空间尺度不同在AOD反演中的影响;此外,受自然或人为条件的影响,在地表反射率发生较大幅度变化时间段,如冰雪消融、植被生长、落叶以及农作物收割等时期算法受到一定限制。
参考文献(References)
-
Ångström A. 1964. The parameters of atmospheric turbidity. , 16 (1): 64–75. [DOI: 10.3402/tellusa.v16i1.8885]
-
Baldridge A M, Hook S J, Grove C I and Rivera G. 2009. The ASTER spectral library version 2.0. Remote Sensing of Environment, 113 (4): 711–715. [DOI: 10.1016/j.rse.2008.11.007]
-
Bodhaine B A, Wood N B, Dutton E G and Slusser J R. 1999. On Rayleigh optical depth calculations. Journal of Atmospheric and Oceanic Technology, 16 (11): 1854–1861. [DOI: 10.1175/1520-0426(1999)016<1854:ORODC>2.0.CO;2]
-
Bucholtz A. 1995. Rayleigh-scattering calculations for the terrestrial atmosphere. Applied Optics, 34 (15): 2765–2773. [DOI: 10.1364/AO.34.002765]
-
Gent J F, Koutrakis P, Belanger K, Triche E, Holford T R, Bracken M B and Leaderer B P. 2009. Symptoms and medication use in children with asthma and traffic-related sources of fine particle pollution. Environmental Health Perspectives, 117 (7): 1168–1174. [DOI: 10.1289/ehp.0800335]
-
Hauser A, Oesch D, Foppa N and Wunderle S. 2005. NOAA AVHRR derived aerosol optical depth over land. Journal of Geophysical Research: Atmospheres, 110 (D8): D08204 [DOI: 10.1029/2004JD005439]
-
Herman M, Deuzé J L, Devaux C, Goloub P, Bréon F M and Tanré D. 1997. Remote sensing of aerosols over land surfaces including polarization measurements and application to POLDER measurements. Journal of Geophysical Research: Atmospheres, 102 (D14): 17039–17049. [DOI: 10.1029/96JD02109]
-
Holben B N, Tanré D, Smirnov A, Eck T F, Slutsker I, Abuhassan N, Newcomb W W, Schafer J S, Chatenet B, Lavenu F, Kaufman Y J, Castle J V, Setzer A, Markham B, Clark D, Frouin R, Halthore R, Karneli A, O’Neill N T, Pietras C, Pinker R T, Voss K and Zibordi G. 2001. An emerging ground-based aerosol climatology: aerosol optical depth from AERONET. Journal of Geophysical Research: Atmospheres, 106 (D11): 12067–12097. [DOI: 10.1029/2001JD900014]
-
Hsu N C, Jeong M J, Bettenhausen C, Sayer A M, Hansell R, Seftor C S, Huang J and Tsay S C. 2013. Enhanced Deep Blue aerosol retrieval algorithm: The second generation. Journal of Geophysical Research: Atmospheres, 118 (16): 9296–9315. [DOI: 10.1002/jgrd.50712]
-
Hsu N C, Tsay S C, King M D and Herman J R. 2004. Aerosol properties over bright-reflecting source regions. IEEE Transactions on Geoscience and Remote Sensing, 42 (3): 557–569. [DOI: 10.1109/TGRS.2004.824067]
-
Hyer E J, Reid J S and Zhang J. 2011. An over-land aerosol optical depth data set for data assimilation by filtering, correction, and aggregation of MODIS Collection 5 optical depth retrievals. Atmospheric Measurement Techniques, 4 (3): 379–408. [DOI: 10.5194/amt-4-379-2011]
-
IPCC. 2013. Climate Change 2013: The Physical Science Basis. Contribution of Working Group I to the Fifth Assessment Report of the intergovernmental panel on climate change. New York: Cambridge University Press.
-
Jackson J M, Liu H Q, Laszlo I, Kondragunta S, Remer L A, Huang J F and Huang H C. 2013. Suomi-NPP VIIRS aerosol algorithms and data products. Journal of Geophysical Research: Atmospheres, 118 (22): 12673–12689. [DOI: 10.1002/2013JD020449]
-
Kahn R A, Gaitley B J, Garay M J, Diner D J, Eck T F, Smirnov A and Holben B N. 2010. Multiangle Imaging Spectro Radiometer global aerosol product assessment by comparison with the Aerosol Robotic Network. Journal of Geophysical Research: Atmospheres, 115 (D23): [DOI: 10.1029/2010JD014601]
-
Kaufman Y J, Wald A E, Remer L A, Gao B C, Li R R and Flynn L. 1997. The MODIS 2.1-/spl mu/m channel-correlation with visible reflectance for use in remote sensing of aerosol. IEEE Transactions on Geoscience and Remote Sensing, 35 (5): 1286–1298. [DOI: 10.1109/36.628795]
-
Levy R C, Mattoo S, Munchak L A, Remer L A, Sayer A M, Patadia F and Hsu N C. 2013. The Collection 6 MODIS aerosol products over land and ocean. Atmospheric Measurement Techniques: Discussions, 6 (1): 159–259. [DOI: 10.5194/amtd-6-159-2013]
-
Levy R C, Remer L A, Kleidman R G, Mattoo S, Ichoku C, Kahn R and Eck T F. 2010. Global evaluation of the Collection 5 MODIS dark-target aerosol products over land. Atmospheric Chemistry and Physics, 10 (21): 10399–10420. [DOI: 10.5194/acp-10-10399-2010]
-
Li J D, Mao J Y and Wang W C. 2015. Anthropogenic Eastern Asian radiative forcing due to sulfate and black carbon aerosols and their time evolution estimated by an AGCM. Chinese Journal of Geophysics, 58 (4): 1103–1120. [DOI: 10.6308/cjg20150402] ( 李剑东, 毛江玉, 王维强. 2015. 大气模式估算的东亚区域人为硫酸盐和黑碳气溶胶辐射强迫及其时间变化特征. 地球物理学报, 58 (4): 1103–1120. [DOI: 10.6308/cjg20150402] )
-
Li S S, Chen L F, Tao J H, Han D, Wang Z T, Su L, Fan M and Yu C. 2012. Retrieval of aerosol optical depth over bright targets in the urban areas of North China during winter. Science China Earth Sciences, 55 (9): 1545–1553. [DOI: 10.1007/s11430-012-4432-1]
-
Li Z, Zhao X, Kahn R, Mishchenko M, Remer L, Lee K H, Wang M, Laszlo I, Nakajima T and Maring H. 2009. Uncertainties in satellite remote sensing of aerosols and impact on monitoring its long-term trend: a review and perspective. Annales Geophysicae, 27 (7): 2755–2770. [DOI: 10.5194/angeo-27-2755-2009]
-
North P R J. 2002. Estimation of aerosol opacity and land surface bidirectional reflectance from ATSR-2 dual-angle imagery: operational method and validation. Journal of Geophysical Research: Atmospheres, 107 (D12): 4149 [DOI: 10.1029/2000JD000207]
-
Penner J E, Dong X Q and Chen Y. 2004. Observational evidence of a change in radiative forcing due to the indirect aerosol effect. Nature, 427 (6971): 231–234. [DOI: 10.1038/nature02234]
-
Pope C A, Burnett R T, Thun M J, Calle E E, Krewski D, Ito K and Thurston G D. 2002. Lung cancer, cardiopulmonary mortality, and long-term exposure to fine particulate air pollution. Journal of the American Medical Association, 287 (9): 1132–1141. [DOI: 10.1001/jama.287.9.1132]
-
Prados A I, Kondragunta S, Ciren P and Knapp K R. 2007. GOES aerosol/smoke product (GASP) over North America: comparisons to AERONET and MODIS observations. Journal of Geophysical Research: Atmospheres, 112 (D15): D15201 [DOI: 10.1029/2006JD007968]
-
Remer L A, Kleidman R G, Levy R C, Kaufman Y J, Tanré D, Mattoo S, Martins J V, Ichoku C, Koren I, Yu H B and Holben B N. 2008. Global aerosol climatology from the MODIS satellite sensors. Journal of Geophysical Research: Atmospheres, 113 (D14): D14S07 [DOI: 10.1029/2007JD009661]
-
Remer L A, Mattoo S, Levy R C and Munchak L A. 2013. MODIS 3 km aerosol product: algorithm and global perspective. Atmospheric Measurement Techniques, 6 (7): 1829–1844. [DOI: 10.5194/amt-6-1829-2013]
-
Sayer A M, Hsu N C, Bettenhausen C and Jeong M J. 2013. Validation and uncertainty estimates for MODIS Collection 6 " Deep Blue” aerosol data. Journal of Geophysical Research: Atmospheres, 118 (14): 7864–7872. [DOI: 10.1002/jgrd.50600]
-
Sayer A M, Hsu N C, Bettenhausen C, Jeong M J, Holben B N and Zhang J. 2012. Global and regional evaluation of over-land spectral aerosol optical depth retrievals from SeaWiFS. Atmospheric Measurement Techniques, 5 (7): 1761–1778. [DOI: 10.5194/amt-5-1761-2012]
-
Sun L, Sun C K, Liu Q H and Zhong B. 2010. Aerosol optical depth retrieval by HJ-1/CCD supported by MODIS surface reflectance data. Science China Earth Sciences, 53 (S1): 74–80. [DOI: 10.1007/s11430-010-4134-5]
-
Sun L, Wei J, Bilal M, Tian X P, Jia C, Guo Y M and Mi X T. 2015. Aerosol optical depth retrieval over bright areas using Landsat 8 OLI images. Remote Sensing, 8 (1): 23 [DOI: 10.3390/rs8010023]
-
Tollefson J. 2010. Asian pollution delays inevitable warming. Nature, 463 (7283): 860–861. [DOI: 10.1038/463860b]
-
Torres O, Bhartia P K, Herman J R, Sinyuk A, Ginoux P and Holben B. 2002. A long-term record of aerosol optical depth from TOMS observations and comparison to AERONET measurements. Journal of Atmospheric Sciences, 59 (3): 398–413. [DOI: 10.1175/1520-0469(2002)059<0398:ALTROA>2.0.CO;2]
-
Torres O, Tanskanen A, Veihelmann B, Ahn C, Braak R, Bhartia P K, Veefkind P and Levelt P. 2007. Aerosols and surface UV products from Ozone Monitoring Instrument observations: An overview. Journal of Geophysical Research: Atmospheres, 112 (D24): D24S47 [DOI: 10.1029/2007JD008809]
-
Vermote E F and Kotchenova S. 2008. Atmospheric correction for the monitoring of land surfaces. Journal of Geophysical Research: Atmospheres, 113 (D3): D23S90 [DOI: 10.1029/2007JD009662]
-
Vidot J, Santer R and Aznay O. 2008. Evaluation of the MERIS aerosol product over land with AERONET. Atmospheric Chemistry and Physics, 8 (24): 7603–7617. [DOI: 10.5194/acp-8-7603-2008]
-
Wang Z T, Li Q, Wang Q, Li S S, Chen L F, Zhou C Y, Zhang L J and Xu Y J. 2012. HJ-1 terrestrial aerosol data retrieval using deep blue algorithm. Journal of Remote Sensing, 16 (3): 596–610. [DOI: 10.11834/jrs.20121148] ( 王中挺, 厉青, 王桥, 李莘莘, 陈良富, 周春艳, 张丽娟, 徐拥军. 2012. 利用深蓝算法从HJ-1数据反演陆地气溶胶. 遥感学报, 16 (3): 596–610. [DOI: 10.11834/jrs.20121148] )