

|
收稿日期: 2015-12-29; 优先数字出版日期: 2016-11-25
基金项目: 南京信息工程大学人才启动费(编号:S8113066001);南海气象防灾减灾重点实验室开放基金(编号:SCSF201402);国家自然科学基金(编号:41365005)
第一作者简介: 王祥(1983—),男,博士,讲师,从事卫星资料研究与应用方面工作。E-mail:
wangxiang@nuist.edu.cn
中图分类号: P407.7
文献标识码: A
|
摘要
风云三号C星(FY-3C)携带的微波温度计(MWTS)辐射资料能够穿透非降水云,因此非常适合热带气旋的监测和结构研究。本文使用MWTS观测资料和逐步多元线性回归方法反演晴空和有云两种不同大气状况下的垂直温度廓线。晴空条件下,使用MWTS通道3—10的观测亮温进行大气温度廓线的反演,而有云情况下,仅使用通道5—10,并且两种状况下的逐步线性回归反演都通过1%的信度检验。研究结果表明在晴空状况下,大气各层温度反演的均方根误差都在1.4 K以下,足够精确到可以用于热带气旋上层暖心结构的反演。通过对台风“威马逊”周围温度廓线的反演研究,可以清楚地观察到200 hPa高度层上台风的暖心结构和沿着台风中心的温度梯度热结构,明显优于美国国家环境预报中心(NCEP)再分析资料得到的台风暖心结构。在大气温度廓线反演基础上,先由采用静力平衡计算各层大气台风“威马逊”周围的位势高度场,再由梯度风平衡计算台风周围的水平切向风,结果显示最大风速半径约80 km,最大风速达51 m/s,且由低层向高层逐步减弱。
关键词
微波温度计 , 台风 , 暖心 , 切向风
Abstract
Owing to the deficiency of conventional observations over oceans, particularly under typhoon conditions, numerical simulation has become the foremost approach to the study of the thermal and dynamic structures of typhoons, and the accuracy of the numerical simulation depends on the initial structure of the typhoon and the accuracy of the model. As the first operational satellite, FY-3C was successfully launched into a morning-configured orbit on September 23, 2013. The MWTS onboard the FY-3C is designed with significantly more channels, finer spatial resolution, and better sensor precision than those of FY-3A and FY-3B.Moreover, the observed radiance is insignificantly affected by non-precipitating clouds, making MWTS measurements more suitable to detect the thermal features of typhoons.Radiance in the microwave band is linearly proportional to the entire layer of atmospheric temperature. The weighting functions of all the sounding channels of MWTS are substantially steady, and atmospheric temperature at a given pressure can be expressed as a linear combination of brightness temperatures measured at certain sounding channels. In this study, a stepwise linear regression analysis with a 1% significance level is used. Under a clear-sky condition, the brightness temperatures at channels 3-10 are used to retrieve the temperatures at 21 pressure levels ranging from 100 hPa to 1000 hPa, but channels 3 and 4 are not used for retrieval under precipitation conditions. When the temperature profiles are retrieved, the tangential winds around typhoon “Rammasun” are calculated using hydrostatic equilibrium and gradient balance equations based on the retrieved temperature profiles.Under a clear-sky condition, the root-mean-square error of the retrieved temperature is 1.4 K at the most and even lower than 1.1 K in the upper troposphere and lower stratosphere. These error values are sufficiently low; thus, the thermal structure of typhoons can be monitored. Applied to the super typhoon “Rammasun”, the method excellently described the warm core eye and the temperature gradients across the eyewall. The results generated by the proposed method are more accurate than the results generated from the NCEP reanalysis data. The warm core is identified throughout the troposphere, with maximum temperatures ranging from 8 °C to 10 °C near 200 hPa; the warm core extends to the sea surface. This finding on the warm core is seemingly more realistic compared with the typical one. From the anomaly field, the radius of the typhoon eye at the sea surface is approximately 100 km, and the eye tilts outward with height. The maximum wind speed radius is approximately 80 km, and the maximum wind speed can reach up to 51 m/s.Among the most important parameters in monitoring typhoon intensity, studying typhoon inner core dynamics, and constructing the initial vortex for a typhoon simulation, the three-dimensional warm core and tangential wind features derived from FY-3C MWTS measurements are investigated in this study. Evidently, MWTS has considerable potential for improving our knowledge of typhoons and hurricanes. However, only a single typhoon case is analyzed in this study; more cases should be studied to verify the retrieval method.
Key words
MWTS , typhoon , warm core , tangential wind
1 引言
台风生成于热带宽阔的洋面上,其初始结构和强度是影响移动路径和强度变化的重要因子( 郭鸿基 等,2004; 陈联寿,2010),因此进一步认识台风的细微内核结构特征对于台风路径和强度预报都具有重要意义。暖心温度结构和非对称水平风场的垂直结构是台风结构研究的两个最重要的方面。台风是暖心气旋性环流,高空暖心的建立是台风生成的主要标志之一( 陈联寿和丁一汇,1979)。台风中心的辐合上升气流携带充沛水汽,水汽凝结时释放出大量潜热加热大气;此外台风眼区气流下沉使得大气绝热增温,形成台风的暖心结构。
由于海洋上缺乏第一手观测资料,不足以刻划台风内核的结构和变化特征,因此对台风的强度和结构变化的深入研究大多建立在台风的数值模拟基础上。植入人造台风涡旋是改进台风模拟初始场的有效方法之一。简言之,人造涡旋就是利用分析构造的平衡涡旋取代全球分析场中较弱的台风涡旋( Ueno,1989; Leslie和Holland,1995; Wang,1998; Ma等,2007; Kwon和Cheong,2010),由一个诊断的检验函数计算出气压场和风场且满足梯度风平衡。这种方法已经得到发展并且广泛应用于实时台风的预报中( Kurihara等,1993, 1995; Bender 等,1993)。虽然该方法简单易行,但是使用这种方法可能会导致台风初始条件和模式物理过程以及动力学不平衡。另外一种方法是人造涡旋资料同化。该方法的原理是使用不同的资料进行数据同化使得分析场中的台风涡旋更加接近于实际的台风结构和强度。Xiao等人(2000)提出了用四维变分资料同化技术和人造的地面气压场相结合来改进初始台风涡旋的结构( George和Jeffries,1994; Zou和Xiao,2000; Pu和Braun,2001; Zhang 等,2007),他们发现指定人造涡旋的尺度对于台风路径和强度的模拟有非常大的影响。同时指出,在人造涡旋资料同化方案中,同化海平面气压场比同化风场更能有效地改进台风的结构。
随着卫星遥感技术的发展,卫星资料在台风研究中得到了广泛的应用,尤其是微波温度计资料的应用,对提高台风路径和强度预报作出了重要贡献。早在1978年, Rosenkranz等人(1978)利用Nimbus-6卫星携带的微波温度计资料研究观测到台风的暖心温度结构;不久之后,微波温度计MSU(Microwave Sounding Unit)资料被大量用于台风结构和强度的研究( Velden,1989; Velden和Smith,1983; Velden和Brueske,1999)。 Kidder等人(2000)使用先进的微波温度计AMSU-A(Advanced Microwave Sounding Unit)资料反演大气的垂直温度,研究台风的暖心结构,并进一步利用静力平衡和梯度风平衡反演台风中心附近的切向风场( Kidder 等,2000; Zhu 等,2002)。
2 资料与台风个例介绍
2.1 研究资料介绍
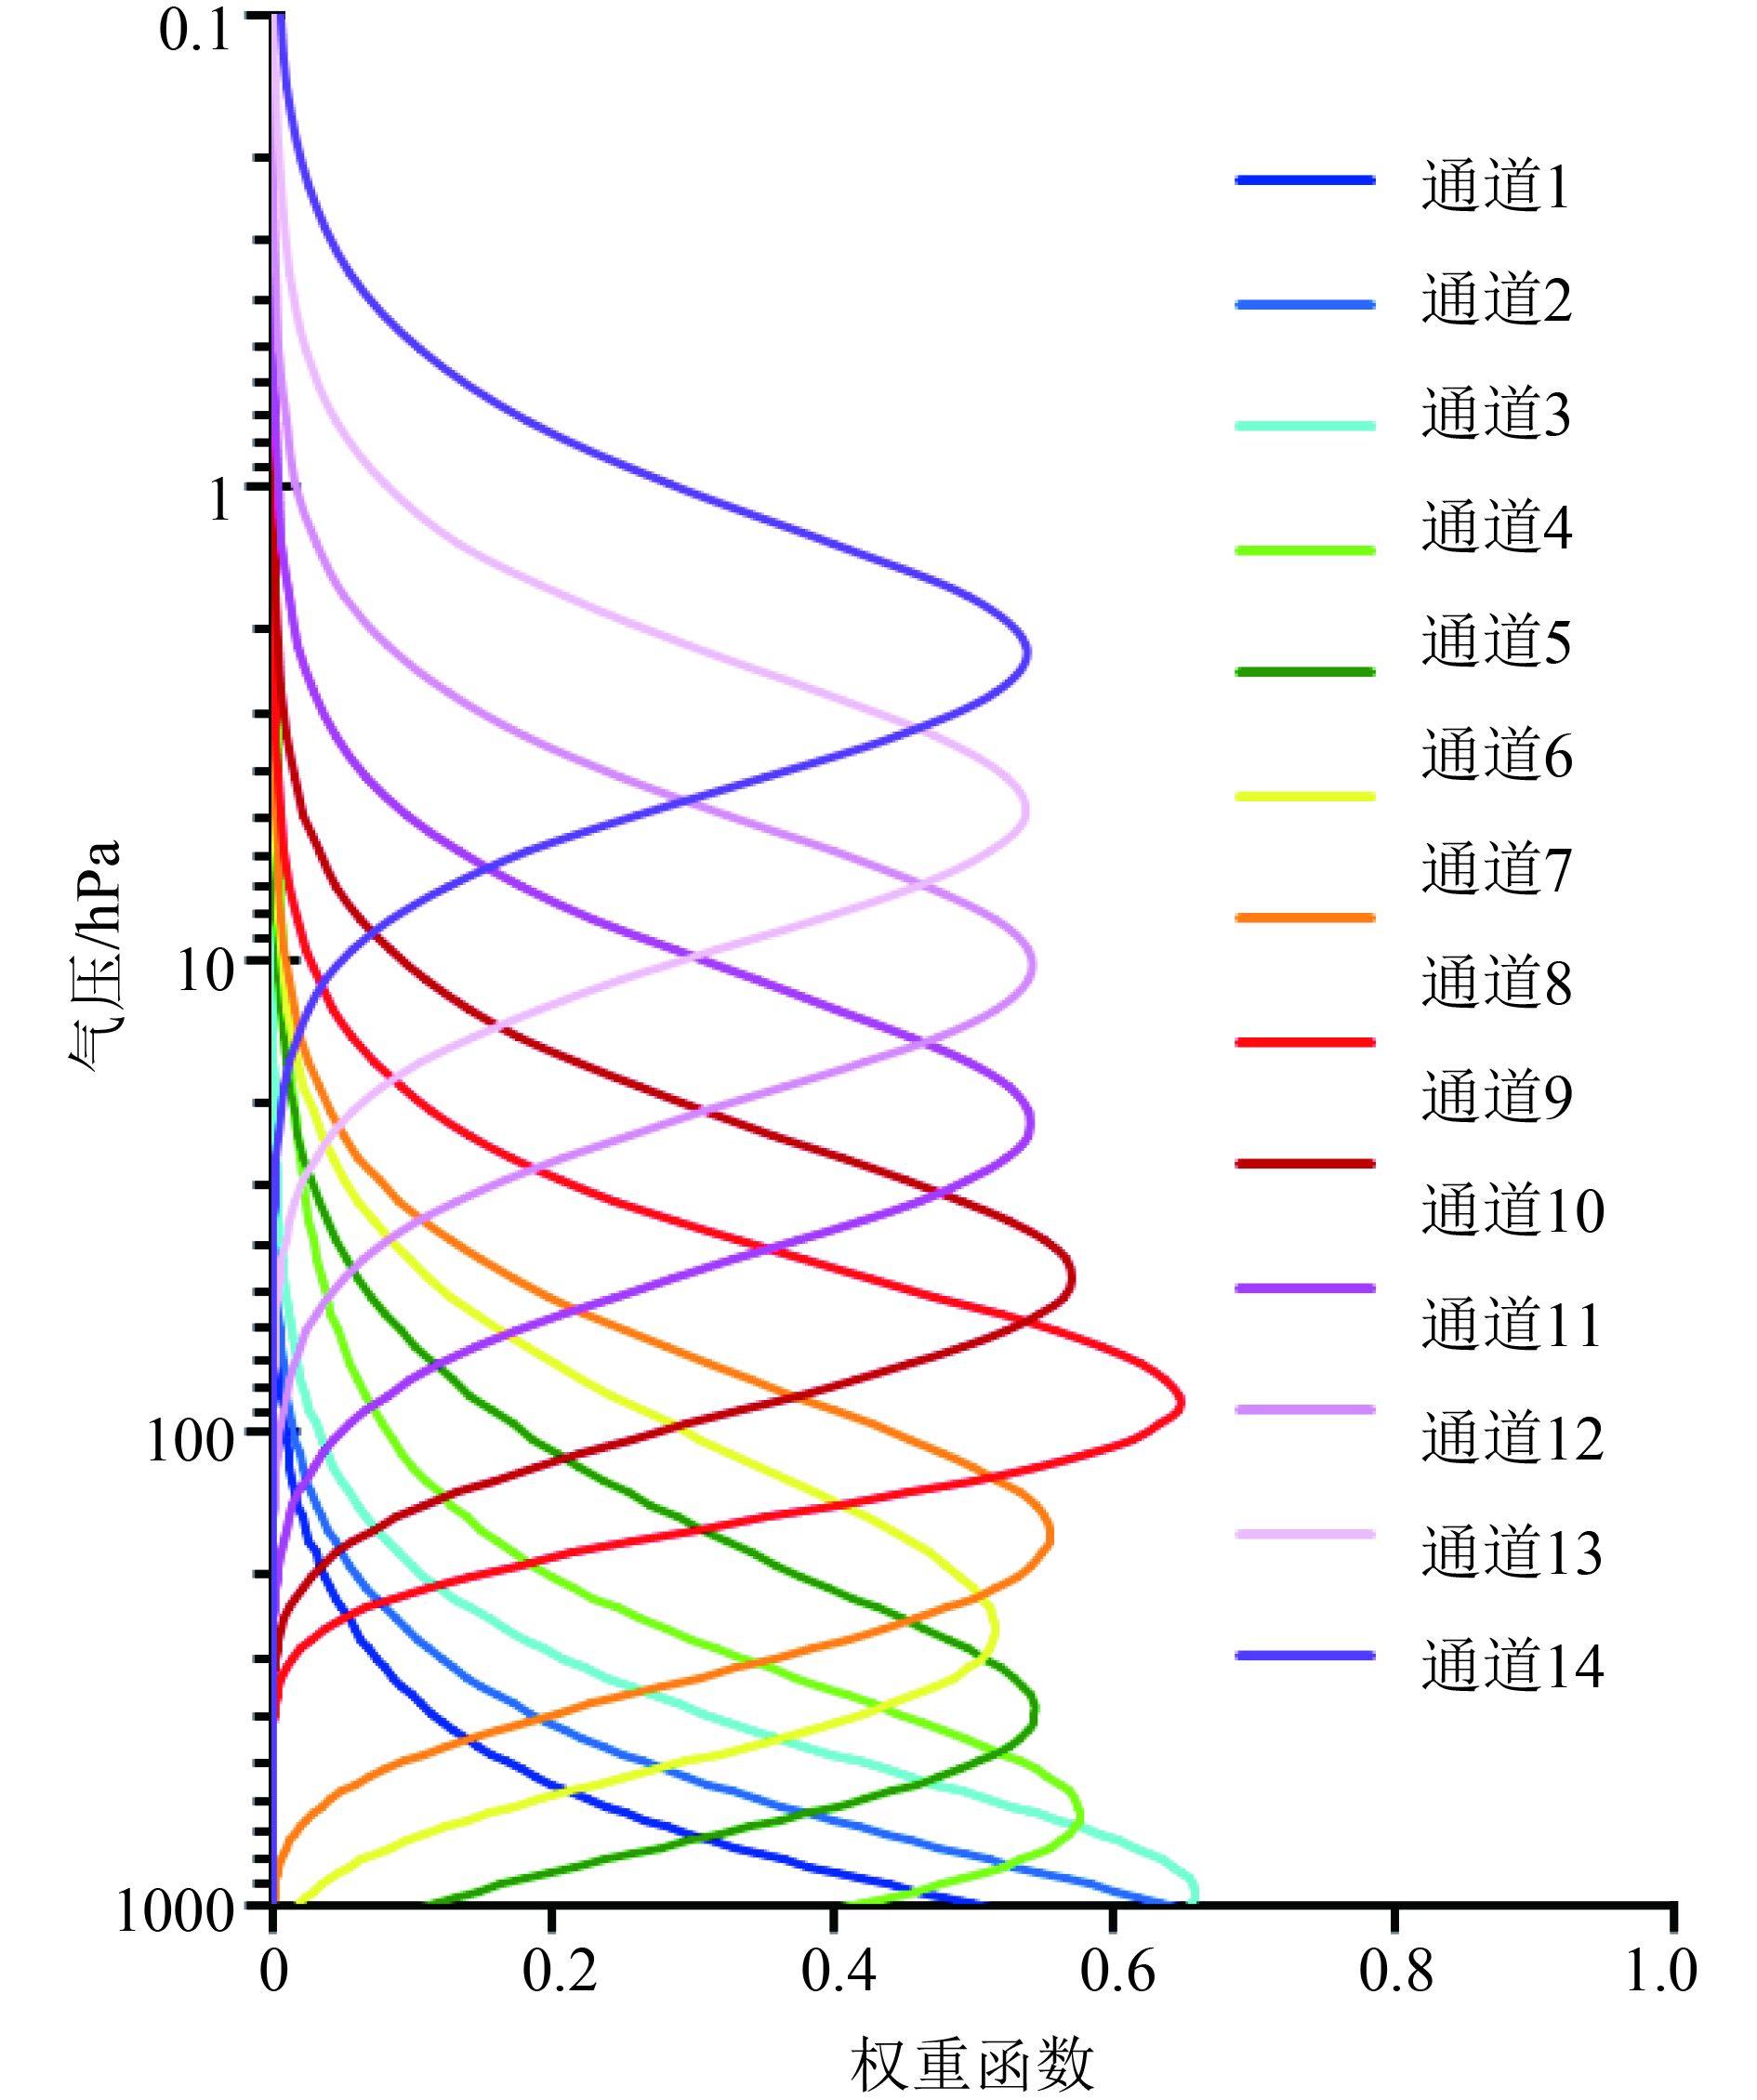
作为中国新一代气象极轨卫星中的第一颗业务卫星,FY-3C于2013年9月23日成功发射,其中MWTS是其携带的最重要传感器之一。MWTS是全功率跨轨垂迹横扫仪,扫描角最大可达±49.5°。每条扫描线具有90个观测像元,像元之间的扫描步进角和每个像元的波束宽度都为2.2°,星下点分辨率约33 km,可以很好地描述台风的暖心结构。MWTS共提供13个探测通道,通道的中心频率在50.3—57.3 GHz的范围内,提供从地表到42 km高空处的大气温度信息。 表 1列出了MWTS探测器13个通道的中心频率、3 dB带宽、探测精度和权重函数的峰值高度。 图 1从下往上依次是MWTS 13个通道的权重函数分布,是将美国标准大气输入到美国卫星资料同化联合中心开发的辐射传输模式CRTM中计算得到,反应了各层大气对探测到的大气层顶总辐射的贡献大小。由于各通道权重函数都有一定的宽度,并且通道之间有重叠,因此可以结合使用多通道观测来反演大气的垂直温度廓线。本文中将使用MWTS通道3—10的观测亮温反演大气垂直温度。
表 1 MWTS仪器通道特征
Table 1 Channel characteristics of MWTS
| 通道 | 中心频率/GHz | 精度/K | 带宽 /MHz | 权重函数峰值高度/hPa |
| 1 | 50.300 | 1.20 | 180 | 地表 |
| 2 | 51.760 | 0.75 | 400 | 地表 |
| 3 | 52.800 | 0.75 | 400 | 950 |
| 4 | 53.596 | 0.75 | 400 | 700 |
| 5 | 54.400 | 0.75 | 400 | 400 |
| 6 | 54.940 | 0.75 | 400 | 270 |
| 7 | 55.500 | 0.75 | 330 | 180 |
| 8 | 57.290(ƒ 0) | 0.75 | 330 | 90 |
| 9 | ƒ 0±0.217 | 1.20 | 78 | 50 |
| 10 | ƒ 0±0.322±0.048 | 1.20 | 36 | 20 |
| 11 | ƒ 0±0.322±0.022 | 1.70 | 16 | 12 |
| 12 | ƒ 0±0.322±0.010 | 2.40 | 8 | 5 |
| 13 | ƒ 0±0.322±0.005 | 3.60 | 3 | 2 |

2.2 台风“威马逊”介绍
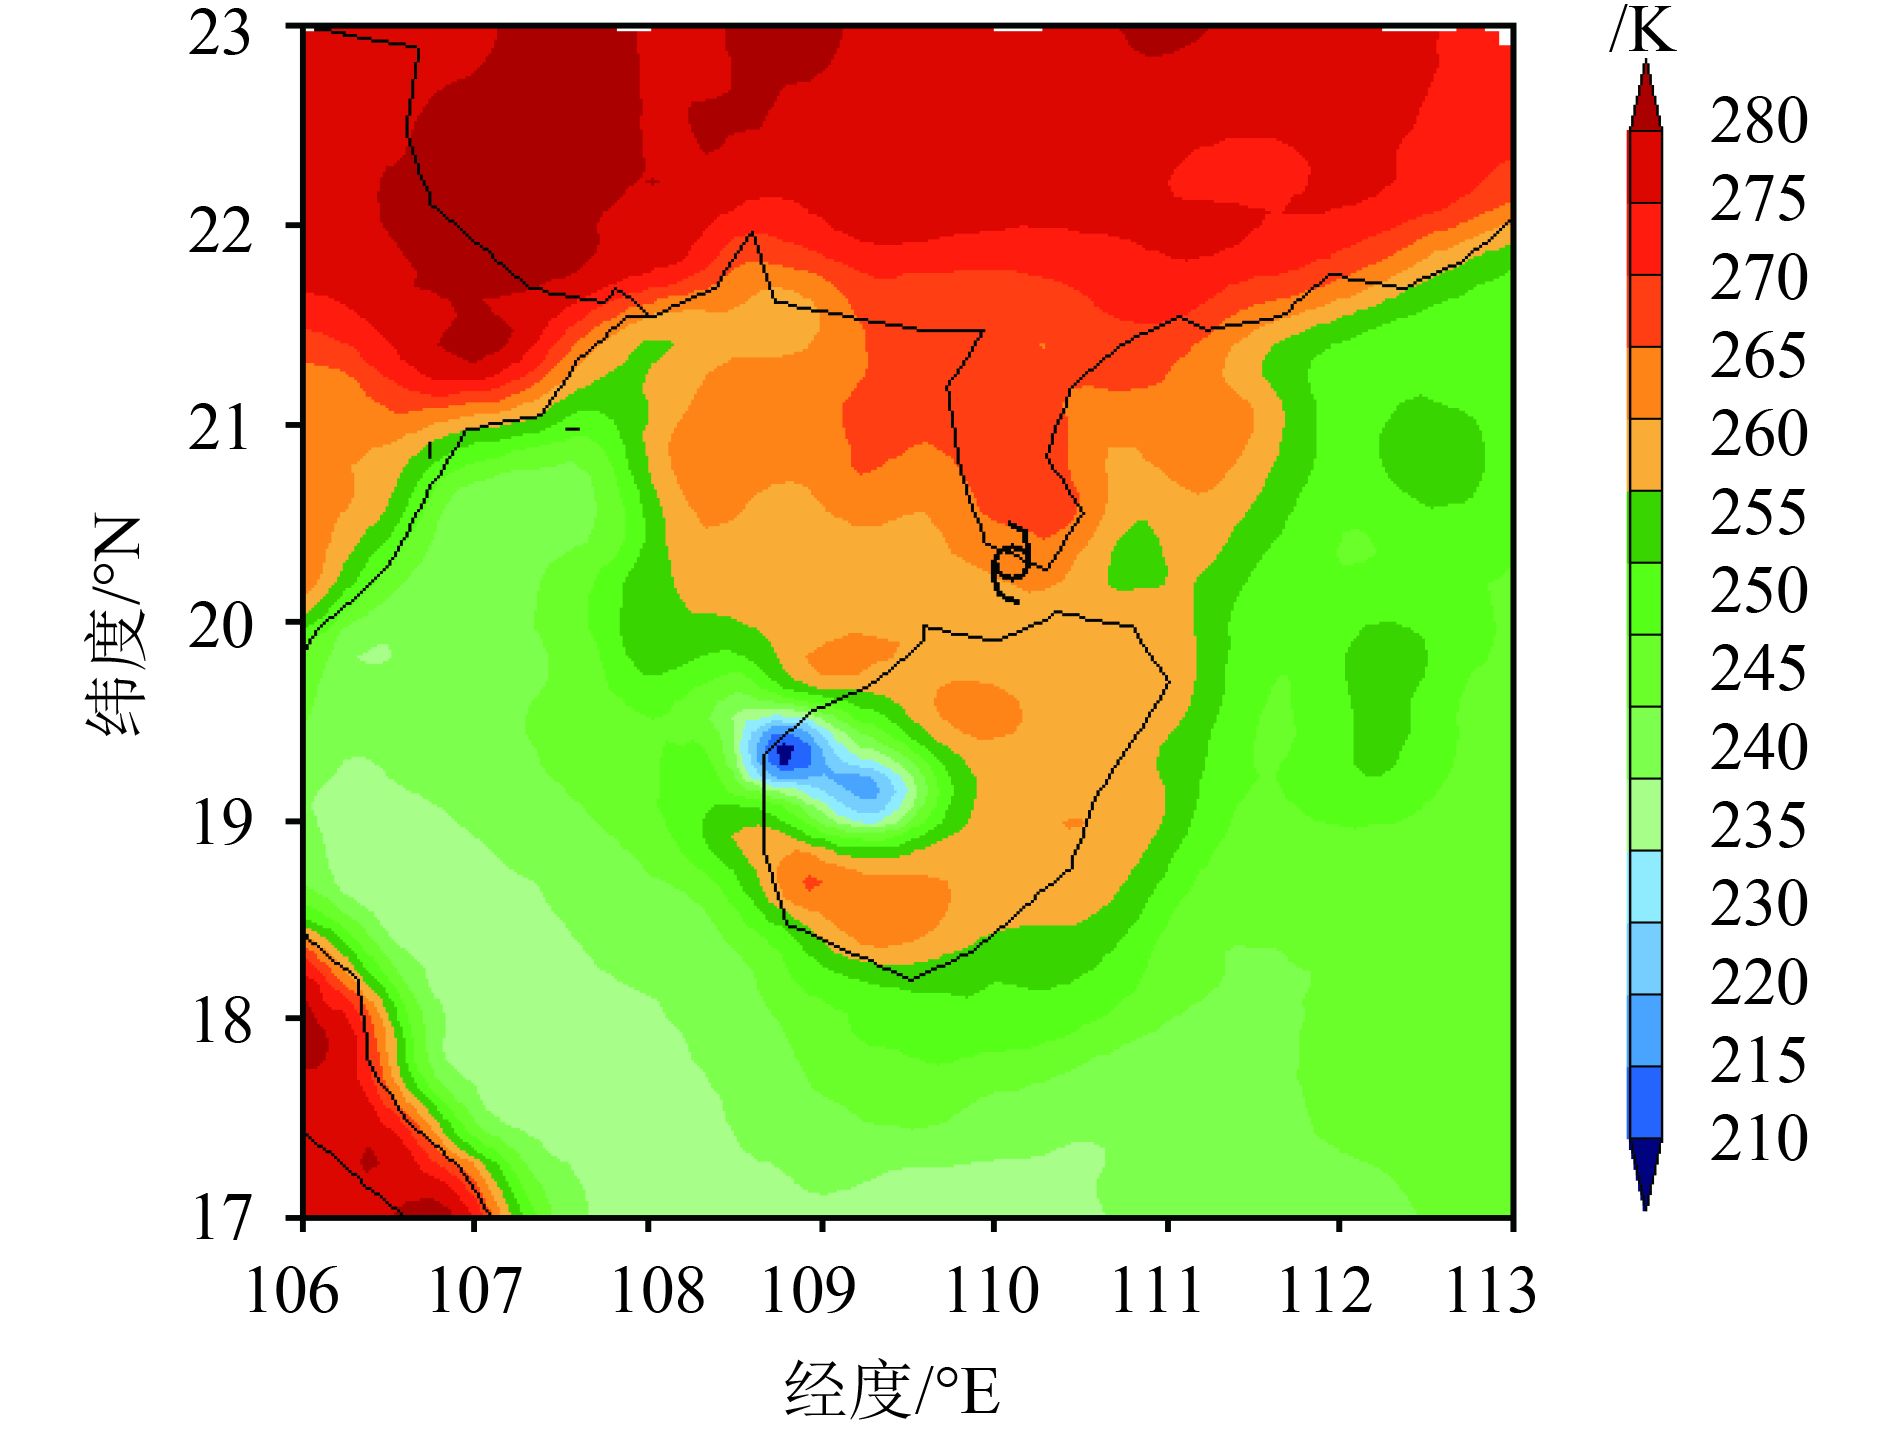
2014年7月9日,一个低压区在楚克东部的西北太平洋面上生成,至2014-07-09 UTC 08左右加强为热带风暴。随后几天,由于环境条件好,热带风暴逐渐加强并稳定西移,在15—16日加强为台风,穿过菲律宾中部进入南海。虽然台风登陆菲律宾后有所减弱,但在进入南海后,受惠于良好的大气环境及高水温,重新组织与增强,中心气压呈下降趋势,至18日凌晨,上升为超强台风“威马逊”,中心附近最大风速52 m/s,最低气压935 hPa。当日下午3时半,“威马逊”以颠峰强度于中国海南省文昌市翁田镇沿海短暂登陆,在重创了海南后便进入海南和雷州之间的琼州海峡。 图 2给出了2014-07-18 UTC 13:53 MWTS通道1的观测亮温在台风“威马逊”周围的空间分布,台风中心在北纬20.3°,东经110.3°。总体而言,陆地的观测亮温明显高于海洋,这是由于海水的地表发射率远低于陆地引起的;再者,可以看到海南岛的西边小块区域的观测亮温也明显低于其他陆地地区(卫星云图略),这是因为台风螺旋雨带致使MWTS通道1只能探测到螺旋雨带顶部的辐射。
3 反演方法与结果
3.1 大气温度反演方法与结果
FY-3C MWTS通道的中心频率位于50—60 GHz,处于氧气的吸收带上,氧气在大气的分布均匀而且稳定,因此MWTS各通道的权重函数的分布相当稳定;另外,MWTS各大气探测通道测得的微波辐射与大气各层的物理温度成线性关系。因而MWTS各大气探测通道的观测亮温值可以用来反演大气垂直温度廓线,具体地可以将大气各层的物理温度表示成多个大气探测通道观测亮温的线性组合( Janssen,1993),公式如下
| $ \begin{aligned} T(p)={{\beta }_{0}}(p,\theta )+\sum\limits_{i=1}^{n}{{{\beta }_{i}}(p,\theta ){{T}_{\rm b}}({{\upsilon }_{i}},\theta )} \end{aligned} $ | (1) |
式中,
p是给定气压层,
实际上,有些探测通道观测之间存在相关性,因此采用逐步多元线性回归来选择通道并确定回归系数 β 0和 β i ,同时要满足1%的信度检验,避免通道信息的繁冗和减小计算量。本文中将2014年7月11—14日的南北纬30°之间的NCEP再分析资料与MWTS观测资料按照3 h和30 km的时空标准分别在陆地和海洋上进行匹配,进而通过回归获得系数。在非晴空状况下,由于通道3和4的观测亮温易受云水的影响,因此仅仅使用通道5—10来进行逐步回归。且本文使用 Han等人(2015)开发的云辐射和散射指数来进行云检测。

温度反演的效果可以用不同层次上均方根误差来检验。如 图 3所示,所有反演层上的均方根误差均在1.4 K以下,尤其是在对流层中上层和平流层低层,反演的均方根误差在1.1 K以下,足够精确地用来监测的台风的暖心结构。对流层低层的反演误差稍大可能是因为降水云对中下层探测通道观测的影响没有完全消除造成的。
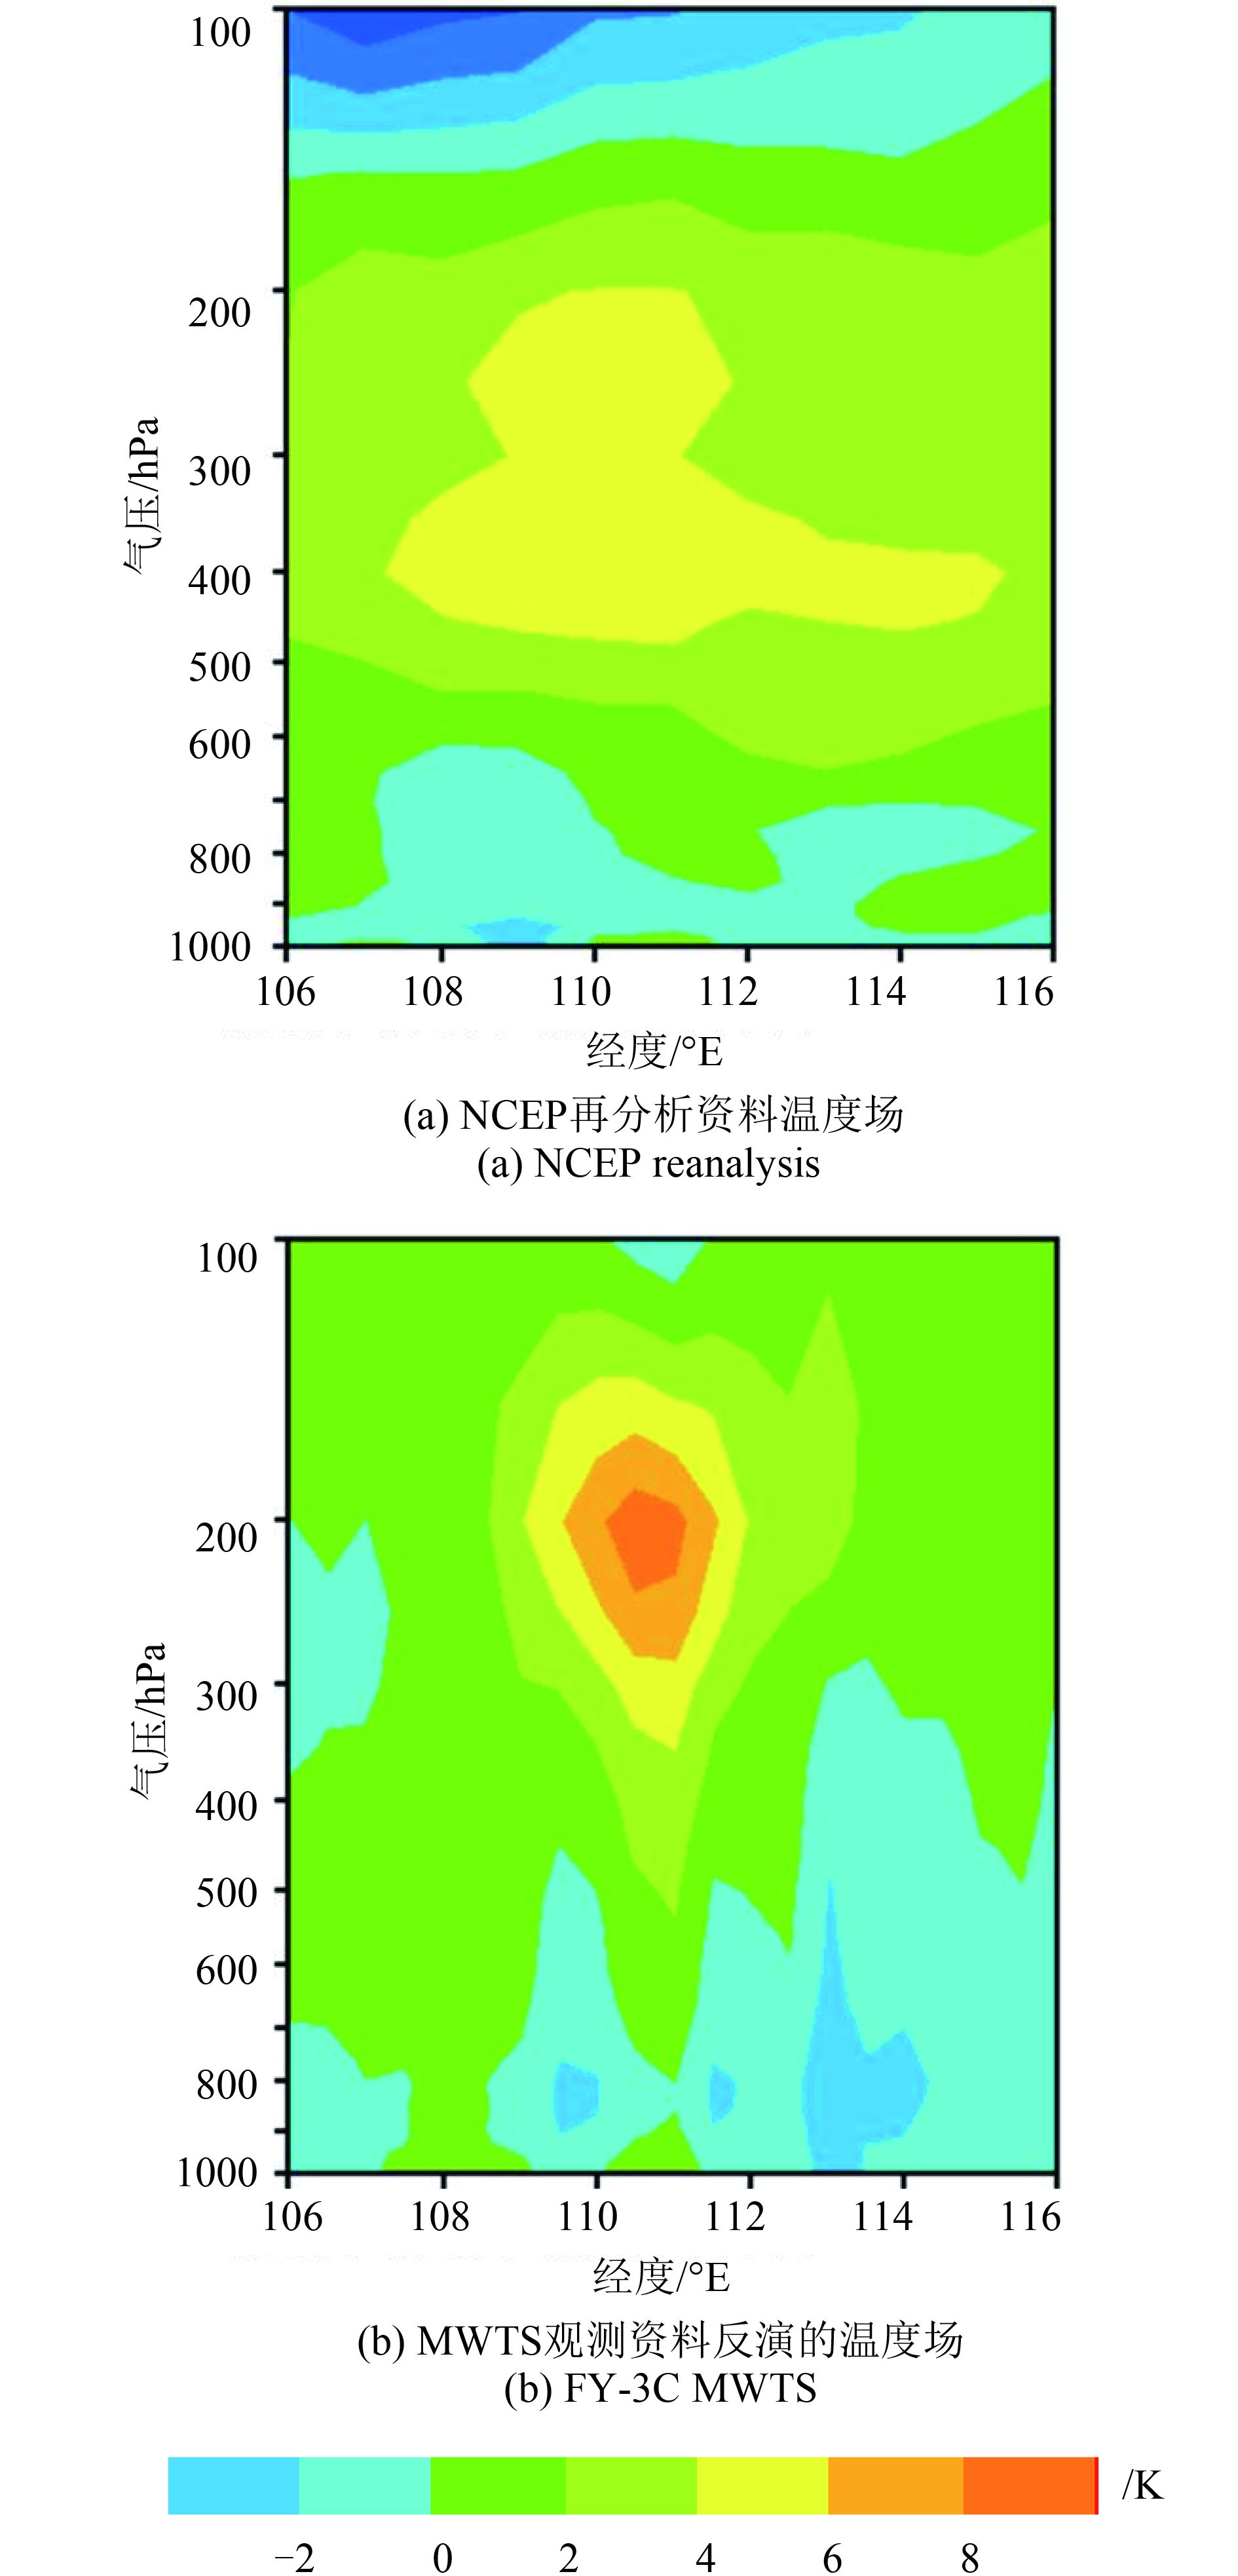
图 4展示了2014-07-18 UTC 13:53 台风“威马逊”成熟阶段的温度异常沿着北纬20.3°的垂直剖面结构,其中本文中温度异常定义为反演的大气温度与没有受到台风影响的环境温度的差。 图 4(b)是用MWTS观测资料反演的结果。明显地,用MWTS观测亮温反演的温度异常在200 hPa左右高度层存在一个8—10°C的暖中心结构,并且暖中心往下逐渐变窄并一直延伸至近地面,且强度明显减弱。只在近地面一个小范围内出现了温度异常小于0的情况,这也很可能是因为降水云对中下层探测通道观测的影响没有完全消除造成的。为了与MWTS反演结果相比, 图 4(a)展示了用NCEP再分析温度资料得到的温度异常的垂直结构。与MWTS反演的温度暖心结构相比,NCEP再分析资料得到的暖心结构的强度明显很弱,最大的温度异常也在6°C以下,并且暖中心高度比较低,约在300—400 hPa。
3.2 水平切向风反演方法与结果
前一部分内容中,由MWTS探测通道的观测亮温资料反演得到了台风“威马逊”的3维温度场结构。众所周知,直接同化MWTS观测亮温资料或间接同化反演的温度资料都可以获得大气的风场和质量场信息,然而本文将使用风场和质量场的平衡关系来获得台风周围的水平切向风场结构,因此要用到静力平衡和梯度风平衡假设。由于台风中心气压较低,1000 hPa在海平面以下,因此本文仅计算925 hPa到50 hPa这20个气压层上的切向风。具体步骤如下:
步骤1将MWTS通道观测亮温资料反演的各层温度场插值到以台风中心为原点,径向格距为25 km的规则格点上,且最大的径向半径取为500 km。如第 i个径向格点的温度 T i 为
| $ \begin{aligned} {{T}_{i}}=\sum{{{w}_{k}}{{T}_{k}}}/\sum{{{w}_{k}}} \end{aligned} $ | (2) |
式中,∑表示包含选定区域内的所有观测资料,每个温度的权重 w k 为
| $ \begin{aligned} {{w}_{k}}=\exp [-{{({{r}_{i}}-{{r}_{k}})}^{2}}/r_{\text{e}}^{2}] \end{aligned} $ | (3) |
式中, r i 和 r k 分别为第 i和 k个径向格点到台风中心的距离,参数 r e决定插值场的平滑程度,本文中取常数20 km。
步骤2由静力平衡假设从低层到高层依次积分计算各气压层上最外圈径向半径上的位势高度 Φ,具体计算公式如下
| $\frac{\partial \Phi (p)}{\partial \ln p}=-{{R}_{\text{d}}}{{t}_{\text{v}}}(p)$ | (4) |
式中, t v为虚温,海平面温度及最外圈气压资料来自NCEP再分析资料。假定50 hPa气压层的位势高度 Φ为常值,然后再由静力平衡假设从高层往海平面依次积分计算除最外圈外的各层径向半径上的位势高度 Φ。
步骤3计算各气压层上的气压梯度力 F( p,r)
| $F(p,r)=-\frac{\partial \Phi (p,r)}{\partial r}$ | (5) |
步骤4最后根据梯度风平衡公式计算各层水平切向风 v t ( p,r)
| $ \begin{aligned} \frac{v_{t}^{2}(p,r)}{r}+{{f}_{c}}{{v}_{t}}(p,r)-F(p,r)=0 \end{aligned} $ | (6) |
式中, f c 是科氏参数。
图 5(a)展示了2014-07-18 UTC 13:53 过台风威马逊中心的水平切向风场的垂直剖面,水平切向风场由MWTS观测资料经过以上四步计算得到。从 图 5中可以看到最大风速随径向半径的增大先增加后减小,最大风速半径约80 km,最大风速达51 m/s,并且随着高度的增加,水平切向风速逐渐减小。 图 5(b)给出了NCEP再分析资料的水平切向风的垂直分布,与MWTS反演结果相比,虽然两者水平切向风的水平和垂直分布特征十分相似,但是NCEP再分析资料的水平切向风的强度要明显偏弱10 m/s左右。

4 结 论
台风的暖心结构和水平切向风场结构是研究台风内核动力、构造台风初始涡旋的两个重要的方面。由于缺乏海洋上常规观测资料,尤其是台风内部常规观测资料的匮乏,台风内部的热力结构和动力结构的研究一直是台风研究工作中的难点。前人对台风内部结构的研究工作主要是借助模式进行数值模拟,模拟效果受到初始条件和模式本身精度的限制。
本文采用逐步多元线性回归方法,使用FY-3C MWTS探测通道的观测亮温资料来反演大气的垂直温度廓线,构造台风的暖心结构,并在此基础上通过静力平衡和梯度风平衡公式计算了台风的水平切向风场。通过台风“威马逊”个例的研究发现:大气各层的温度反演误差都小于1.4 K,可以较好地反应台风的暖心结构特征,并且也可以较好地得到台风的水平风场结构,因此FY-3C MWTS观测亮温资料无疑可以用来监测台风,提高对台风内部结构的认识,并为以后的FY-3D/E/F MWTS观测资料的应用提供借鉴和参考。但是本文只研究了台风“威马逊”一个个例,为了验证本文中反演方法的普适性,需要进一步多选取个例进行研究。
参考文献(References)
-
Bender M A, Ginis I, Kurihara Y.1993.Numerical simulations of tropical cyclone-ocean interaction with a high-resolution coupled model. Journal of Geophysical Research, 98 : 23245–23263. DOI: 10.1029/93JD02370.
-
Chen L S.2010.Tropical meteorological calamities and its research evalution. Meteorological Monthly, 36 : 101–110. ( 陈联寿. 2010. 热带气象灾害及其研究进展. 气象, 36 : 101–110. )
-
Chen L S, Ding Y H. Introduction on the Western Pacific Typhoons. 科学出版社: Beijing 1979 . ( 陈联寿, 丁一汇. 1979. 西太平洋台风概论. 科学出版社: 北京 . )
-
George J S, Jeffries R A.1994.Assimilation of synthetic tropical cyclone observations into the Navy operational global atmospheric prediction system. Weather and Forecasting, 9 : 557–576. DOI: 10.1175/1520-0434(1994)009<0557:AOSTCO>2.0.CO;2.
-
Guo H J, Lin L Y, Chen Y L.2004.A review of study on recent typhoons. Atmospheric Science, 32 : 205–223. ( 郭鸿基, 林李耀, 陈怡良. 2004. 近期台风研究之回顾. 大气科学, 32 : 205–223. )
-
Han Y, Zou X L, Weng F Z.2015.Cloud and precipitation features of Super Typhoon Neoguri revealed from dual oxygen absorption band sounding instruments on board FengYun-3C satellite. Geophysical Research Letters, 42 : 916–924. DOI: 10.1002/2014GL062753.
-
(Janssen M A. 1993. Atmospheric Remote Sensing by Microwave Radiometry (Wiley Series in Remote Sensing and Image Processing). New York: John Wiley and Sons, 572 pp)
-
Kidder S Q, Goldberg M D, Zehr R M, DeMaria M, Purdom J F W, Velden C S, Grody N C, Kusselson S J.2000.Satellite analysis of tropical cyclones using the Advanced Microwave Sounding Unit (AMSU). Bulletin of the American Meteorological Society, 81 : 1241–1260. DOI: 10.1175/1520-0477(2000)081<1241:SAOTCU>2.3.CO;2.
-
Kurihara Y, Bender M A, Ross R J.1993.An initialization scheme of hurricane models by vortex specification. Monthly Weather Review, 121 : 2030–2045. DOI: 10.11175/1520-04093(1993)121<2030:AISOHM>2.2.CO;2.
-
Kurihara Y, Bender M A, Tuleya R E, Ross R J.1995.Improvements in the GFDL hurricane prediction system. Monthly Weather Review, 123 : 2791–2801. DOI: 10.1175/1520-0493(1995)123<2791:IITGHP>2.0.CO;2.
-
Kwon I H, Cheong H B.2010.Tropical cyclone initialization with a spherical high-order filter and an idealized three-dimensional bogus vortex. Monthly Weather Review, 138 : 1344–1367. DOI: 10.1175/2009MWR2943.1.
-
Leslie L M, Holland G J.1995.On the bogussing of tropical cyclones in numerical models: a comparison of vortex profiles. Meteorology and Atmospheric Physics, 56 : 101–110. DOI: 10.1007/BF01022523.
-
Ma S H, Qu A X, Wang Y.2007.The performance of the new tropical cyclone track prediction system of the China National Meteorological Center. Meteorology and Atmospheric Physics, 97 : 29–39. DOI: 10.1007/s00703-006-0242-3.
-
Pu Z X, Braun S A.2001.Evaluation of bogus vortex techniques with four-dimensional variational data assimilation. Monthly Weather Review, 129 : 2023–2039. DOI: 10.1175/1520-0493(2001)129<2023:EOBVTW>2.0.CO;2.
-
Rosenkranz P W, Staelin D H, Grody N C.1978.Typhoon June (1975) viewed by a scanning microwave spectrometer. Journal of Geophysical Research, 83 : 1857–1868. DOI: 10.1029/JC083iC04p01857.
-
(Ueno M. 1989. Operational bogussing and numerical prediction of typhoon in JMA. JMA/NPD Technical Report, No.28, 48pp)
-
Velden C S.1989.Observational analyses of North Atlantic tropical cyclones from NOAA polar-orbiting satellite microwave data. Journal of Applied Meteorology, 28 : 59–70. DOI: 10.1175/1520-0450(1989)028<0059:OAONAT>2.0.CO;2.
-
(Velden C S and Brueske K F. 1999. Tropical cyclone warm cores as observed from the NOAA polar orbiting satellite’s new Advanced Microwave Sounding Unit // 23d Conference on Hurricanes and Tropical Meteorology. Dallas, TX: Amer. Meteor. Soc.: 182-185)
-
Velden C S, Smith W L.1983.Monitoring tropical cyclone evolution with NOAA satellite microwave observations. Journal of Climate and Applied Meteorology, 22 : 714–724. DOI: 10.1175/1520-0450(1983)022<0714:MTCEWN>2.0.CO;2.
-
Wang Y Q.1998.On the bogusing of tropical cyclones in numerical models: the influence of vertical structure. Meteorology and Atmospheric Physics, 65 : 153–170. DOI: 10.1007/BF01030785.
-
Zhang X Y, Xiao Q N, Fitzpatrick P J.2007.The impact of multisatellite data on the initialization and simulation of Hurricane Lili’s (2002) rapid weakening phase. Monthly Weather Review, 135 : 526–548. DOI: 10.1175/MWR3287.1.
-
Zhu T, Zhang D L, Weng F Z.2002.Impact of the advanced microwave sounding unit measurements on hurricane prediction. Monthly Weather Review, 130 : 2416–2432. DOI: 10.1175/1520-0493(2002)130<2416:IOTAMS>2.0.CO;2.
-
Zou X L, Xiao Q N.2000.Studies on the initialization and simulation of a mature hurricane using a variational bogus data assimilation scheme. Journal of Atmospheric Sciences, 57 : 836–860. DOI: 10.1175/1520-0469(2000)057<0836:SOTIAS>2.0.CO;2.