
|
收稿日期: 2016-01-20; 修改日期: 2016-05-25; 优先数字出版日期: 2016-11-25
基金项目: 国家青年科学基金(编号:41301482);国家自然科学基金(编号:41271369);山东省自主创新及成果转化专项(编号:2014ZZCX07402);山东农业大学博士后基金(编号:76390);2013年度山东省高等学校青年骨干教师国内访问学者项目
第一作者简介: 王凌(1975—),女,副教授,研究方向为农业定量遥感。E-mail:
lingwang@sdau.edu.cn
通讯作者简介: 赵庚星(1964—),男,教授,研究方向为土地资源和遥感。E-mail:
zhaogx@sdau.edu.cn
中图分类号: TP753/S127
文献标识码: A
|
摘要
Landsat 8 OLI影像已成为重要的数据源,但受云及云影的影响较大,降低了数据的可用性,因此,快速识别云及云影,为后续的数据恢复有着积极的应用价值。通过构建云指数(CI)、归一化暗像元指数(NDPI)和比值阴影指数(RSI),采用阈值法和方位角搜索法,以两景Landsat 8 OLI影像(一景试验影像,另一景验证影像)为例进行云及云影检测。每类随机选取200个样点进行精度分析,结果表明: CI可快速区分OLI影像中的云区与非云区,厚云样本点正确识别率达到99%;NDPI与归一化植被指数(NDVI)构建的比值阴影指数RSI放大了水体、云影与其他阴影间的差异,更便于区分;方位搜索合理设置搜索方位角和搜索距离,简化了云影与云的相对关系模型,可准确区分水体与云影,两者的正确识别率都超过93%,弥补了阈值法的局限性。本方法可行快捷,为OLI影像的后续应用提供了基础,可有效提高其利用精度。
关键词
比值阴影指数 , 云指数 , 方位搜索 , 云影检测 , OLI影像
Abstract
Landsat 8 OLI images have become important data sources; however, they are usually covered by clouds and cloud shadows, which reduce data availability. Therefore, a rapid method for detecting clouds and cloud shadows in a single image is necessary for follow-up data recovery applications. Threshold setting has been a commonly used method; however, it is difficult to use because the same threshold value usually indicates different objectives and varies across different data sources, as well as across different period images. Thus, the relative position relationship between a cloud shadow and a cloud is the key to detect a cloud shadow. First, a cloud index (CI) with a cirrus band and coastal/aerosol band was established to distinguish the thin and thick cloud pixels by setting thresholds. Second, a normalized dark pixel index (NDPI) with coastal/aerosol band and short-wave infrared 2 band was established. Furthermore, a ratio of shadow index (RSI) was established based on the NDPI and normalized differential vegetation index. RSI was used to distinguish the potential cloud shadow pixels in thin-cloud and non-cloud areas also by using thresholds. Third, an azimuth search method based on the solar azimuth angle and an appropriate searching distance were adopted to detect the cloud shadow from the potential cloud shadow pixels in the images. Two Landsat 8 OLI images were selected for the case study; the image captured on April 22, 2014 was used for the test, whereas the image captured on July 12, 2015 was used for validation. For each type (e.g., thick cloud, water, cloud shadow, or other kinds of shadow),200 random sampling points were used to assess the detection accuracy. Results showed that CI could quickly distinguish cloud from on-cloud pixels by statistics according to the cloud coverage ratio in the header files, with thresholds of CI ≥ 0.0011 and CI ≥ 0.0048 in the test and validation OLI images for the thick cloud type. Both user accuracy rates of detection for the thick cloud samples were over 99%. RSI could enhance the difference among water, cloud shadow, and other kinds of shadow, thereby facilitating the differentiation among the different types. The pixels with 0.45 ≤ RSI < 0.76 in the test image and 0.36 ≤ RSI < 0.76 in the validation image belong to potential cloud shadows. Using the solar azimuth angle at the time of imaging as the searching azimuth angle and a reasonable searching distance (500-2200 m in the test image and 270-800 m in the validation image), the azimuth searching method simplified the models of the relative position relationship of a cloud shadow to a cloud and accurately distinguished cloud shadow from water and other shadows. The detection precision levels for both test and validation reached more than 93%, which compensated for the limitation of the threshold method. The proposed shadow detection method combines threshold with simplified relative relationship model and leverages band difference. The method is feasible and rapid when applied to a single image, further improving the utilization accuracy of OLI images.
Key words
ratio of shadow index , cloud index , azimuth search , cloud shadow detection , OLI image
1 引 言
卫星遥感影像已成为重要的数据源,其中Landsat- 8数据的应用较广泛,但遥感数据受到云及云影的影响较大,降低了质量和可用性(Shahtahmassebi 等,2013),限制着定点定期的动态遥感监测,表 1显示了2014年中国不同区域(每个区域选择一景数据为代表)的云覆盖情况,即使湿度最小的西北地区平均云覆盖也接近30%。因此,快速识别云及云影,为后续的云污染像元的数据恢复及提高影像的利用率有着积极的应用价值。
表 1 2014年Landsat 8影像中国区域云覆盖统计
Table 1 Cloud cover statistics in China in Landsat 8 images of 2014
| 代表区域 | 东北 | 华北 | 东南 | 西北 | 西南 | |
| Path/Row | 117/28 | 122/35 | 121/43 | 145/30 | 130/41 | |
| 2014年总景数 | 23 | 21 | 23 | 21 | 22 | |
| 不同云覆盖水平的景数 | 0—30% | 10 | 6 | 4 | 14 | 12 |
| 30%—60% | 6 | 6 | 4 | 4 | 3 | |
| 60%—100% | 7 | 9 | 15 | 3 | 7 | |
| 平均云覆盖度/% | 41.04 | 52.48 | 66.65 | 28.57 | 37.05 | |
对于影像中云及云影的检测和识别已经提出了诸多方法,概括起来主要有:(1)波段差异法(Zhang 等,2002;Richter和Müller,2005;李存军 等,2006;Luo 等,2008;Liu 等,2011;Zhu和Woodcock,2012;Zhu 等,2015),利用单景数据不同波段对云及云影的敏感性差异进行图像运算与处理,该方法利用单景数据,简单有效,但前提条件较高,波段较少时受到限制;(2)多时相比较法(Song和Civco,2002;田养军和薛春纪,2007;Hagolle 等,2010;柴勇 等,2010;李炳燮 等,2010;Goodwin 等,2013;Lin 等,2015),依据同一地区不同时相的多幅影像进行叠加运算,这一方法需要选取同一区域的合适的无云影像,且要求这一时段内区域的地物变化不大;(3)滤波法(Lu,2007;张波 等,2011),利用单景影像通过均值、低通、高通、小波、同态等不同算子进行处理,滤波法原理简单、操作方便,不足是会造成不必要的信息丢失;(4)几何关系法(Luo 等,2008;Hégarat-Mascle和André,2009;Jin 等,2013),利用云与云影之间的相对关系,可有效避免与其他光谱类似地物的混淆,但模型复杂,涉及的参数较多,需与其他方法结合。
这些方法各有特色又各有局限性,前3种方法应用较多,第4种方法应用较少,相对于云检测,云影的检测研究相对较少,而云影易与水体、其他阴影混淆,是检测的难点,涉及的影像有多种。Landsat 8 OLI拥有的Cirrus波段(1341—1410 nm,记为B9)使得云检测变得简单,精度接近100%(Man 等,2015),但对于Landsat 8 OLI影像中云影的检测鲜见报道。
本文以单景OLI影像为基础,利用波段差异构建暗像元指数和阴影指数,结合阈值法和方位角搜索,简化几何关系法,提供一种快捷实用的云影检测方法。
2 数据和方法
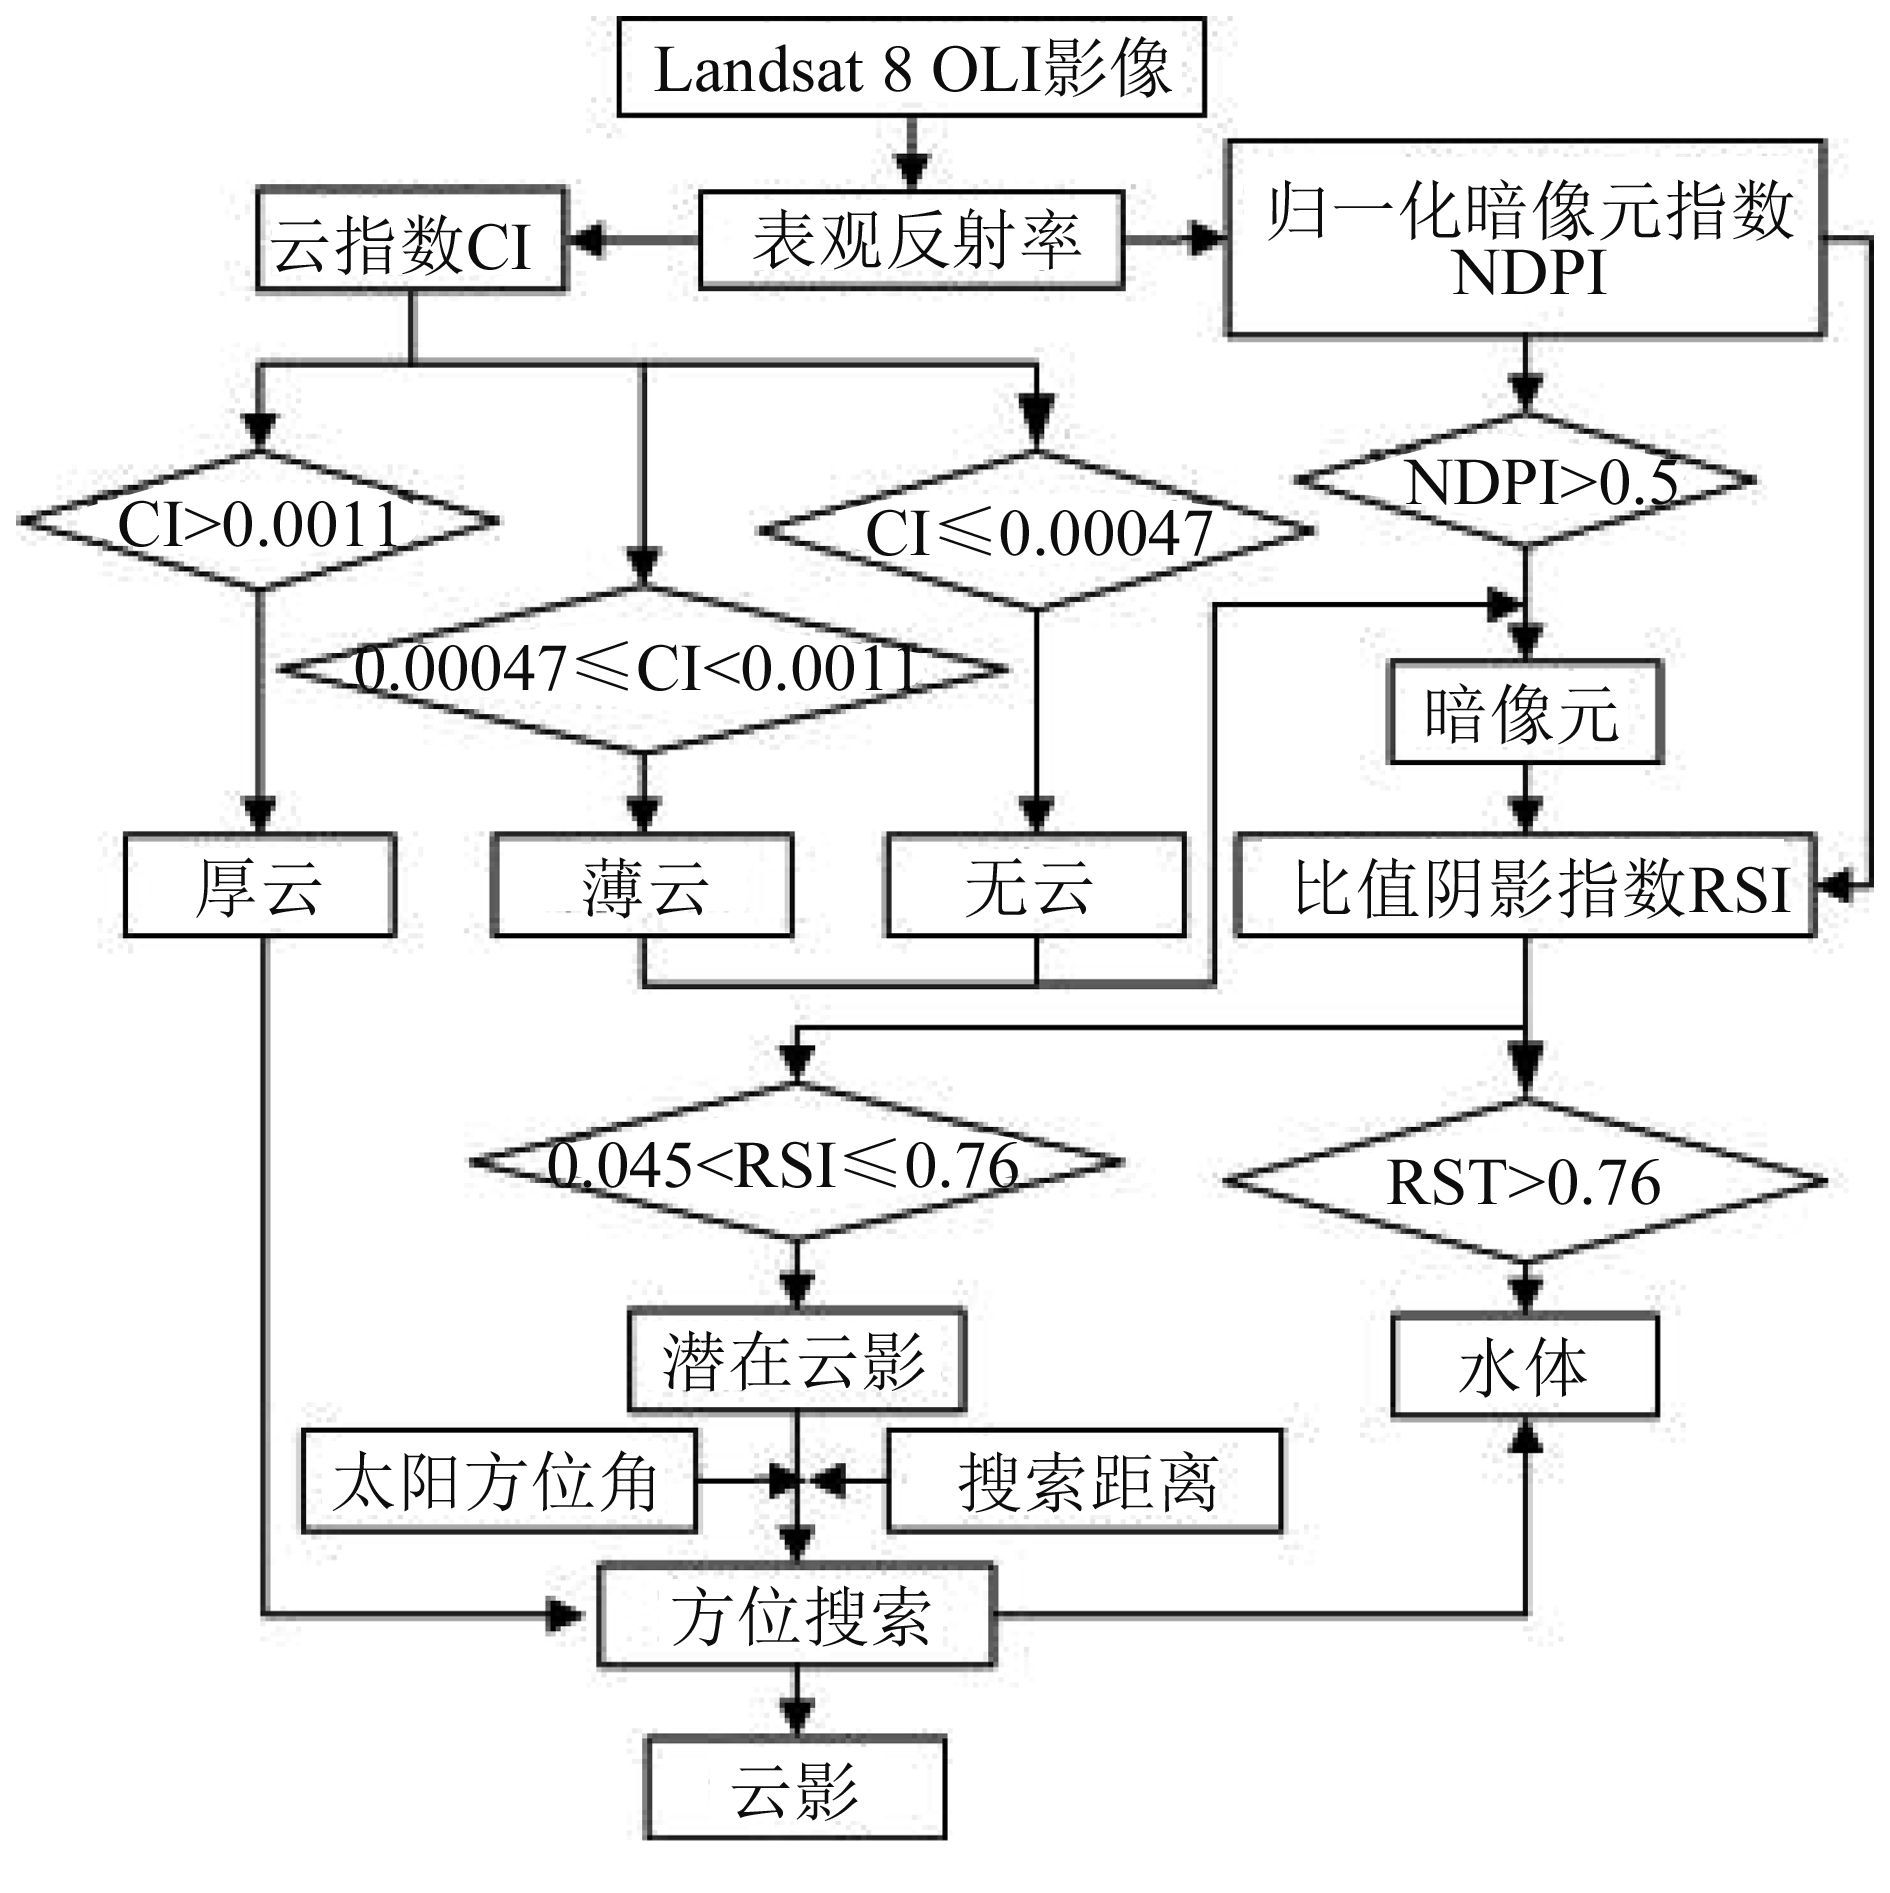
试验影像以2014年4月22日Path122/Row35的Landsat 8 OLI影像为例,分析波段相关性时辅以此轨道号2014年其他11景影像,验证时利用2015年7月12日Path/Row为124/40的OLI影像(来源http://glovis.usgs.gov和中国科学院计算机网络信息中心地理空间数据云http://www.gscloud.cn)。技术路线如图 1所示。

2.1 云检测
云影检测需利用其与云的方位关系,因而首先要确定云,Landsat 8 OLI的B 9可有效检测云,但研究中发现,部分高反射率的地物(如亮建筑物、反光膜等)在B 9易与云混淆,仅靠B 9来识别云有局限性,考虑波长越短,散射越强,而且云的散射要高于高反射率地物,理论上云在Coastal/Aerosol波段(427—459 nm,记为B1)的反射率也应该高。
随机选取2014年Path122/Row35 12景影像统计无云区与有云区(仅根据云覆盖率按照B 9表观反射率确定)的B 1—B 9波段相关性,如表 2,绝大多数影像无云区的相关系数明显低于有云区,表明有云区B 1与B 9呈一定相关性,说明云检测中引入B 1波段是必要的。公式如下
| ${\rm{CI}} = \frac{{B9 - B{9_{\min }}}}{{B{9_{\max }} - B{9_{\min }}}} \times \frac{{B1 - B{1_{\min }}}}{{B{1_{\max }} - B{1_{\min }}}}$ | (1) |
式中,CI为云指数,B1 、B1max 和B1min 为B1 表观反射率及其单景最大值和最小值,B9 、B9max 和B9min 为B9 表观反射率及其单景最大值和最小值。
云层越厚,CI越大,根据头文件中云覆盖率按CI由大到小确定云区,并设定阈值区分厚云和薄云。只有厚云才能形成云影,为云影检测提供了依据。
表 2 影像无云区与有云区的B1—B9波段相关系数
Table 2 Correlation coefficient between B1 and B9 of non-cloud and cloud area in images
| 日期/月-日 | 云覆盖率/% | 相关系数 | |
| 无云区 | 有云区 | ||
| 01-16 | 87.86 | 0.01 | 0.72 |
| 02-01 | 99.86 | 0.06 | 0.33 |
| 03-05 | 76.94 | -0.01 | 0.75 |
| 03-21 | 0.25 | -0.07 | 0.17 |
| 04-22 | 44.77 | 0.21 | 0.68 |
| 05-08 | 34.70 | 0.5 | 0.65 |
| 06-09 | 86.24 | 0.03 | 0.19 |
| 07-11 | 11.19 | 0.09 | 0.17 |
| 10-15 | 13.25 | -0.01 | -0.01 |
| 11-16 | 85.36 | 0.07 | 0.73 |
| 12-02 | 7.48 | 0.03 | 0.89 |
| 12-18 | 11.21 | 0.06 | -0.08 |
| 平均值 | 46.59 | 0.10 | 0.45 |
| 注:平均值由各相关系数的绝对值计算而来。 | |||
2.2 云影检测
云影的检测基于无云和薄云区展开。首先根据波段差异构建归一化暗像元指数和比值阴影指数,通过阈值确定阴影像元,然后结合太阳方位角和搜索距离进行方位搜索确定云影区。
2.2.1 归一化暗像元指数(NDPI)和比值阴影指数(RSI)
目前云影检测所采用波段有蓝光、红光、近红外、中红外、短波红外和热红外等(Song和Civco,2002;Hégarat-Mascle和André 等,2009;Jin 等,2013;Shahtahmassebi 等,2013;Zhu 等,2015),就基于单景Landsat影像的检测而言,Choi和Bindschadlerb(2004)将ETM中云影的阈值设为0.15 ≤B3(红光)≤ 0.6(太阳高度角H≤ 15°)或0.7(H > 15°)和0.1 ≤ B4(近红外)≤ 0.6(H≤ 15°)或0.7(H≤ 15°);Zhu等人(2015)将同时满足(Flood-fill-Original近红外)> 0.02和(Flood-fill-Original短波红外)> 0.02的像元作为潜在云影区。
总体而言,云影的检测波段较分散,缺乏系统的参数。对于云影而言,无法接收太阳直接辐射,周围地形的反射辐射很小,可忽略不计,所接收能量以大气散射辐射为主,而波长越短,散射越强,OLI影像的深蓝波段(B1 )较蓝光波长散射更强,理论上,云影的B1 反射率高于SWIR2波段(2038—2356 nm,记为B7 ),因此,将这两个波段用于云影检测,特征应更明显。由此构建归一化暗像元指数NDPI(Normalized Dark Pixel Index)如下:
| $\text{NDPI}=\frac{B1-B7}{B1+B7}$ | (2) |
NDPI高值区为暗像元,暗像元包括阴影、水体、湿润耕地等,由于水体在短波红外的反射能量很小,B1 反射率也高于B7 ,因此水体的NDPI亦高,一般地,水体NDPI大于阴影NDPI,但当水体较浅且有植被生长时,如水田等,极易与云影混淆。
为更好地区分云影与水体,利用水体的归一化植被指数NDVI(Normalized Difference Vegetation Index)低于阴影且多为负值,尤其OLI影像的近红外波段(B5 )波长为830—901 nm,排除了825 nm处水汽吸收特征,导致水体的NDVI较TM和ETM影像小,与其他地类差异变大。因此,引入NDVI与NDPI共同构建比值阴影指数RSI(Ratio Shadow Index),可以放大水体与阴影的差异,更易区分阴影与水体。
| $\begin{align} & \text{NDVI}=\frac{B5-B4}{B5+B4} \\ & \text{RSI}=\frac{\text{NDPI}}{1+\text{NDVI}} \\ \end{align}$ | (3) |
式中,B5 为近红外波段(830—901 nm);B4 为红光波段(626—692 nm)。
RSI综合了深蓝、红光、近红外和短波红外的特点,比单一波段在识别潜在云影方面更具有优势。
2.2.2 方位搜索
通常阴影是由云、山、高大建筑物导致的,虽然利用指数法设定阈值可以区分大部分,但仍有少部分容易混淆,准确判断云影难度较大,与云的相对关系成为重要依据。
表征云影与云相对关系的参数很多,Hégarat-Mascle和André(2009)估测SPOT HRVIR影像中云影与云的位置关系时考虑的参数有太阳方位角、太阳入射角、卫星天顶角、卫星观测角、云高度等,Jin等人(2013)在确定云影位置时考虑了其与云的邻近性、大小及方向。通过分析发现,Landsat 8卫星的高度为705 km,而云集中于对流层,一般其高度在11 km以下,低纬地区也在18 km以下,与卫星高度相比显得微不足道,因而众多参数中起关键作用的是成像时的太阳方位角,其决定了云影与云的相对方向。太阳入射角及卫星天顶角和观测角的影响主要体现在云影与云之间的水平距离上,由于云的高度不同且难以计算,导致两者间的距离很难用定量公式表达,需要在影像上目视测量确定搜索距离。最终将成像时的太阳高度角(本文为136.735°)作为搜索方位角,搜索距离为500—2200 m。方法如图 2所示(以太阳方位在东南为例)。
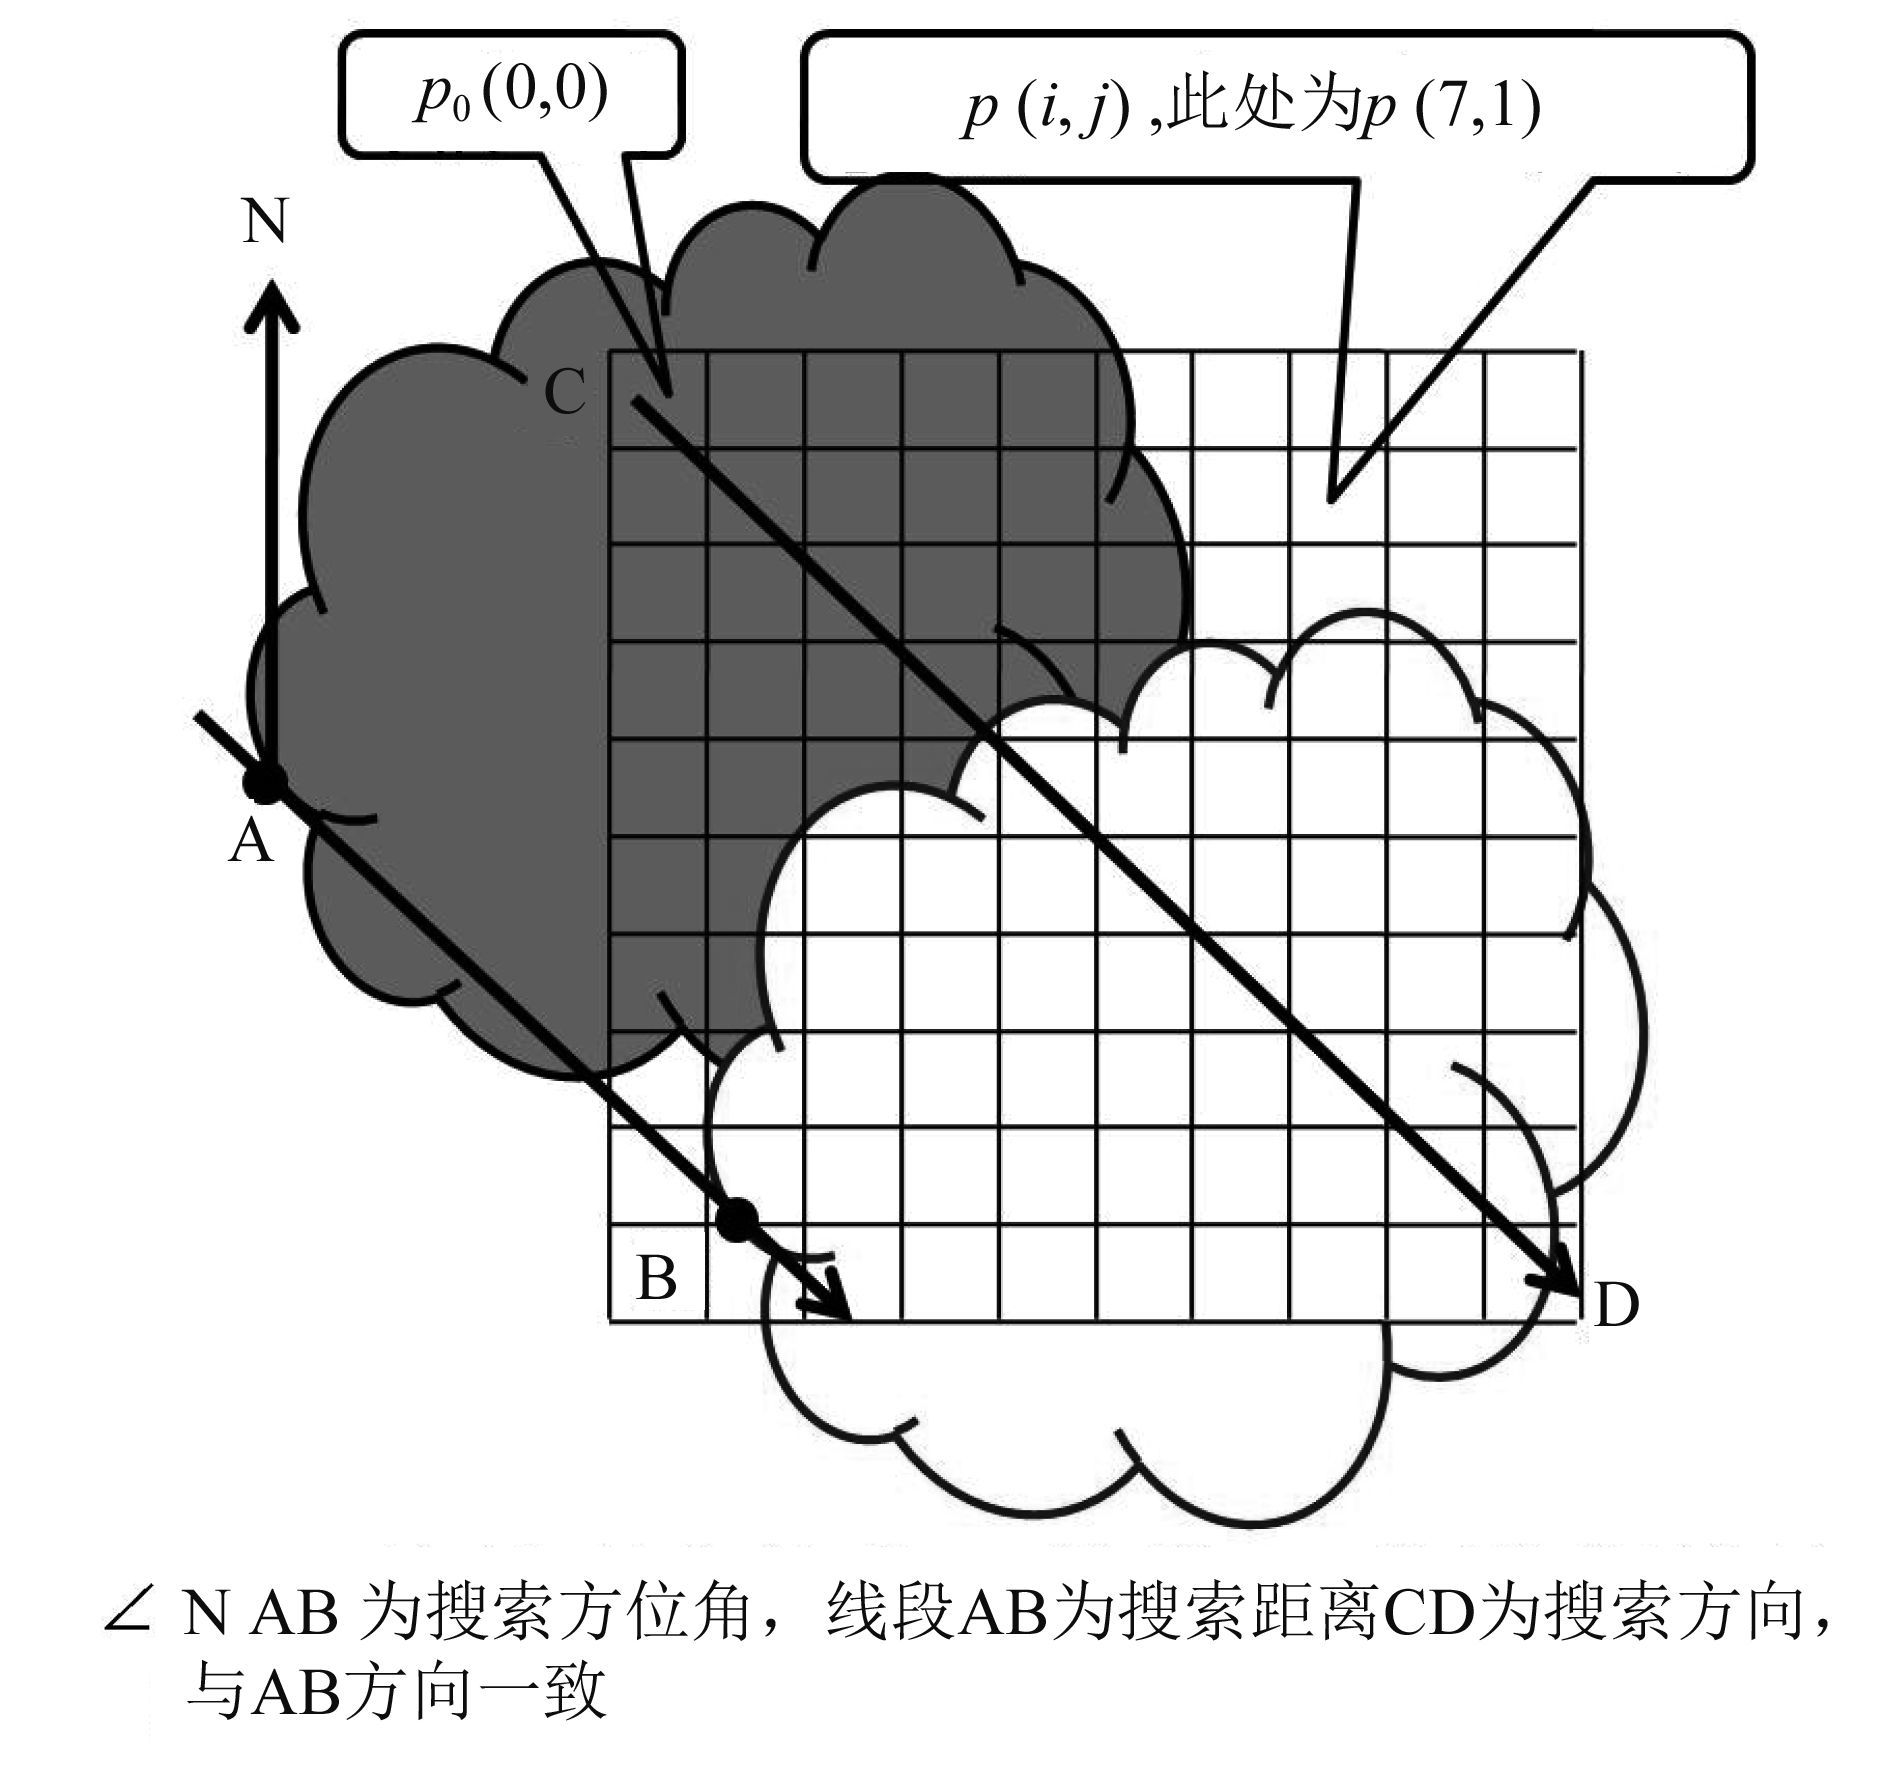
影像的任一像元设为矩阵原点p 0(0,0),相对于这一像元的东南方位的像元设为p (i,j ),其中i 为行号,j 为列号。如果同时满足下列条件,且考虑到能成影的云应有一定的覆盖面积,为避免偶然性,因此将搜索到的像元p (i,j )属性为厚云的数量超过3的阴影像元p 0(0,0)视为云影,否则为水体。
| $\left\{ \begin{align} & j=ceil(\frac{i}{\left| {\rm tg}A \right|})\ \ \ \ \ \ i=\left( 1,2,\cdots ,\text{\emph n} \right) \\ & 500\ {\rm m}\leqslant r \times \sqrt{{{i}^{2}}+{{j}^{2}}}\leqslant 2200\ {\rm m} \\ & \ \ \ \ \ \ \ \ \ \ \ \ {{p}_{0}}(0,0)\in \left\{ \text{阴影} \right\} \\ & \ \ \ \ \ \ \ \ \ \ \ p(i,j)\in \left\{ \text{厚云} \right\} \\ \end{align} \right.$ | (4) |
式中,i 和j 分别为p (i,j )的行号和列号,A 为太阳方位角,ceil表示向上取整,r 为像元的边长。
3 结果和分析
3.1 云检测结果分析
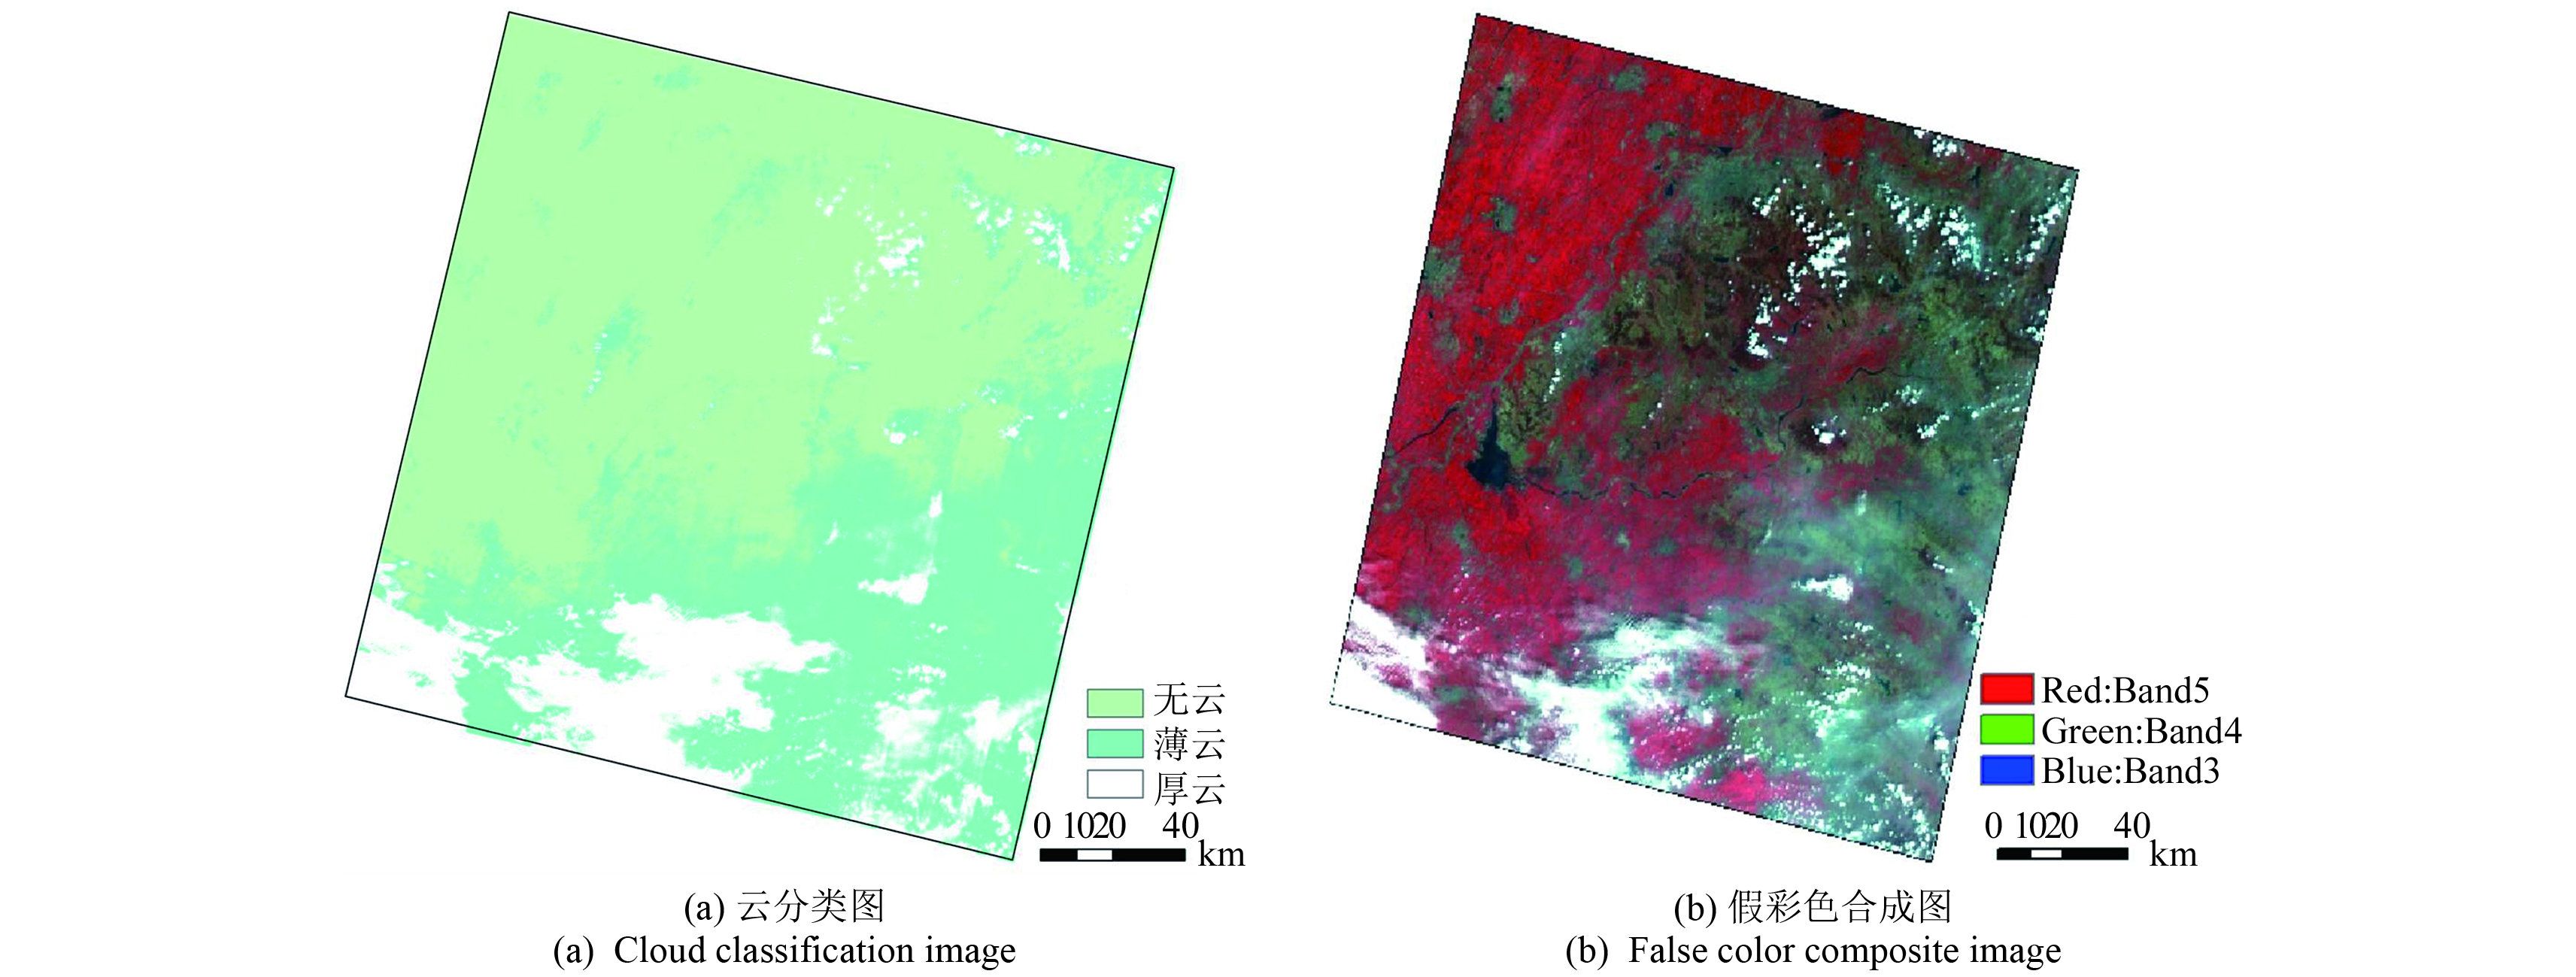
由式(1)获取各像元的云指数(CI),范围在0—0.985之间,平均值0.002,CI值大的像元为云,头文件中云覆盖率为44.77%,由此确定云覆盖像元的比例为44.77%,按照CI值由大到小选取这部分像元,确定无云区与有云区的阈值为0.00047,即CI值高于0.00047的像元比例约为44.77%。考虑云影由厚云导致,目前对于厚云与薄云的界限仍没有明确标准,经目视识别和统计分析发现能产生阴影的云指数为0.0011,将其作为薄云与厚云的阈值(图 1)。需说明的是,由于云高度不同,低云之上也可能存在高云的阴影,此处将其归为云。由此分为无云、薄云和厚云,如图 3可以看出,厚云区包括了图 3(b)中肉眼可见的全部云区且范围有所扩大,占全景面积的14.11%。
3.2 云影检测结果分析
根据2.2中的方法,无云和薄云区的NDPI在-0.632—0.873之间,平均值0.250,采用阈值法确定暗像元的NDPI > 0.5,包括水体、阴影及湿润耕地等,像元比例为全景的13.08%。
暗像元的RSI为0.289—1.019,平均值0.424。水体的RSI最大,其次为阴影,RSI > 0.76可确定为水体,RSI ≤ 0.45可确定为非阴影,两值之间为潜在云影( 图 1),包含云影和部分易混淆的水体。
需指出的是,山体阴影所占比例很小,而且其RSI小于云影,楼体阴影多与其他地物混合,在中分辨率影像上表现不明显,其RSI亦远小于云影,因而在此将这两类阴影归为非阴影。
按照方位角和搜索距离进行方位搜索,将999281像元的阴影区分为云影和水体,像元数分别为574931和424350,如图 4,可以看出,云影与厚云的相对关系得以很好体现,水体也明显区分。

3.3 方法验证分析
为验证本方法的可行性,选择2015-07-12日Path124/Row40的影像作为验证影像,CI 为0—0.243,头文件中云覆盖率为13.92%,按照 CI 高值进行统计,确定有云区与无云区的阈值为0.0048,本景的云类型为低层碎积云,多为能形成阴影的厚云,薄云比例极小,未再细分。无云区的NDPI在-0.640—0.992之间,平均值0.351,暗像元的阈值仍确定为0.5,暗像元的 RSI 范围为0.283—2.473,平均值0.742,由于本景影像地理位置偏南,且为夏季,植被覆盖好,使得RSI 偏小,非阴影与阴影之间的阈值调整为0.36,水体的阈值仍为 RSI > 0.76,成像时的太阳高度角为102.176°,搜索方位角也设为102.176°,搜索距离为270—800 m,结果如图 5,可以看出,同样表现出了云影与云的相对关系,水体区分完整,与图 4表现特征一致,说明本方法可行。

3.4 检测结果精度分析
为定量化分析检测精度,对试验影像和验证影像的厚云、云影、水体等各类分别随机取200个样点进行精度验证,同时为比较检测效果,还对试验影像进行了监督分类,结果如表 3。
表 3 典型类别检测结果的混淆矩阵
Table 3 Confusion matrix of the detection results of typical types
| (a) 试验影像监督分类结果的混淆矩阵 | ||||||
| (a) Confusion matrix of supervised classification results of test image | ||||||
| 验证样点真实类别 | ||||||
| 类别 | 厚云1 | 水体(2+3) | 云影4 | 其他类5 | 总和 | 用户精度/% |
| 1 | 200 | 0 | 0 | 0 | 200 | 100.00 |
| 2+3 | 0 | 146 | 51 | 3 | 200 | 73.00 |
| 4 | 0 | 85 | 101 | 14 | 200 | 55.50 |
| 5 | 22 | 5 | 6 | 167 | 200 | 83.50 |
| 总和 | 222 | 236 | 158 | 184 | 800 | |
| 制图精度/% | 90.09 | 61.86 | 63.92 | 90.76 | 总体精度76.75 | |
表 4 (b)试验影像本文方法检测结果的混淆矩阵
Table 4 (b)Confusion matrix of detection results of test image by methods in this paper
| 验证样点真实类别 | ||||||||
| 类别 | 1 | 2 | 3 | 4 | 5 | 其他 | 总和 | 用户精度/% |
| 1 | 198 | 0 | 0 | 0 | 0 | 2 | 200 | 99.00 |
| 2 | 0 | 200 | 0 | 0 | 0 | 0 | 200 | 100.00 |
| 3 | 0 | 0 | 186 | 2 | 12 | 0 | 200 | 93.00 |
| 4 | 0 | 0 | 6 | 190 | 1 | 3 | 200 | 95.00 |
| 5 | 0 | 0 | 2 | 4 | 194 | 0 | 200 | 97.00 |
| 总和 | 198 | 200 | 194 | 196 | 207 | 7 | 1000 | |
| 制图精度/% | 100 | 100 | 95.88 | 96.94 | 93.72 | 总体精度 96.80 | ||
表 5 (c)验证影像本文方法检测结果的混淆矩阵
Table 5 (c)Confusion matrix of detection results of validation image by methods in this paper
| 验证样点真实类别 | ||||||||
| 类别 | 1 | 2 | 3 | 4 | 5 | 其他 | 总和 | 用户精度/% |
| 1 | 199 | 0 | 0 | 0 | 0 | 1 | 200 | 99.50 |
| 2 | 0 | 200 | 0 | 0 | 0 | 0 | 200 | 100.00 |
| 3 | 0 | 0 | 196 | 0 | 4 | 0 | 200 | 98.00 |
| 4 | 0 | 0 | 0 | 199 | 1 | 0 | 200 | 99.50 |
| 5 | 0 | 0 | 5 | 3 | 189 | 3 | 200 | 94.50 |
| 总和 | 199 | 200 | 201 | 202 | 194 | 4 | 1000 | |
| 制图精度/% | 100 | 100 | 97.51 | 98.51 | 97.42 | 总体精度 98.30 | ||
| 注:1—厚云;2—RSI>0.76确定的水体;3—方位搜索后的水体;4—云影;5—其他暗像元;其他—难确定类别的像元,为混合像元;总体分类精度—被正确分类的像元总和除以总像元数;制图精度—假定地表真实为A类,分类器能将一幅图像的像元归为A的概率;用户精度——假定分类器将像元归到A类时,相应的地表真实类别是A的概率。 | ||||||||
从表 3中看出,本方法识别厚云的用户精度分别达到99%和99.5%,制图精度达到100%,说明OLI的B9为云检测提供了有力支持,精度极大提高,传统的监督分类厚云的用户精度虽然可达到100%,但制图精度只为90.09%,有近10%的漏分误差,总体而言,本方法对厚云的识别优于监督分类。Man等(2015)利用光谱间差异规则和空间变异性对Landsat 8影像云的检测精度达到99.89%,本文的结果与此一致,为云影检测提供了质量保证。
云影的检测精度大为提高,用户精度分别为95%和99.5%,制图精度也达到96.94%和98.51%;验证影像的精度高于试验影像,究其原因在于前者的云类型简单,基本都为厚云,且云的高度差异小;由于云影最易与水体和其他暗像元混淆,而本方法的水体与其他暗像元的用户精度均超过93%,试验影像中水体和其他暗像元错分为云影的比例分别为1%和2%,验证影像中为1.5%;而监督分类中水体和云影的精度都在55.5%—73%,漏分率和错分率都很高,说明本方法能有效将云影与水体等其他暗像元区分。Zhu和Woodcock(2012)采用Fmask算法基于TM/ETM近红外波段得出潜在云影区的基础上,运用云影与云的方位关系及形状相似性进行匹配,最终结果表明,云影的制图精度和用户精度分别超过70%和50%;Goodwin等人(2013)基于多时相TM/ETM的近红外和中红外波段提取潜在云影区后,综合考虑太阳方位角、观测角、云顶高度确定云影,制图精度和用户精度分别为90%和62%。
与已有的相关研究相比,本方法在采用阈值法确定潜在阴影的基础上,利用云影与云的相对关系确定云影,思路相似,对于云影的检测效果有较大改善,而且几何关系模型的简化使运算量减少,表现出仅靠阈值法所不具备的优势。
4 结 论
针对单景OLI影像,通过云指数、暗像元指数和比值阴影指数,采用阈值法和方位搜索法,可快速检索出云及云影,对OLI影像中厚云的正确识别率可达到99%,对易混淆的云影与水体识别精度都超过95%。流程简单,只要计算出相应参数,调整相应阈值,阈值的设置并不需很严格,将可能的云影像元都可归为潜在云影,利用简单方位搜索进行确定,弥补了仅靠阈值法难以对云影精确分类的缺陷(Simpson和Stitt,1998),能有效提高OLI影像的后续利用价值和精度。
但需注意,错分的像元除发生在云影与水体、其他暗像元之间,还表现在混合像元,如表 3中的“其他”类,可能为水体与云及云影的叠合、云与云影的叠合、生长植被的水体、湿润的耕地尤其水田等,本身就难于归类。另外,同一景影像中云的高度差异大,导致其云影与云的水平距离差别也大,误判的可能性就大。因此,搜索距离的设置和混合像元的归类及边界界定应是今后改进的方向。
参考文献(References)
-
Chai Y, He Y, Qu C W.2010.Remote sensing image fusion using MGA based on cloud and shadow distance model. Journal of Image and Graphics, 15 : 1398–1405. ( 柴勇, 何友, 曲长文. 2010. 基于云影距离模型的遥感图像多尺度融合算法. 中国图象图形学报, 15 : 1398–1405. )
-
Choi H, Bindschadler R.2004.Cloud detection in Landsat imagery of ice sheets using shadow matching technique and automatic normalized difference snow index threshold value decision. Remote Sensing of Environment, 91 : 237–242. DOI: 10.1016/j.rse.2004.03.007.
-
Goodwin N R, Collett L J, Denham R J, Flood N, Tindall D.2013.Cloud and cloud shadow screening across Queensland, Australia: an automated method for Landsat TM/ETM+ time series. Remote Sensing of Environment, 134 : 50–65. DOI: 10.1016/j.rse.2013.02.019.
-
Hagolle O, Huc M, Pascual D V, Dedieu G.2010.A multi-temporal method for cloud detection, applied to FORMOSAT-2, VENμS, LANDSAT and SENTINEL-2 images. Remote Sensing of Environment, 114 : 1747–1755. DOI: 10.1016/j.rse.2010.03.002.
-
Jin S M, Homer C, Yang L M, Xian G, Fry J, Danielson P, Townsend P A.2013.Automated cloud and shadow detection and filling using two-date Landsat imagery in the USA. International Journal of Remote Sensing, 34 : 1540–1560. DOI: 10.1080/01431161.2012.720045.
-
Le Hégarat-Mascle S, André C.2009.Use of Markov Random Fields for automatic cloud/shadow detection on high resolution optical images. ISPRS Journal of Photogrammetry and Remote Sensing, 64 : 351–366. DOI: 10.1016/j.isprsjprs.2008.12.007.
-
Li C Y, Liu L Y, Wang J H, Song X Y, Wang R C.2006.Automatic detection and removal of thin haze based on own features of Landsat image. Journal of Zhejiang University (Engineering Science), 40 : 10–13,37. ( 李存军, 刘良云, 王纪华, 宋晓宇, 王人潮. 2006. 基于Landsat 影像自身特征的薄云自动探测与去除. 浙江大学学报(工学版), 40 : 10–13,37. )
-
Lin C H, Lin B Y, Lee K Y, Chen Y C.2015.Radiometric normalization and cloud detection of optical satellite images using invariant pixels. ISPRS Journal of Photogrammetry and Remote Sensing, 106 : 107–117. DOI: 10.1016/j.isprsjprs.2015.05.003.
-
Liu C B, Hu J B, Lin Y, Wu S H, Huang W.2011.Haze detection, perfection and removal for high spatial resolution satellite imagery. International Journal of Remote Sensing, 32 : 8685–8697. DOI: 10.1080/01431161.2010.547884.
-
Lu D.2007.Detection and substitution of clouds/hazes and their cast shadows on IKONOS images. International Journal of Remote Sensing, 28 : 4027–4035. DOI: 10.1080/01431160701227703.
-
Luo Y, Trishchenko A P, Khlopenkov K V.2008.Developing clear-sky, cloud and cloud shadow mask for producing clear-sky composites at 250-meter spatial resolution for the seven MODIS land bands over Canada and North America. Remote Sensing of Environment, 112 : 4167–4185. DOI: 10.1016/j.rse.2008.06.010.
-
(Man D C, Luu V H, Hoang V T, Bui Q H and Nguyen T N T. 2015. Cloud detection algorithm for Landsat 8 image using multispectral rules and spatial variability//Knowledge and Systems Engineering. Switzerland: Springer International Publishing: 247–259 [DOI: 10.1007/978-3-319-11680-8_20])
-
Ri P, Ma Z B, Qi Q W, Liu G H.2010.Cloud and shadow removal from Landsat TM data. Journal of Remote Sensing, 14 : 534–545. DOI: 10.11834/jrs.20100311. ( 李炳燮, 马张宝, 齐清文, 刘高焕. 2010. Landsat TM遥感影像中厚云和阴影去除. 遥感学报, 14 : 534–545. DOI: 10.11834/jrs.20100311. )
-
Richter R, Müller A.2005.De-shadowing of satellite/airborne imagery. International Journal of Remote Sensing, 26 : 3137–3148. DOI: 10.1080/01431160500114664.
-
Shahtahmassebi A, Yang N, Wang K, Moore N, Shen Z Q.2013.Review of shadow detection and de-shadowing methods in remote sensing. Chinese Geographical Science, 23 : 403–420. DOI: 10.1007/s11769-013-0613-x.
-
Simpson J J, Stitt J R.1998.A procedure for the detection and removal of cloud shadow from AVHRR data over land. IEEE Transactions on Geoscience & Remote Sensing, 36 : 880–897.
-
(Song M J and Civco D L. 2002. A knowledge-based approach for reducing cloud and shadow//Proceedings of the 2002 ASPRS-ACSM Annual Conference and FIG XXⅡ Congress. Washington, DC)
-
Tian Y J, Xue C J.2007.Detection and removal of clouds and their shadows from remote sensing images. Journal of Earth Sciences and Environment, 29 : 300–303. ( 田养军, 薛春纪. 2007. 遥感影像云团和云影检测与去除. 地球科学与环境学报, 29 : 300–303. )
-
Zhang B, Ji M H, Shen Q.2011.Wavelet-based cloud removal from high-resolution remote sensing data: an experiment with QuickBird imagery. Remote Sensing Information : 38–43. DOI: 10.3969/j.issn.1000-3177.2011.03.007. ( 张波, 季民河, 沈琪. 2011. 基于小波变换的高分辨率快鸟遥感图像薄云去除. 遥感信息 : 38–43. DOI: 10.3969/j.issn.1000-3177.2011.03.007. )
-
Zhang Y, Guindon B, Cihlar J.2002.An image transform to characterize and compensate for spatial variations in thin cloud contamination of Landsat images. Remote Sensing of Environment, 82 : 173–187. DOI: 10.1016/S0034-4257(02)00034-2.
-
Zhu Z, Woodcock C E.2012.Object-based cloud and cloud shadow detection in Landsat imagery. Remote Sensing of Environment, 118 : 83–94. DOI: 10.1016/j.rse.2011.10.028.
-
Zhu Z, Wang S X, Woodcock C E.2015.Improvement and expansion of the Fmask algorithm: cloud, cloud shadow, and snow detection for Landsats 4-7, 8, and Sentinel 2 images. Remote Sensing of Environment, 159 : 269–277. DOI: 10.1016/j.rse.2014.12.014.