收稿日期: 2016-11-15
土壤含水量作为研究参数在农业、气象、灾害监测等多个学科领域中起着重要作用,其中山地土壤含水量可用于植被生长监测、滑坡预测、山火预警等方面。由于山区地形的复杂性,连续多次地大范围实地考察并不现实,目前经济可行的方式之一为采用遥感图像对山区土壤含水量进行测量。考虑到合成孔径雷达(SAR)具有不受天气影响、穿透能力较强、对含水量敏感等特性,所以通常采用SAR来监测大面积土壤含水量(Ulaby 等,1996;Shi 等,1997;Alvarez-Mozos 等,2006;鲍艳松 等,2007;杨立娟 等,2011)。
山地地表一般有植被覆盖,因此山地区域的土壤含水量估计需要去除植被的影响。对SAR图像而言,主要包括两方面问题,其一是对于山区测量,由于SAR成像方式为侧向扫描式,会引起图像包括透视收缩、叠掩、阴影等几何形变问题以及极化旋转问题(Lee 等,2002);其二是地表植被会降低微波对土壤含水量的敏感性(Said 等,2012)。因为雷达后向散射系数不仅受地表含水量影响,还受植被形状、类型、密度等影响(Jackson和Schmugge,1991;Chen 等,2010;Moran 等,2012;Jagdhuber 等,2013),所以山地植被区域土壤含水量估计目前仍然是一个棘手的问题。
大部分植被覆盖地表土壤含水量估计方法主要以植被散射模型为基础,常用的散射模型包括水云模型(Attema和Ulaby,1978)和密西根模型(Ulaby 等,1988)。前者为基于简化植被散射机制的半经验模型,适用于单一均匀的植被区域;后者为基于辐射传输方程理论的散射模型,在已知确定植被特征参数条件下,能够基本准确的得到对应的后向散射系数,可用于复杂多样的植被区域。针对低矮植被覆盖区域,各学者提出了许多土壤含水量反演方法。如刘伟等人(2005)采用简化裸露地表模型及水云模型反演农作物区域土壤含水量;Rahman等人(2008)基于IEM模型和ASAR数据反演了稀疏植被区域土壤含水量;Gherboudj等人(2011)利用Radarsat-2数据反演小麦等农作物的土壤含水量;另外丁建丽和姚远(2013)、谢凯鑫等人(2016)分别针对干旱区稀疏植被区和高原牧草覆盖区提出了不同的土壤含水量方法。然而,受限于山区复杂地形及植被多样性等原因,山地低矮植被的土壤含水量反演目前研究还比较少。
针对山区低矮植被覆盖区域土壤含水量反演的需求,本文基于山区SAR图像成像特征和低矮植被散射模型提出了一种适用于山区的土壤含水量估计方法,并通过实测结果对模型进行了验证,为山区土壤含水量的监测提供了一种有效的方法。
2、山地区域SAR数据处理 (2.1) 可测区域选取由于SAR系统的成像方式为侧向扫描式,因此会出现图像形变现象。对于山区地形而言,会出现特有的几何形变情况,主要包括透视收缩、叠掩和阴影。为了便于说明,本文约定面向入射波的区域为向坡,背向入射波的区域为背坡。
透视收缩和叠掩主要发生在向坡区域。透视收缩表明对应区域投影到图像上会出现收缩现象,即与平地上相同地物的图像相比,图像表现更亮。此现象可能导致山顶和山脚两处回波叠加到图像同一点,从而不能被区分;叠掩表明对于某些区域,面向入射波较高区域的回波信息相较于较低区域的回波优先被雷达接收,导致较高区域的回波特征被较低处替换。这两种现象目前很难区分开来,并且也很难从这些区域提取信息,因此本算法暂时不考虑向坡区域。
阴影发生在背坡区域,这种现象是由于较高的地物阻挡了入射波,对应为没被入射波照射到的区域,不包含任何雷达信息。综上所述,本算法只考虑不包含阴影的背坡区域,称之为可测区域。
假设目标坡度
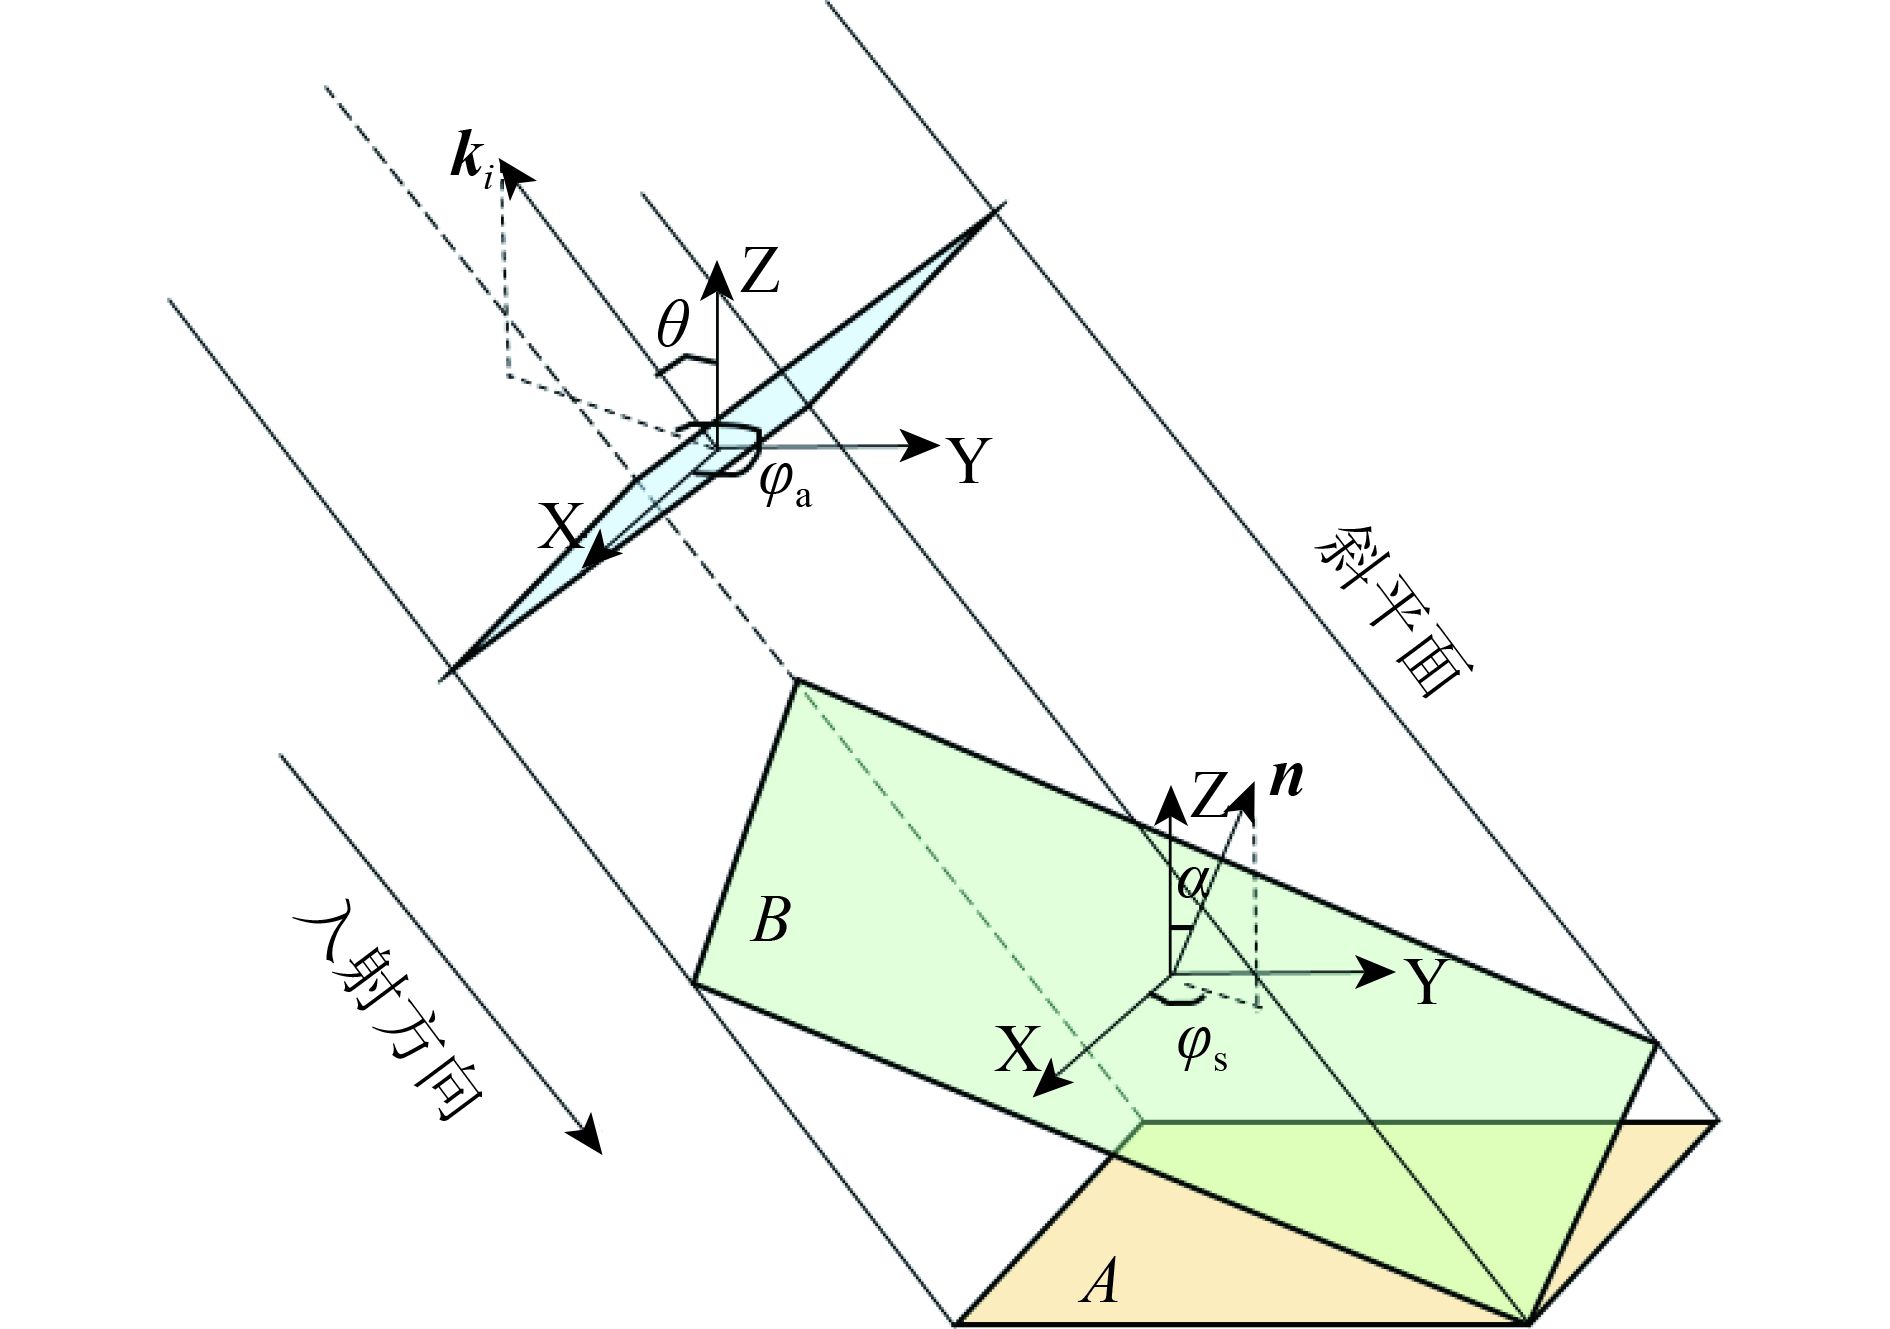
| ${\mathit{\boldsymbol{k}}_i} = \sin \theta \cos {\varphi _{\rm{a}}}\mathit{\boldsymbol{x}} + \sin \theta \sin {\varphi _{\rm{a}}}\mathit{\boldsymbol{y}} + {\rm{cos}}\theta \mathit{\boldsymbol{z}}$ | (1) |
| $\mathit{\boldsymbol{n}} = \sin \alpha \cos {\varphi _{\rm{s}}}\mathit{\boldsymbol{x}} + \sin \alpha \sin {\varphi _{\rm{s}}}\mathit{\boldsymbol{y}} + {\rm{cos}}\alpha \mathit{\boldsymbol{z}}$ | (2) |
考虑到可能引入的误差,根据入射波和坡向的关系,本方法区分向坡和背坡的定义如下
| $\left\{ {\begin{array}{*{20}{c}}{{\text{背坡}},} & {{\rm{ }}\displaystyle\frac{{19}}{{36}}{\text{π}} \leqslant \left| {{\varphi _{\rm{s}}} - {\varphi _{\rm{a}}}} \right| \leqslant \displaystyle\frac{{53}}{{36}}{\text{π}}}\\[7pt]{{\text{向坡}},} & {{\text{其他}}}\end{array}} \right.$ | (3) |
背坡本地入射角β可以由下式得到
| $\beta = \arccos \left( {{\mathit{\boldsymbol{k}}_i} \cdot \mathit{\boldsymbol{n}}} \right)$ | (4) |
根据阴影产生原理,对应于非阴影区域的本地入射角必须满足条件
综上所述,可测区域定义为背向入射波区域并且本地入射角满足条件
假设分布式目标被一平面波Ei照射,总散射场为Es,则后向散射系数可以由下式得到
| $\sigma _{{\rm{pq}}}^0 = \frac{{4{\text{π}}{r^2}}}{A} \cdot \frac{{\left\langle {{{\left| {\mathit{\boldsymbol{E}}_{\rm{p}}^{\rm{s}}} \right|}^2}} \right\rangle }}{{{{\left| {\mathit{\boldsymbol{E}}_{\rm{q}}^{\rm{i}}} \right|}^2}}}$ | (5) |
式中,p、q表示H、V极化,r表示分布式目标与观测点的距离,A表示照射区域面积。
对山区地形而言,被照射地区面积随着地形的不同而改变,因此需要对后向散射系数进行校正。
假设被照射目标位于背坡,A为水平面照射面积,B为实际照射面积(图1)。其中各向量定义与前文相同,则斜平面单位面积即可用
| ${\sigma _{{\rm{pq}}}^{0}}' = \frac{A}{B}\sigma _{{\rm{pq}}}^0 = \frac{{{\mathit{\boldsymbol{k}}_i} \cdot \mathit{\boldsymbol{n}}}}{{{\mathit{\boldsymbol{k}}_i} \cdot \mathit{\boldsymbol{z}}}}\sigma _{{\rm{pq}}}^0$ | (6) |
|
| 图 1 倾斜地形照射面积示意图 Figure 1 The sketch map of the irradiated area on a tilted terrain |
对于倾斜或不平的地面,散射波水平极化方向可能不平行于水平平面,垂直极化方向也可能不在入射波平面内,从而导致极化旋转问题。
对于任意平面波E,基于局部坐标系
| $\mathit{\boldsymbol{E}} = \left( {\mathit{\boldsymbol{h}}{E_{\rm{h}}} + \mathit{\boldsymbol{v}}{E_{\rm{v}}}} \right){{\rm{e}}^{ - j{k_0}\mathit{\boldsymbol{kR}}}}$ | (7) |
| $\begin{aligned}& \quad\quad \mathit{\boldsymbol{h}} = \frac{{z \times \mathit{\boldsymbol{k}}}}{{\left| {z \times \mathit{\boldsymbol{k}}} \right|}} = - \sin {\varphi _{\rm{a}}}\mathit{\boldsymbol{x}} + \cos{\varphi _{\rm{a}}}\mathit{\boldsymbol{y}}\\& \mathit{\boldsymbol{v}} = \mathit{\boldsymbol{h}} \times \mathit{\boldsymbol{k}} = \cos \theta \cos {\varphi _{\rm{a}}}\mathit{\boldsymbol{x}} + {\rm{cos}} \theta \sin {\varphi _{\rm{a}}}\mathit{\boldsymbol{y}} - \sin \theta \mathit{\boldsymbol{z}}\end{aligned}$ | (8) |
式中,h、v表示水平与垂直单位向量,Eh、Ev表示沿着h、v方向的复值振幅,k0表示波数,k表示入射波传播方向的单位向量,R表示标准球面坐标系
假设n为倾斜平面的法向量,则此地面的水平和垂直单位向量可以由下式得到
| ${\mathit{\boldsymbol{h}}_{\rm{n}}} = \frac{{\mathit{\boldsymbol{n}} \times \mathit{\boldsymbol{k}}}}{{\left| {\mathit{\boldsymbol{n}} \times \mathit{\boldsymbol{k}}} \right|}},\;\;{\mathit{\boldsymbol{v}}_{\rm{n}}} = {\mathit{\boldsymbol{h}}_{\rm{n}}} \times \mathit{\boldsymbol{k}}$ | (9) |
从而E沿着hn和vn方向的复值振幅Ehn和Evn为
| $\left[ {\begin{array}{*{20}{c}}{{E_{{\rm{hn}}}}}\\[5pt]{{E_{{\rm{vn}}}}}\end{array}} \right] = \left[ {\begin{array}{*{20}{c}}{{\mathit{\boldsymbol{h}}_{\rm{n}}} \cdot \mathit{\boldsymbol{h}}} & {{\mathit{\boldsymbol{h}}_{\rm{n}}} \cdot \mathit{\boldsymbol{v}}}\\[5pt]{{\mathit{\boldsymbol{v}}_{\rm{n}}} \cdot \mathit{\boldsymbol{h}}} & {{\mathit{\boldsymbol{v}}_{\rm{n}}} \cdot \mathit{\boldsymbol{v}}}\end{array}} \right]\left[ {\begin{array}{*{20}{c}}{{E_{\rm{h}}}}\\[5pt]{{E_{\rm{v}}}}\end{array}} \right]$ | (10) |
根据式(10)重写散射场Es,以hh极化为例,表达式为
| $\frac{{{{\left| {\mathit{\boldsymbol{E}}_{{\rm{hn}}}^{\rm{s}}} \right|}^2}}}{{{{\left| {\mathit{\boldsymbol{E}}_{\rm{h}}^{\rm{i}}} \right|}^2}}} = \frac{{{{\left| {{\mathit{\boldsymbol{h}}_{\rm{n}}} \cdot \mathit{\boldsymbol{h}}E_{\rm{h}}^{\rm{s}} + {\mathit{\boldsymbol{h}}_{\rm{n}}} \cdot \mathit{\boldsymbol{v}}E_{\rm{v}}^{\rm{s}}} \right|}^2}}}{{{{\left| {E_{\rm{h}}^{\rm{i}}} \right|}^2}}}$ | (11) |
将上式代入式(5)和式(6)并经过变形后可得到
| $\begin{aligned}{\sigma _{{\rm{hh}}}^{0}}'' = & {\left| {{\mathit{\boldsymbol{h}}_{\rm{n}}} \cdot \mathit{\boldsymbol{h}}} \right|^2}{\sigma _{{\rm{hh}}}^{0}}' + {\left| {{\mathit{\boldsymbol{h}}_{\rm{n}}} \cdot \mathit{\boldsymbol{v}}} \right|^2}{\sigma _{{\rm{vh}}}^{0}}' + \\ &2\left| {{\mathit{\boldsymbol{h}}_{\rm{n}}} \cdot \mathit{\boldsymbol{h}}} \right|\left| {{\mathit{\boldsymbol{h}}_{\rm{n}}} \cdot \mathit{\boldsymbol{v}}} \right|\sqrt {{\sigma _{{\rm{hh}}}^{0}}'{\sigma _{{\rm{vh}}}^{0}}'} \end{aligned}$ | (12) |
式中,
类似地,对于其他极化方式后向散射系数可通过相似方法进行校正。
3、低矮植被区域土壤含水量估计模型考虑到山区植被的多样性和复杂性,本文低矮植被散射模型主要基于密西根模型改进。低矮植被区域土壤含水量估计方法主要分为3步。理论上,每种极化类型后向散射系数都可由散射矩阵确定。因此首先需要确立低矮植被区的散射模型(Ulaby 等,1988)。散射模型由两部分构成,一部分是假定地面为光滑的镜面反射平面,散射强度来自于植被;另一部分散射强度直接来自于实际粗糙地面,最后结合两部分确定总散射强度。其次,需要研究土壤含水量对散射矩阵的影响,即是研究在一定条件下通过散射矩阵提取土壤含水量的方法。最后,建立土壤含水量和后向散射系数的关系。
(3.1) 低矮植被散射模型以HH极化为例,基于传输矩阵的后向散射系数可由下式得到
| $\sigma _{\rm{hh}}^0 = 4{\text{π}}{\left[ {{\mathit{\boldsymbol{T}}_{\rm{v}}}\left( {\theta ,\phi } \right) + {\mathit{\boldsymbol{T}}_{\rm{g}}}\left( \theta \right)} \right]_{22}}\cos \theta $ | (13) |
式中,
低矮灌木植被通常由叶子和枝干构成,本研究分别用圆盘和圆柱模拟。假设叶子数量为Nd,枝干数量为Nc,则P由下式求得
| $\mathit{\boldsymbol{P}} = {N_{\rm{d}}}\int {{f_{\rm{d}}}\left( {{\mathit{\boldsymbol{x}}_{\rm{d}}}} \right)\mathit{\boldsymbol{L}}({\mathit{\boldsymbol{x}}_{\rm{d}}})} {\rm{d}}{\mathit{\boldsymbol{x}}_{\rm{d}}} + {N_{\rm{c}}}\int {{f_{\rm{c}}}\left( {{\mathit{\boldsymbol{x}}_{\rm{c}}}} \right)\mathit{\boldsymbol{L}}({\mathit{\boldsymbol{x}}_{\rm{c}}})} {\rm{d}}{\mathit{\boldsymbol{x}}_{\rm{c}}}$ | (14) |
式中,fd和fc分别表示圆盘和圆柱的联合概率密度函数;xd和xc分别表示与叶子或枝干有关的特征向量,如叶子维度、叶子方向、枝干长度等;L为改进的Stokes矩阵,其每个元素为与叶子或枝干有关的散射矩阵。其中叶子的散射矩阵基于一个厚度均匀的薄平面的非磁性介质材料求得(Senior 等,1987;Sarabandi 等,1988),枝干的散射矩阵基于一个有限圆柱体光滑电介质圆柱求得(Karam和Fung,1988;Senior和Sarabandi,1990)。
基于改进Stokes矩阵和Foldy逼近方法(Lin和Sarabandi,1999),通过计算沿着传输方向的平均场可以求得消光矩阵κ。
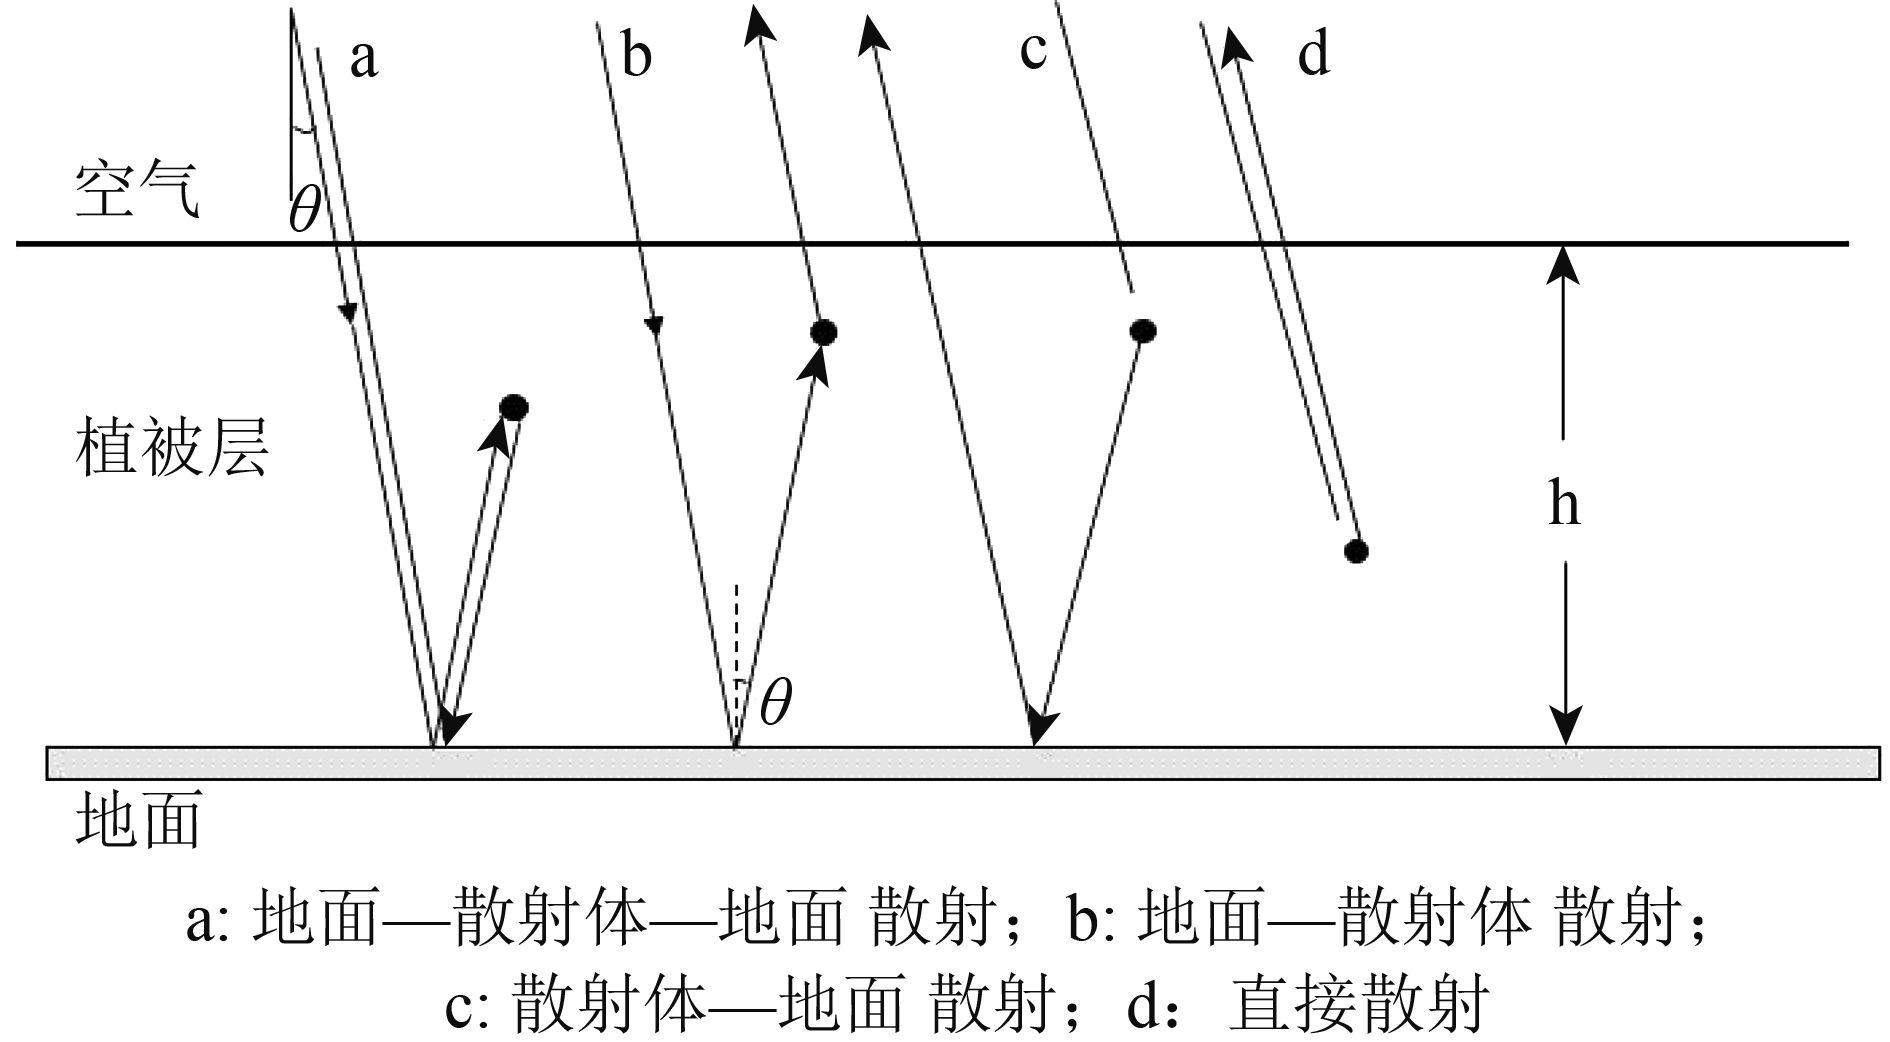
3.1.1. 低矮植被传输矩阵求解方法对于均匀的低矮植被,总散射功率主要由4个分量构成(图2),即地面—散射体—地面散射;地面—散射体散射;散射体—地面散射;直接散射。假设不考虑散射体中多次散射情况,则总散射功率可以简单的由4分量相加得到。
|
| 图 2 低矮植被散射模型 Figure 2 The scattering model for low vegetation |
根据辐射传输模型的一阶解,
| $\begin{aligned}{\mathit{\boldsymbol{T}}_{\rm{v}}}\left( {\theta ,\phi } \right) = & \frac{1}{u}{{\rm{e}}^{ - {\mathit{\boldsymbol{\kappa }} ^ + }h/u}}\mathit{\boldsymbol{R}}\left( {u,\phi + {\text{π}}} \right)\mathit{\boldsymbol{Q}}\left( { - u,\phi + {\text{π}} } \right)\\ &{\mathit{\boldsymbol{A}}_1}{\mathit{\boldsymbol{Q}}^{ - 1}}\left( {u,\phi } \right)\mathit{\boldsymbol{R}}\left( {u,\phi } \right){{\rm{e}}^{ - {\mathit{\boldsymbol{\kappa }} ^ - }h/u}} + \\ &\frac{1}{u}\mathit{\boldsymbol{Q}}\left( {u,\phi + {\text{π}} } \right){\mathit{\boldsymbol{A}}_2}{\mathit{\boldsymbol{Q}}^{ - 1}}\left( {u,\phi } \right)\mathit{\boldsymbol{R}}\left( {u,\phi } \right){{\rm{e}}^{ - {\mathit{\boldsymbol{\kappa }} ^ - }h/u}} + \\ &\frac{1}{u}{{\rm{e}}^{ - {\mathit{\boldsymbol{\kappa }} ^ + }h/u}}\mathit{\boldsymbol{R}}\left( {u,\phi + {\text{π}} } \right)\mathit{\boldsymbol{Q}}\left( { - u,\phi +{\text{π}}} \right){\mathit{\boldsymbol{A}}_3}{\mathit{\boldsymbol{Q}}^{ - 1}}\left( { - u,\phi } \right) + \\ &\frac{1}{u}\mathit{\boldsymbol{Q}}\left( {u,\phi + {\text{π}}} \right){\mathit{\boldsymbol{A}}_4}{\mathit{\boldsymbol{Q}}^{ - 1}}\left( { - u,\phi } \right)\end{aligned}$ | (15) |
式中,
电磁波从植被层到地表,经过后向散射后再从粗糙地表到植被层的传播用
| ${\mathit{\boldsymbol{T}}_{\rm{g}}}\left( \theta \right) = {{\rm{e}}^{ - {\mathit{\boldsymbol{\kappa }}^ + } + h/u}}\mathit{\boldsymbol{D}}\left( \theta \right){{\rm{e}}^{ - {\mathit{\boldsymbol{\kappa }}^ - } - h/u}}$ | (16) |
式中,
散射矩阵与材质的介电常数有关。在材质形状、密度、大小保持不变的情况下,介电常数只与体积含水量有关。
定义土壤的介电常数为
| $\varepsilon = \varepsilon ' - j\varepsilon ''$ | (17) |
实部与虚部可写为
| $\begin{array}{*{20}{c}}\begin{aligned}{\varepsilon _0} = & \left( {{a_0} + {a_1}S + {a_2}C} \right) + \\ &\left( {{b_0} + {b_1}S + {b_2}C} \right){m_{\rm{v}}} + \\ &\left( {{c_0} + {c_1}S + {c_2}C} \right)m_{\rm{v}}^2,\end{aligned} & {{\varepsilon _0} = \varepsilon '{\text{或}}\varepsilon ''}\end{array}$ | (18) |
式中,mv为土壤体积含水量,S和C为细沙和粘土在土壤中占的百分比。多项式系数
对植被而言,不同的土壤含水量对植被本身的含水量影响非常小,另外在植被成熟期其特征参数如形状大小等基本保持不变。对山区土壤而言,在很长一段时间内土壤成分、表面粗糙度等也都几乎保持不变。因此可以说在一定时期内植被的散射矩阵是基本不变的,而土壤的散射矩阵变化是由土壤含水量变化造成的。
基于以上分析,假设已知确定某区域植被和土壤的特征量,那么此区域的含水量就可以从对应的后向散射系数中估计得到。
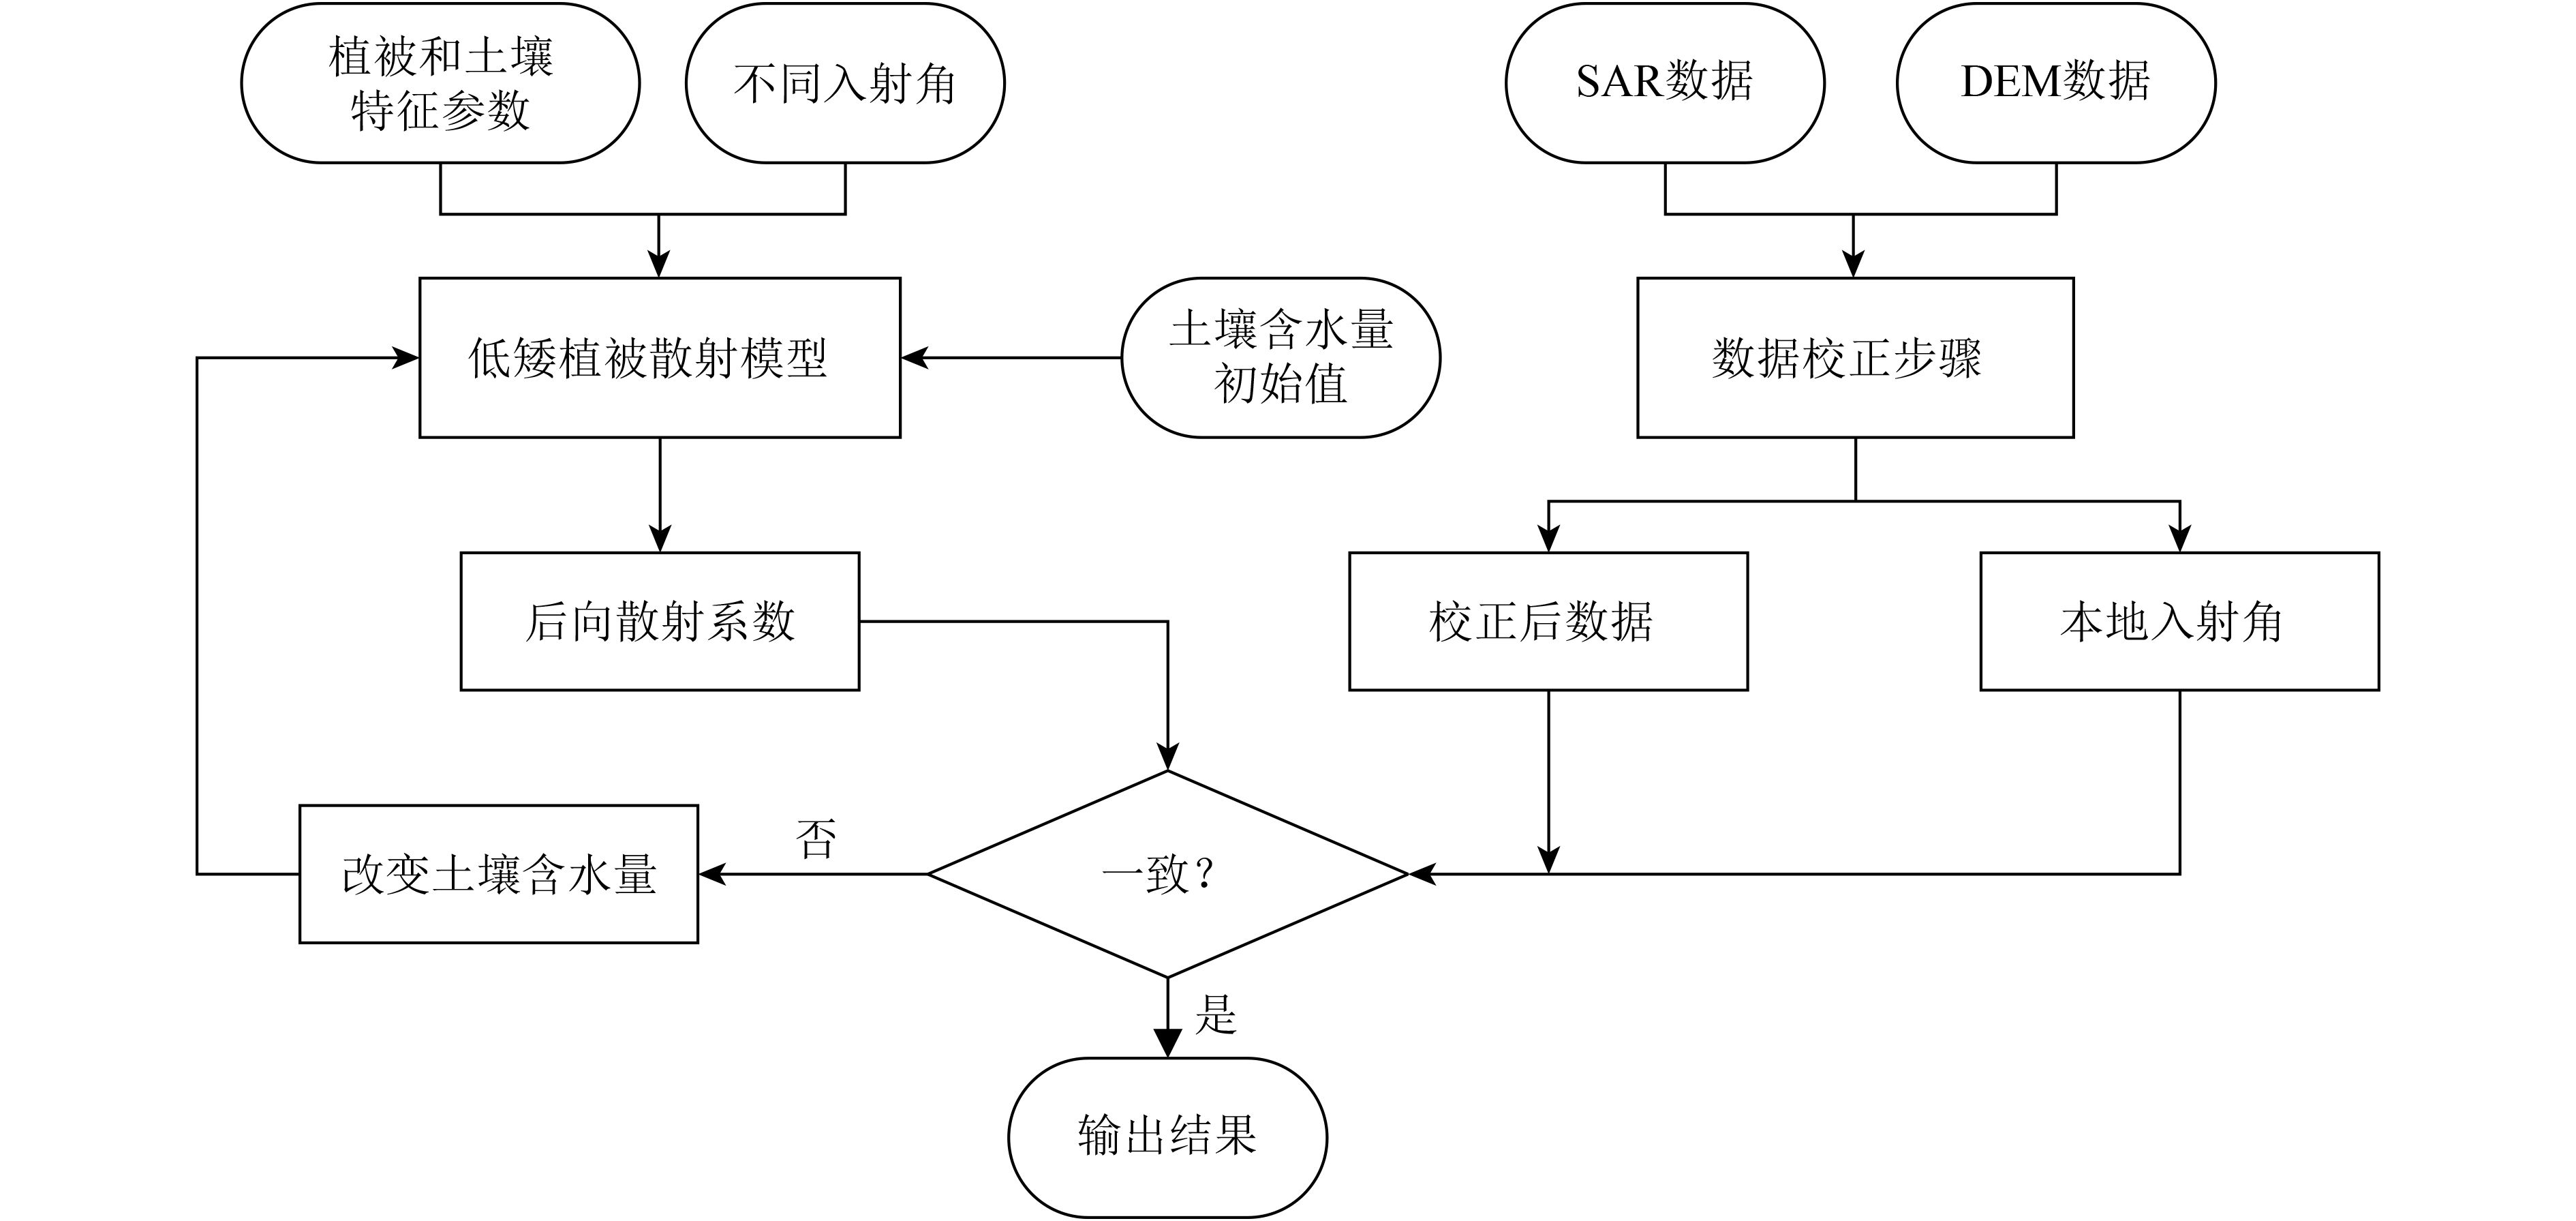
在确定本地入射角及土壤含水量条件下,当同极化和交叉极化模式下的测量数据与散射模型得到的数据相差达到最小时,则认为此时两者数据一致并输出当前土壤含水量,否则改变土壤含水量值直到最小差值条件满足。在本实验中,土壤水分初始值设为1%,步进间隔取1%。
针对山区地形,结合数据校正步骤,图3给出了土壤含水量估计流程图。
|
| 图 3 山地低矮植被区域土壤含水量估计流程图 Figure 3 The flow chart of soil moisture estimation from the mountainous areas covered with low vegetation |
本实验的研究区域为中国四川省茂县。此区域为山区,地势复杂,绝大部分地表覆盖着多种类型植被,四季分明,全年降雨量集中在6—9月份。雷达图像为Radarsat-2全极化图像,覆盖四川省茂县区域,获取时间为2016年6月18日18点57分,中心经纬度为103°55′9″E,31°44′23″N。SAR数据为C波段、升轨、多视复数数据,其平均入射角约为24°,方位向和距离向分辨率分别为4.95 m和11.5 m。图像预处理过程包括辐射校正、多视处理和地形校正,其中多视处理窗口大小为7×7。图4为经预处理后HH极化强度图像及对应实验区域位置。采用数字高程模型(DEM)数据获取实验区域坡度和坡向角,DEM数据来自SRTM(Shuttle Radar Topographic Mission);采用双线性插值算法将预处理后SAR数据与DEM数据配准。

|
| 图 4 实验区域HH极化强度图像 Figure 4 The intensity image at HH polarization over the study area |
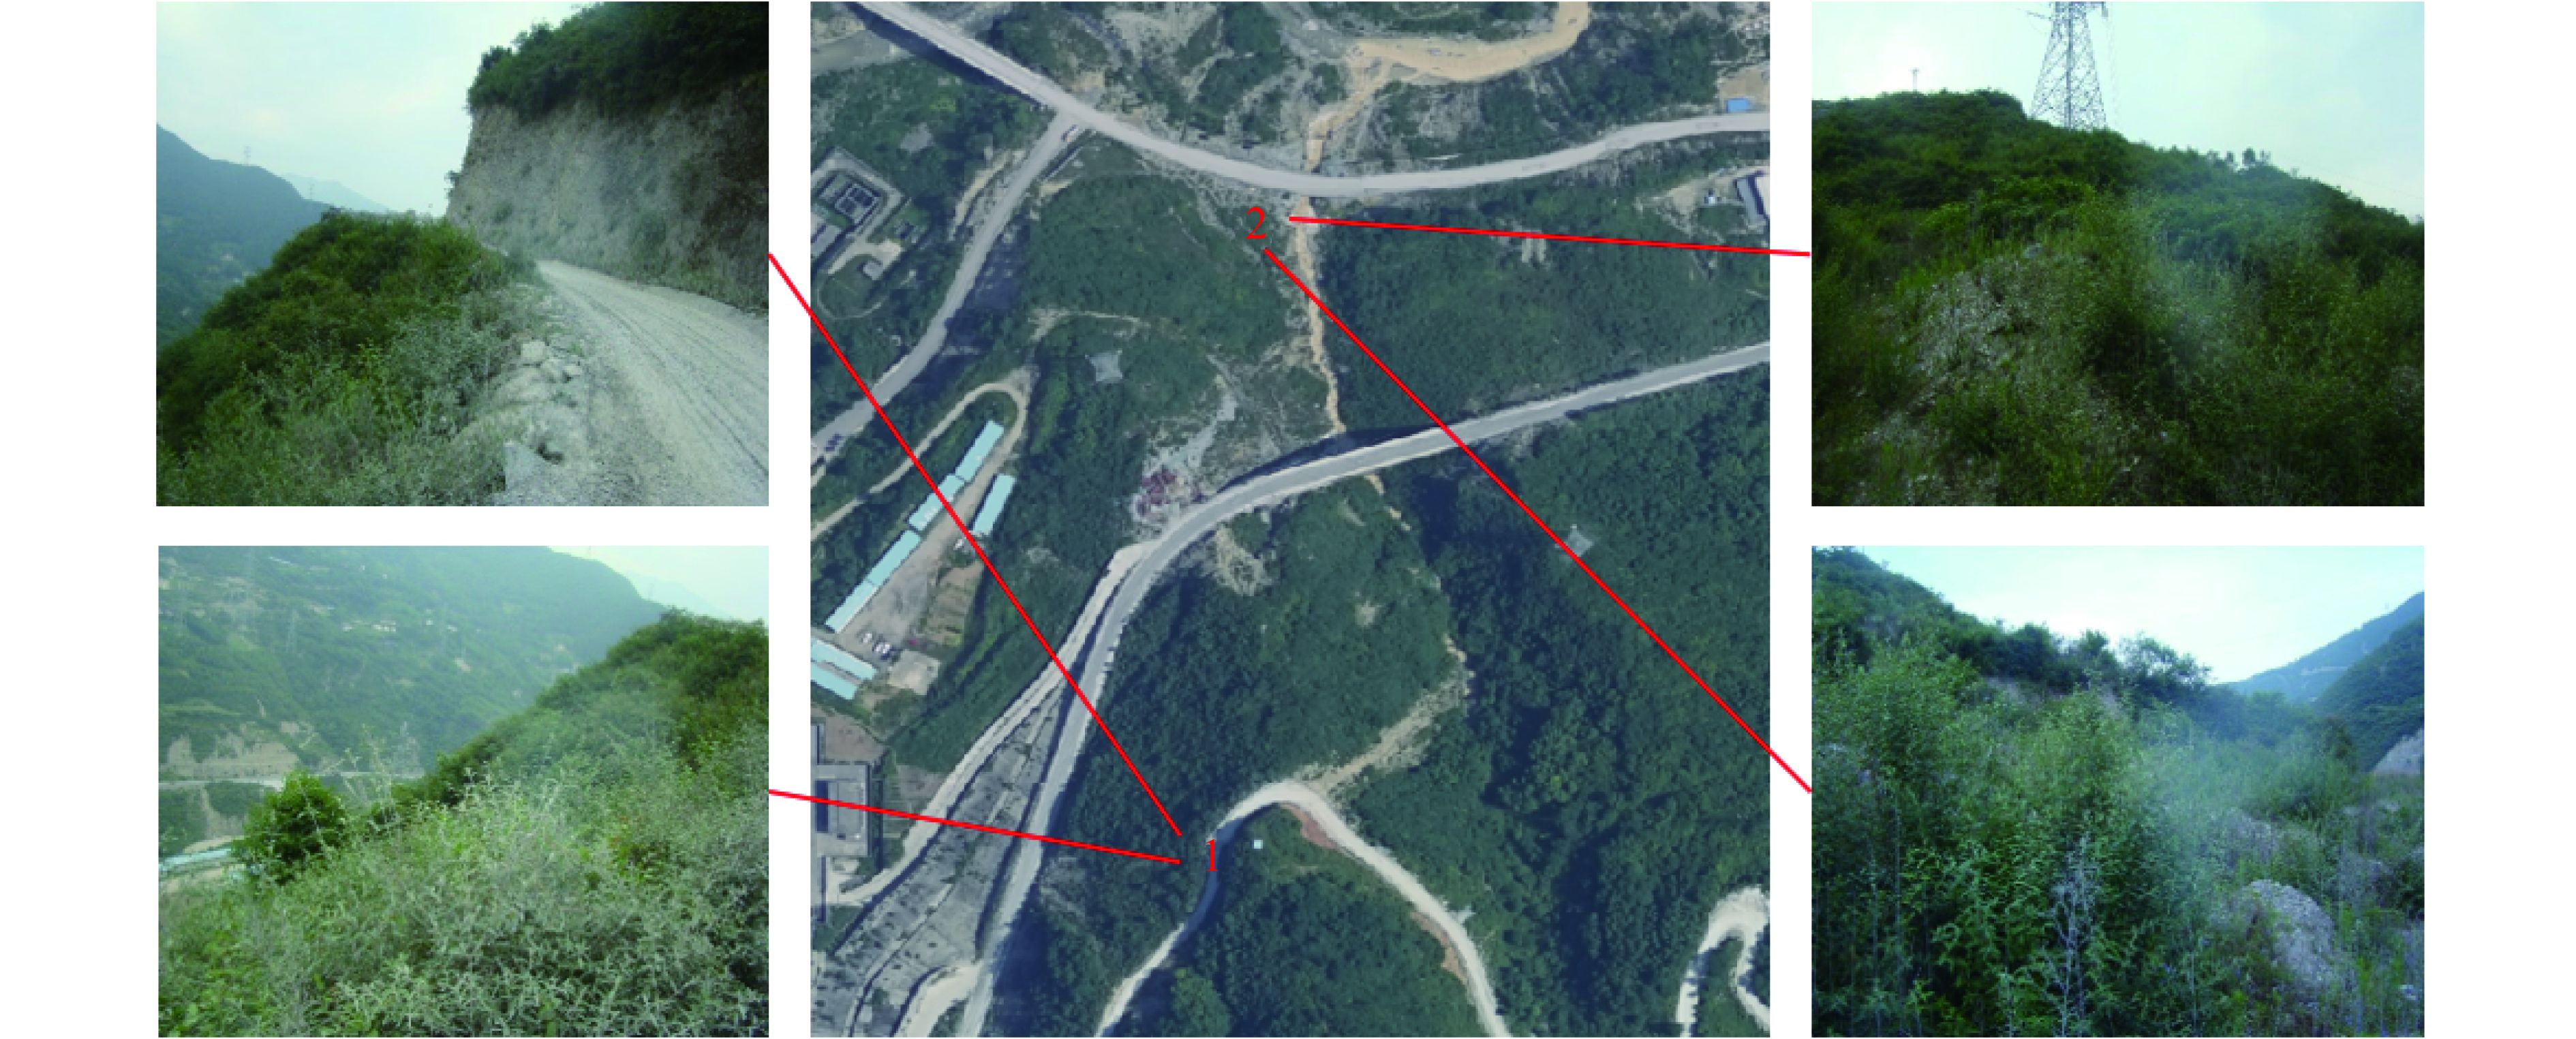
根据第2节可测区域选取原则,实验点需要位于背坡且不是阴影区域。为了验证数据校正的正确性,不同实验点最好位于不同坡向且有一定坡度的区域。对含水量而言,希望在相同植被特征情况下不同的实验点含水量有一定差异。基于以上考虑,选取了两个位于背坡且不是阴影区域的实验采集点,如图4红圈范围内,其坐标为(1)31°45′17.46″N,104°1′30.45″E;(2)31°45′28.99″N,104°1′32″E。实验点1位于道路一侧山坡,实验点2位于一条山沟旁边。理论上实验点2含水量大于实验点1含水量。具体实验地点如图5所示,中间图像来自于光学图像,其他图像为现场采集照片。由图5可知,两处实验点位于植被覆盖山地区域,主要植被类型为低矮灌木和杂草。
实地考察时间为卫星过境时间,测量参数主要包括植被特征参数、土壤含水量、土壤粗糙度等。实验区植被主要有两种类型(A,B),所占比例约为1∶1。每种植物随机选取20—30株,每株植物选取上、中、下区域采样多组,最后取平均值作为对应植被特征参数。为了确保土壤含水量测量准确性,采用TDR 300测试仪和采样盒两种方法测量,测量对象为土壤体积含水量(%)。在TDR测量中,以实验点为中心约50 m×50 m范围内随机选取平均分散的10个采集点,并且每个采集点位于靠近植被根部1—2 cm处,采样平均深度约10 cm;在采样盒测量中,每个实验点随机采样4组植被根部附近表层到往下10 cm左右范围土壤,通过烘干法测量质量含水量,并通过换算得到体积含水量。植被特征参数如表1所示,土壤含水量数值如表2所示。
|
| 图 5 实验点位置及其环境 Figure 5 The location of the experimental site and its surroundings |
|
|
表 1 实验点植被特征参数 Table 1 The characteristic parameters of the vegetation in the experimental site |
|
|
表 2 实验点土壤含水量测量值 Table 2 The measured soil moisture from the experimental site |
由表2可以看出,由TDR 300和采样盒得到的土壤含水量结果相差很小,表明测量结果可信。另外,同一时段实验点2土壤含水量大于实验点1土壤含水量的原因是实验点2紧邻一条山沟,更易获取水分。
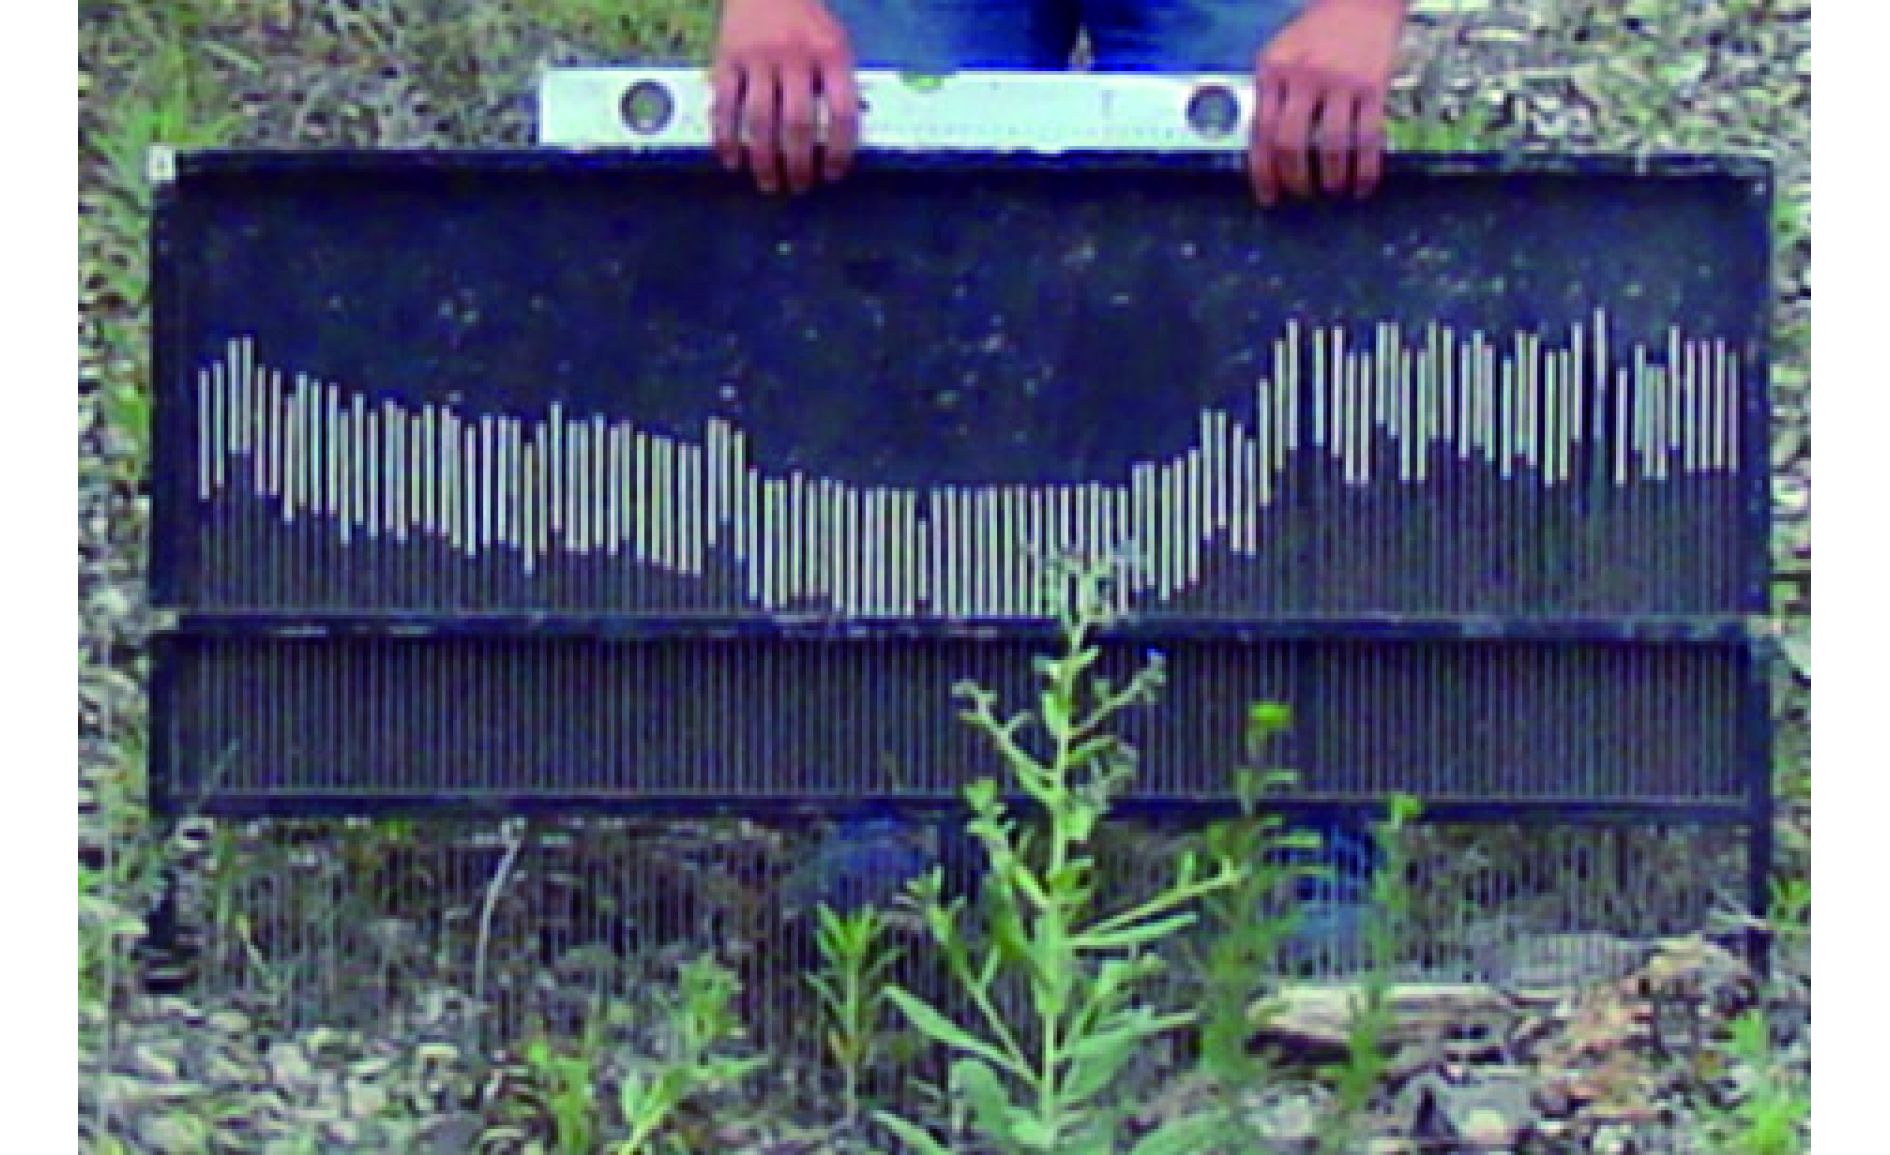
本研究采用粗糙度板测量实验点土壤粗糙度参数,包括均方根高度和相关长度。测量板和测量方法采用专利陈彦等人(2012)中的方法。每个实验点随机采集30组数据,剔除异常值取平均值作为此实验点粗糙度参数。测量步骤主要包含(1)利用水平仪水平放置粗糙度测量板;(2)尽量平视视角拍摄测量板;(3)在拍摄图片中记录粗糙度板上4个角坐标;(4)灰度和亮度滤波;(5)提取粗糙度板针尖高度;(6)比例换算;(7)定标与计算;(8)输出粗糙度计算结果。图6为采用此粗糙度板测量土壤粗糙度的一组采样数据。测量结果实验点1均方根高度和相关长度分别为0.972 cm和8.525 cm,实验点2均方根高度和相关长度分别为0.762 cm和6.753 cm。
|
| 图 6 采用粗糙度板测量的一组采样数据 Figure 6 A set of sample data measured by the roughness board |
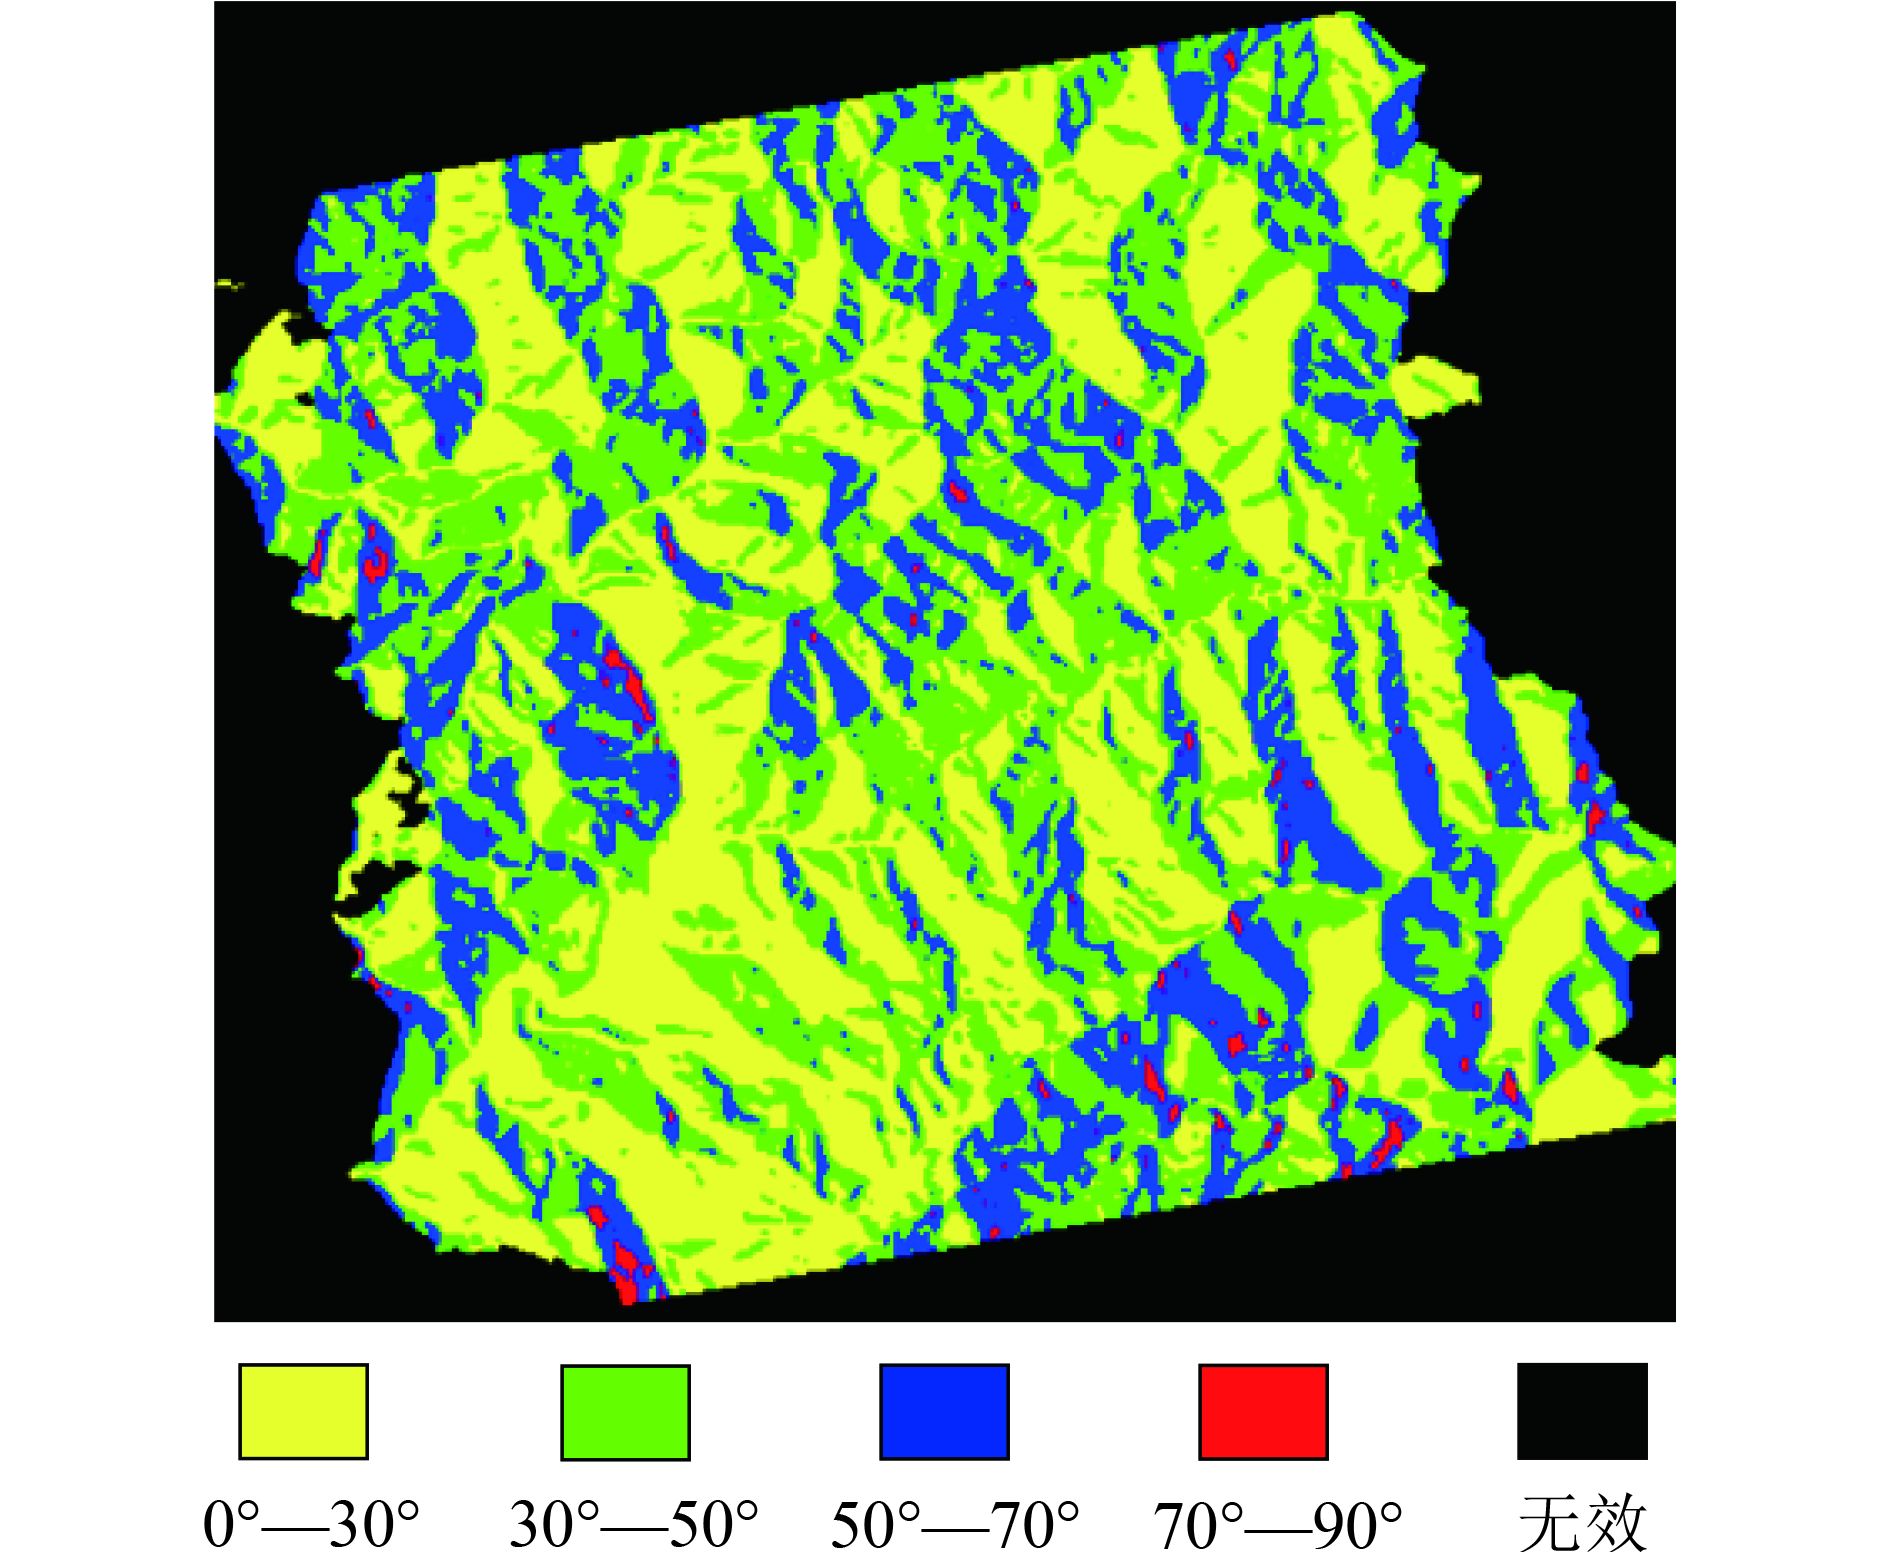
基于式(4),图7给出了观测区域本地入射角范围。采集点1对应的本地入射角为30.27°,采集点2对应的本地入射角为27.56°。
|
| 图 7 观测区域本地入射角 Figure 7 The local incident angles over the observed area |
根据采集点1本地入射角值和低矮植被散射模型,表3给出了入射角30°和表1参数条件下含水量从10%到18%对应的后向散射系数。
去植被效应是土壤含水量反演的关键步骤之一,基于第3节,表4给出了在入射角30°和表1参数条件下含水量从10%到18%对应的去植被效应后地表散射系数。由表3和表4可见,土壤含水量的变化是总散射系数改变的主要因素。另外表4中交叉极化值为–999.99 dB,表明地表直接交叉极化散射对总体交叉极化系数贡献可忽略不计。对本实验区植被而言,交叉极化系数主要由冠层直接散射及其余散射类型如地面—散射体—地面散射、地面—散射体散射等决定。交叉极化系数很大程度依赖于植被冠层密度,也与波段有关。波长较短信号更不易穿透植被。
采集点1(HH,VV,HV)后向散射系数为(–7.638 dB,–7.8901 dB,–11.494 dB),采用式(6)和式(12)得到的校正后向散射系数为(–10.214 dB,–10.033 dB,–16.917 dB),其中去植被效应后散射系数为(–12.791 dB,–12. 632 dB,–999.99 dB)。根据图3流程可得到采集点1的土壤含水量估计值为14%。采集点1土壤含水量实测值为11.45%,绝对误差为2.55%,相对误差约为22%。
对于采集点2,SAR图像对应的(HH,VV,HV)散射系数为(–7.461 dB,–7.500 dB,–12.163 dB),经过校正后散射系数为(–10.095 dB,–9.892 dB,–16.770 dB),其中去植被效应后散射系数为(–11.921 dB,–11.882 dB,–999.99 dB)。通过图3流程得到采集点2土壤含水量估计值为15%。采集点2土壤含水量实测值为15.80%,绝对误差为0.80%,相对误差约为5%。
|
|
表 3 实验点入射角30°条件下土壤含水量(10%—18%)对应后向散射系数 Table 3 The backscattering coefficients corresponded to the soil moisture (10%—18%) at the incident angle 30° over the experimental site |
|
|
表 4 入射角30°条件下去植被效应后土壤含水量(10%—18%)对应地表后向散射系数 Table 4 The backscattering coefficients corresponded to the soil moisture (10%—18%) at the incident angle 30° without the influence of the vegetation over the experimental site |
基于以上结果可知,本方法基本能够正确估计山区低矮植被覆盖下土壤含水量。由于研究区域为山区,夏季天气变化无常,经常发生局部区域阵雨且不能准确预报。因此为了确保数据的有效性,实验点数据特别是土壤含水量都是在卫星过境时间前后两小时内测量的。在有限时间且实验人员有限情况下,本文只测量了两个实验点。虽然样本数量较少,但两个实验点处于不同的坡度、坡向区域,且具有不同的土壤含水量,因此作为验证结果有一定的参考性。在未来我们会持续对观测区域进行测量考察,增加此方法的说服力。
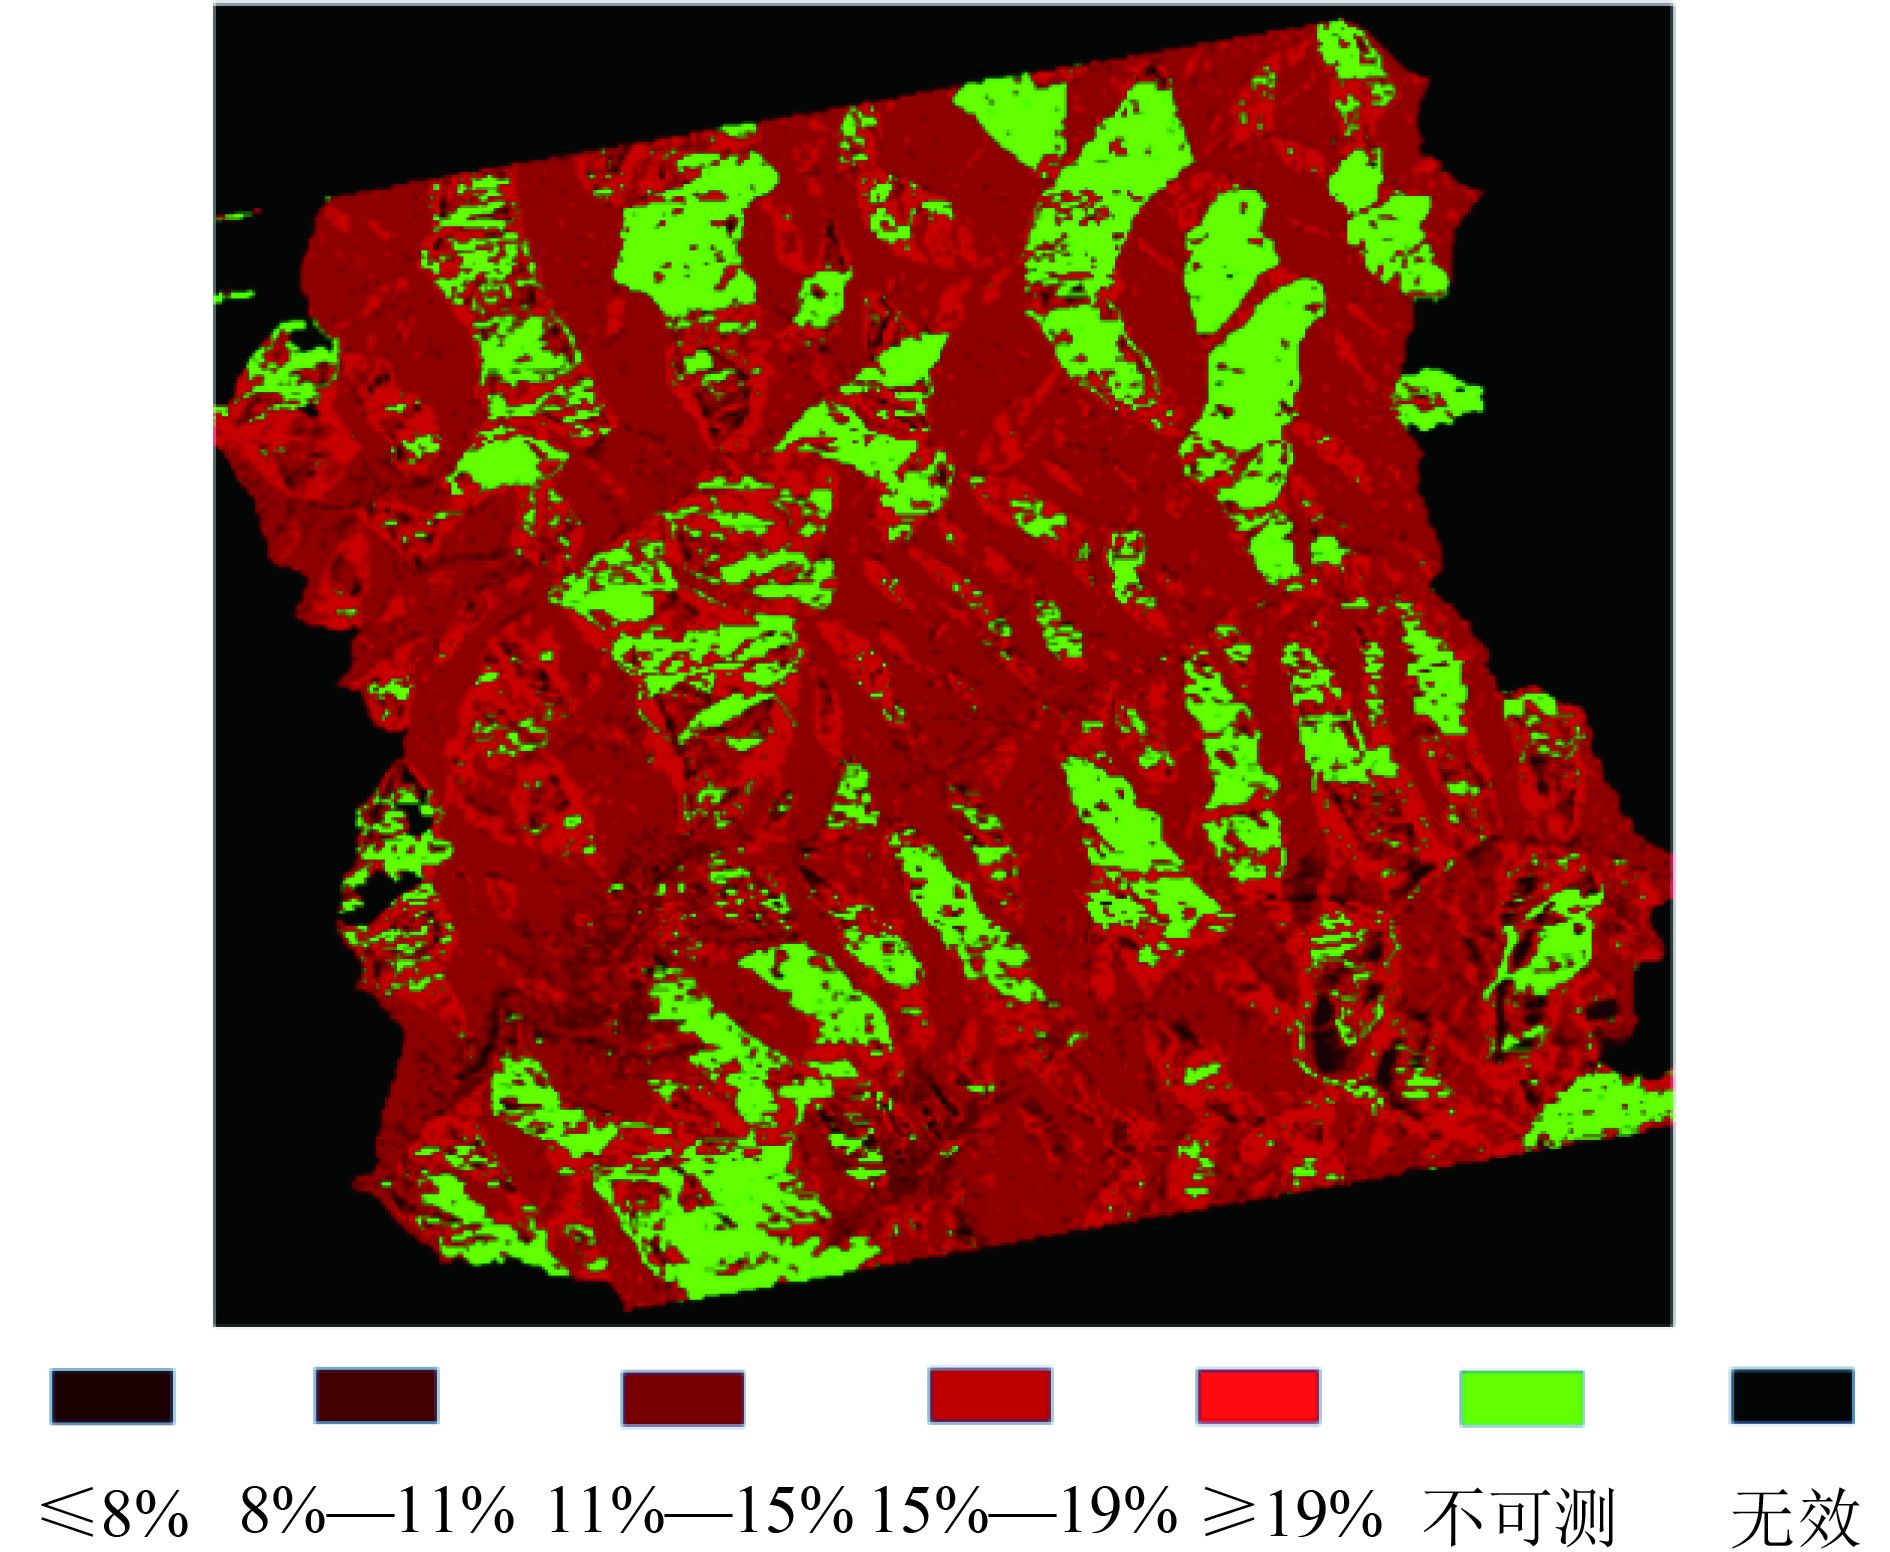
由于缺少观测区域各处植被特征参数,而观测区域覆盖植被种类及生长状况等情况与两处采集点类似,因此假设观测区域地表均覆盖与采集点相同特征的植被,两处观测点值的平均值作为观测区域植被特征值。基于此,则可给出观测区域含水量分布图(图8)。在图8中,含水量小于某个值对应的像素数占到总像素数约5%左右时,取此值作为土壤含水量下限值;同理,含水量大于某个值对应的像素数占到总像素数约5%左右时,取此值作为土壤含水量上限值。为了便于显示,下限值与上限值间等分成3份并进行显示。其中绿色代表的不可测区域为向坡和阴影区域,取决于卫星照射方向。本实验中仅采用一景升轨图像,理论上至多只能测量一半区域。若同时采用升轨降轨数据,可对绝大部分实验区域进行测量。另外,含水量基本集中在8%—19%之间,变化范围为10%左右。对山区而言,含水量变化范围在可接受范围之内。
|
| 图 8 观测区域含水量分布图 Figure 8 The distribution map of soil moisture over the observed area |
图8是理想情况下基于观测区域整体覆盖相同植被条件下得出的,因此此结果仅作为参考而不代表实际的含水量分布图。由于本实验缺乏实验区域地物分布信息,如水体、裸土等,以及植被类型分布信息,因此暂时不能给出精确的实验区域植被覆盖区土壤含水量分布图。未来结合观测区域精分类信息和多视SAR图像,即可持续对观测区域土壤含水量进行估计。
5、结 论山区土壤含水量估计对植被生长监测、滑坡预测、山火预警等应用有着重要意义。基于SAR图像的山区植被区域土壤含水量估计研究需要解决SAR图像几何形变以及极化旋转问题,同时还要解决去植被效应等问题。以往的研究主要针对平地单一或稀疏植被覆盖区域土壤含水量反演,然而受限于山区复杂地形及植被多样性等原因,山地低矮植被的土壤含水量反演目前研究还比较少。
针对以上问题提出了一种基于全极化SAR图像的山地低矮植被区域土壤含水量估计方法。针对SAR图像成像系统在山地地形引起的几何形变及极化旋转等问题,本文基于透视收缩、叠掩、阴影等形成原理将图像分为可测区域与不可测区域,并通过入射角、坡度、坡向等参数对可测区域后向散射系数进行校正。其次基于密西根模型推导低矮植被散射模型,给出了后向散射系数正演方法。最后结合校正数据进行土壤含水量估计。两处实验点土壤估计值为14%和15%,对应实测值为11.45%和15.80%,相对误差分别为22%和5%,结果表明本方法基本能够正确估计山地低矮植被区域土壤含水量。
本文验证了密西根模型能够应用于复杂多样的植被区域,并基于山区地形SAR图像特征提出了针对山区植被区域的含水量估计方法,为山区土壤含水量监测提供了一种有效方法。下一步工作将着重于山区分类研究,将分类结果与此反演模型相结合,并采用多景升降轨SAR图像,持续对观测区域土壤含水量进行监测。
| [1] | Alvarez-Mozos J, Casali J, Gonzalez-Audicana M, Verhoest N E C. Assessment of the operational applicability of RADARSAT-1 data for surface soil moisture estimation[J]. IEEE Transactions on Geoscience and Remote Sensing, 2006, 44 (4) : 913 –924. DOI: 10.1109/TGRS.2005.862248 |
| [2] | Attema E P W, Ulaby F T. Vegetation modeled as a water cloud[J]. Radio Science, 1978, 13 (2) : 357 –364. DOI: 10.1029/RS013i002p00357 |
| [3] | 鲍艳松, 刘良云, 王纪华. 综合利用光学、微波遥感数据反演土壤湿度研究[J]. 北京师范大学学报(自然科学版), 2007, 43 (3) : 228 –233. Bao Y S, Liu L Y, Wang J H. Soil moisture estimation based on optical and microwave remote sensing data[J]. Journal of Beijing Normal University (Natural Science), 2007, 43 (3) : 228 –233. DOI: 10.3321/j.issn:0476-0301.2007.03.002 |
| [4] | Chen Q, Li Z, Cai A M and Tian B S. 2010. Surface parameters estimation using Radarsat-2 polarimetric data over wheat covered area//Proceedings of 2010 IEEE International Geoscience and Remote Sensing Symposium. Honolulu, HI, USA: IEEE: 4843–4846 [DOI: 10.1109/IGARSS.2010.5650824] |
| [5] | 陈彦, 童玲, 贾明权, 庞少峰. 2012. 一种土壤表面粗糙度测量板及测量方法. 中国, CN102788566A Chen Y, Tong L, Jia M Q and Pang S F. 2012. A surface roughness measuring board and its measuring method. China, CN102788566A |
| [6] | 丁建丽, 姚远. 干旱区稀疏植被覆盖条件下地表土壤水分微波遥感估算[J]. 地理科学, 2013, 33 (7) : 837 –842. Ding J L, Yao Y. Evaluation of soil moisture contents under sparse vegetation coverage conditions using microwave remote sensing technology in arid region[J]. Scientia Geographica Sinica, 2013, 33 (7) : 837 –842. DOI: 10.13249/j.cnki.sgs.2013.07.837 |
| [7] | Gherboudj I, Magagi R, Berg A A, Toth B. Soil moisture retrieval over agricultural fields from multi-polarized and multi-angular RADARSAT-2 SAR data[J]. Remote Sensing of Environment, 2011, 115 (1) : 33 –43. DOI: 10.1016/j.rse.2010.07.011 |
| [8] | Jackson T J, Schmugge T J. Vegetation effects on the microwave emission of soils[J]. Remote Sensing of Environment, 1991, 36 (3) : 203 –212. DOI: 10.1016/0034-4257(91)90057-D |
| [9] | Jagdhuber T, Hajnsek I, Bronstert A, Papathanassiou K P. Soil moisture estimation under low vegetation cover using a multi-angular polarimetric decomposition[J]. IEEE Transactions on Geoscience and Remote Sensing, 2013, 51 (4) : 2201 –2215. DOI: 10.1109/TGRS.2012.2209433 |
| [10] | Karam M A, Fung A K. Electromagnetic scattering from a layer of finite length, randomly oriented, dielectric, circular cylinders over a rough interface with application to vegetation[J]. International Journal of Remote Sensing, 1988, 9 (6) : 1109 –1134. DOI: 10.1080/01431168808954918 |
| [11] | Lee J S, Schuler D L, Ainsworth T L, Krogager E, Kasilingam D, Boerner W M. On the estimation of radar polarization orientation shifts induced by terrain slopes[J]. IEEE Transactions on Geoscience and Remote Sensing, 2002, 40 (1) : 30 –41. DOI: 10.1109/36.981347 |
| [12] | Lin Y C, Sarabandi K. A Monte Carlo coherent scattering model for forest canopies using fractal-generated trees[J]. IEEE Transactions on Geoscience and Remote Sensing, 1999, 37 (1) : 440 –451. DOI: 10.1109/36.739083 |
| [13] | 刘伟, 施建成, 余琴. 基于机载极化雷达技术的农作物覆盖区土壤水分估算[J]. 干旱区地理, 2005, 28 (6) : 856 –861. Liu W, Shi J C, Yu Q. Estimation of soil moisture content in vegetated areas using multi-polarization airborne sar[J]. Arid Land Geography, 2005, 28 (6) : 856 –861. DOI: 10.3321/j.issn:1000-6060.2005.06.024 |
| [14] | Moran M S, Alonso L, Moreno J F, Mateo M P C, de la Cruz D F, Montoro A. A RADARSAT-2 quad-polarized time series for monitoring crop and soil conditions in Barrax, Spain[J]. IEEE Transactions on Geoscience and Remote Sensing, 2012, 50 (4) : 1057 –1070. DOI: 10.1109/TGRS.2011.2166080 |
| [15] | Rahman M M, Moran M S, Thoma D P, Bryant R, Collins C D H, Jackson T, Orr B J, Tischler M. Mapping surface roughness and soil moisture using multi-angle radar imagery without ancillary data[J]. Remote Sensing of Environment, 2008, 112 (2) : 391 –402. DOI: 10.1016/j.rse.2006.10.026 |
| [16] | Said S, Kothyari U C, Arora M K. Vegetation effects on soil moisture estimation from ERS-2 SAR images[J]. Hydrological Sciences Journal, 2012, 57 (3) : 517 –534. DOI: 10.1080/02626667.2012.665608 |
| [17] | Sarabandi K, Senior T B A, Ulaby F T. Effect of curvature on the backscattering from a leaf[J]. Journal of Electromagnetic Waves and Applications, 1988, 2 (7) : 653 –670. DOI: 10.1163/156939388X00341 |
| [18] | Senior T B A and Sarabandi K. 1990. Scattering models for point targets. Radar Polarimetry for Geoscience Applications: 53–110 |
| [19] | Senior T B A, Sarabandi K, Ulaby F T. Measuring and modeling the backscattering cross section of a leaf[J]. Radio Science, 1987, 22 (6) : 1109 –1116. DOI: 10.1029/RS022i006p01109 |
| [20] | Shi J C, Wang J, Hsu A Y, O'Neill P E, Engman E T. Estimation of bare surface soil moisture and surface roughness parameter using L-band SAR image data[J]. IEEE Transactions on Geoscience and Remote Sensing, 1997, 35 (5) : 1254 –1266. DOI: 10.1109/36.628792 |
| [21] | Ulaby F T, Dubois P C, van Zyl J. Radar mapping of surface soil moisture[J]. Journal of Hydrology, 1996, 184 (1-2) : 57 –84. DOI: 10.1016/0022-1694(95)02968-0 |
| [22] | Ulaby F T, Long D G, Blackwell W J, Elachi C, Fung A K, Ruf C, Sarabandi K, Zebker H A and Van Zyl J. 2014. Microwave radar and radiometric remote sensing. Ann Arbor, Michigan: University of Michigan Press |
| [23] | Ulaby F T, McDonald K, Sarabandi K and Dobson M C. 1988. Michigan microwave canopy scattering models (MIMICS)//Proceedings of Remote Sensing: Moving Toward the 21st Century Geoscience and Remote Sensing Symposium. Edinburgh, UK: IEEE |
| [24] | Ulaby F T, Moore R K and Fung A K. 1981. Microwave Remote Sensing: Active and Passive. Vol. 1: Microwave Remote Sensing Fundamentals and Radiometry. Dedham, MA: Artech House |
| [25] | Ulaby F T, Moore R K and Fung A K. 1982. Microwave Remote Sensing, Active and Passive: Volume II: Radar Remote Sensing and Surface Scattering and Emission Theory. Dedham, MA: Artech House |
| [26] | 谢凯鑫, 张婷婷, 邵芸, 柴勋. 基于Radarsat-2全极化数据的高原牧草覆盖地表土壤水分反演[J]. 遥感技术与应用, 2016, 31 (1) : 134 –142. Xie K X, Zhang T T, Shao Y, Chai X. Study on soil moisture inversion of plateau pasture using radarsat-2 imagery[J]. Remote Sensing Technology and Application, 2016, 31 (1) : 134 –142. DOI: 10.11873/j.issn.1004-0323.2016.1.0134 |
| [27] | 杨立娟, 武胜利, 张钟军. 利用主被动微波遥感结合反演土壤水分的理论模型分析[J]. 国土资源遥感, 2011 (2) : 53 –58. Yang L J, Wu S L, Zhang Z J. A model analysis using a combined active/passive microwave remote sensing approach for soil moisture retrieval[J]. Remote Sensing for Land & Resources, 2011 (2) : 53 –58. |

