收稿日期: 2016-07-08
成像分辨率对SAR目标识别、参数反演、灾害评估性能具有重要意义。基于匹配滤波的SAR成像算法的分辨率受限于信号带宽和合成孔径长度。Candès等(2006)提出了基于压缩感知(CS)的数据获取和重构理论,指出对于稀疏信号或者可压缩信号,利用少量观测即可实现信号重构或者近似。诸如车辆、建筑物等人造目标电磁散射信号具有明显的稀疏特性,目标总的电磁散射可以由局部散射中心散射的合成来近似(Keller,1962)。因而,压缩感知理论对于实现人造目标的高精度成像具有很大潜力。
虽然大量研究(Cetin 等,2003;Xu 等,2012)表明
正则化参数用来平衡重构结果的稀疏度及其与观测的吻合度,收缩参数控制解的稀疏度。已有研究表明,不合适的正则化参数和收缩参数会导致较差的稀疏重构结果(Wang 等,2014)。为了保证重构效果,进行自适应的参数选择很有必要。
在过去一段时间里,很多参数选择方法被提出来,有贝叶斯信息论准则(BIC),L-曲线,交叉验证(CV)和贝叶斯推理。BIC方法是通过建立稀疏重构问题和基于信息论的模型阶数选择问题的关系来选择参数(Austin 等,2010;Tan 等,2011)。L-曲线方法是通过测试所有可能的模型参数值并寻找曲线的拐点来进行参数选择(Zhang 等,2014)。当有足够的训练样本构成训练和验证部分时,CV方法可以得到精确地模型参数选择结果(Lu 等,2010)。通过引入一些超参数,贝叶斯推理在证据框架下从已有数据中估计出正则化参数(Chien,2015;Zhao 等,2015)。虽然BIC、L-曲线、CV方法的实际结果较为可靠,但这3种方法需要计算一系列的正则化问题,直到目标函数达到最小值或者拐点,因此计算量很大。贝叶斯推理没有使用计算复杂度高的迭代算法,因此是一种高效的模型参数估计方法。由于大多数基于贝叶斯推理的方法都是依赖于某一个模型(p=1),因此不可以被应用于更为普遍的情况(Chaari 等,2013)。总之,传统的参数选择方法普遍存在一些缺点,如计算量过大或被限制于某一特定模型。
为了克服上述参数选择方法的缺点,使lp范数正则化SAR成像方法得到更好的应用,本文提出一种无需额外先验信息的自适应参数选择方法。首先,通过最大后验概率(MAP)估计和贝叶斯推理,得到模型参数与信号和噪声方差的关系。在此基础上,提出了参数自适应选择方法,即在每一次的迭代过程中,所有需要的参数都可以通过已知的数据被更新而不需要任何额外先验信息,SAR稀疏成像结果通过已经更新了模型参数的lp范数正则化方法重构得到。通过基于仿真数据和实测数据的实验对比分析可知,本文方法不仅得到了较为精确的参数选择和成像结果,而且计算量远低于其他方法。
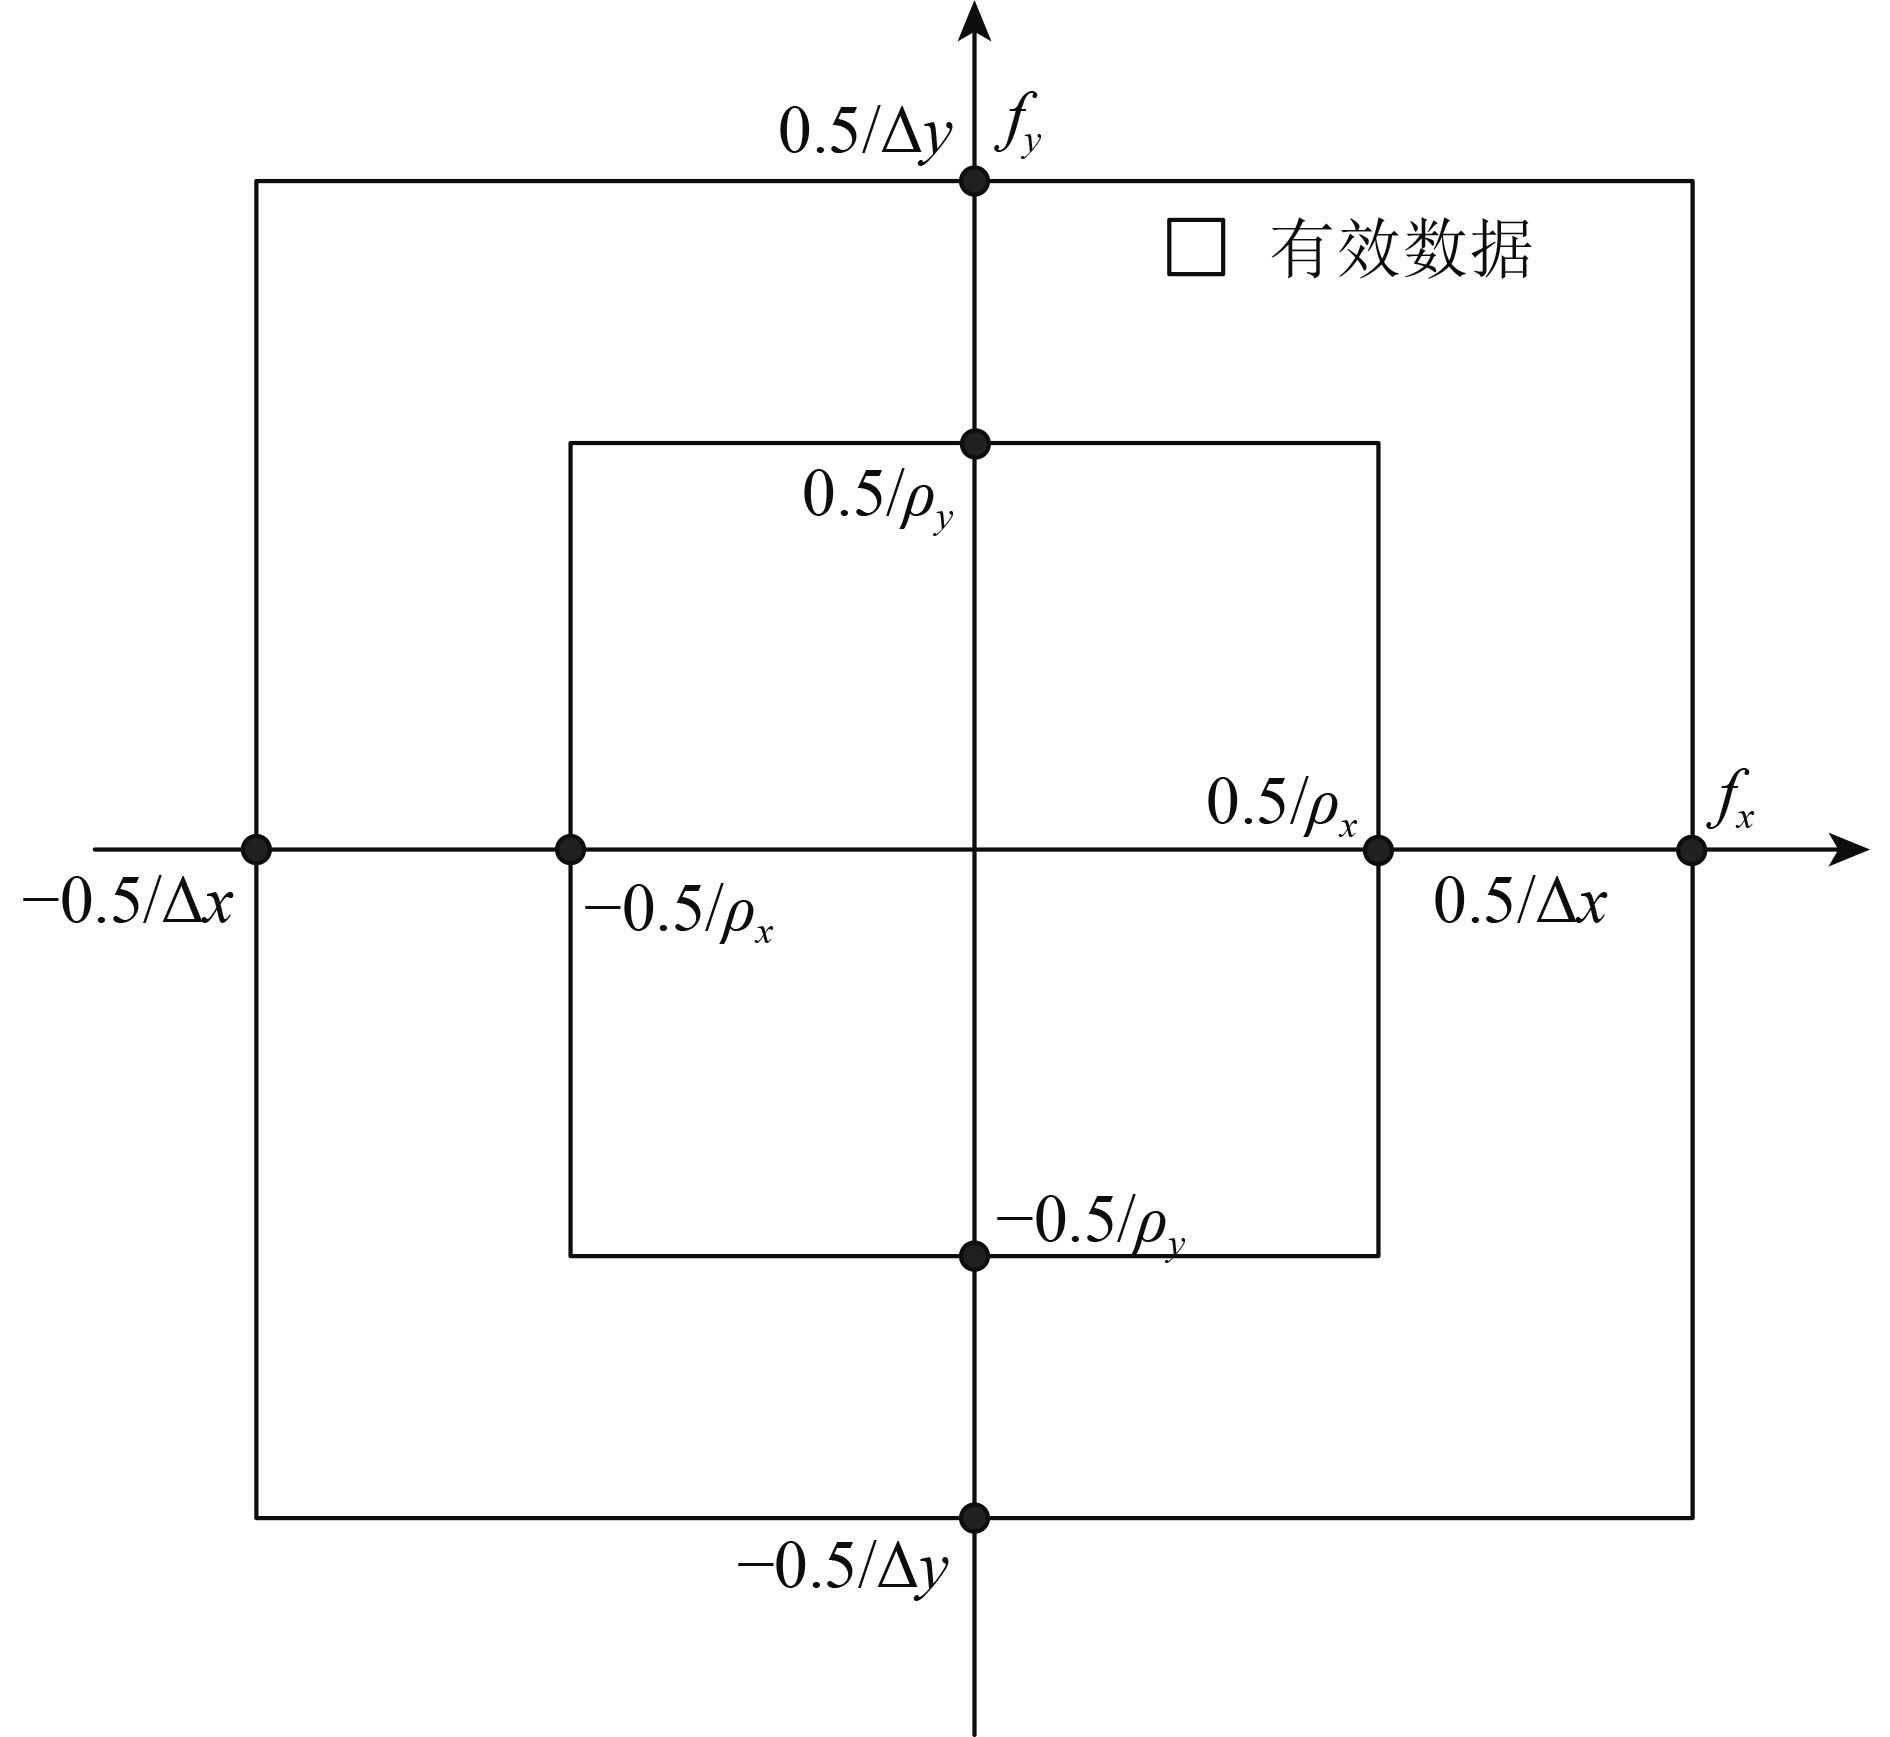
2、信号模型人造目标SAR图像可以建模为多个sinc函数之和,在空间频率域,其可以表示为2维复正弦信号之和。因此,考虑观测噪声后的空间频率域模型可表示为
| $\begin{array}{l}{{J}}\left( {m,n} \right) = \\\displaystyle\sum\limits_{q = 1}^d {\left( {\gamma _q^{}\exp \left( { - j2{\rm{\pi }}(m\Delta {f_x}{x_q} + n\Delta {f_y}{y_q})} \right)} \right) + u(m,n)} {\rm{ }}\\{\rm{ }}\left( {0 \leqslant m \leqslant M - 1,{\rm{ }}0 \leqslant n \leqslant N - 1} \right)\end{array}$ | (1) |
式中,
| ${B_x} = 1/{\rho _x}{\rm{ }}\;\;{B_y} = 1/{\rho _y}$ | (2) |
式中,

|
| 图 1 SAR复图像空间频率域数据示意图 Figure 1 General view of frequency domain data |
| $M = \left\lfloor {\frac{{{B_x}}}{{\Delta {f_x}}}} \right\rfloor = \left\lfloor {\frac{{\Delta x}}{{{\rho _x}}}K} \right\rfloor ,N = \left\lfloor {\frac{{{B_y}}}{{\Delta {f_y}}}} \right\rfloor = \left\lfloor {\frac{{\Delta y}}{{{\rho _y}}}L} \right\rfloor $ | (3) |
式中,
将数据矩阵J按列展开,得到观测向量
| ${{y = At + n}}$ | (4) |
式中,
| ${{A}} = \left[ {\begin{array}{*{20}{c}}{{{a}}_1^{}}&{{{a}}_2^{}}& \cdots &{{{a}}_d^{}}\end{array}} \right]$ | (5) |
| $\begin{array}{c}{{a}}_k^{} = {\left[ {1\;\;{{\rm{e}}^{ - j2{\rm{\pi }}\Delta {f_y}{y_q}}}\; \cdots \;{{\rm{e}}^{ - j2{\rm{\pi }}\left( {N - 1} \right)\Delta {f_y}{y_q}}}} \right]^{\rm{T}}} \otimes\\[8pt] {\left[ {1\;\;{{\rm{e}}^{ - j2{\rm{\pi }}\Delta {f_x}{x_q}}}\; \cdots \;{{\rm{e}}^{ - j2{\rm{\pi }}\left( {M - 1} \right)\Delta {f_x}{x_q}}}} \right]^{\rm{T}}}\end{array}$ | (6) |
一般情况下,观测向量y服从高斯分布
| ${\rm{p}}({{y|t}}) = {\mathop{\rm N}\nolimits} ({{y}}|{{At}},{\beta ^{ - 1}}{{I}})$ | (7) |
式中,
人造目标一般由少量的强散射点组成,SAR图像在空域是稀疏的,因此可以将稀疏重构应用在SAR成像上来提高人造目标图像的质量,即将式(4)中的模型看成一个lp范数最小化问题
| ${{\hat t}} = \mathop {\arg \min }\limits_{{t}} \left\| {{{y}} - {{At}}} \right\|_2^2 + \lambda \left\| {{t}} \right\|_p^p$ | (8) |
式中,
研究表明,正则化参数和收缩参数对成像结果有很大的影响。一个小的正则化参数会产生更稀疏的解,但同时会降低解的准确度。收缩参数控制解的稀疏度,收缩参数越小,成像结果越稀疏(陈国新和陈生昌,2014)。为了保证重构效果,进行自适应的参数选择很有必要。
从贝叶斯推理的角度来看,稀疏重构模型等价于在假定信号先验分布下求信号的MAP估计(Chen,2002)。lp范数正则化模型的贝叶斯推理如下:
首先,假定信号的各个元素服从lp(Seeger,2008)先验分布
| $\begin{array}{l}p({t_i}|\mu ) \propto {\mu ^{\frac{1}{p}}}\exp \left\{ { -\displaystyle \frac{\mu }{p}|{t_i}{|^p}} \right\} = \\ {c_0}{\mu ^{\frac{1}{p}}}\exp \left\{ - \displaystyle\frac{\mu }{p}|{t_i}{|^p} \right\} \end{array}$ | (9) |
式中,ti表示信号t的各个元素,μ是超参数,p是收缩参数,当p=1时,式(9)等价于拉普拉斯先验分布。c0是归一化参数,用来确保
| $\int {{\mathop{\rm p}\nolimits} ({t_i}|\mu ){\mathop{\rm d}\nolimits} {t_i}} = 1$ | (10) |
通过推导发现当1/p是整数时,式(10)才是可积的,得到c0的表达式如下
| ${c_0} = \left\{ \begin{array}{l}{\left(2p\prod\limits_{n = 0}^{\frac{1}{p} - 2} {(1 - np)} \right)^{ - 1}}\begin{array}{*{20}{c}}{}\;\;\;\;&{0 < p < 1}\end{array}\\[15pt]\displaystyle \frac{1}{2}\begin{array}{*{20}{c}}{}&{\begin{array}{*{20}{c}}{\begin{array}{*{20}{c}}{\begin{array}{*{20}{c}}{\begin{array}{*{20}{c}}{}&{}\end{array}}&{}\end{array}}&{}\end{array}}&{}\end{array}}&{p = 1}\end{array}\end{array} \right.$ | (11) |
假定信号的每个元素之间是相互独立的,则信号t的先验分布为
| $\begin{array}{l}{\rm{p}}({{t}}|\mu ) = \prod\limits_{i = 1}^d {{\rm{p}}({t_i}|\mu )} = {c_0}^d{\mu ^{\frac{d}{p}}}\exp \left\{ { -\displaystyle \frac{\mu }{p}\left\| {{t}} \right\|_P^P} \right\} \end{array}$ | (12) |
结合式(7)和式(12),信号的MAP估计为
| $\begin{array}{l}{{\tilde t}} = \mathop {\arg \min }\limits_{{t}} \{ - \log {\mathop{\rm p}\nolimits} ({{t}}|{{y}})\}= \\ \mathop {\arg \min }\limits_{{t}} \{ - \log {\mathop{\rm p}\nolimits} ({{y}}|{{t}}) - \log {\mathop{\rm p}\nolimits} ({{t}})\} = \\\mathop {\arg \min }\limits_{{t}} \left\{ \left\| {{{y}} - {{At}}} \right\|_2^2 + \displaystyle\frac{{2\mu }}{{p\beta }}\left\| {{t}} \right\|_p^p - \displaystyle\frac{{2d}}{\beta }\log {c_0} - \displaystyle\frac{{2d}}{{p\beta }}\log \mu \right\} \end{array}$ | (13) |
式(13)的第3和第4项与信号t无关,因此可以被视为常量。对比式(13)和式(8)可知,式(8)的lp范数最小化问题等价于式(13)中的MAP估计问题。
(3.1) 正则化参数比较式(13)和式(8)得到正则化参数的估计值为
| $\lambda = \frac{{2\mu }}{{p\beta }}$ | (14) |
可以看出来,未知的超参数μ对于正则化参数很重要。幸运的是可以通过建立超参数和信号方差的关系来得到这个超参数值。
根据式(9)所示的先验概率密度分布函数,可得到信号中每个元素的方差
| ${\mathop{\rm E}\nolimits} ({t_i}) = \int {{\mathop{\rm p}\nolimits} ({t_i}|\mu ){t_i}} {\mathop{\rm d}\nolimits} {t_i} = 0$ | (15) |
| $\begin{array}{l}{\mathop{\rm E}\nolimits} ({t_i}^2) = \displaystyle\int {{\mathop{\rm p}\nolimits} ({t_i}|\mu ){t_i}^2} {\mathop{\rm d}\nolimits} {t_i}=\\[5pt] 2{c_0}{\mu ^{ - \frac{2}{p}}}p\prod\limits_{n = 1}^{\frac{3}{p} - 2}{(3 - np)} \end{array}$ | (16) |
| $\begin{array}{l}{\mathop{\rm D}\nolimits} ({t_i}) = {\mathop{\rm E}\nolimits} ({t_i}^2) - {\mathop{\rm E}\nolimits} {({t_i})^2}=\\[5pt] 2{c_0}{\mu ^{ - \frac{2}{p}}}p\prod\limits_{n = 1}^{\frac{3}{p} - 1} {(3 - np)} \end{array}$ | (17) |
当3/p是整数时,式(16)和式(17)是可积的。因为信号的各个元素之间是相互独立的,因此信号方差等于各个元素方差的乘积。
| $\begin{array}{l}{\mathop{\rm D}\nolimits} ({{t}}) =\prod\limits_{i = 1}^d{{\mathop{\rm D}\nolimits} ({t_i})} \\ [5pt] = {2^d}{c_0}^d{\mu ^{ - \frac{{2d}}{p}}}\{ p\prod\limits_{n = 1}^{\frac{3}{p} - 2} {(3 - np){\} ^d} = {\sigma _{{t}}}^2} \end{array}$ | (18) |
式中,
根据上式,可以得到超参数的表达式如下
| $\begin{array}{l}\mu = {\left. {\left\{ {2{c_0}p\prod\limits_{n = 1}^{\frac{3}{p} - 2}{(3 - np)} } \right.} \right\}^{\frac{p}{2}}}{\sigma _{{t}}}^{ - p} = {\mu _0}{\sigma _{{t}}}^{ - p} = \\\left\{ \begin{array}{l}{\left. {\left\{ {{{\{ \prod\limits_{n = 0}^{\frac{1}{p} - 2} {(1 - np)} \} }^{ - 1}}\prod\limits_{n = 1}^{\frac{3}{p} - 2} {(3 - np)} } \right.} \right\}^{\frac{p}{2}}}{\sigma _{{t}}}^{ - p},0 < p < 1\\{\left. {\left\{ {p\prod\limits_{n = 1}^{\frac{3}{p} - 2} {(3 - np)} } \right.} \right\}^{\frac{p}{2}}}{\sigma _{{t}}}^{ - p},p = 1\end{array} \right.\end{array}$ | (19) |
在式(19)中,因为要保证1/p和3/p是整数,p只能取某些值,这就限制了本文提出方法的使用范围。为了解决这个问题,在仿真中对只与p有关的参数μ0进行了分析,发现随着p的增加,μ0也在不断地增加。基于μ0与p之间的变化趋势,通过对μ0进行插值处理,这样式(19)就可以应用在任意的p值上。
根据上面的推导,lp范数正则化模型中的正则化参数可表示为
| $\begin{array}{l}\lambda = \displaystyle\frac{{2\mu }}{{p\beta }} = \displaystyle\frac{{2{\sigma ^2}{\mu _0}{\sigma _{{t}}}^{ - p}}}{p} = \\\left\{ \begin{array}{l}\displaystyle\frac{{2{\sigma ^2}}}{p}{\left. {\left\{ {\displaystyle\frac{{\prod\limits_{n = 1}^{\frac{3}{p} - 2} {(3 - np)} }}{{\prod\limits_{n = 0}^{\frac{1}{p} - 2}{(1 - np)} }}} \right.} \right\}^{\frac{p}{2}}}{\sigma _{{t}}}^{ - p}\;\;\;\;\;\;\;\;0 < p < 1\\\displaystyle\frac{{2{\sigma ^2}}}{p}{\left. {\left\{ {p\prod\limits_{n = 1}^{\frac{3}{p} - 2} {(3 - np)} } \right.} \right\}^{\frac{p}{2}}}{\sigma _{{t}}}^{ - p}\;\;\;\;\;\;p = 1\end{array} \right.\end{array}$ | (20) |
式(20)建立了正则化参数和收缩参数之间的关系,表明正则化参数由收缩参数、信号方差和噪声方差共同决定。对于某一个p值来说,如果估计出信号和噪声的方差,则总有一个最优的正则化参数值λ(p)与p对应。
(3.2) 自适应参数选择算法信号和噪声方差已知的情况下,通过式(20)可以得到正则化参数的最优值。然而在实际问题中,信号和噪声方差往往都是未知的。为了解决这个问题,这里提出了一个通过交叉迭代进行参数更新的方法。对于每一个p值,给定一个随机的正则化参数并通过lp范数正则化方法重构出信号。之后,根据信号估计值,估计得到信号和噪声方差。然后再通过式(20)计算正则化参数。通过对上述步骤的多次自适应迭代,当结果收敛(模型参数的变化量小于给定门限)时,则得到正则化参数的最优值。
对于收缩参数p而言,已有研究表明收缩参数越小,成像结果越稀疏,因此这里选择p=0.1。
目前有很多种算法来解决式(8)中所示的lp范数正则化问题,如FOCUSS(Cotter 等,2005), SLIM(Tan 等,2011)等。本文提出的参数选择方法并不依赖于某一个算法,而是可以适用于各种lp范数正则化算法。由于Cetin(Austin 等,2011)提出的算法精度高且效率高,因此,使用此算法进行处理lp范数正则化问题。
本文提出算法的步骤总结如下:
(1) 输入:y,A,p,和随机的正则化参数λ(p)
(2) 用lp范数正则化算法重构出信号
(3) 基于
(4) 用式(20)更新λ(p)
(5) 重复步骤(2)—(4)直到λ(p)收敛于某值
(6) 输出:
基于1维仿真数据和2维实测数据,本节对比分析了本文方法与2种典型参数选择方法(BIC,L-曲线)在精度和运算量方面的差异。
(4.1) 基于仿真的实验设计与结果分析给定1维复信号,其稀疏度分别设置为3,10,100,噪声为高斯白噪声,信噪比分别设置为2 dB,5 dB,8 dB。字典矩阵是傅里叶变换矩阵。根据式(4)的模型,可以得到观测向量。观测信号的采样率设定为50 Hz,观测时长是2 s。信号被等分为500份。收缩参数为p=0.1。基于观测信号和字典矩阵,使用lp范数正则化方法和本文提出的参数选择方法稀疏重构出信号。
为了验证本文所提出的参数选择方法,下面对比分析不同噪声强度和稀疏度时,本文方法和L-曲线,BIC方法在重构精度和运算量之间的差异。因为仿真中的原始1维复信号是已知的,因此上述3种方法的精度可以通过式(21)式定义的重构结果的均方根误差(RMSE)来进行评价。
| ${\mathop{\rm RMSE}\nolimits} = \sqrt {\frac{1}{n}\left( {\sum\limits_{i = 1}^n {d_i^2} } \right)} $ | (21) |
| ${\rm{MSE}} = {d_i} = \frac{{\left\| {{{{{\tilde t}}}_i} - {{t}}} \right\|_2^2}}{{\left\| {{t}} \right\|_2^2}}$ | (22) |
式中,
表1记录了不同条件下3种参数选择方法的结果。表1前两列是不同的条件设定和不同的参数选择方法。第3和第4列是运算时间和RMSE。第5列是选取的正则化参数值。从表1可以看出,不同的噪声强度和稀疏度下,3种方法选择出来的λ都比较接近,且RMSE都保持在同一数量级上。本文方法的重构精度与BIC,L-曲线方法相当,但本文提出方法的计算量远远的小于这两个方法。
|
|
表 1 不同条件下对比各种参数选择方法 Table 1 Comparison of different parameter selection methods under different conditions |
事实上,本文提出的方法建立了正则化参数与收缩参数,信号方差,噪声方差之间的联系,只需不超过6次的迭代就可选择出正则化参数,其中的信号方差和噪声方差根据数据进行迭代更新得到。BIC方法使用二分法搜索最优的正则化参数,L-曲线方法需要在λ的一系列采样点上进行一系列的lp范数正则化过程。因此,这两种方法相比于本文提出的方法需要更多的运算时间。
表2记录了在SNR=2 dB且稀疏度为10时,不同收缩参数下的参数选择结果。可以看出,不同收缩参数下,这3种方法的参数选择结果互相之间都很接近。
|
|
表 2 不同收缩参数下对不同参数选择方法的结果对比(SNR=2 dB, 稀疏度=10) Table 2 Comparison of different parameter selection methods under different shrinkage parameters (SNR=2 dB, sparsity=10) |
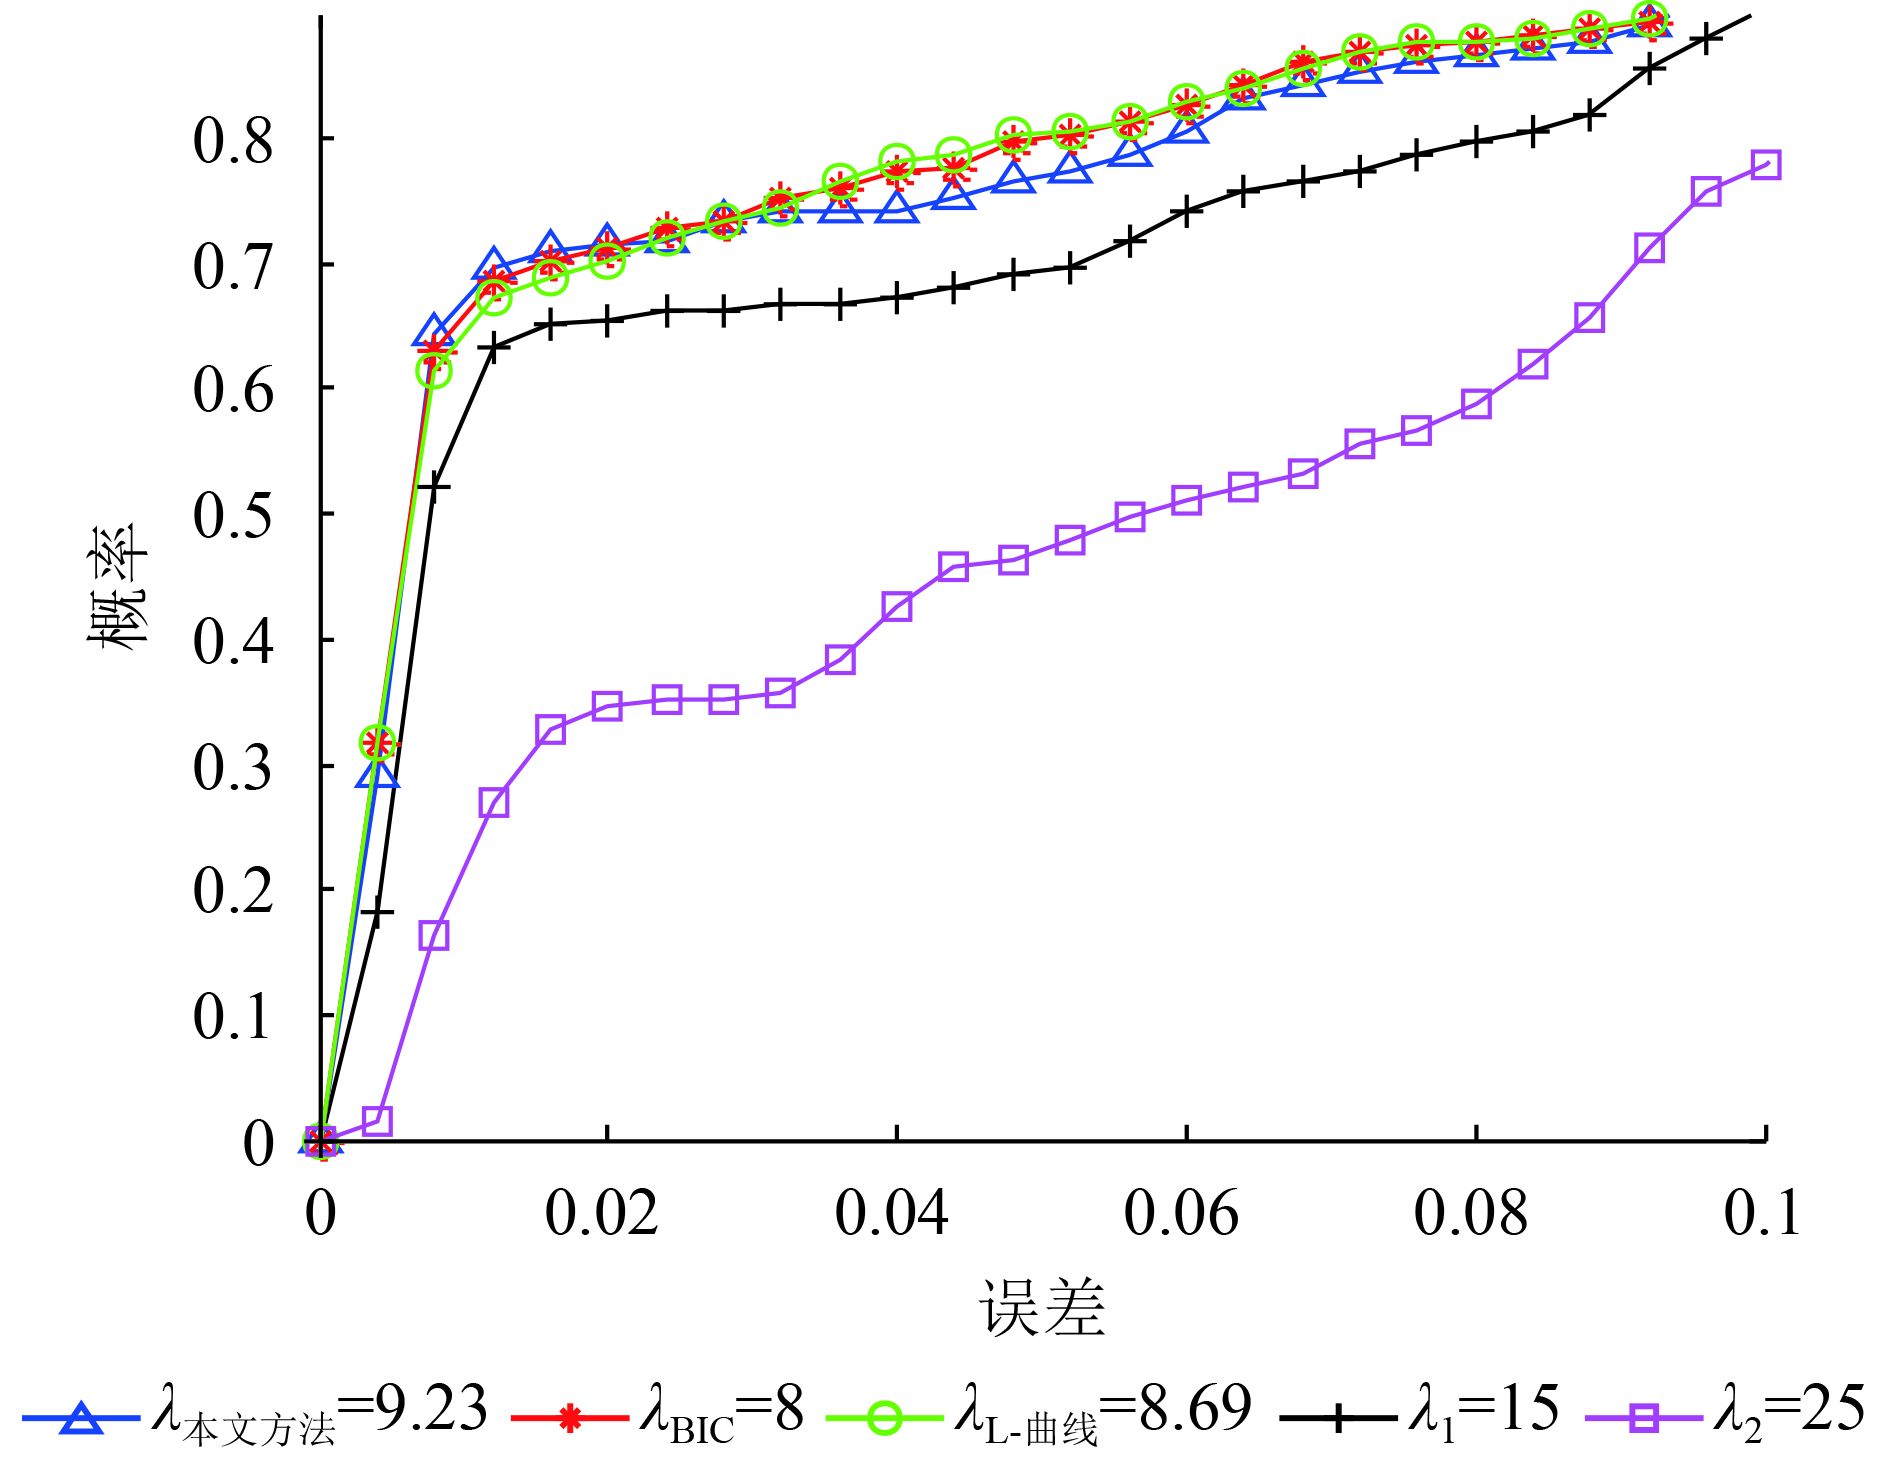
进一步的,我们研究p=0.3的情况。图2表示在不同的正则化参数下式(22)所定义的误差的概率。纵轴表示误差,横轴表示当实际重构误差小于纵轴数值时的概率。我们对1000次的蒙特卡洛仿真结果做统计,计算出实际重构误差小于某一门限值时的仿真次数,将累积次数除以1000则得到了概率。曲线上升的越快表明在此正则化参数下的稀疏重构结果精度越高。从图2可以看出本文方法和BIC,L-曲线方法对应的曲线趋势很相近,并且高于另外两个正则化参数(λ1和λ2)对应的曲线。

|
| 图 2 不同正则化参数下的概率随误差变化曲线(SNR=2 dB, p=0.3, 稀疏度=10) Figure 2 Probability versus error under different regularization parameters (SNR=2 dB, p=0.3, sparsity=10) |
根据上述仿真分析,验证了本文提出的参数选择方法以及模型参数与信号、噪声方差间的关系,得出本文方法在保持精度的情况下计算量远低于其他参数选择方法。
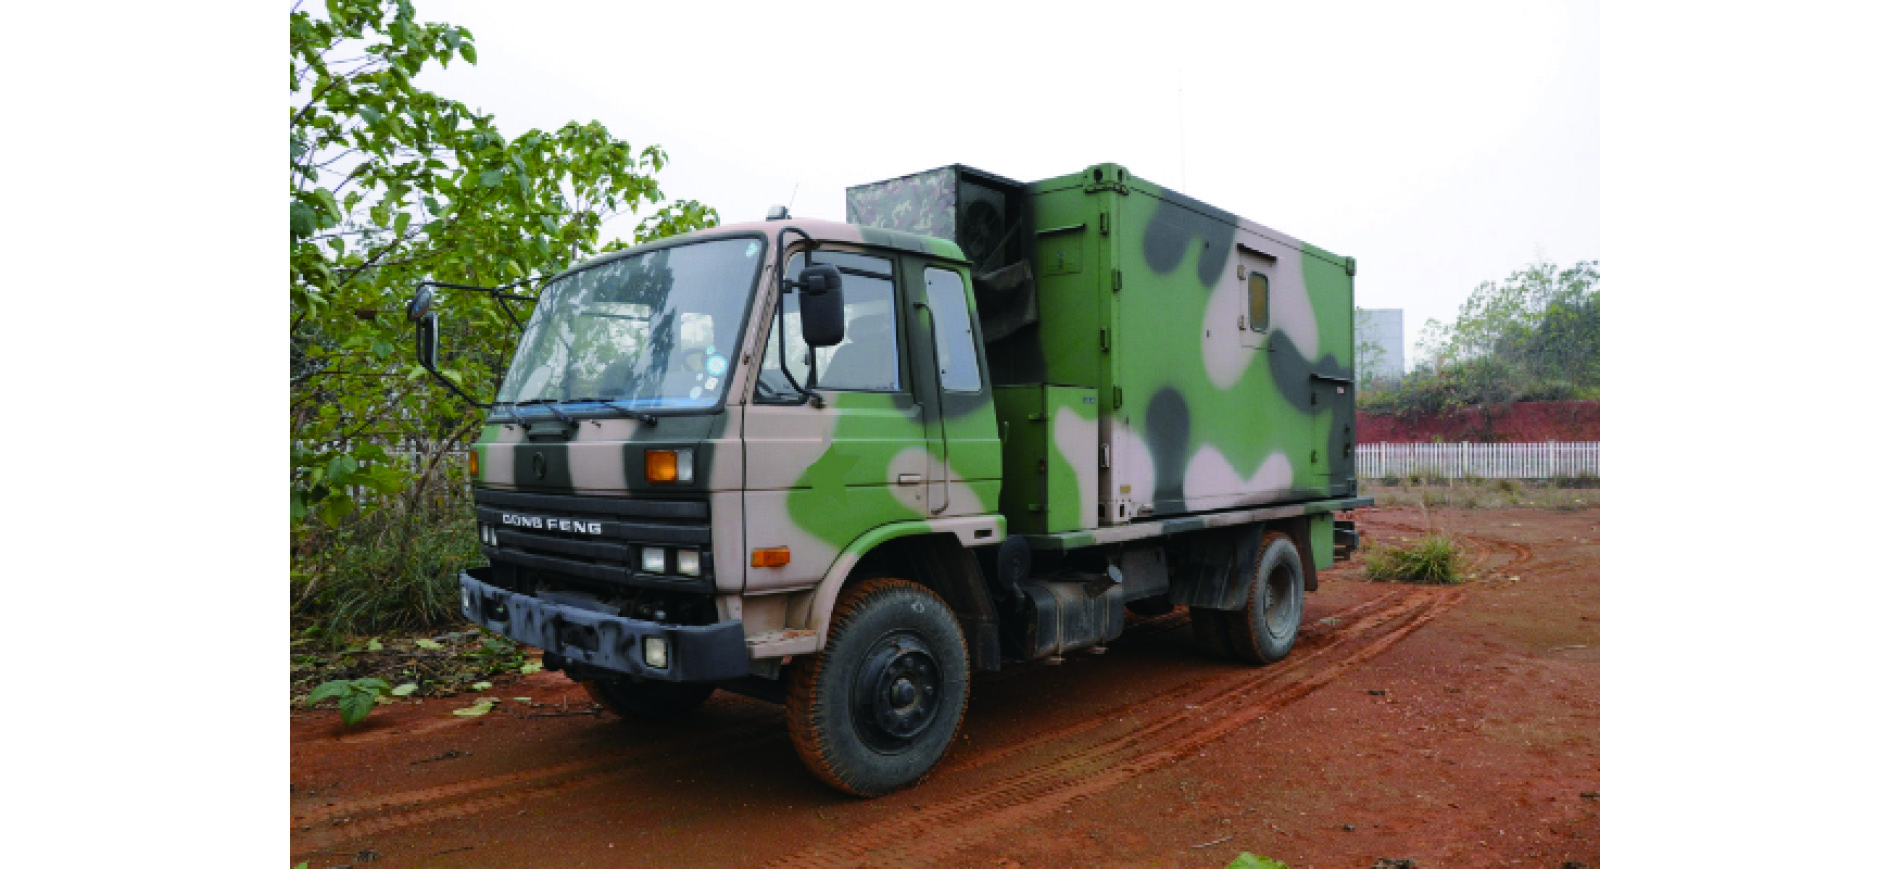
(4.2) 基于实测数据的实验设计与结果分析实验数据在长沙某实验场地录取。实验场地地形略有起伏,覆盖有杂草和少量树木,场景中包含一辆军用卡车。实验场景中建立了一个轨道SAR系统(X波段),由矢量网络分析仪(VNA)、线性轨道、天线系统以及控制计算机构成。矢量网络分析仪在平台上沿着轨道以预设的速度运动。当平台运动的时候,VNA以一定的重复周期发射步进频信号,并且通过电脑控制对回波信号进行采集。通过对宽带步进频测量数据进行相干处理获得雷达距离向高分辨,VNA在线性轨道上的横向运动则形成雷达方位高分辨。表3记录了实验系统中的各项参数。
|
|
表 3 实验系统参数 Table 3 Experimental system parameters |
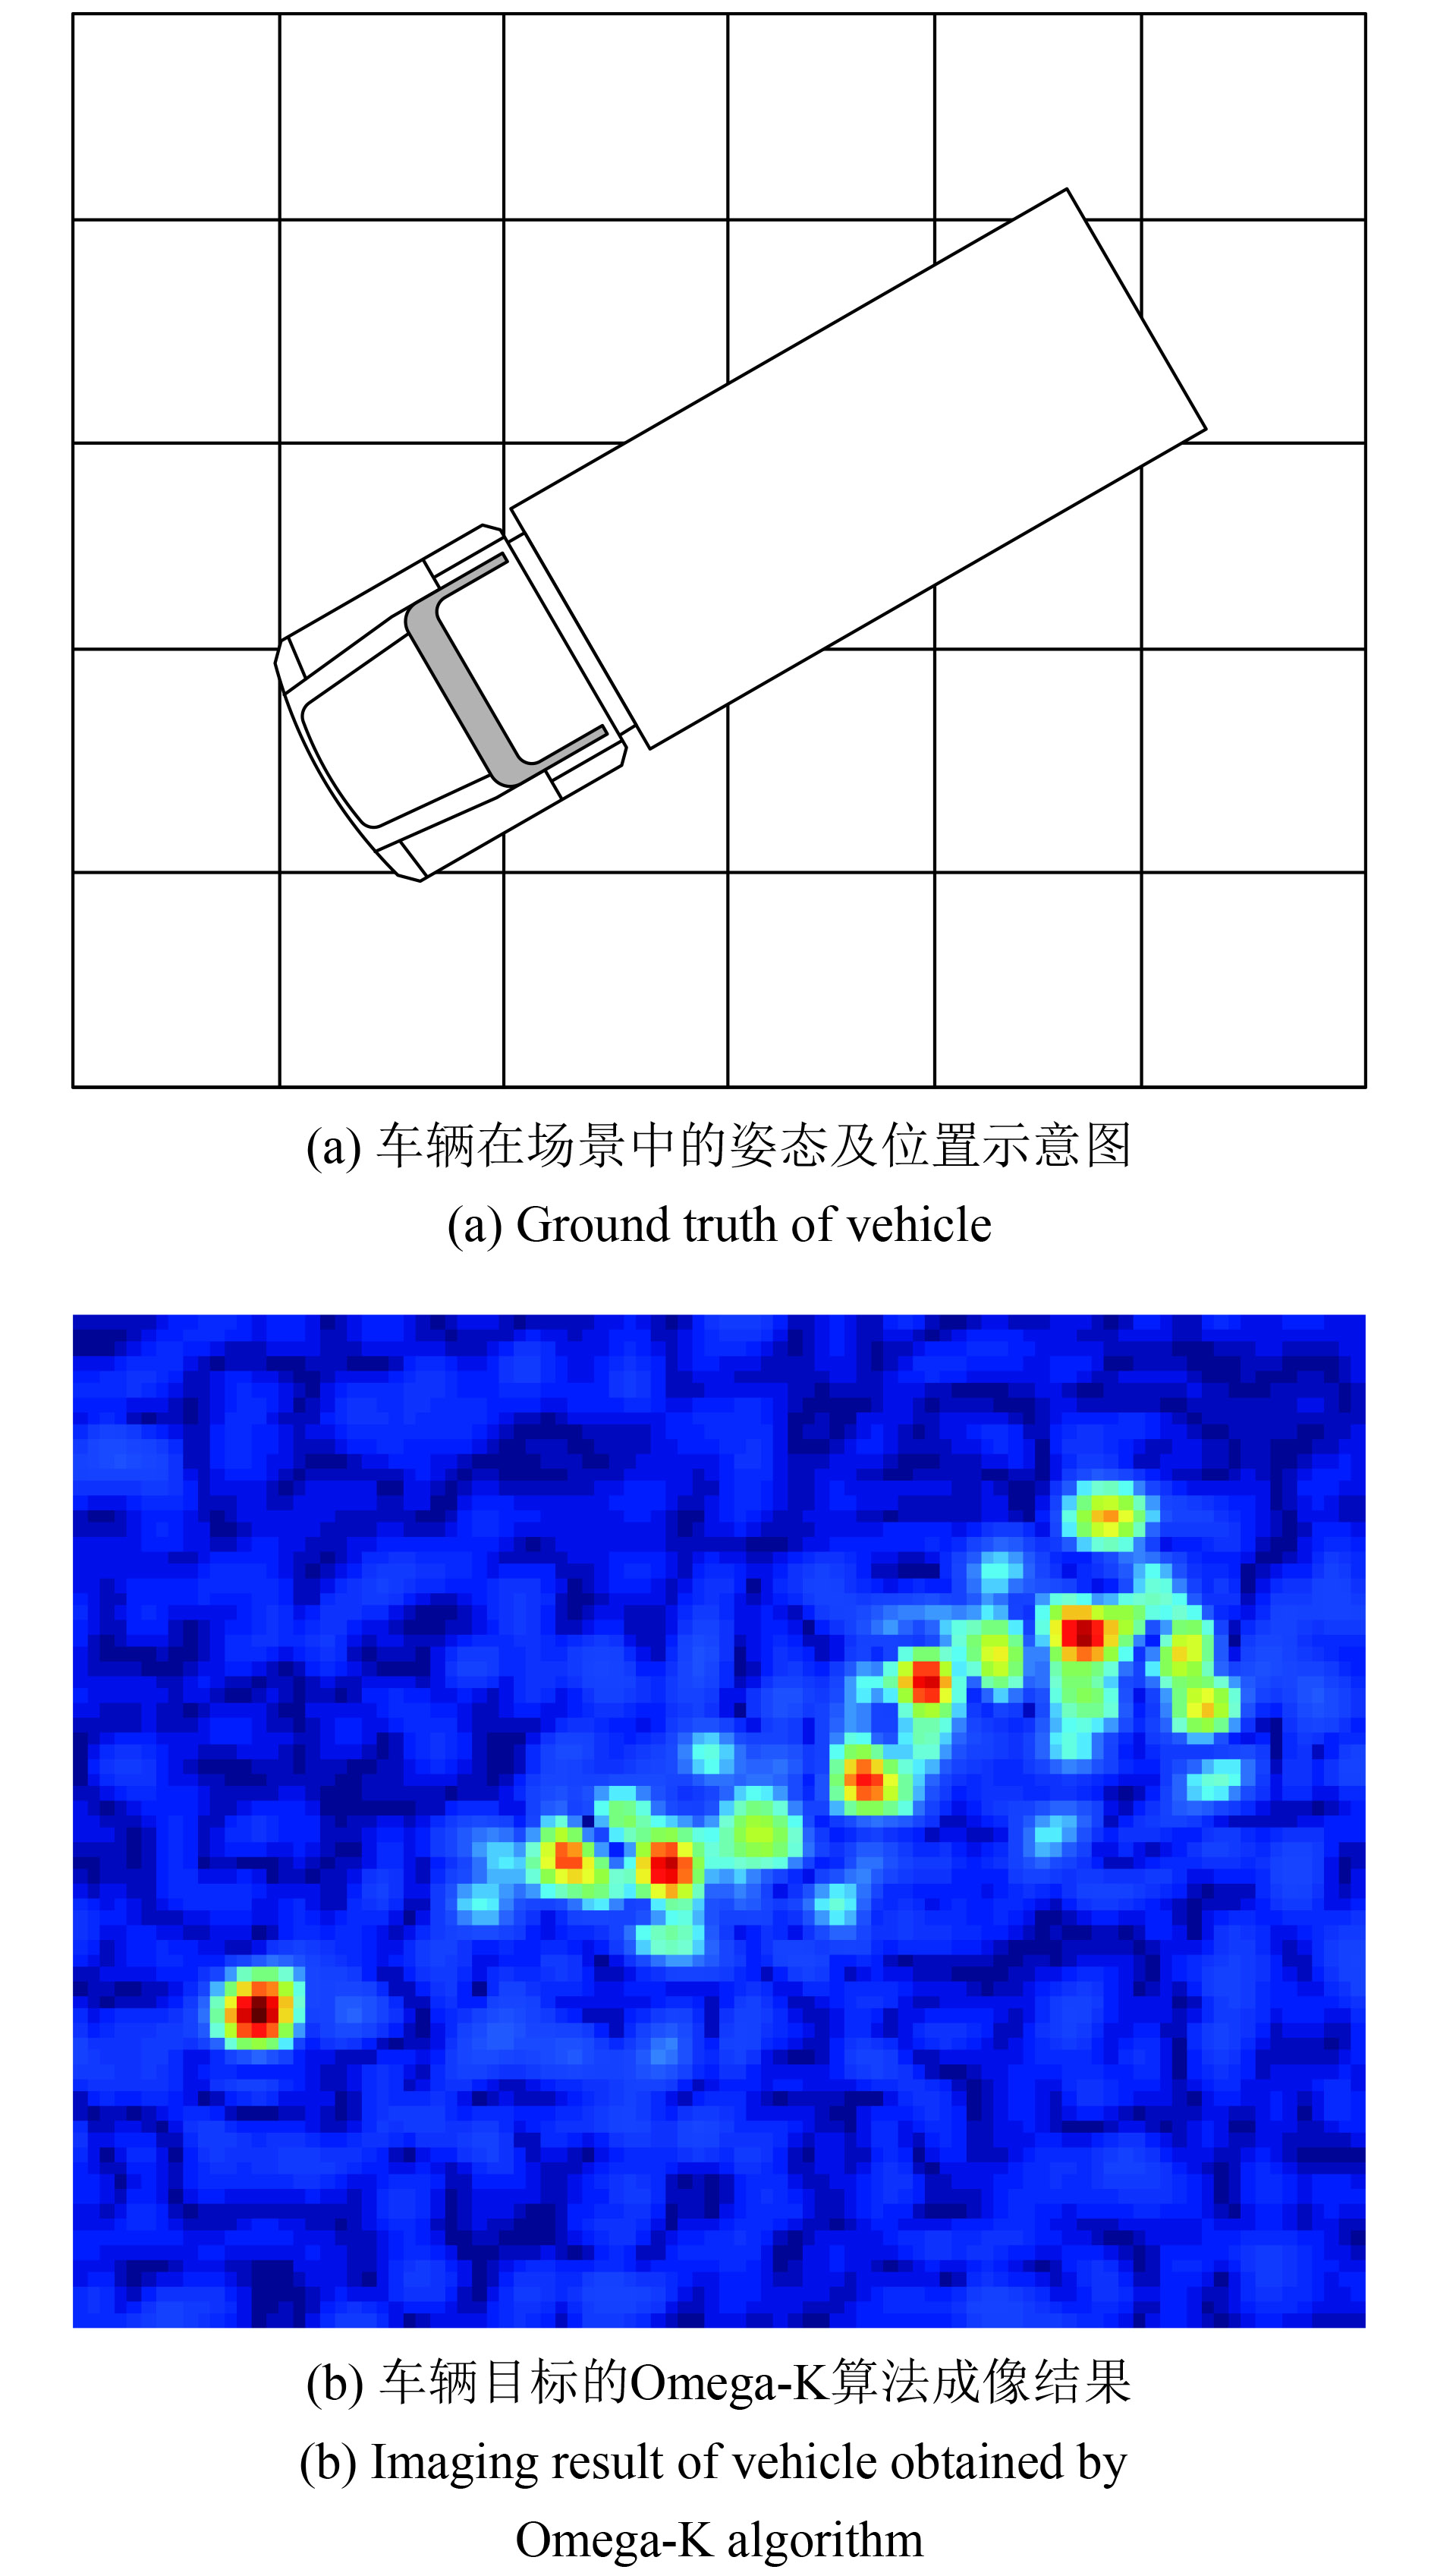
图3给出了场景中车辆目标的光学照片,卡车的车身高3.3 m,宽2.1 m,长6.5 m。图4给出了车辆目标在距离和方位平面内的布置示意图,以及相应的Omega-K算法成像结果。

|
| 图 3 实验场景中车辆目标的光学照片 Figure 3 The photograph of vehicle deployed in test scene |

|
| 图 4 车辆在场景中的示意图及其Omega-K算法成像结果 Figure 4 Ground truth of vehicle and its imaging result by Omega-K algorithm |
图5表示使用不同参数选择方法得到的车辆目标稀疏成像结果。与图4(b)所示的存在噪声且sinc函数包络也比较明显的Omega-K方法的成像结果相比,稀疏成像结果更稀疏,干净并且消除了旁瓣和额外的噪声。根据图5的成像结果可以看出,图5(b)中车身部分的成像结果轮廓和车辆真实轮廓的差异是比较大的,图5(d)和车辆目标真实轮廓差异最大,图5(a)和图5(c)和车辆目标最为接近。因此,使用本文提出的参数选择方法和使用其他参数选择方法的成像精度相当。

|
| 图 5 使用不同参数选择方法得到的车辆目标SAR稀疏成像结果 Figure 5 Comparison of SAR images of vehicle with different parameter selection methods |
表4记录了使用不同的参数选择方法进行稀疏成像的运算时间。很明显,本文方法的运算量远小于BIC和L-曲线方法。
|
|
表 4 使用不同参数选择方法进行SAR稀疏成像的运算时间 Table 4 Run time of SAR imaging under different parameter selection methods |
根据上述的实验结果,验证了本文提出的参数选择方法。相比较于传统成像方法,使用本文提出方法的稀疏成像结果稀疏、降低了旁瓣而且干净无噪声。此外,相比较于其他参数选择方法,本文方法更有优势,在保持了不错的精度的同时计算量远小于其他参数选择方法。
5、结 论成像分辨率对SAR目标识别、参数反演、灾害评估等有重要的影响。传统基于匹配滤波的SAR成像算法的分辨率受限于信号带宽和合成孔径长度。研究表明结合CS理论进行人造目标SAR成像可以大幅提高成像结果的分辨率。然而,此类成像方法存在模型参数的选择问题,传统参数选择方法(BIC、L-曲线)有着计算量大或依赖于特定模型的缺点,因此,进行自适应的参数选择很有必要。
本文基于最大后验概率估计和贝叶斯推理,得出了模型参数和信号,噪声方差的关系,提出了一种无需额外先验信息的自适应参数选择方法。在每一次的迭代过程中,所有需要的参数都通过已知的数据被更新,SAR稀疏成像结果则由已经更新了模型参数的lp范数正则化方法重构得到。通过与其他方法在仿真数据和实测数据上的实验比较发现,相比较于其他参数选择方法,本文方法更有优势,不仅保持了不错的精度且计算量远小于其他方法。此外,模型参数与信号、噪声方法之间的关系在实验中得到了论证。作为一个一般的参数选择方法,本文提出的方法可以被应用在任何一种lp范数正则化算法中。
本文是在SAR稀疏成像背景下提出了一种参数自适应选择方法。实际上,稀疏模型中的参数选择问题在其他应用背景下也依然存在,后续会尝试将本文参数选择方法应用到其他相关领域中,并开展进一步的研究。
| [1] | Austin C D, Moses R L, Ash J N, Ertin E. On the relation between sparse reconstruction and parameter estimation with model order selection[J]. IEEE Journal of Selected Topics in Signal Processing, 2010, 4 (3) : 560 –570. DOI: 10.1109/JSTSP.2009.2038313 |
| [2] | Austin C D, Ertin E, Moses R L. Sparse signal methods for 3-D radar imaging[J]. IEEE Journal of Selected Topics in Signal Processing, 2011, 5 (3) : 408 –423. DOI: 10.1109/JSTSP.2010.2090128 |
| [3] | Candès E J, Romberg J, Tao T. Robust uncertainty principles: exact signal reconstruction from highly incomplete frequency information[J]. IEEE Transactions on Information Theory, 2006, 52 (2) : 489 –509. DOI: 10.1109/TIT.2005.862083 |
| [4] | Cetin M, Karl W C, Castanon D A. Feature enhancement and ATR performance using nonquadratic optimization-based SAR imaging[J]. IEEE Transactions on Aerospace and Electronic Systems, 2003, 39 (4) : 1375 –1395. DOI: 10.1109/TAES.2003.1261134 |
| [5] | Chaari L, Tourneret J Y and Batatia H. 2013. Sparse Bayesian regularization using Bernoulli-Laplacian priors//Proceedings of the 21st European Signal Processing Conference. Marrakech: IEEE: 1–5. |
| [6] | 陈国新, 陈生昌. 位场数据重构的lP范数稀疏约束正则化方法 [J]. 浙江大学学报(工学版), 2014, 48 (4) : 748 –756. Chen G X, Chen S C. Regularization method with lp-norm sparsity constraints for potential field data reconstruction [J]. Journal of Zhejiang University (Engineering Science), 2014, 48 (4) : 748 –756. DOI: 10.3785/j.issn.1008-973X.2014.04.027 |
| [7] | Chen S. 2002. Locally regularised orthogonal least squares algorithm for the construction of sparse kernel regression models//Proceedings of the 6th International Conference on Signal Processing. Beijing: IEEE: 1229–1232 [DOI: 10.1109/ICOSP.2002.1180013] |
| [8] | Chien J T. Laplace group sensing for acoustic models[J]. IEEE/ACM Transactions on Audio, Speech, and Language Processing, 2015, 23 (5) : 909 –922. DOI: 10.1109/TASLP.2015.2412466 |
| [9] | Cotter S F, Rao B D, Engan K, Kreutz-Delgado K. Sparse solutions to linear inverse problems with multiple measurement vectors[J]. IEEE Transactions on Signal Processing, 2005, 53 (7) : 2477 –2488. DOI: 10.1109/TSP.2005.849172 |
| [10] | Keller J B. Geometrical theory of diffraction[J]. Journal of the Optical Society of America, 1962, 52 (2) : 116 –130. DOI: 10.1364/JOSA.52.000116 |
| [11] | Lu H P, Eng H L, Guan C T, Plataniotis K N, Venetsanopoulos A N. Regularized common spatial pattern with aggregation for EEG classification in small-sample setting[J]. IEEE Transactions on Biomedical Engineering, 2010, 57 (12) : 2936 –2946. DOI: 10.1109/TBME.2010.2082540 |
| [12] | Seeger M W. Bayesian inference and optimal design for the sparse linear model[J]. The Journal of Machine Learning Research, 2008, 9 : 759 –813. |
| [13] | Tan X, Roberts W, Li J, Stoica P. Sparse learning via iterative minimization with application to MIMO radar imaging[J]. IEEE Transactions on Signal Processing, 2011, 59 (3) : 1088 –1101. DOI: 10.1109/TSP.2010.2096218 |
| [14] | Wang Z Y, Hu R M, Wang S Z, Jiang J J. Face hallucination via weighted adaptive sparse regularization[J]. IEEE Transactions on Circuits and Systems for Video Technology, 2014, 24 (5) : 802 –813. DOI: 10.1109/TCSVT.2013.2290574 |
| [15] | Xu Z B, Chang X Y, Xu F M, Zhang H. L1/2 regularization: a thresholding representation theory and a fast solver [J]. IEEE Transactions on Neural Networks and Learning Systems, 2012, 23 (7) : 1013 –1027. DOI: 10.1109/TNNLS.2012.2197412 |
| [16] | Zhang Y, Zhou G X, Jin J, Zhao Q B, Wang X Y, Cichocki A. Aggregation of sparse linear discriminant analyses for event-related potential classification in brain-computer interface[J]. International Journal of Neural Systems, 2014, 24 (1) : 1450003 . DOI: 10.1142/S0129065714500038 |
| [17] | Zhao Q B, Zhang L Q, Cichocki A. Bayesian CP factorization of incomplete tensors with automatic rank determination[J]. IEEE Transactions on Pattern Analysis and Machine Intelligence, 2015, 37 (9) : 1751 –1763. DOI: 10.1109/TPAMI.2015.2392756 |

