
|
收稿日期: 2015-06-17; 修改日期: 2016-02-05;
优先数字出版日期: 2016-07-25
基金项目: 国家重点基础研究发展计划(973计划)(编号:2010CB950802);国家自然科学基金项目(编号:41575033);北京市自然科学基金(编号:8153039);
第一作者简介:
何文英(1973-)女,副研究员,主要从事卫星遥感理论和应用研究。E-mail:hwy@mail.iap.ac.cn
通讯作者简介: 凌超(1984-),男,助理研究员,主要从事中层大气研究。E-mail:lc@mail.iap.ac.cn
中图分类号: TP79
文献标识码: A
文章编号: 1007-4619(2016)04-0540-09
|
摘要
为了解中国上空SAGE反演的平流层气溶胶数据质量,将合肥地区地基激光雷达观测10年(1996年-2005年)的气溶胶数据与SAGE资料进行比较。通过较为系统全面的比较分析,得到如下结果:(1)10-30 km内SAGE与LiDAR分析的气溶胶变化趋势较为一致,出现峰值和低值的位置也较为接近;(2)SAGE结果普遍比LiDAR测量的偏小,对应的平流层气溶胶AOD差异显著,定量表现为:激光雷达获取的平流层气溶胶AOD基本约为0.004,SAGE反演的平流层气溶胶AOD基本约为0.002,只有前者的一半;(3)两者分析的20-35 km气溶胶季节分布差异较小,再次表明平流层气溶胶比较稳定。
关键词
平流层气溶胶 , SAGE , 地基激光雷达 , 消光系数 , 光学厚度
Abstract
This study aims to assess the quality of retrieved stratospheric aerosol data from the Stratospheric Aerosol and Gas Experiment (SAGE) in China. Data from 10-year observation of ground LiDAR in Hefei, China were comparedwith the corresponding SAGE aerosol dataset. This work focused on the 20-40 km aerosol extinction profile and AOD to elucidate stratospheric aerosol. Two methods were used to form matching pair for LiDAR and SAGE because of the limited observation samples in Hefei for SAGE limb detection. The first method is singe profile matching, which matches the observed aerosol profile within the same day with the temporal and 10° spatialdistancetoobtain approximately 24 matching pairs. The second method is multi-profile matching, which matches the aerosol profiles with the 10° spatial distance within a certain period, such as per season; subsequently, differences in the averaged profiles were compared among the four seasons. Comprehensive comparisons show that aerosol variation trends are consistent when derived from LiDAR and SAGE in 10-30km. The positions of peaks and valleys of the aerosol extinction profile are similar. In addition, aerosol seasonal differences in 20-35km from LiDAR and SAGE, respectively, are relatively smaller, which reflects the stability of stratospheric aerosol. However, the detailed value distribution shows that the SAGE results are generally smaller than those of LiDAR, and their corresponding AODs differ within 20-40km. The quantitative results show that the aerosol AOD within 20-40 km as observed by LiDAR is approximately 0.004; the corresponding results retrieved by SAGE is approximately 0.002, which is only half of the former. The evident differences in LiDAR and SAGE results for stratospheric aerosol AOD and their extinction profiles are mainly attributed to their different measurement and retrieval methods. Furthermore, large temporal and spatial scales are required to match the LiDAR and SAGE observations, which may cause uncertainties in the compared results because of different detection technologies employed. Moreover, the SAGE aerosol profile was retrieved from Mie scattering theory. By contrast, the LiDAR aerosol profile was calculated using Fernald method, which requires the adjustment of several important constants, such as back scattering ratio and reference height. Artificial choices for these constants increase the possibility of errors for LiDAR aerosol retrieval. Therefore, different and complex retrieval methods can increase bias in the compared results. Comparisons of aerosol within 20-40 km from SAGE and LiDAR in Hefei, China show that variation in stratospheric aerosol is generally reasonable as reflected by SAGE retrieval. The quantitative AOD value is systemically lower than half of that detected by ground LiDAR.
Key words
stratospheric aerosol , SAGE , ground LiDAR , extinction coefficient , optic depth
1 引 言
大气气溶胶是指悬浮在大气中大小为1—20 μm的液态或固态粒子,根据分布高度不同,划分为对流层气溶胶和平流层气溶胶。目前,对流层气溶胶的观测及分析研究较为广泛,而平流层有限的观测资料致使对平流层气溶胶的理解较少。随着近年对全球气候变化的关注和研究,平流层气溶胶在全球大气辐射与化学平衡中的重要作用以及对全球气候变化的重要影响也颇受关注,增强了平流层气溶胶的研究需求。
最初,国外学者利用一系列探测仪器展开对平流层气溶胶各种参数的定量测量(Junge等,1961; Fiocco和Grams,1966; Rosen,1971;McCormick等,1979)。随着星载平流层气溶胶和气体实验SAGE(Stratospheric Aerosol and Gas Experiment)的出现(Mauldin等,1985),国外学者对临边探测的SAGE资料获取的平流层气溶胶进行大量研究。一方面利用SAGE资料反演平流层气溶胶成分和粒子谱分布,分析平流层气溶胶纬度和季节变化(Brogniez和Lenoble,1991;Hitchman等,1994; Yue等,1994;Yue,1999;Bingen等,2004a,b);另一方面开展大量比较验证工作,如Osborn等人(1989)利用Dustsonde和激光雷达反演气溶胶消光系数,与SAGE Ⅱ在1984—1986年获取的消光系数资料对比,结果表明从对流层顶至28 km 3种测量一致。Burton等人(1999)利用ILAS和SAGE Ⅱ 资料对比分析了1997年冬季一周的平流层气溶胶可见光消光系数廓线。Antuña等人(2002)利用两台激光雷达验证了Pinatubo火山爆发后SAGE Ⅱ的观测,结果显示可以联合激光雷达和卫星观测来建立一个改进的平流层气溶胶资料。Thomason等人(2007)比较SAGE Ⅱ 与 POAM Ⅲ测量数据,认为中纬度地区的SAGE数据可靠性较强,并且SAGE极地气溶胶的数据质量也不错。
国内在利用SAGE卫星资料研究平流层气溶胶变化方面做了不少工作。陈洪滨等人(1994)利用SAGEⅡ 中1.02 μm的气溶胶消光系数资料分析Pinatubo火山喷发前后平流层气溶胶的变化特征。李维亮和于胜民(2001)和刘煜等人(2007)都利用SAGE Ⅱ资料分析青藏高原平流层气溶胶和臭氧的时空变化特征。王开存等人(2004)利用SAGE Ⅱ资料分析了1984年—2000年印度洋与中国地区上对流层和平流层(10 km以上)气溶胶变化和输送特征。结果显示气溶胶光学厚度在低纬度大,在印度洋岛屿上空的3个高值中心与对流层中上层的上升气流的高值中心相对应。关于SAGE资料在我国上空的质量验证方面,吴永华等人(2001)利用安光所一台探测平流层气溶胶的激光雷达数据初步分析了1991年—1998年平流层气溶胶消光系数和积分体后向散射系数的变化特征,并与SAGE Ⅱ 观测结果进行了对比,初步结果显示一致。
由于平流层气溶胶观测资料较少,星载SAGE资料在平流层气溶胶研究方面发挥着极其重要的作用,其数据质量虽然已在国外经过大量比较验证,但在中国地区的验证工作尚有限。因此,本文将比较分析更长时间的地基激光雷达观测和SAGE卫星数据,增强对这两种不同探测方式获取的平流层气溶胶数据的认识和理解。
2 数据介绍
2.1 SAGE 资料
本文使用平流层气溶胶和气体实验Ⅱ SAGE Ⅱ(Stratospheric Aerosol and Gas Experiment Ⅱ)的数据,它是搭载在1984年10月发射的地球辐射收支观测ERBS(Earth Radiation Budget Satellite)卫星上用于观测上对流层和平流层(10-40 km)的化学和动力过程的仪器。SAGE Ⅱ仪器作为SAMⅡ、SAGE Ⅰ仪器的后续仪器,利用自校准太阳掩星方法提供几乎全球的气溶胶、臭氧,NO2以及水汽资料。当卫星位于日出和日落时,SAGE Ⅱ仪器利用太阳掩星技术在7个通道(波长位于0.385—1.02 μm)测量地球临边方向经过大气衰减的太阳辐射,同时也测量外层未经衰减的太阳辐射,用于计算大气透过率。7通道中波长为0.385 μm,0.453 μm,0.525 μm和1.02 μm的4个通道用于反演气溶胶,提供气溶胶消光系数廓线。本文使用SAGE Ⅱ最新提供的1996年—2005年的气溶胶资料。
2.2 地基激光雷达(LiDAR)
本文采用中国科学院安徽光学精密机械研究所研制的L625 激光雷达(LiDAR)测量的平流层气溶胶资料与SAGE资料进行比对分析。L625 米散射激光雷达系统主要由激光发射、回波信号接收和数据采集及控制3部分组成。通过Nd∶YAG激光器输出波长532 nm作为探测激光,其工作频率为10 Hz,单脉冲能量约为70 mJ,脉宽为18 ns,光束发散角小于1 mrad。激光器发射10000—20000 个激光脉冲,回波信号采样的距离分辨率为150 m,采样最大高度为150 km。考虑到白天天空背景噪声大以及回波信号较弱,一般在晴朗无云夜晚观测,能够测量合肥(31.87°N,117.28°E)地区0—40 km的大气气溶胶。
LiDAR采用Fernald方法计算气溶胶的后向散射系数和消光系数(Ferna,1984)。其中空气分子的后向散射系数及消光系数由气象探空给出,其后向散射比(消光系数与后向散射系数的比值)取为8π/3;不同高度上的气溶胶后向散射比取15—50 之间的常数(Takamura和Sasano,1987;Sasano,1996);参考高度即清洁大气层的高度一般选在30 km 左右,气溶胶与分子的体后向散射系数之比取为0.01(Sasano和Browell,1989)。
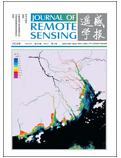
为了和SAGE卫星数据进行比对,选取1996年10月—2005年11月的激光雷达观测数据,主要是5—40 km气溶胶消光系数和散射比廓线,垂直分辨率为150 m。由于LiDAR测量受天气影响较为显著,尤其是探测中高层大气气溶胶,因此每年能够探测到20 km以上的有效廓线较为有限。统计这10年LiDAR测量数据,除了1998年探测到约100条廓线外,大多数年份探测有效的气溶胶廓线少于50条。然后,选取有效探测高度在20 km以上的廓线近400条,分析这些样本在20 km以上的气溶胶光学厚度(AOD)与其对应廓线顶高度(Htop)的关系(图 1)。从两者散点图可看到,LiDAR观测的气溶胶廓线能够达到30—40 km,测量的合肥上空平流层气溶胶AOD普遍小于0.005,除个别观测达到0.01高值。
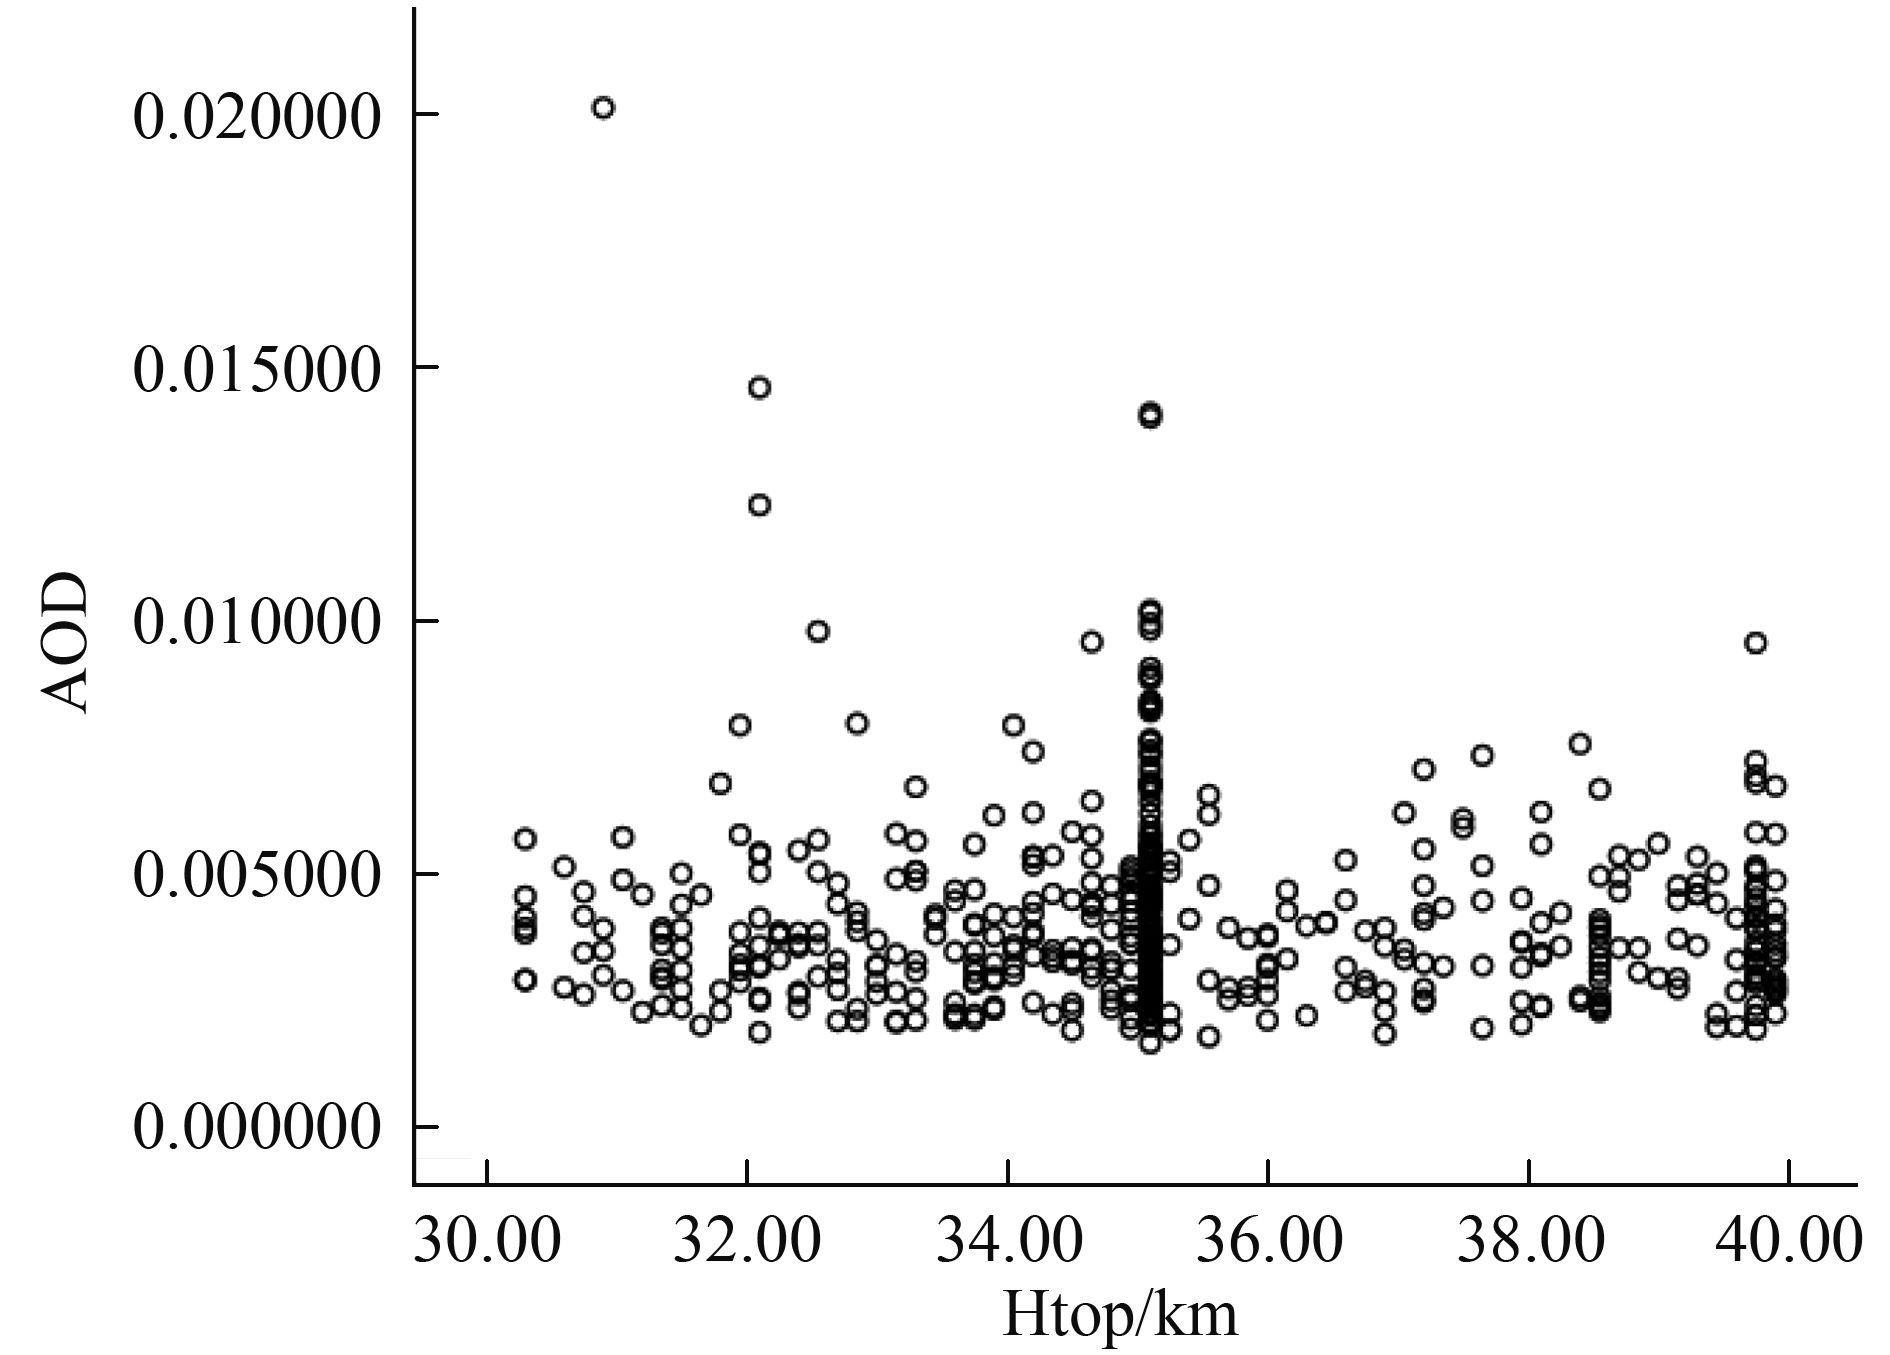

进一步分析LiDAR观测的气溶胶消光系数廓线在不同季节中的分布,如图 2所示。可看到15 km以下,除了春季变化较为显著,其他季节的气溶胶消光系数变化较小;然后在18 km附近出现极大值,即气溶胶Junge层;18 km以上基本随着高度增加逐渐减少。从季节变化范围和幅度来看,4个季节的分布差异较小,尤其在20 km以上,这说明平流层气溶胶较稳定。
3 SAGE与地基激光雷达比较
由于平流层气溶胶相对比较稳定,LiDAR 532 nm波长与SAGEⅡ 525 nm通道的波长接近,因此合肥地区的LiDAR与SAGE Ⅱ探测的平流层气溶胶具有一定可比性。
为了匹配SAGE临边探测数据和LiDAR单站观测数据,也考虑到平流层气溶胶水平范围变化相对较小,选取以LiDAR为中心,与其空间距离小于10°的SAGE气溶胶数据;并且根据匹配时间不同形成两种匹配数据:
(1) 单个廓线比较: 即与LiDAR测量同年同月同日,空间距离≤10°的SAGE数据.
(2) 较长时间内平均廓线的比较: 即与LiDAR测量的空间距离≤10°,比较两者在同一时间段,如季节内的平均廓线。
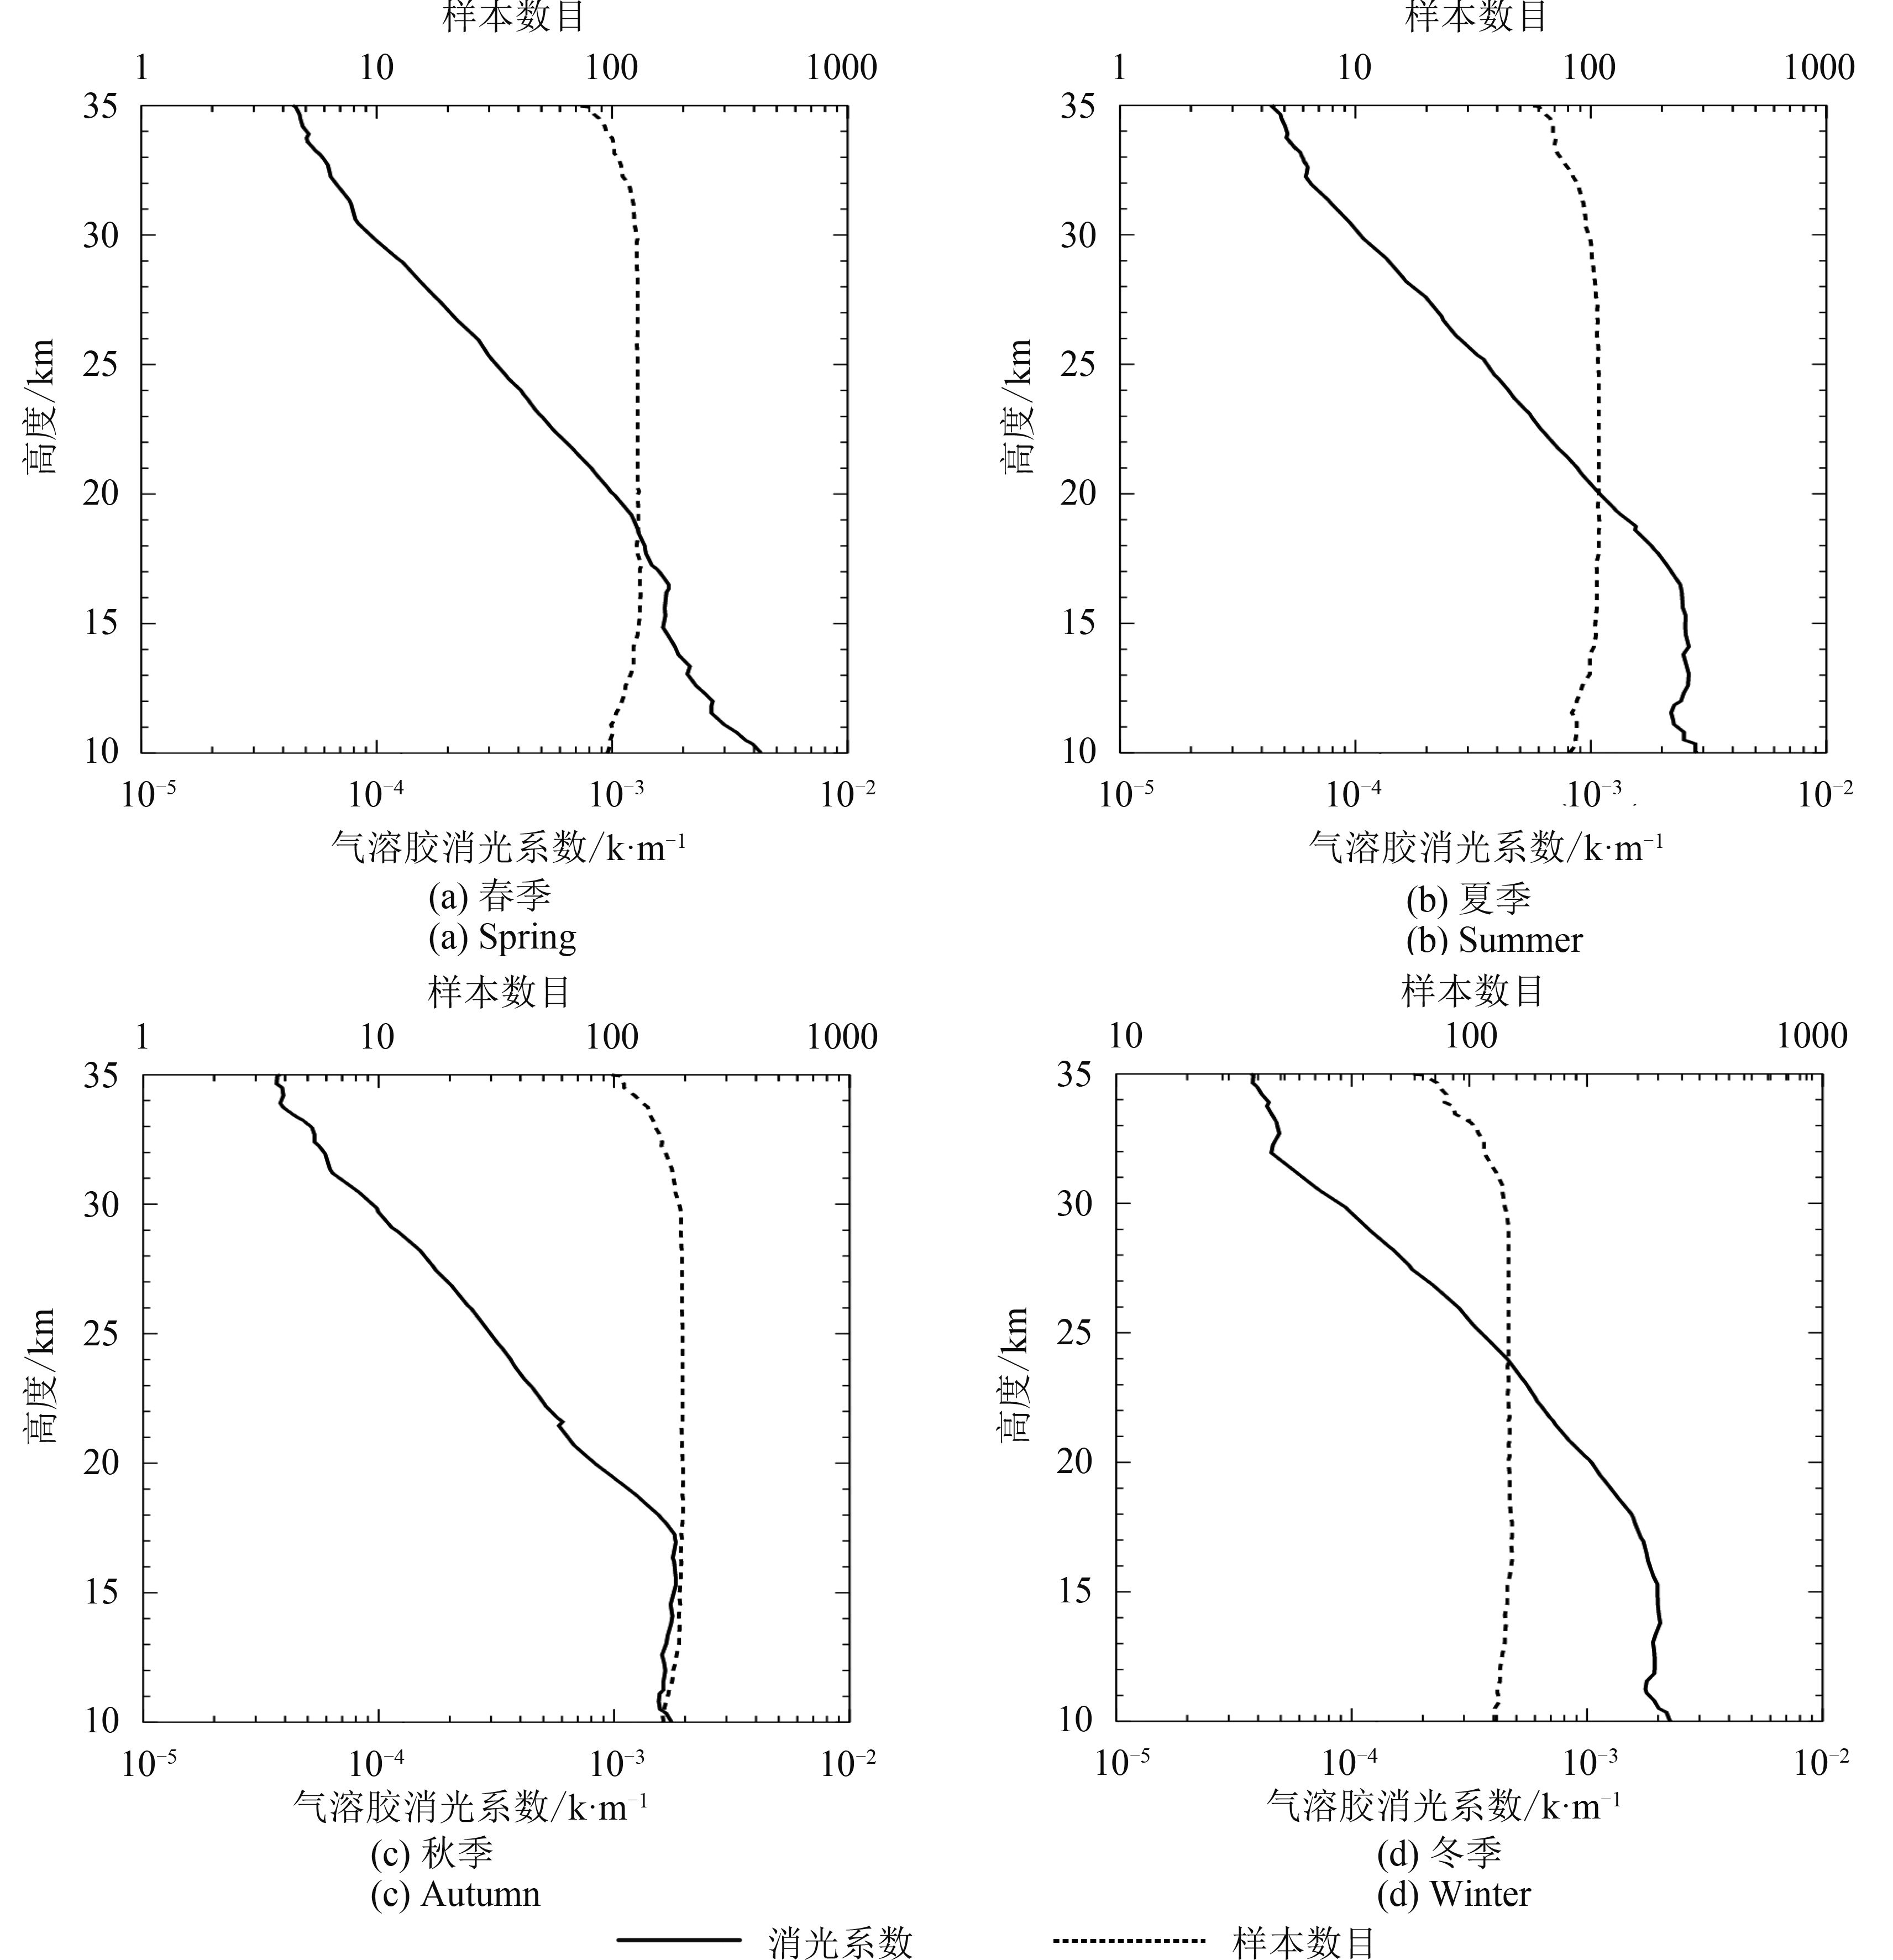
首先,图 3显示同年同月同日两者单个廓线匹配的4个个例比对结果,可以看到,无论两者相距较近或者较远,其对应的气溶胶消光系数在10—30 km内观测趋势基本一致,出现峰值和低值的位置也较为接近,尤其是两者基本均在18 km附近出现较强的气溶胶Junge层;具体量值上,SAGE结果普遍比LiDAR测量结果偏小,尤其在对流层差异较为明显。该比对结果与Antuña等人(2002)开展的两台地基LiDAR与SAGE资料的比较结果较为一致,即都存在SAGE反演的气溶胶消光系数比地基LiDAR反演结果偏小的现象。
由于探测方法和探测范围的差异,以及SAGE卫星探测到中国上空时间较为有限,能够与地基激光雷达同日匹配的单个廓线也只有24个,图 4显示这些匹配数据得到的20—40 km气溶胶AOD差异。总体看来,激光雷达获取的合肥地区平流层气溶胶AOD基本都在0.004附近变化,而对应的SAGE临边探测的该地区平流层气溶胶AOD基本约为0.002,只有前者的一半。对于两者AOD差异较小和较大的两个个例,如第21和第22个例,进一步显示其对应的消光廓线分布图,很明显在20 km以上,AOD差别较小的第21个匹配廓线对应的两者消光系数差异也很小,并且在平流层低层LiDAR比SAGE偏高点,而平流层中上层出现相反的变化,因此两者在整个平流层的总体结果很接近;而对于AOD差异显著的第22个匹配廓线,很明显两者消光系数在20 km以上就是LiDAR一直比SAGE偏高,致使两者在平流层整层积分得到的AOD差异更为显著。关于平流层AOD,Yue等人(2005)在比较SAGE Ⅱ与Ⅲ反演气溶胶消光属性的评估中,提到两者反演的平流层AOD(主要从对流层顶以上2—30 km)主要介于0.002—0.008,本文无论是地基LiDAR或是SAGE分析的平流层AOD都位于该范围,表明该结果是合理可信的。

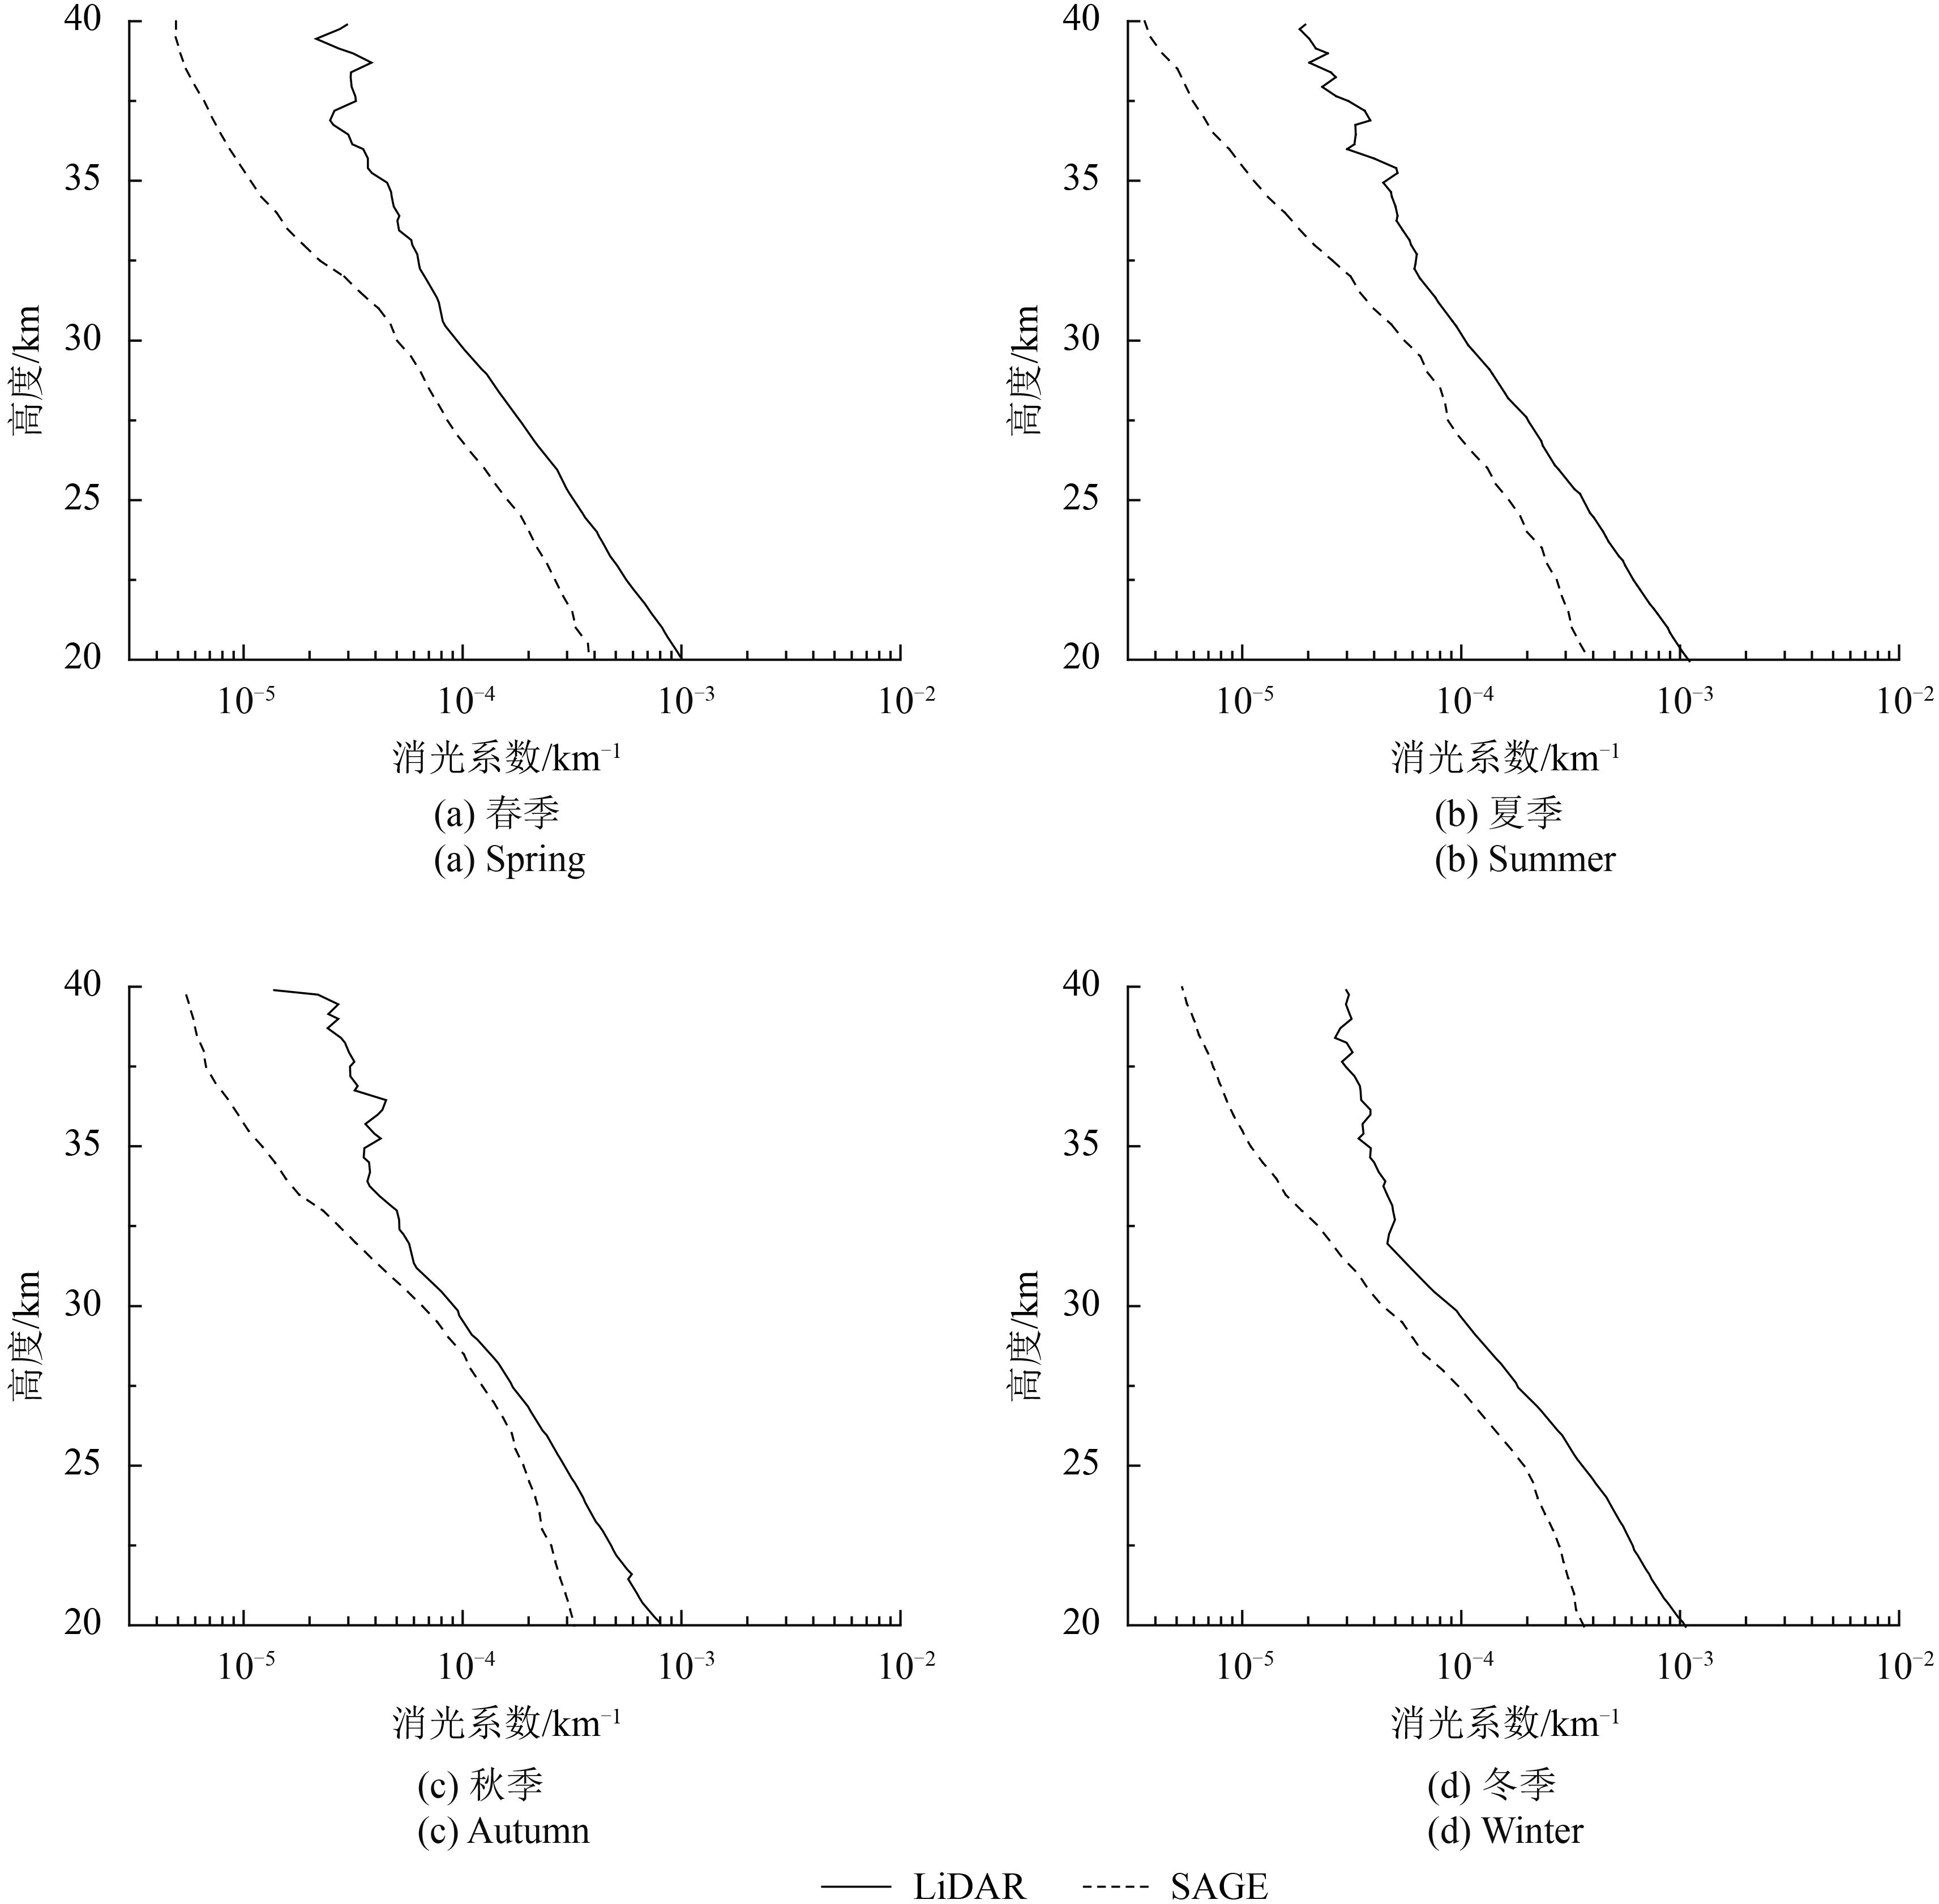
上文都是匹配同日单个廓线比对结果,鉴于样本匹配较为有限,而平流层气溶胶时间变化相对较小,采用同一时段内空间距离较近(如≤10°)能够匹配的LiDAR与SAGE气溶胶数据进行比对分析。本文选取一年4个季节划分匹配时段,这样相对匹配的样本增多,如春季约有50条匹配廓线。图 5显示4个季节中匹配廓线平均的比较结果,整体上4个季节的平流层气溶胶变化趋势和程度都很接近,尤其是25 km以上显著减少;四季比对中仍然显示LiDAR和SAGE廓线在平流层存在较为稳定的差异,基本都是SAGE廓线偏低与LiDAR测量结果,并且秋冬季节差异相比较春夏季节要偏小,尤其秋季在20—30 km范围内两者最为接近。
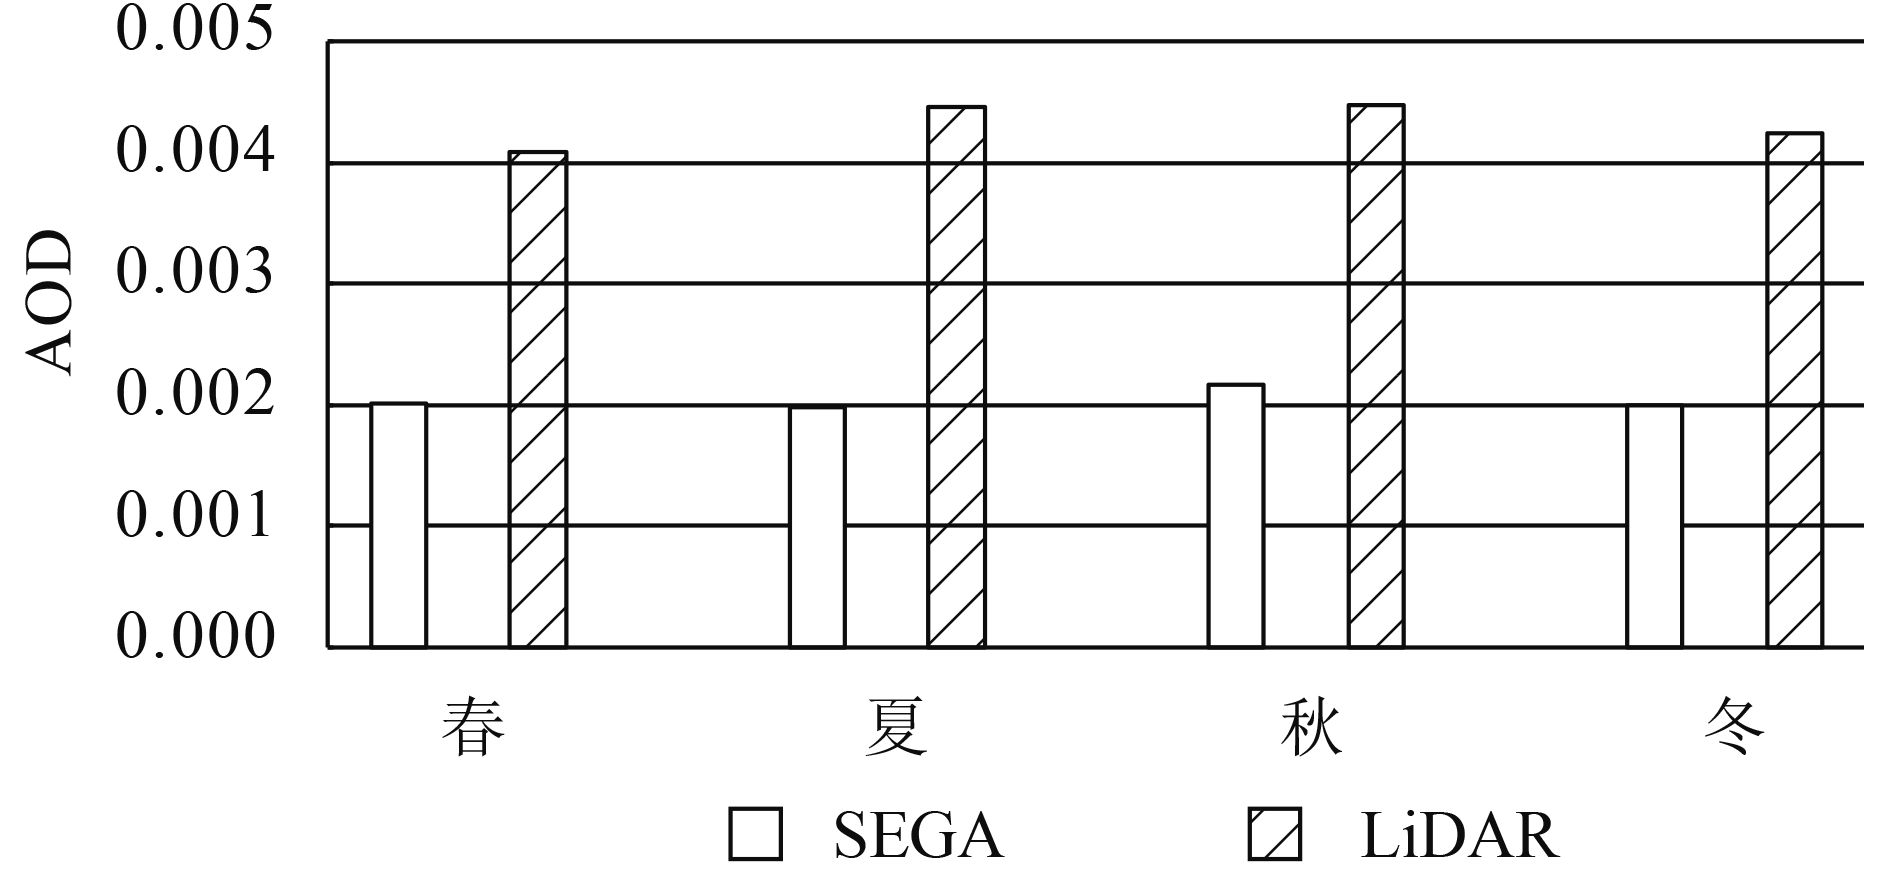
基于上述季节匹配廓线数据,进一步分析其对应的20—40 km气溶胶AOD季节差异,如图 6所示,4个季节的平流层AOD差异较小,基本是夏秋两季略微偏高,并且LiDAR测量的平流层AOD基本约为0.004,SAGE反演的AOD普遍为0.002,即SAGE获取的该地区平流层AOD仅是LiDAR观测结果的一半。
SAGE卫星探测的平流层气溶胶与LiDAR测量结果存在上述差异,一方面是两种数据探测方式不同,另一方面是各自反演算法不同。由于SAGE数据是利于太阳掩星的临边探测方式获取,其每条气溶胶廓线水平覆盖上千公里,并且基本在1分钟内完成;而地基激光雷达只扫描其顶部上空的大气气溶胶,并且由于脉冲频率不同接收每条廓线需要几分钟甚至几十分钟。而且,这两种数据的时空匹配尺度较大,容易引入较多匹配误差。另外,两种探测数据采用不同反演方法获得大气气溶胶。SAGE的气溶胶廓线是基于Mie散射理论反演得到,而LiDAR采用Fernald方法计算气溶胶的后向散射系数和消光系数。尤其对于后者,在反演过程中,需要假设几个重要参数,如气溶胶消光后向散射比、参考高度等。陶宗明等人(2011)的研究表明对LiDAR反演气溶胶消光系数相对误差较大的应该是后向散射比,其准确性在激光雷达数据反演中至关重要。夏俊荣(2010)比较后向散射比分别取20 sr与50 sr时,得出的气溶胶消光系数廓线差别很大。在本文研究中,不同高度上的气溶胶后向散射比取为定值(15—50 之间)。可见,在LiDAR反演大气气溶胶消光系数廓线时,后向散射比要尽量接近实际的数值,才能获得较准确的反演结果。
4 结 论
为了更加定量、正确认识SAGE气溶胶数据对中国地区平流层气溶胶的描述能力,本文采用10年合肥地区的地基激光雷达观测加以比对分析。通过较为系统全面地比较分析,得到如下结果:(1) 10—30 km内SAGE与LiDAR分析的气溶胶变化趋势较为一致,出现峰值和低值的位置也较为接近;(2) SAGE结果普遍比LiDAR测量的偏小,对应的平流层气溶胶AOD差异显著,定量表现为:激光雷达获取的平流层气溶胶AOD基本约为0.004附近,SAGE反演的平流层气溶胶AOD基本约为0.002,只有前者的一半;(3) 两者分析的20—35 km气溶胶季节分布差异较小,再次表明平流层气溶胶比较稳定。
对于SAGE与LiDAR获取的平流层气溶胶之间存在的具体差异,还需要在其反演算法方面做更多深入分析,也需要增加更多辅助数据加以论证比较,找出差异的真实原因,从而有效改善数据质量。
参考文献(References)
-
Antuña J C, Robock A, Stenchikov G L, Thomason L W, Barnes J E.2002.Lidar validation of SAGE Ⅱ aerosol measurements after the 1991 Mount Pinatubo eruption. Journal of Geophysical Research, 107 (D14) : ACL 3-1–ACL 3-11 . [DOI:10.1029/2001JD001441]
-
Bingen C, Fussen D, Vanhellemont F.2004a.A global climatology of stratospheric aerosol size distribution parameters derived from SAGE Ⅱ data over the period 1984-2000:1. Methodology and climatological observations. Journal of Geophysical Research, 109 : D06201 [DOI:10.1029/2003JD003518]
-
Bingen C, Fussen D, Vanhellemont F.2004b.A global climatology of stratospheric aerosol size distribution parameters derived from SAGE Ⅱ data over the period 1984-2000:2. Reference data.Journal of Geophysical Research, 109 : D06202 [DOI:10.1029/2003JD003511]
-
Brogniez C, Lenoble J.1991.Analysis of 5 year aerosol data from the stratospheric aerosol and gas experiment Ⅱ. Journal of Geophysical Research, 96 (D8) : 15479–15497 . [DOI:10.1029/91JD01280]
-
Burton S P, Thomason L W, Sasano Y, Hayashida S.1999.Comparison of aerosol extinction measurements by ILAS and SAGE Ⅱ. Geophysical Research Letters, 26 (12) : 1719–1722 . [DOI:10.1029/1999GL900359]
-
Chen H B, Lv D R, Xu L S.1994.Variation Characteristic of stratospheric aerosol before and after Mount Pinatubo eruption using SAGE Ⅱ data. Chinese Science Bulletin, 39 (22) : 2084–2087 .
-
( 陈洪滨, 吕达仁, 许丽生. 1994. 利用SAGE Ⅱ资料分析皮纳图博火山爆发前后平流层气溶胶的变化特征. 科学通报, 39 (22) : 2084–2087. )
-
Fernald F G.1984.Analysis of atmospheric lidar observations:some comments. Applied Optics, 23 (5) : 652–653 . [DOI:10.1364/AO.23.000652]
-
Fiocco G, Grams G.1966.Observations of the upper atmosphere by optical radar in Alaska and Sweden during the summer 1964. Tellus, 18 (1) : 34–38 . [DOI:10.1111/j.2153-3490.1966.tb01441.x]
-
Hitchman M H, McKay M, Trepte C R.1994.A climatology of stratospheric aerosol. Journal of Geophysical Research, 99 (D10) : 20689–20700 . [DOI:10.1029/94JD01525]
-
Junge C E, Chagnon C W, Manson J E.1961.Stratospheric aerosols. Journal of Meteorology, 18 (1) : 81–108 . [DOI:10.1175/1520-0469(1961)018<0081:SA>2.0.CO;2]
-
Li W L, Yu S M.2001.Aerosol distribution characteristics as well as its radiation forcing on climate change by model simulation over Tibetan Plateau. Science in China (Series D), 31 (S1) : 300–307 .
-
( 李维亮, 于胜民. 2001. 青藏高原地区气溶胶的时空分布特征及其辐射强迫和气候效应的数值模拟. 中国科学(D辑), 31 (S1) : 300–307. )
-
Liu Y, Guo C L, Li W L, Zhou X J.2007.Trends of stratospheric ozone and aerosols over Tibetan Plateau. Acta Meteorologica Sinica, 65 (6) : 938–945 .
-
( 刘煜, 郭彩丽, 李维亮, 周秀骥. 2007. 青藏高原平流层臭氧和气溶胶的变化趋势研究. 气象学报, 65 (6) : 938–945. )
-
Mauldin L E, Zaun N H, McCormick M P Jr, Guy J H, Vaughn W R.1985.Stratospheric aerosol and gas experiment Ⅱ instrument:a functional description. Optical Engineering, 24 (2) : 242307 [DOI:10.1117/12.7973473]
-
McCormick M P, Hamill P, Chu W P, Swissler T J, McMaster L R, Pepin T J.1979.Satellite studies of the stratospheric aerosols. Bulletin of American Meteorological Society, 60 (9) : 1038–1046 . [DOI:10.1175/1520-0477(1979)060<1038:SSOTSA>2.0.CO;2]
-
Osborn M T, Rosen J M, McCormick M P, Wang P H, Livingston J M, Swissler T J.1989.SAGE Ⅱ aerosol correlative observations:profile measurements. Journal of Geophysical Research, 94 (D6) : 8353–8366 . [DOI:10.1029/JD094iD06p08353]
-
Rosen J M.1971.The boiling point of stratospheric aerosols. Journal of Applied Meteorology, 10 (5) : 1044–1046 . [DOI:10.1175/1520-0450(1971)010<1044:TBPOSA>2.0.CO;2]
-
Sasano Y.1996.Tropospheric aerosol extinction coefficient profiles derived from scanning lidar measurements over Tsukuba, Japan, from 1990 to 1993. Applied Optics, 35 (24) : 4941–4952 . [DOI:10.1364/AO.35.004941]
-
Sasano Y, Browell E V.1989.Light scattering characteristics of various aerosol types derived from multiple wavelength lidar observations. Applied Optics, 28 (9) : 1670–1679 . [DOI:10.1364/AO.28.001670]
-
Takamura T, Sasano Y.1987.Ratio of aerosol backscatter to extinction coefficients as determined from angular scattering measurements for use in atmospheric lidar applications. Optical and Quantum Electronics, 19 (5) : 293–302 .
-
Tao Z M, Wu D C, Liu D, Hu S X, Nie M, Shi B.2011.Estimation of aerosol backscatter coefficient error in Lidar data processing. Chinese Journal of Lasers, 38 (12) : 1214001
-
( 陶宗明, 吴德成, 刘东, 胡顺星, 聂淼, 史博. 2011. 激光雷达反演气溶胶后向散射系数误差估算. 中国激光, 38 (12) : 1214001 )
-
Thomason L W, Poole L R, Randall C E.2007.SAGE Ⅲ aerosol extinction validation in the Arctic winter:comparisons with SAGE Ⅱ and POAM Ⅲ. Atmospheric Chemistry and Physics, 7 (5) : 1423–1433 . [DOI:10.5194/acp-7-1423-2007]
-
Wang K C, Li W L, Bai L J.2004.Characteristics of change and transport of aerosols in the middle and upper troposphere and stratosphere over Indian ocean and China in 1984-2000. Journal of Applied Meteorological Science, 15 (1) : 32–40 .
-
( 王开存, 李维亮, 白立杰. 2004. 1984-2000年印度洋与中国地区上空对流层中上层及平流层气溶胶变化和输送特征. 应用气象学报, 15 (1) : 32–40. )
-
Wu Y H, Hu H L, Zhou J, Hu S X, Zhang M.2001.Measurements of stratosphere aerosol with L625 Lidar. Acta Optica Sinica, 21 (8) : 1012–1015 .
-
( 吴永华, 胡欢陵, 周军, 胡顺星, 张民. 2001. L625激光雷达探测平流层气溶胶. 光学学报, 21 (8) : 1012–1015. )
-
Xia J R.2010.Observational study of the vertical distribution of atmospheric aerosol optical properties over Northern China. , : 1–80 .
-
-
Yue G K.1999.A new approach to retrieval of aerosol size distributions and integral properties from SAGE Ⅱ aerosol extinction spectra. Journal of Geophysical Research, 104 (D22) : 27491–27506 . [DOI:10.1029/1999JD900455]
-
Yue G K, Lu C H, Wang P H.2005.Comparing aerosol extinctions measured by Stratospheric Aerosol and Gas Experiment (SAGE) Ⅱ and Ⅲ satellite experiments in 2002 and 2003. J Geophys Res, 110 : D11202 [DOI:10.1029/2004JD005421]
-
Yue G K, Poole L R, Wang P H, Chiou E W.1994.Stratospheric aerosol acidity, density, and refractive index deduced from SAGE Ⅱ and NMC temperature data. Journal of Geophysical Research, 99 (D2) : 3727–3738 . [DOI:10.1029/93JD02989]