 2020,
Vol. 29
2020,
Vol. 29


2. 青岛海洋科学与技术国家实验室海洋渔业科学与食物产出过程功能实验室, 山东 青岛 266071;
3. 大洋渔业资源可持续开发教育部重点实验室, 上海 201306;
4. 国家远洋渔业工程技术研究中心, 上海 201306;
5. 农业农村部大洋渔业开发重点实验室, 上海 201306
柔鱼(Ommastrephes bartramii)是西北太平洋重要的渔业资源, 具有较高的生态位与经济价值[1-2]。柔鱼生命周期短, 寿命大约为1年[3], 其种群广泛分布在北太平洋20°N到50°N之间[4], 每年在副热带的产卵场和靠近亚北极边界的索饵场之间进行季节性的往返洄游[5]。根据胴长组成、仔幼体分布以及寄生虫感染等特征, 北太平洋柔鱼种群可以具体划分为秋生群中部群体、秋生群东部群体、冬春生群西部群体和冬春生群中东部群体[3]。
西北太平洋黑潮和亲潮过渡区生物物理环境复杂, 为不同海洋经济生物包括柔鱼提供了生产力丰富的栖息地[6]。柔鱼作为一种短生命周期的大洋暖水性物种[7], 大尺度的海洋-气候现象如厄尔尼诺/拉尼娜现象以及局部海域环境变量如水温[8-10]、盐度[10-11]、海表面高度(sea surface height, SSH)[12-15]、浮游生物密度[16]和叶绿素a(chlorophyll-a, Chl.a)浓度[6, 17-18]等都会对其资源丰度和渔场分布产生显著影响。在众多海洋环境变量中, 水温对柔鱼的分布和丰度影响最为显著, 成为生产上寻找柔鱼渔场最为合适的指示因子。本研究将异常气候事件(厄尔尼诺/拉尼娜现象)、海表面温度(sea surface temperature, SST)与柔鱼渔场重心3者联系起来, 分析异常气候事件对柔鱼渔场SST的影响, 探讨柔鱼渔场分布对异常气候事件的响应机制, 为我国远洋鱿钓渔业的生产和科学管理提供依据。
1 材料与方法 1.1 研究海域西北太平洋150°E~165°E海域是我国鱿钓船重要的作业渔场[7], 而8—10月是西北太平洋柔鱼的渔汛期[9]。本研究的海域范围为39°N~45°N、150°E~165°E。
1.2 材料来源 1.2.1 渔业生产统计数据统计数据采用2004—2015年8—10月我国西北太平洋柔鱼鱿钓渔业生产数据, 由上海海洋大学鱿钓科学技术组提供。数据包括作业年份、作业月份、作业经度(°)、作业纬度(°)、捕捞努力量(d)和产量(t), 时间分辨率为月, 空间分别率为0.5°×0.5°。
1.2.2 水温数据海表面温度(SST)和海表面温度距平值(sea surface temperature anomaly, SSTA)下载自夏威夷大学网站(http://apdrc.soest.hawaii.edu/data/data.php), 时间分辨率为月, 空间分辨率为0.5°×0.5°。
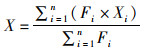
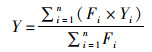
1.3 研究方法 1.3.1 渔场重心确定渔场重心位置利用作业次数进行计算[9], 计算公式为
 (1)
(1)
 (2)
(2)
式中:X、Y分别为渔场重心的经纬度; Xi为第i个渔区中心点的经度; Yi为第i个渔区中心点的纬度; n为渔区的总个数; Fi为第i个渔区的捕捞努力量, d。
1.3.2 捕捞努力量空间分布及其与SST为了研究西北太平洋柔鱼鱼群在8—10月集中分布的海域、时空变化情况以及渔场适宜的温度范围, 将经度和纬度按0.5°划分区间, 分别统计捕捞努力量在每一个经度(纬度)区间上的频数; 将SST以1 ℃划分区间, 统计捕捞努力量在每个SST区间上的频数。
1.3.3 聚类分析利用SPSS 19.0软件对各年度8—10月的渔场重心进行系统聚类分析, 采用“组间联接”的聚类方法, 计算不同年度之间的平方欧氏距离, 将每个月份的渔场重心分为3类, 绘制出聚类树状图, 以分析同一月份、不同年份之间的渔场重心位置的差异及变化。从每一类中选择一个代表年份(3个月的代表年份统一), 对比渔场海表面温度以及渔场重心时空分布差异。
1.3.4 异常气候事件判断海洋尼诺指数(oceanic niño index, ONI)是厄尔尼诺-南方涛动(el niño-southern oscillation, ENSO)的一个重要衡量指标, 利用海洋尼诺指数可以判断厄尔尼诺/拉尼娜现象的发生情况。本文海洋尼诺指数的数据和定义来自美国NOAA气候预报中心(https://origin.cpc.ncep.noaa.gov/products/analysis_monitoring/ensostuff/ONI_v5.php)。NOAA气候预报中心对厄尔尼诺/拉尼娜现象的定义如下:若ONI至少连续5个月大于+0.5 ℃, 则发生1次厄尔尼诺现象; 若ONI至少连续5个月小于-0.5 ℃, 则发生1次拉尼娜现象; 其余为正常气候条件。
1.3.5 交相关分析对本文研究海域内的SSTA和尼诺3.4区的ONI进行交相关分析, 判断异常气候事件(厄尔尼诺/拉尼娜现象)的发生是否对西北太平洋柔鱼渔场内的SST产生影响。
1.3.6 渔场重心和SST与异常气候事件关系计算3个代表年份8—10月SST的平均值, 统计不同月份各年度SST的频率分布情况, 并绘制3个代表年份8—10月西北太平洋海域SSTA的空间分布图, 以比较研究厄尔尼诺和拉尼娜现象发生时柔鱼渔场内SST的变化。此外, 进一步分析3个代表年份8—10月渔场重心的时空变化, 以评估异常气候事件对渔场重心分布的影响。
2 结果 2.1 8—10月渔场重心的时空变化由图 1可知, 8月渔场重心主要分布在152.0°E~156.1°E和40.8°N~42.7°N, 9月主要分布在154.0°E~156.4°E和42.3°N~43.8°N, 10月主要分布在153.9°E~156.1°E和42.1°N~43.1°N, 但是各年份间分布差异显著。根据表 1和图 2可知, 渔场重心和捕捞努力量均具有显著的季节性变化, 即在8—9月向东北方向移动, 9—10月向西南方向移动。由此可见, 捕捞努力量的分布情况与渔场重心的分布情况基本一致, 即捕捞努力量集中分布的区域就是渔场重心所在地。

|
图 1 2004—2015年8—10月渔场重心的时空变化 Fig. 1 Spatio-temporal variations of the gravity centers of fishing ground from every year of August to October during 2004 to 2015 |

|
表 1 8—10月渔场重心和捕捞努力量的分布情况 Tab.1 Distribution of the fishing ground's gravity centers and fishing effort from August to October |

|
图 2 8—10月捕捞努力量在经度、纬度上的分布 Fig. 2 Distribution of fishing effort in longitude or latitude from August to October |
由图 3可知:8月作业次数主要集中在SST为18~22 ℃的范围内; 9月作业次数的分布相对较为均匀, 主要集中在SST为15~19 ℃海域内; 10月作业次数主要分布在SST为13~17 ℃海域内。

|
图 3 8—10月捕捞努力量分布与SST的关系 Fig. 3 Relation between the distribution of fishing effort and SST from August to October |
由聚类分析树状图(图 4)可看出:8月渔场重心分为(2008、2009、2014、2004、2007年)、(2011、2012、2010年)和(2005、2013、2006、2015年)3类; 9月渔场重心分为(2011、2012、2005、2007、2008年)、(2010、2009、2014、2004、2013年)和(2006、2015年)3类; 10月渔场重心分为(2006、2007、2005、2014、2008年)、(2010、2012、2004、2009、2011年)和(2013、2015年)3类。其中2008、2010和2015年分别是每一类中相同的年份, 选取这3个年份作为每一类的代表年份进行后续研究。

|
图 4 2004—2015年8—10月渔场重心的聚类结果 Fig. 4 Clustering of gravity centers of fishing ground from every year of August to October during 2004 to 2015 |
经ENSO定义可推断:2010年的8—10月发生拉尼娜事件; 2015年8—10月发生厄尔尼诺事件; 2008年8—10月为正常气候, 见表 2。

|
表 2 3个代表年份连续5个月的ONI值 Tab.2 ONI for 5 consecutive months ofthree representative years |
由图 5可以看出, 研究海域内SSTA与ONI呈显著的负相关关系(P < 0.05), 在滞后8个月时SSTA与ONI的负相关性最大, 对应的相关系数为-0.273。以上结果说明异常气候事件的发生会引起研究海域内SST的变化。

|
图中的虚线和实线分别是95%置信区间的上限和下限 The dotted and solid lines in the graph stand for the upper and lower limits of 95% confidence intervals, respectively 图 5 ONI与研究海域内SSTA的交相关系数 Fig. 5 Cross correlation coefficients between ONI and SSTA of the research area |
从总体上看, SST的均值2008年最高, 2010年略低于2008年, 2015年SST的均值显著降低, 见图 6。

|
图 6 3个代表年份8—10月SST的均值 Fig. 6 Means of SST in three representative years from August to October |
由图 7可看出, 不同年份之间SST的频率分布具有显著差异。2008年8月SST主要分布在15~22 ℃; 2010年8月SST主要分布在14~22 ℃; 2015年8月SST主要分布在13~22 ℃。2008年、2010年以及2015年9月对应的SST主要分布在16~23 ℃, 14~22 ℃和12~21 ℃。10月, 2008年的SST主要分布在12~20 ℃; 2010年的SST主要分布在10~20 ℃; 2015年的SST主要分布在10~19 ℃。从总体上看, 2008年SST最高, 其次是2010年, 2015年最低。

|
图 7 3个代表年份8—10月SST频率分布图 Fig. 7 SST Frequency distribution map of three representative years from August to October |
由图 9可以看出:2008年8—10月的渔场重心分布在154.5°E~155.4°E、42.6°N~43.6°N, 平均渔场重心为154.9°E、43.1°N; 2010年8—10月的渔场重心分布在155.4°E~156.1°E、42.6°N~43.5°N, 平均渔场重心为155.8°E、42.9°N; 2015年8—10月的渔场重心分布在152.4°E~156.0°E、40.8°N~42.6°N, 平均渔场重心为154.3°E、41.9°N。整体上看, 2015年的渔场重心相对于其他年份来说处于研究海域的西南位置, 2008和2010年的渔场重心相对来说位于研究海域的东北位置, 2010年的渔场重心比2008年略微偏东南。

|
图 9 3个代表年份渔场重心的变化 Fig. 9 Change of the gravity centers of fishing ground in three representative years |
从图 8可以看出, 3个代表年份研究海域内的SST范围具有较大差异。2008年的高温范围最大, 其次是2010年, 2015年研究海域内的SST普遍很低。

|
图 8 SSTA的空间分布图 Fig. 8 Spatial distribution map of SSTA |
西北太平洋柔鱼渔场重心的年际和季节性变化显著。渔场重心的季节性移动规律是:8—9月向东北方向移动, 9—10月向西南方向移动。柔鱼的洄游规律是8—9月在亚北极区附近索饵, 9月以后向南部产卵场洄游[4]。这表明柔鱼渔场重心的移动与柔鱼的洄游路线一致。
渔场重心在相同月份、不同年份的分布位置相差很大, 总体来说没有统一的规律可循, 这可能是因为不同年份之间的大尺度海洋-气候现象存在差异或者区域海洋环境条件发生变化, 导致渔场重心的分布存在较大的年间差异。
3.2 柔鱼渔场的适宜SST范围作业次数在SST上的分布反映了柔鱼渔场的适宜SST范围。8月柔鱼的适宜SST范围是18~22 ℃、9月柔鱼的适宜SST范围是15~19 ℃、10月柔鱼的适宜SST范围是13~17 ℃, 这表明柔鱼渔场的适宜SST范围存在明显的季节性变化, 随着月份的推移, 柔鱼渔场的适宜SST范围逐渐变小。该结果与前人[19-21]总结的柔鱼主要渔场内的适宜SST基本一致(表 3), 有所出入的原因可能与调查研究时间不同有关, 前人研究的时间分别为2004年[19]、2006年[20]和2010年[21]; 而本文的研究时间为2004—2015年, 可能由于在这12年间发生了异常气候现象, 比如2015年是非常典型的强厄尔尼诺年, 故本文总结出的柔鱼渔场适宜SST范围与前人有所不同。

|
表 3 8—10月柔鱼渔场的适宜SST范围与前人总结情况的对比 Tab.3 Comparisons between the appropriate range of SST of fishing ground for Ommastrephes bartramii 0 and the summary of predecessors from August to October |
SSTA与ONI的交相关分析表明, 异常气候事件的发生会调控柔鱼渔场内的SST(图 5)。2008年对应正常气候条件时柔鱼渔场的SST最高; 2010年虽然发生拉尼娜现象, 但SST并非最低, 反而是在2015年厄尔尼诺现象时SST最低。这说明厄尔尼诺事件会使柔鱼渔场的SST降低, 拉尼娜事件会使柔鱼渔场的SST升高。该结果与余为[21]对厄尔尼诺年份、拉尼娜年份以及正常年份柔鱼渔场内SST的分析一致。
2010年(拉尼娜年份)和2008年(正常年份)渔场重心位于研究海域的东北位置, 2010年比2008年还要偏东北一些; 而2015年(厄尔尼诺年份)的渔场重心相对来说则处于研究海域的西南位置。这说明异常气候事件的发生会使柔鱼渔场重心沿着渔场的西南-东北方向移动[22], 拉尼娜现象使渔场重心向东北方向偏移, 厄尔尼诺现象使渔场重心向西南方向偏移。
在异常气候影响下渔场重心经线方向上的移动规律符合前人对异常气候现象发生及SST高低变化时柔鱼渔场移动规律的总结[23-25]。已有学者[23-24]指出, 拉尼娜现象会增加柔鱼渔场中适宜栖息地的面积, 渔场向北移动; 而厄尔尼诺现象会使有利的栖息地减少, 渔场向南偏移。陈新军等[25]研究发现, 作业渔场的SST较高时渔场偏北, 反之渔场偏南。YU等[26]认为, 渔场重心在异常气候影响下发生南北移动的原因如下:厄尔尼诺通过扩大柔鱼渔场的冷水范围, 导致适宜柔鱼生存的温度范围向南偏移, 由于柔鱼总是趋向于对它们有利的环境条件, 故柔鱼将转移到南部海域; 拉尼娜条件下的情况则完全相反。在异常气候事件影响下, 柔鱼渔场重心纬线方向上发生变动的原因有待进一步探讨。
结合上述分析得出: ENSO现象通过调控西北太平洋柔鱼渔场的SST来驱动柔鱼渔场重心偏移:拉尼娜现象(ENSO冷事件)时, 研究海域内的SST偏高, 渔场重心偏东北位置; 厄尔尼诺现象(ENSO暖事件)时, 研究海域内的SST偏低, 渔场重心偏西南位置。
3.4 不足与展望2004—2015年这12年间, 利用聚类分析选取了2008年、2010年和2015年这3个年份作为正常气候条件、拉尼娜现象和厄尔尼诺现象的代表年份进行研究。在这12年中, 这3个年份可以代表其他的正常年份、厄尔尼诺年份和拉尼娜年份柔鱼渔场重心的变化规律。但是对于它们能否代表迄今为止乃至以后所有的正常年份、厄尔尼诺年份和拉尼娜年份柔鱼渔场重心的变化规律, 有待今后进一步研究。
| [1] |
陈新军. 世界头足类资源开发现状及我国远洋鱿钓渔业发展对策[J]. 上海海洋大学学报, 2019, 28(3): 321-330. CHEN X J. Development status of world cephalopod fisheries and suggestions for squid jigging fishery in China[J]. Journal of Shanghai Ocean University, 2019, 28(3): 321-330. |
| [2] |
方舟, 陈新军, 瞿俊跃, 等. 北太平洋柔鱼角质颚形态及生长年间差异[J]. 上海海洋大学学报, 2020, 29(1): 109-120. FANG Z, CHEN X J, QU J Y, et al. Annual variation of beak morphology and growth models for neon flying squid (Ommastrephes bartramii) in north Pacific Ocean[J]. Journal of Shanghai Ocean University, 2020, 29(1): 109-120. |
| [3] |
陈新军, 钱卫国, 刘必林, 等. 主要经济大洋性鱿鱼资源渔场生产性调查与渔业概况[J]. 上海海洋大学学报, 2019, 28(3): 344-356. CHEN X J, QIAN W G, LIU B L, et al. Productive survey and fishery for major pelagic economic squid in the world[J]. Journal of Shanghai Ocean University, 2019, 28(3): 344-356. |
| [4] |
BOWER J R, ICHⅡ T. The red flying squid (Ommastrephes bartramii):a review of recent research and the fishery in Japan[J]. Fisheries Research, 2005, 76(1): 39-55. |
| [5] |
魏广恩, 陈新军, 李纲. 西北太平洋柔鱼洄游重心年际变化及预测[J]. 上海海洋大学学报, 2018, 27(4): 573-583. WEI G E, CHEN X J, LI G. Interannual variation and forecasting of Ommastrephes bartramii migration gravity in the northwest Pacific Ocean[J]. Journal of Shanghai Ocean University, 2018, 27(4): 573-583. |
| [6] |
YU W, CHEN X J, YI Q, et al. Spatio-temporal distributions and habitat hotspots of the winter-spring cohort of neon flying squid Ommastrephes bartramii in relation to oceanographic conditions in the northwest Pacific Ocean[J]. Fisheries Research, 2016, 175: 103-115. DOI:10.1016/j.fishres.2015.11.026 |
| [7] |
陈新军, 田思泉. 西北太平洋海域柔鱼的产量分布及作业渔场与表温的关系研究[J]. 中国海洋大学学报, 2005, 35(1): 101-107. CHEN X J, TIAN S Q. Study on the catch distribution and relationship between fishing ground and surface temperature for Ommastrephes bartramii in the northwestern Pacific Ocean[J]. Periodical of Ocean University of China, 2005, 35(1): 101-107. |
| [8] |
CHEN C S, CHIU T S. Abundance and spatial variation of Ommastrephes bartramii (Mollusca:Cephalopoda) in the eastern North Pacific observed from an exploratory survey[J]. Acta Zoologica Taiwanica, 1999, 10(2): 135-144. |
| [9] |
陈新军. 西北太平洋柔鱼渔场与水温因子的关系[J]. 上海水产大学学报, 1995, 4(3): 181-185. CHEN X J. An approach to the relationship between the squid fishing ground and water temperature in the northwestern Pacific[J]. Journal of Shanghai Fisheries University, 1995, 4(3): 181-185. |
| [10] |
唐峰华, 杨胜龙, 范秀梅, 等. 基于Argo的西北太平洋公海柔鱼渔场垂直水温结构的变化特征[J]. 上海海洋大学学报, 2019, 28(3): 427-437. TANG F H, YANG S L, FAN X M, et al. Variation characteristics of vertical water temperature structure of neon flying squid fishery in northwestern Pacific Ocean based on Argo[J]. Journal of Shanghai Ocean University, 2019, 28(3): 427-437. |
| [11] |
刘洪生, 杨红, 章守宇. 北太平洋西经海域(175°W-170°W)温盐分布及其与柔鱼渔场关系的初步研究[J]. 上海水产大学学报, 2001, 10(3): 229-233. LIU H S, YANG H, ZHANG S Y. Preliminary study on seawater salinity and temperature distributions and their relationship with the squid fishing grounds in 175°W-170°W area of north Pacific[J]. Journal of Shanghai Fisheries University, 2001, 10(3): 229-233. |
| [12] |
ICHⅡ T, MAHAPATRA K, SAKAI M, et al. Changes in abundance of the neon flying squid Ommastrephes bartramii in relation to climate change in the central north Pacific Ocean[J]. Marine Ecology Progress Series, 2011, 441: 151-164. DOI:10.3354/meps09365 |
| [13] |
宋婷婷.基于海面高度数据研究西北太平洋巴特柔鱼(Ommastrephes bartramii)渔场分布[D].上海: 上海海洋大学, 2014. SONG T T. Relationship between fishing grounds of Ommastrephes bartramii and satellite altimeter data in Northwestern Pacific[D]. Shanghai: Shanghai Ocean University, 2014. |
| [14] |
TIAN S Q, CHEN X J, CHEN Y, et al. Evaluating habitat suitability indices derived from CPUE and fishing effort data for Ommatrephes bratramii in the northwestern Pacific Ocean[J]. Fisheries Research, 2009, 95(2/3): 181-188. |
| [15] |
魏广恩, 陈新军. 北太平洋柔鱼(Ommastrephes bartramii)资源渔场研究进展[J]. 广东海洋大学学报, 2016, 36(6): 114-122. WEI G E, CHEN X J. Review on neon flying squid (Ommastrephes bartramii) resources and fishing ground in the north Pacific Ocean[J]. Journal of Guangdong Ocean University, 2016, 36(6): 114-122. |
| [16] |
徐兆礼, 崔雪森, 黄洪亮. 北太平洋柔鱼渔场浮游动物数量分布及与渔场的关系[J]. 水产学报, 2004, 28(5): 515-521. XU Z L, CUI X S, HUANG H L. Distribution of zooplankton in Ommastrephes bartramii fishing ground of the north Pacific Ocean and its relationship with the fishing ground[J]. Journal of Fisheries of China, 2004, 28(5): 515-521. |
| [17] |
王文宇, 邵全琴, 薛允传, 等. 西北太平洋柔鱼资源与海洋环境的GIS空间分析[J]. 地球信息科学, 2003, 5(1): 39-44. WANG W Y, SHAO Q Q, XUE Y C, et al. On the relationship between the resources of Ommastrephes bartrami and marine environment in the northwest Pacific Ocean based on GIS[J]. Geo-Information Science, 2003, 5(1): 39-44. |
| [18] |
沈新强, 王云龙, 袁骐, 等. 北太平洋鱿鱼渔场叶绿素a分布特点及其与渔场的关系[J]. 海洋学报(中文版), 2004, 26(6): 118-123. SHEN X Q, WANG Y L, YUAN Q, et al. Distributional characteristics of chlorophyll-a and relation to the fishing ground in the squid fishing ground of the northern Pacific Ocean[J]. Acta Oceanologica Sinica, 2004, 26(6): 118-123. |
| [19] |
陈新军, 刘必林. 2004年北太平洋柔鱼钓产量分析及作业渔场与表温的关系[J]. 湛江海洋大学学报, 2005, 25(6): 41-45. CHEN X J, LIU B L. Analysis on Catch of Ommastrephes bartramii in squid jigging fishery and the relationship between fishing ground and SST in the north Pacific Ocean in 2004[J]. Journal of Zhanjiang Ocean University, 2005, 25(6): 41-45. |
| [20] |
陈新军, 曹杰, 田思泉, 等. 表温和黑潮年间变化对西北太平洋柔鱼渔场分布的影响[J]. 大连水产学院学报, 2010, 25(2): 119-126. CHEN X J, CAO J, TIAN S Q, et al. Effect of inter-annual change in sea surface water temperature and Kuroshio on fishing ground of squid Ommastrephes bartramii in the northwest Pacific[J]. Journal of Dalian Fisheries University, 2010, 25(2): 119-126. |
| [21] |
余为.西北太平洋柔鱼冬春生群对气候与环境变化的响应机制研究[D].上海: 上海海洋大学, 2016. YU W. Response mechanism of winter-spring cohort of neon flying squid to the climatic and environmental variability in the northwest Pacific Ocean[D]. Shanghai: Shanghai Ocean University, 2016. |
| [22] |
沈新强, 樊伟, 崔雪森. 西北太平洋柔鱼渔场分布与水温关系的研究[J]. 海洋水产研究, 2004, 25(3): 10-14. SHEN X Q, FAN W, CUI X S. Study on the relationship of fishing ground distribution of Ommastrephes bartramii and water temperature in the northwest Pacific Ocean[J]. Marine Fisheries Research, 2004, 25(3): 10-14. |
| [23] |
CHEN X J, ZHAO X H, CHEN Y. Influence of El Niño/La Niña on the western winter-spring cohort of neon flying squid (Ommastrephes bartramii) in the northwestern Pacific Ocean[J]. ICES Journal of Marine Science, 2007, 64(6): 1152-1160. DOI:10.1093/icesjms/fsm103 |
| [24] |
YU W, CHEN X J, YI Q, et al. A review of interaction between neon flying squid (Ommastrephes bartramii) and oceanographicvariability in the north Pacific Ocean[J]. Journal of Ocean University of China, 2015, 14(4): 739-748. DOI:10.1007/s11802-015-2562-8 |
| [25] |
陈新军, 田思泉. 西北太平洋海域柔鱼渔场分析探讨[J]. 渔业现代化, 2001(3): 3-6. CHEN X J, TIAN S Q. Analysis and discussion on fishing ground of Ommastrephes bartramii in northwestern Pacific[J]. Fishery Modernization, 2001(3): 3-6. |
| [26] |
YU W, CHEN X J, ZHANG Y, et al. Habitat suitability modelling revealing environmental-driven abundance variability and geographical distribution shift of winter-spring cohort of neon flying squid Ommastrephes bartramii in the northwest Pacific Ocean[J]. ICES Journal of Marine Science, 2019, 76(6): 1722-1735. DOI:10.1093/icesjms/fsz051 |
2. Laboratory for Marine Fisheries Science and Food Production Processes, Qingdao National Laboratory for Marine Science and Technology, Shandong, Qingdao 266071, Shandong, China;
3. Key Laboratory of Sustainable Exploitation of Oceanic Fisheries Resources, Ministry of Education, Shanghai Ocean University, Shanghai 201306, China;
4. National Engineering Research Center for Oceanic Fisheries, Shanghai Ocean University, Shanghai 201306, China;
5. Key Laboratory of Oceanic Fisheries Exploration, Ministry of Agriculture and Rural Affairs, Shanghai Ocean University, Shanghai 201306, China