2. 宁波大学 地理与空间信息技术系, 浙江 宁波 315211
东海是我国东部长江口外的大片海域,南接台湾海峡,北临黄海(以长江口北侧与韩国济州岛的连线为界),东临太平洋,以琉球群岛为界。大陆流入东海长度超过百公里的河流有40多条,其中长江、钱塘江、瓯江、闽江等四大水系是注入东海的主要江河[1-2]。随着东海沿岸地区社会经济的高速发展,每年通过长江冲淡水等江河输入的营养盐浓度不断增加,因而,东海成为营养盐污染较为严重的水域[3-8]。
东海作为世界上高生产力的海区[9],国内针对其营养盐领域已有大量的研究。王芳等[10]研究了东海外海海域营养盐分布特征及季节变化的三维时空过程,曹维等[11]根据1989年至2010年丰水期东海区3条断面表层营养盐调查结果,分析了近20年来东海典型断面丰水期无机氮、活性磷酸盐及硅酸盐的长期变化。米铁柱等[12]利用2011年4月和8月的调查资料,分析讨论了春、夏季黄海、东海营养盐分布特征及影响因素。叶然等[13]根据2013年东海海域(120°-128°E、25°-33°N)春、夏、秋、冬4个航次的调查资料,分析了营养盐结构的时空分布并探讨其对浮游植物生长限制的情况。由于东海营养盐的污染情况在逐年发生变化,及时了解营养盐的分布特征和影响因素对于合理开发利用东海海洋资源具有重要意义。本文根据2015年春季(5月)、夏季(8月)、秋季(11月)和冬季(2月)对东海4个航次30个站位的调查资料,对该海域的营养盐分布特征及影响因素等进行探讨分析,旨在以最新的调查数据较系统地探究东海区营养盐的分布特征和变化规律,为相关工作者的研究和海洋资源开发与利用提供营养盐基础数据和丰富已有的关于东海海域营养盐分布的认识。
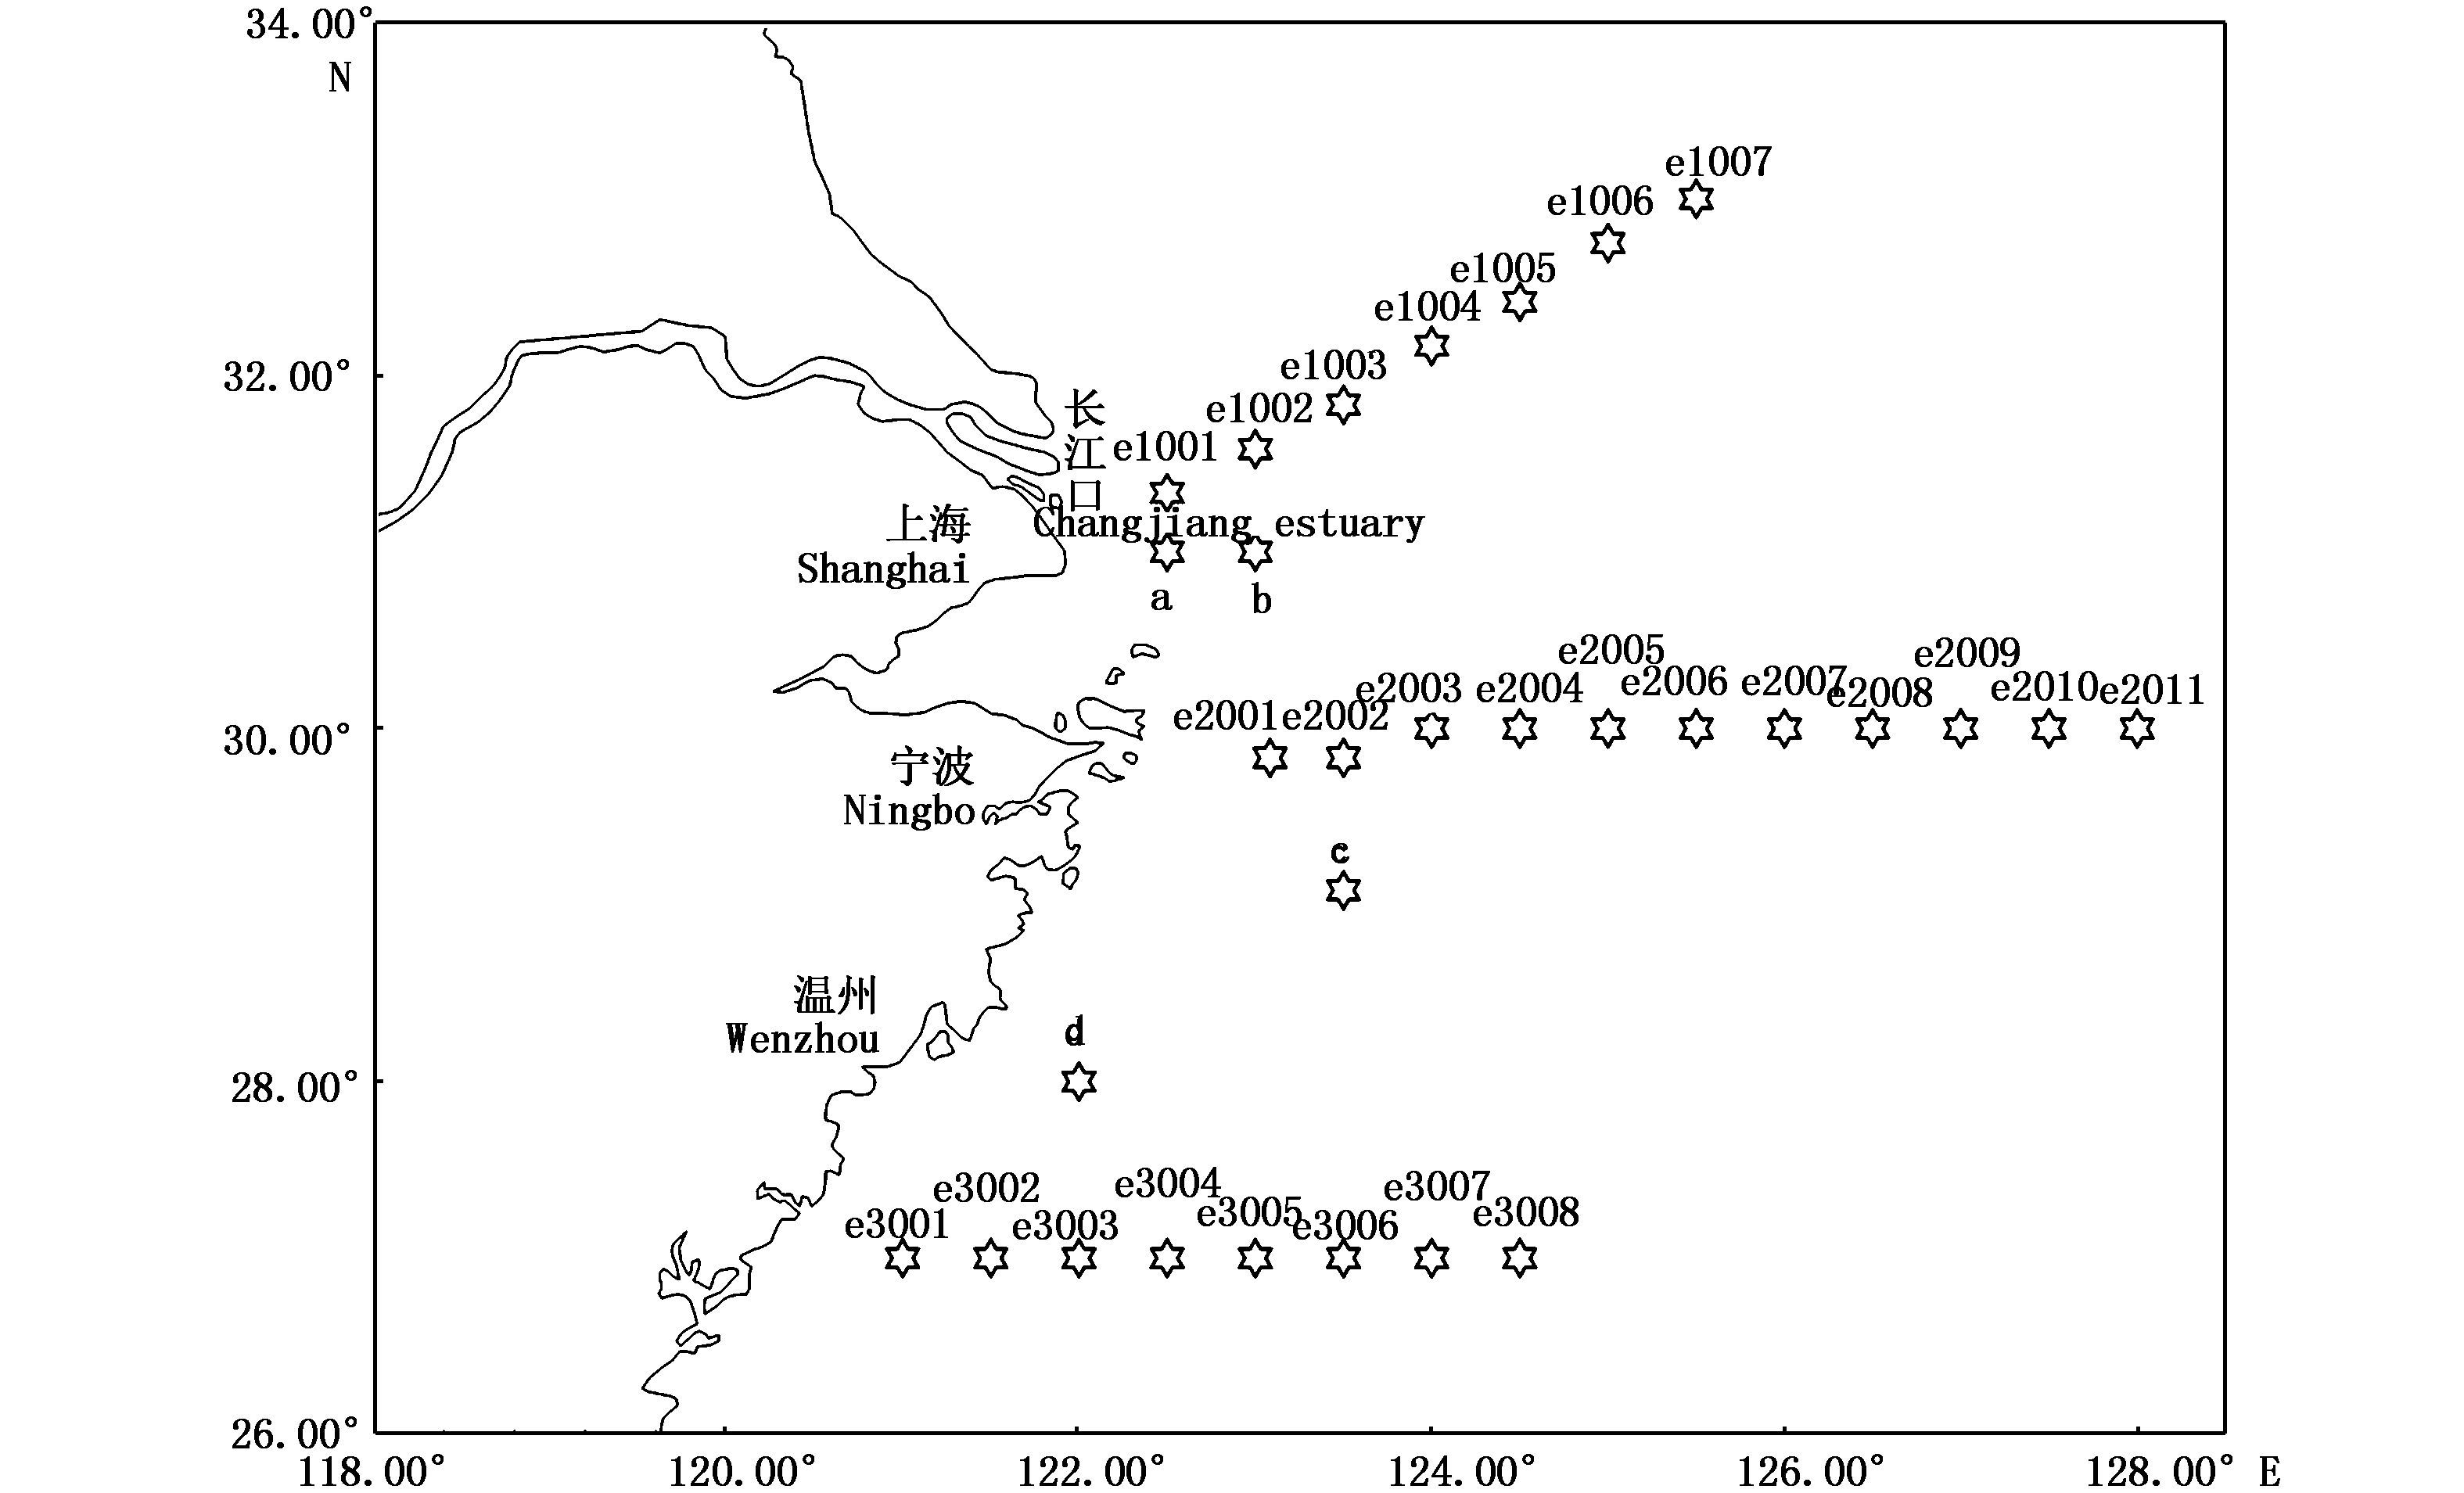
1 站位的设置与采样分析方法 1.1 站位分布本文依托国家海洋局宁波海洋环境监测中心站2015年春季(5月)、夏季(8月)、秋季(11月)、冬季(2月)四个航次的东海标准断面进行调查。调查站位共布置了3条断面和4个辅助站位,共30个调查站位。具体分布如图 1所示。
|
图 1 调查站位分布图
Fig. 1 Sampling sites in the East China Sea
|
水样的采集使用Seabird(美国)的CTD自容式采样器,根据现场的水深和具体情况,采集各层次海水样品。水样用0.45 μm醋酸纤维滤膜(预先将滤膜放入比例为1:1 000盐酸溶液中浸泡24 h,取出后用大量去离子水将其冲洗至pH达到中性)进行过滤后,现场进行分析测定。营养盐的测定方法严格按照《海洋调查规范(GB17378.4—2007) 第4部分:海水化学要素调查》[14]中的分析方法,其中磷酸盐(PO4-P)、亚硝酸盐(NO2-N)、硝酸盐(NO3-N)、铵盐(NH4-N)、硅酸盐(SiO3-Si)的分析方法和测定的检出限见表 1。溶解态无机氮为硝酸盐、亚硝酸盐及氨氮含量总和,计算公式为: DIN =NO3-N+NO2-N+NH4-N。

|
表 1 海水样品中各要素的分析方法 Tab.1 Sample analysis method of the elements in seawater |
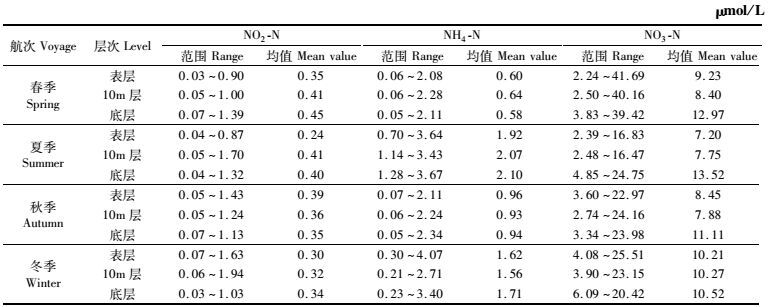
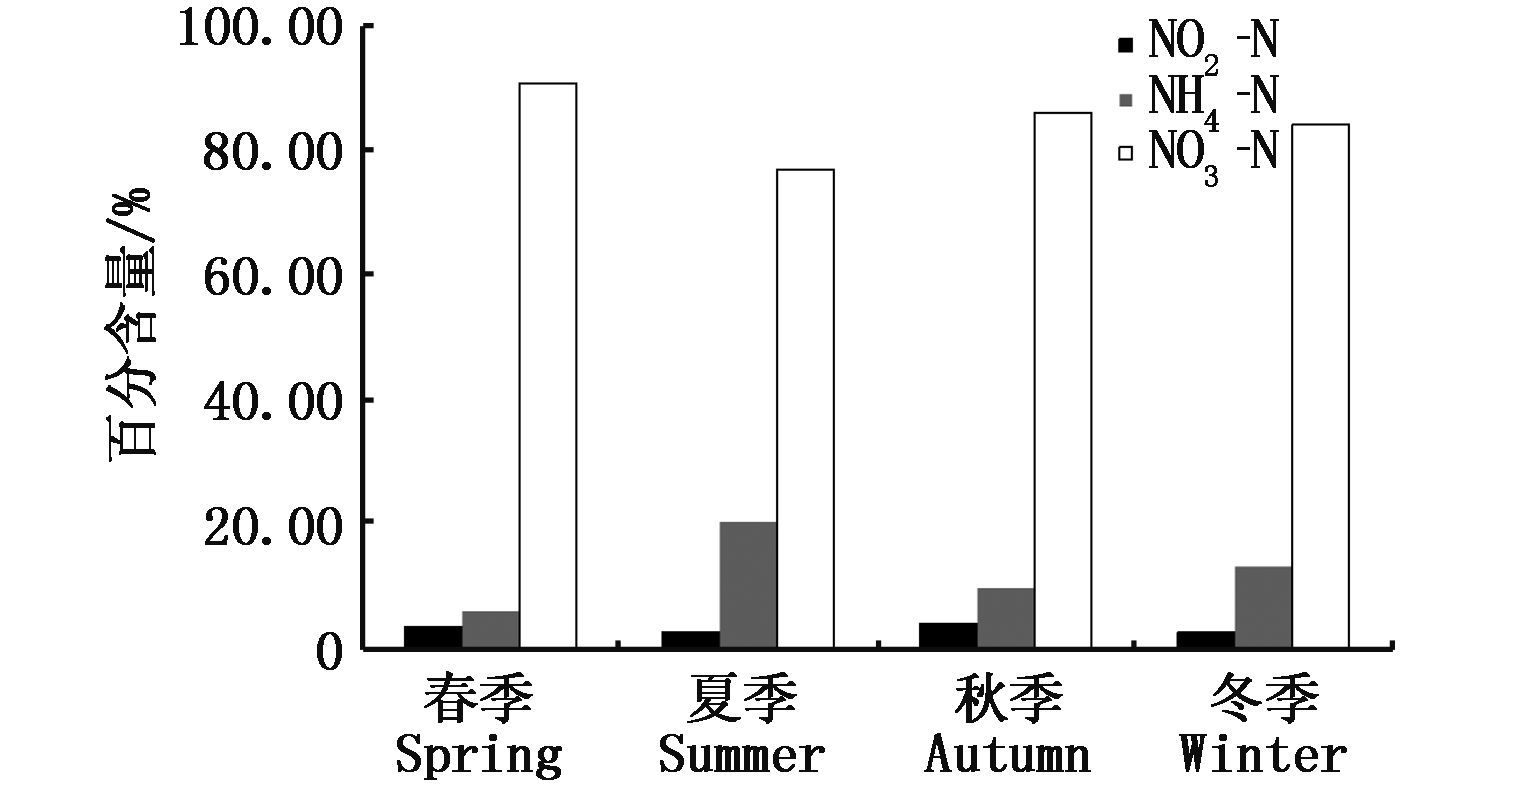
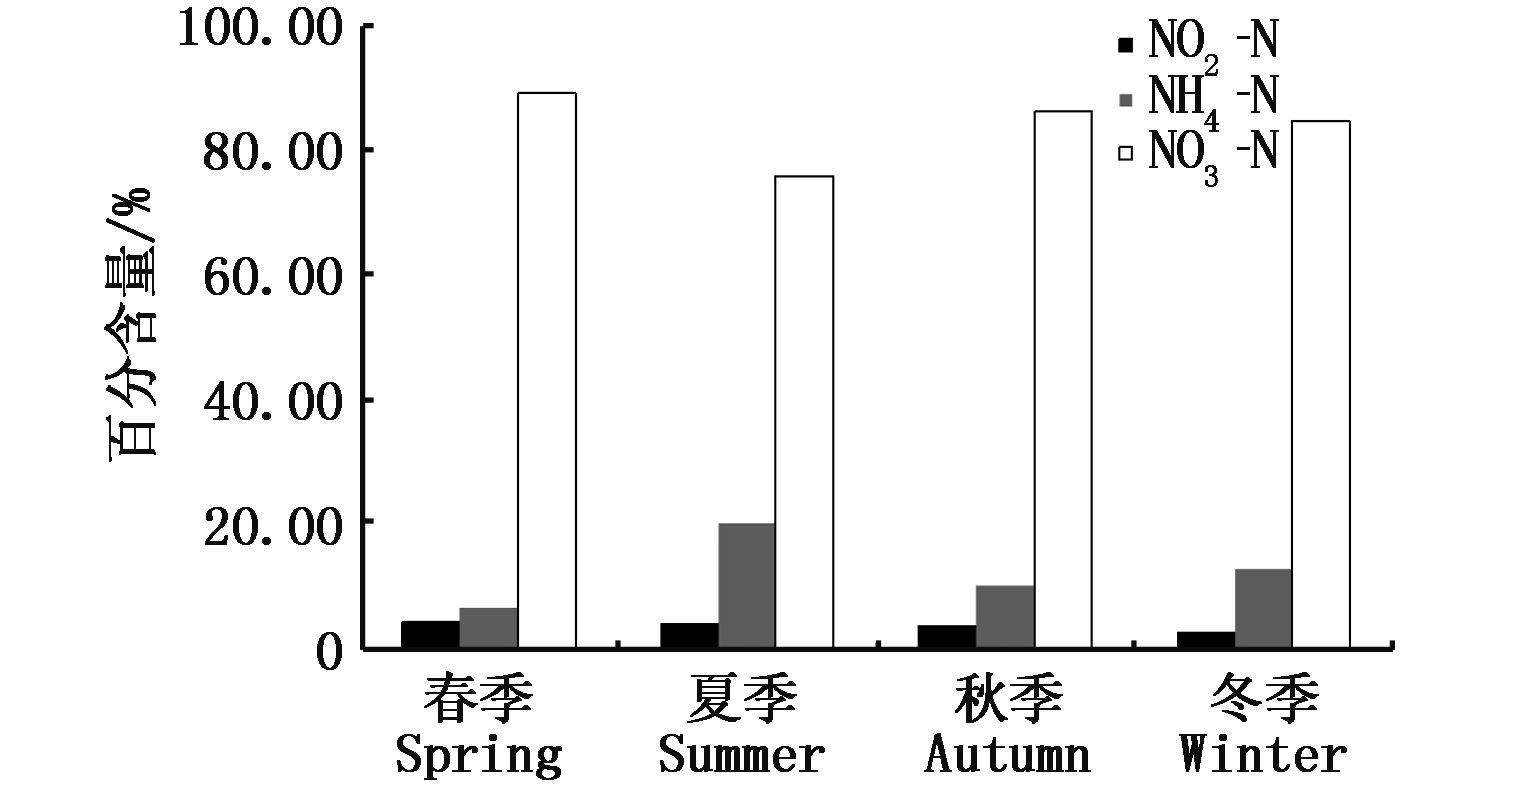
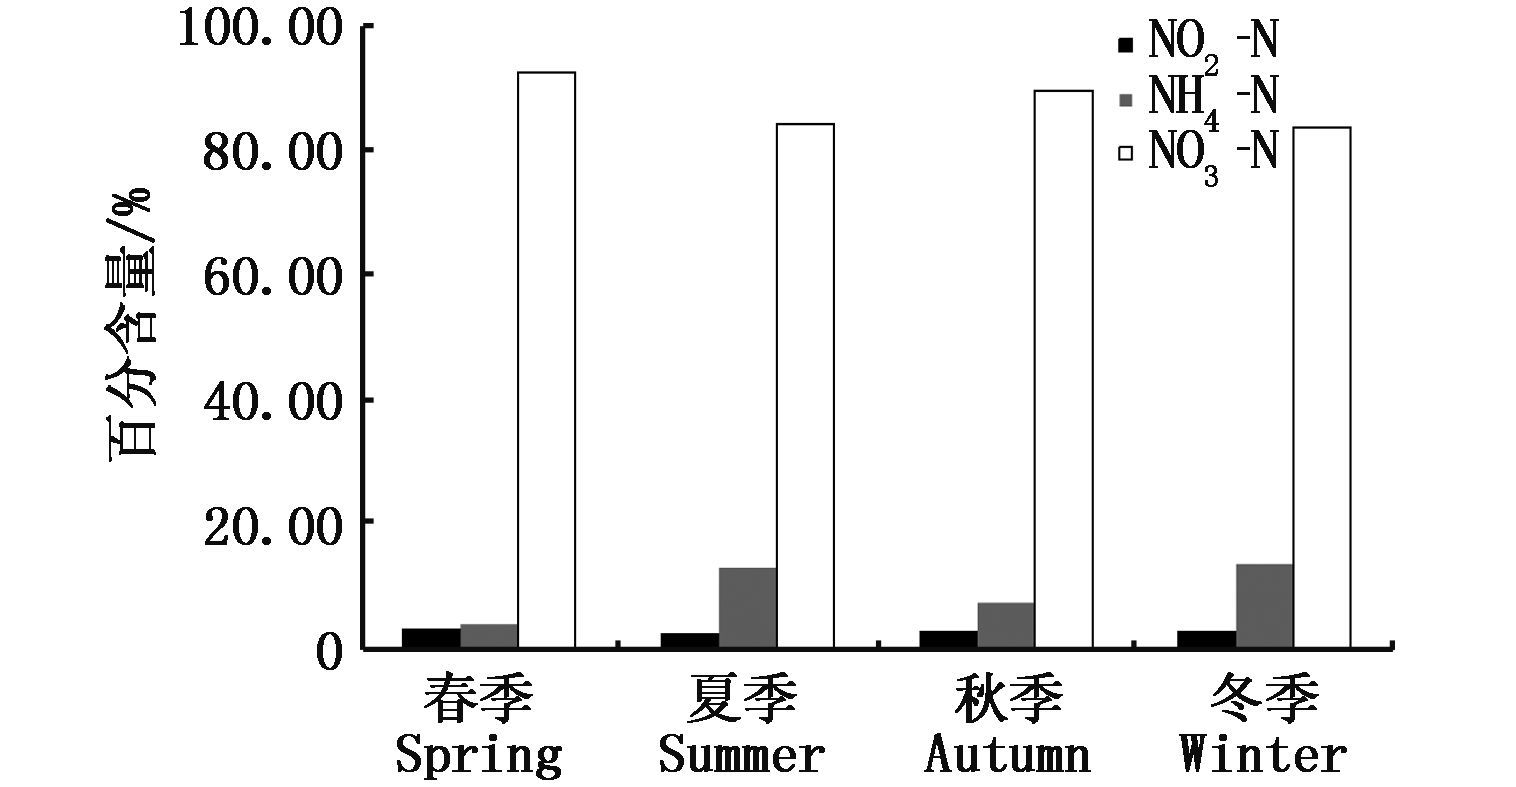
根据表 2对DIN中硝酸盐、亚硝酸盐及氨氮含量进行分析可知:2015年东海海域春季表层硝酸盐浓度平均值为9.23 μmol/L,占DIN总含量的90.62%,亚硝酸盐占DIN总含量的3.45%,氨盐占DIN总含量的5.93%。10 m层硝酸盐浓度平均值为8.40 μmol/L,占DIN总含量88.85%,亚硝酸盐占DIN总含量的4.36%,氨盐占DIN总含量的6.79%。底层硝酸盐浓度平均值为12.97 μmol/L,占DIN总含量的92.65%,亚硝酸盐占DIN总含量的3.21%,氨盐占DIN总含量的4.14%。夏季表层硝酸盐浓度平均值为7.20 μmol/L,占DIN总含量的76.91%,亚硝酸盐占DIN总含量的2.53%,氨盐占DIN总含量的20.46%。10 m层硝酸盐浓度平均值为7.75 μmol/L,占DIN总含量的75.76%,亚硝酸盐占DIN总含量的4.01%,氨盐占DIN总含量的20.23%。底层硝酸盐浓度平均值为13.52 μmol/L,占DIN总含量的84.39%,亚硝酸盐占DIN总含量的2.50%,氨盐占DIN总含量的13.11%。秋季表层硝酸盐浓度平均值为8.45 μmol/L,占DIN总含量的86.22%,亚硝酸盐占DIN总含量的3.98%,氨盐占DIN总含量的9.80%。10 m层硝酸盐浓度平均值为7.88 μmol/L,占DIN总含量的85.93%,亚硝酸盐占DIN总含量的3.93%,氨盐占DIN总含量的10.14%。底层硝酸盐浓度平均值为11.11 μmol/L,占DIN总含量的89.60%,亚硝酸盐占DIN总含量的2.82%,氨盐占DIN总含量的7.58%。冬季表层硝酸盐浓度平均值为10.21 μmol/L,占DIN总含量的84.17%,亚硝酸盐占DIN总含量的2.47%,氨盐占DIN总含量的13.36%。10 m层硝酸盐浓度平均值为10.27 μmol/L,占DIN总含量的84.53%,亚硝酸盐占DIN总含量的2.63%,氨盐占DIN总含量的12.84%。底层硝酸盐浓度平均值为10.52 μmol/L,占DIN总含量的83.69%,亚硝酸盐占DIN总含量的2.70%,氨盐占DIN总含量的13.61%。
|
表 2 2015年春、夏、秋、冬季东海各层次DIN含量组成 Tab.2 DIN content in all layers of the East China Sea in spring, summer, autumn and winter, 2015 |
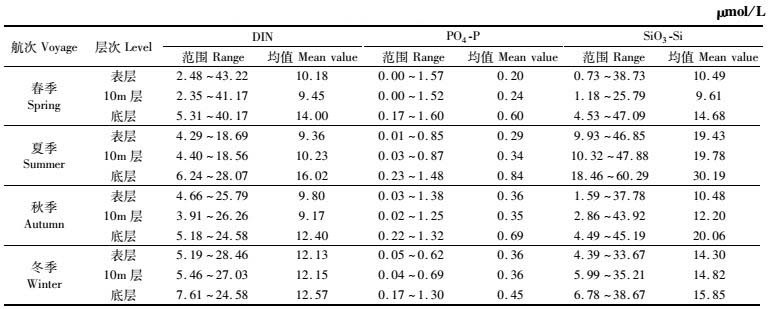
综合图 2-图 4和表 3分析春、夏、秋、冬季4个季节东海海域各层次营养盐含量可以发现,DIN含量主要受硝酸盐控制,铵盐其次,亚硝酸盐比例最小。从垂直分布来看,硝酸盐均值最高值均在底层。从季节性变化来看,夏、冬季中表层、10 m层、底层的氨氮浓度显著高于春、秋季,这主要源于浮游生物的作用[12]。DIN中亚硝酸在表层、10 m层、底层含量均最低。而磷酸盐、硅酸盐含量均值最高也都在底层,大致都呈现由表层至底层逐渐升高的趋势。
|
表 3 2015年春、夏、秋、冬季东海各层次营养盐含量范围及均值 Tab.3 Nutrient content range and mean values at all levels of the East China Sea in spring, summer, autumn and winter, 2015 |
|
图 2 2015年春、夏、秋、冬季东海海域表层DIN含量组成
Fig. 2 DIN content of the East China Sea surface in spring, summer, autumn, and winter, 2015
|
|
图 3 2015年春、夏、秋、冬季东海海域10 m层DIN含量组成
Fig. 3 DIN content of the East China Sea 10 m layer in spring, summer, autumn, and winter, 2015
|
|
图 4 2015年春、夏、秋、冬季东海海域底层DIN含量组成
Fig. 4 DIN content of the East China Sea bottom in spring, summer, autumn, and winter, 2015
|
图 5显示了研究海域4个航次中表层磷酸盐、无机氮、硅酸盐含量的平面分布,由图可以看出2015年春季(5月)、夏(8月)、秋(11月)、冬(2月)四季东海区海域磷酸盐、无机氮、硅酸盐的表层浓度高值区均出现在长江口海域,并扩展形成密集等值线。随着向外部海域的扩展,磷酸盐、无机氮、硅酸盐表层浓度逐渐减小。对相同站位比较而言,不同季节磷酸盐的表层浓度大小顺序为:冬季>秋季>夏季>春季,这可能与表层海水中浮游植物在春季逐渐生长并大量吸收磷酸盐有关。不同季节无机氮的表层浓度大小顺序为冬季>秋季>春季>夏季,这表现出无机氮表层浓度变化是由秋季开始升高,到冬季达到最高值,春季开始减弱,在夏季达到最低值,这可能是受长江冲淡水外海扩展影响,DIN含量高值区主要集中在长江口海域,其他海域含量低。造成此种营养盐结构的主要原因是夏季表层水中较强生物营养盐消耗作用,使得除长江口以外其他海域表层无机氮在大量消耗同时得不到深层水中无机氮的补充。不同季节硅酸盐的表层浓度大小顺序为夏季>冬季>秋季>春季。长江口外表层硅酸盐分布与长江冲淡水走势基本一致,呈双舌分布,向东北、东南方向扩展,影响范围广泛[15]。

|
图 5 2015年春、夏、秋、冬季东海磷酸盐、无机氮、硅酸盐表层含量平面分布
Fig. 5 Phosphate, inorganic nitrogen, content of silicate surface plane distribution of the East China Sea in spring, summer, autumn, and winter, 2015
|
总体来看,东海区营养盐分布具有明显的季节变化。调查时间内,对于磷酸盐和无机氮的含量,浓度大小顺序为冬季>秋季>夏季>春季。硅酸盐的含量表现为夏季>冬季>秋季>春季。且高值区的东扩现象更为明显[13]。
2.3 营养盐变化规律分析东海海域营养盐分布变化除了与不同季节海洋生物活动及营养盐的内部生物地球化学循环机制密切相关外,在中尺度上他们主要受控于东海区复杂的环流季节变化,特别是长江冲淡水的季节变化[5]。从营养盐的研究来看,黑潮、台湾暖流、黄海暖流、长江口羽状锋或冲淡水等海流[16]对营养盐的分布特征和物质交换影响很大,加上东海位于地球环境变化速率大的典型的亚洲季风区,海流明显受季风驱动,复杂的物理和化学条件,使东海营养盐研究及相关的生物地球化学研究和海洋生态系统动力学研究具有挑战性[17]。东海外海区为西侧分支—台湾暖流流经和影响区,营养盐浓度分布表现为表层水和底层水的巨大差异。台湾暖流向东海入侵路径在底部呈现营养盐浓度高值带[10]。东海营养盐主要受长江冲淡水影响,长江口-浙闽近海表层营养盐浓度较高。外海表层受黑潮表层水的影响营养盐浓度较低,底层由于有机物降解,浓度随深度而增加[12]。长江冲淡水中硝酸盐浓度较高(最高浓度可达100 μmol/L),而磷酸盐浓度相对偏低[18],因而受其影响,长江口附近海域营养盐表层高值区范围明显大于中层和底层。这进一步表明,东海营养盐主要来源于长江冲淡水,而磷酸盐往往受长江冲淡水和台湾暖流同时控制[19]。营养盐浓度大体呈现自西向东递减的变化趋势,营养盐含量的高值区均集中在123°E以西的长江口海域,自此向外开始迅速递减。以上论述均与本文得出的结论相一致。
3 结论综合分析2015年春、夏、秋、冬4个季节东海海域DIN含量可以发现,DIN含量主要受硝酸盐控制。从垂直分布来看,磷酸盐、硅酸盐、硝酸盐均值最高值均在底层,几乎都呈现由表层至底层逐渐升高趋势。从季节性变化来看,无机氮中表层、10 m层、底层氨氮的浓度夏、冬季显著高于春、秋季,亚硝酸含量在表层、10 m层、底层浓度所占比例均最低。
东海区营养盐分布具有明显的季节变化。对于磷酸盐和无机氮,秋、冬季的含量,浓度大小顺序为冬季>秋季>夏季>春季。硅酸盐的含量表现为夏季>冬季>秋季>春季。东海营养盐主要来源于长江冲淡水,浓度大体呈现自西向东递减的变化趋势,营养盐含量的高值区均集中在123°E以西的长江口海域,自此向外开始迅速递减。
| [1] | CHU P, CHEN Y C, KUNINAKA A. Seasonal variability of the Yellow Sea/East China Sea surface fluxes and thermohaline structure[J]. Advances in Atmospheric Sciences, 2005, 22(1): 1–20. DOI:10.1007/BF02930865 |
| [2] | YANAGI T, TAKAHASHI S. Seasonal variation of circulations in the East China Sea and the Yellow Sea[J]. Journal of Oceanography, 1993, 49(5): 503–520. DOI:10.1007/BF02237458 |
| [3] | SHEN Z L, LIU Q, ZHANG S M, et al. The dominant controlling factors of high content inorganic N in the Changjiang River and its mouth[J]. Oceanologia et Limnologia Sinica, 2001, 32(5): 465–473. |
| [4] |
王修林, 孙霞, 韩秀荣, 等. 2002年春、夏季东海赤潮高发区营养盐结构及分布特征的比较[J].
海洋与湖沼, 2004, 35(4): 323–331.
WANG X L, SUN X, HAN X R, et al. Comparison in macronutrient distributions and composition for high frequency HAB occurrence areas in the East China Sea between summer and spring 2002[J]. Oceanologia et Limnologia Sinica, 2004, 35(4): 323–331. |
| [5] |
高生泉, 林以安, 金明明, 等. 春、秋季东、黄海营养盐的分布变化特征及营养结构[J].
东海海洋, 2004, 22(4): 38–50.
GAO S Q, LIN Y A, JIN M M, et al. Distribution features of nutrients and nutrient structure in the East China Sea and the Yellow Sea in spring and autumn[J]. Donghai Marine Science, 2004, 22(4): 38–50. |
| [6] |
刘兴泉. 东海PN断面夏季温盐及化学要素的分布特征[J].
海洋与湖沼, 2001, 32(2): 204–212.
LIU X Q. Distribution features of T-S and chemical constituents at the PN section in the East China Sea during summer[J]. Oceanologia et Limnologia Sinica, 2001, 32(2): 204–212. |
| [7] |
孙霞, 王保栋, 王修林, 等. 东海赤潮高发区营养盐时空分布特征及其控制要素[J].
海洋科学, 2004, 28(8): 28–32.
SUN X, WANG B D, WANG X L, et al. Spatial and temporal distribution of the nutrients and its controlling factors in the high-frequency HAB occurrence area in the East China Sea[J]. Marine Sciences, 2004, 28(8): 28–32. |
| [8] |
王保栋, 战闰, 藏家业. 长江口及其邻近海域营养盐的分布特征和输送途径[J].
海洋学报, 2002, 24(1): 53–58.
WANG B D, ZHAN R, ZANG J Y. Distributions and transportation of nutrients in Changjiang River Estuary and its adjacent sea areas[J]. Acta Oceanologica Sinica, 2002, 24(1): 53–58. |
| [9] | LI D J, DAG D. Ocean pollution from land-based sources:East China Sea, China[J]. AMBIO:A Journal of the Human Environment, 2004, 33(1): 107–113. DOI:10.1579/0044-7447-33.1.107 |
| [10] |
王芳, 康建成, 周尚哲, 等. 东海外海海域营养盐的时空分布特征[J].
资源科学, 2008, 30(10): 1592–1599.
DOI:10.3321/j.issn:1007-7588.2008.10.022 WANG F, KANG J C, ZHOU S Z, et al. Nitrate and phosphate conditions and fishery resources in the offshore area of the East China Sea[J]. Resources Science, 2008, 30(10): 1592–1599. DOI:10.3321/j.issn:1007-7588.2008.10.022 |
| [11] |
曹维, 蔡燕红, 张海波, 等. 东海区典型断面营养盐潜在性富营养化评价[J].
浙江海洋学院学报(自然科学版), 2014, 33(3): 251–256.
CAO W, CAI Y H, ZHANG H B, et al. Analysis of nutrient distributions and potential eutrophication in seawater of the East China Sea nearly two decades[J]. Journal of Zhejiang Ocean University (Natural Science), 2014, 33(3): 251–256. |
| [12] |
米铁柱, 姚庆祯, 孟佳, 等. 2011年春、夏季黄海、东海营养盐分布特征研究[J].
海洋与湖沼, 2012, 43(3): 678–688.
DOI:10.11693/hyhz201203040040 MI T Z, YAO Q Z, MENG J, et al. Distributions of nutrients in the Southern Yellow Sea and East China Sea in spring and summer 2011[J]. Oceanologia et Limnologia Sinica, 2012, 43(3): 678–688. DOI:10.11693/hyhz201203040040 |
| [13] |
叶然, 刘艳云, 崔永平, 等. 东海营养盐结构的时空分布及其对浮游植物的限制[J].
海洋与湖沼, 2015, 46(2): 311–320.
DOI:10.11693/hyhz20140400122 YE R, LIU Y Y, CUI Y P, et al. Temporal and spatial distributions of nutrient structure and limitation on phytoplankton in the East China Sea[J]. Oceanologia et Limnologia Sinica, 2015, 46(2): 311–320. DOI:10.11693/hyhz20140400122 |
| [14] |
徐恒振, 马永安, 于涛, 等. 海洋监测规范[M]. 北京: 中国海洋出版社, 2007: 109-119.
XU H Z, MA Y A, YU T, et al. The Specification for Marine Monitoring[M]. Beijing: China Ocean Press, 2007: 109-119. |
| [15] |
朱建荣, 王金辉, 沈焕庭, 等. 2003年6月中下旬长江口外海区冲淡水和赤潮的观测及分析[J].
科学通报, 2005, 50(3): 240–247.
ZHU J R, WANG J H, SHEN H T, et al. Observation and analysis of the diluted water and red tide in the sea off the Changjiang River mouth in middle and late June 2003[J]. Chinese Science Bulletin, 2005, 50(3): 240–247. |
| [16] | CHEN C C, GONG G C, SHIAH F K. Hypoxia in the East China Sea:One of the largest coastal low-oxygen areas in the world[J]. Marine Environmental Research, 2007, 64(4): 399–408. DOI:10.1016/j.marenvres.2007.01.007 |
| [17] | LIU K K, PENG T H, SHAW P T, et al. Circulation and biogeochemical processes in the East China Sea and the vicinity of Taiwan:an overview and a brief synthesis[J]. Deep-Sea Research Ⅱ:Topical Studies in Oceanography, 2003, 50(6/7): 1055–1064. |
| [18] | LIU K K, TANG T Y, GONG G C, et al. Cross-shelf and along-shelf nutrient fluxes derived from flow fields and chemical hydrography observed in the southern East China Sea off northern Taiwan[J]. Continental Shelf Research, 2000, 20(4/5): 493–523. |
| [19] | SHI X Y, WANG X L, HAN X R, et al. Nutrient distribution and its controlling mechanism in the adjacent area of Changjiang River estuary[J]. Chinese Journal of Applied Ecology, 2003, 14(7): 1086–1092. |
2. Department of Geography & Spatial Information Techniques, Ningbo University, Ningbo 315211, Zhejiang, China
 2017,
Vol. 26

