得益于二代测序技术的发展,单核苷酸多态性标记(SNPs)在种群遗传、生态保护、农作物杂交、适应性进化、系统发育以及物种鉴定等领域得到了广泛的应用[1-11]。目前有两种方法识别非模式物种中的SNPs。第一种方法是转录组测序获取SNPs[12-14]。由于用此方法得出的SNPs位于转录区域,因此可能会导致在估计种群参数比如遗传漂变,基因流时产生误差[12]。另外,除非是与已注释好的基因组做比较[13, 15],或者从头组装[16],否则在内含子外显子边界附近的SNPs难以验证。第二种方法是对简化基因组测序,如:基因分型测序(GBS)[9],或者限制性酶切位点测序(RAD)[1, 17]。但是,这些方法需要高质量的DNA样本,并且在不同物种中的可比性很小且质量不高[9]。所以不能用于跨物种的系统学研究[1, 18]。
目前,基因富集技术成为第三种获得SNPs的渠道[19-22],甚至可以用于古DNA的实验[20, 23]。基因富集的目标也是灵活多样的,比如叶绿体基因组[23]、基因组中的某一区段[20]、和疾病相关的基因[24]、或者是外显子组都可以成为富集的目标基因[25],并且基因富集技术可富集不同物种的同源基因[26],这意味着我们可以利用富集技术来研究种间问题[26-27]。利用分子数据进行物种鉴定的方法有许多[28-32]。利用贝叶斯因子进行物种界定是一种常用的方法 [2, 32],大多方法只能处理较少的位点[2],然而Bayes factor delimitation(*with genomic data,BFD*)可以用来分析上千SNP数据,它的优点是通过共显性标记直接推算物种树,而不需要估算基因树[33]。
刀鲚(Coilia)是一种鲱形目的鱼类[34-35],长江中已经发现了多个刀鲚的亚种及生态型[34, 36-37]。在洞庭湖中发现与刀鲚(C. nasus)不同的短颌鲚(C. brachygnathus)[38],后来上颌骨较短的生态型在长江中游、下游,以及与中下游相通的其他湖泊中相继被发现[34, 36-38]。这些物种以及生态型的分类合理性仍备受争议[32, 39-41]。线粒体和AFLP数据显示短颌鲚和刀鲚难以区分,因此现在一致认为短颌鲚和刀鲚是同一物种[32, 39-41]。因为它们可能有不同的产卵场[42],已有相关研究致力于辨别这些不同来源的个体[43-44]。
LI等[26]开发了1 265个单拷贝核基因标记。本研究有两个目标:(1)根据LI等的方法,开发可用于鲱形目鱼类的SNP分子标记,结合基因富集技术以及BFD*的方法进行物种界定;(2)富集这些SNP位点来区分短颌鲚和沿海以及河流中的刀鲚,以此来判断它们之间的遗传差异,对鲚属进行物种界定。
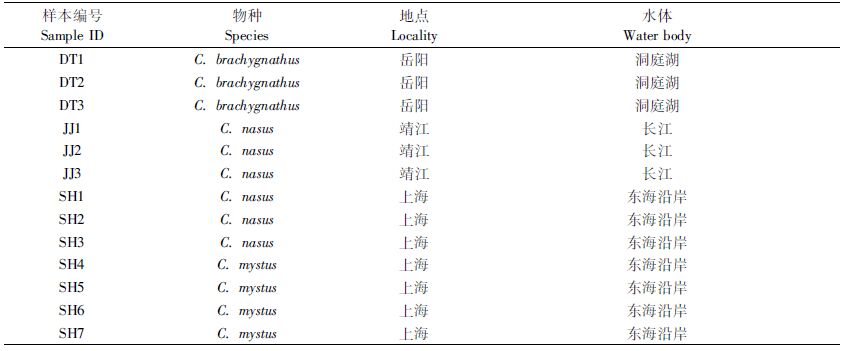
1 材料与方法 1.1 样本采集了6尾刀鲚(C. nasus),其中3尾来自于上海沿岸,3尾来自于长江主干的靖江;3尾“短颌鲚”(C. brachygnathus)来自于模式产地岳阳洞庭湖(图 1和表 1)。另外,从上海采集了4尾凤鲚(C. mystus)做为本研究的外群。

|
图 1 样本采集地点
Fig. 1 The site of samples
|

|
表 1 采样地点及水体 Tab.1 Sampling localities and water bodies |
根据LI等[26]的描述,选用单拷贝核基因标记作为富集的目标基因。因为没有刀鲚基因组,因此RNA探针是根据斑马鱼的1 265个核编码基因序列设计,总计358 798 bp。目标区域从142 bp到2 462 bp不等,平均片段大小是222 bp。根据这些目标序列合成120 bp的RNA探针(MYBaits试剂盒;MYcroarray,Ann Arbor,Michigan,USA),每个相邻探针之间留有60 bp的重叠区域,以提高基因富集效率。
1.3 文库制备、基因富集及混合测序文库制备和基因富集按照LI等[26]的实验步骤。每个样本富集两次,即第一次富集的产物做为第二次富集的模板。通过条形码引物扩增将8 bp的DNA条形码添加到每个样本上,然后将所有样本等摩尔混合用MiSeq(Illumina,Inc,San Diego,CA,USA)平台进行2×151 bp测序。
1.4 生物信息学分析根据8 bp的DNA条形码将属于每个样本的原始序列(reads)分开,DNA条形码没有错配的reads才可以用作下一步分析。接头序列和质量分数低于20的reads用Cutadapt1.1软件去掉[45-46]。对每个样本用ABySS 1.3.4 软件进行从头组装[47]。ABySS的kmer值设置为63。用自编Perl脚本以斑马鱼为参考序列与组装好的重叠群比对,获得组装好的每个样本每个基因的重叠群,然后将每个样本的重叠群用Geneious Pro v 5.6.2 软件(Biomatters,Auckland,New Zealand available from http://www.geneious.com/)进一步组装,这时选择Geneious中从头组装的选项。对组装好的重叠群进行手动检查。挑选与斑马鱼序列最相似的重叠群,仔细检查以确保是直系同源基因。筛选目标基因符合以下3个条件:(1)每个个体有大于2个等位基因的重叠群会被去除,因为二倍体生物有超过两个等位基因表明可能旁系同源序列被错误地组装到了一起;(2)如果一个位点在某一群体的所有个体中都没有数据的话,那么这个位点也会被舍弃,也就是说每个位点在每个群体至少要有一个样本中有数据;(3)无法对齐的序列的两端会被切除。经过以上数据清理后,每个基因输出一条共有序列用作原始reads映射的一个参考序列。
1.5 序列(reads)映射和SNPs位点的获取所有样本原始序列经过修整,然后用BWA-0.7.10 软件映射到共有参考序列上[48],重复序列(PCR扩增产生的重复)用Picard 1.118软件(http://picard.sourceforge.net)标记出来。用GATK 3.2软件对碱基测序质量重新校正、序列重新比对,根据标准过滤参数对13个样本同时进行基因分型,获得SNP基因型数据[49]。所有分析步骤按照GATK最优的执行方法进行操作[50-51]。用自编Perl脚本将SNP vcf文件转换成可以被BEAST 2.1.3识别的Nexus文件[52],和Structure 2.3.4识别的输入文件[53]。因为BEAST和Structure软件的分析需要假定位点是连锁平衡的,用自编脚本选择每个目标区域最好的SNP位点(最高的SNP映射得分,最少丢失数据)用于后面的数据分析。数据预处理、参考序列组装、序列映射及SNPs获取的过程如图 2所示。

|
图 2 根据参考序列组装原始数据以及获取SNPs数据流程图
Fig. 2 The workflow of the raw data preprocessing,reference assembling and SNPs calling
|
用STRUCTURE分析来检测样本可以分为几个不同的遗传群体。测试值从1到4(K=1到4),每个K值的运行次数、迭代次数均采用默认设置。用Structure Harvester软件(http://taylor0.biology.ucla.edu/structureHarvester/)来评估增加K值时,Delta K的变化[54],根据此值来选择最佳的K值[60]。
1.7 物种界定BFD*与其他物种界定的方法相比优点是可以利用全基因组共显性等位基因数据[2]。用BEAST 2的插件SNAPP的改进版进行BFD*物种界定[52]。根据BFD*维基操作说明(http://www.beast2.org/wiki/index.php/BFD*,12/22/2014)安装程序、建立XML文件及运行,详细分析原理请见“SNAPP分析如何更简单地处理丢失数据和路径抽样”(http://blog.beast2.org/tag/snapp/,12/22/2014)。共运行了24次路径抽样(每次包括100 000 MCMC步骤,burnin设置为10 000代)来估计边际似然值。
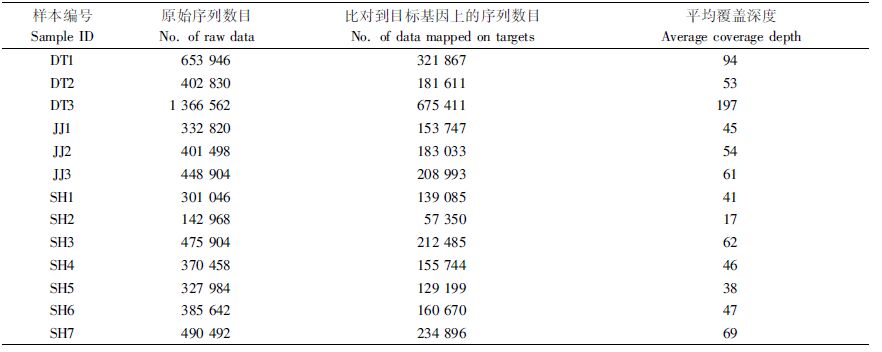
2 结果 2.1 测序结果和SNPs获取经过去接头和测序质量分数校正,共获得了600万条序列,每个样本获得301 046~1 366 562条序列不等,不同群体间的样本数据量无明显差异(表 2)。用ABySS组装所有的序列,通过和斑马鱼的目标序列比较,获得刀鲚每个样本每个基因的重叠群,用Geneious合并重叠群,去除组装错误的重叠群和在某一种群所有样本均有缺失的数据,我们最终得到698条共有目标序列作为参考序列。使用BWA将每个样品的序列映射到参考序列上。每个样本映射到目标区域的序列从57 350到675 411条不等,目标序列平均覆盖深度从17×到197×不等。

|
表 2 测序结果统计 Tab.2 Summary of sequencing results |
对所有13个样本进行了序列分值校正、局部重比对、SNP和INDEL的发掘与基因分型。经过应用默认参数的挑选,我们从682个重叠群中提取了8 011个SNPs。最后,我们选择了每一个重叠群中映射分值最高的和缺失数据最少的,共682个SNP位点用于后续的分析。我们将vcf文件格式转换成了nexus格式,以及STRUCTURE分析的输入文件格式。
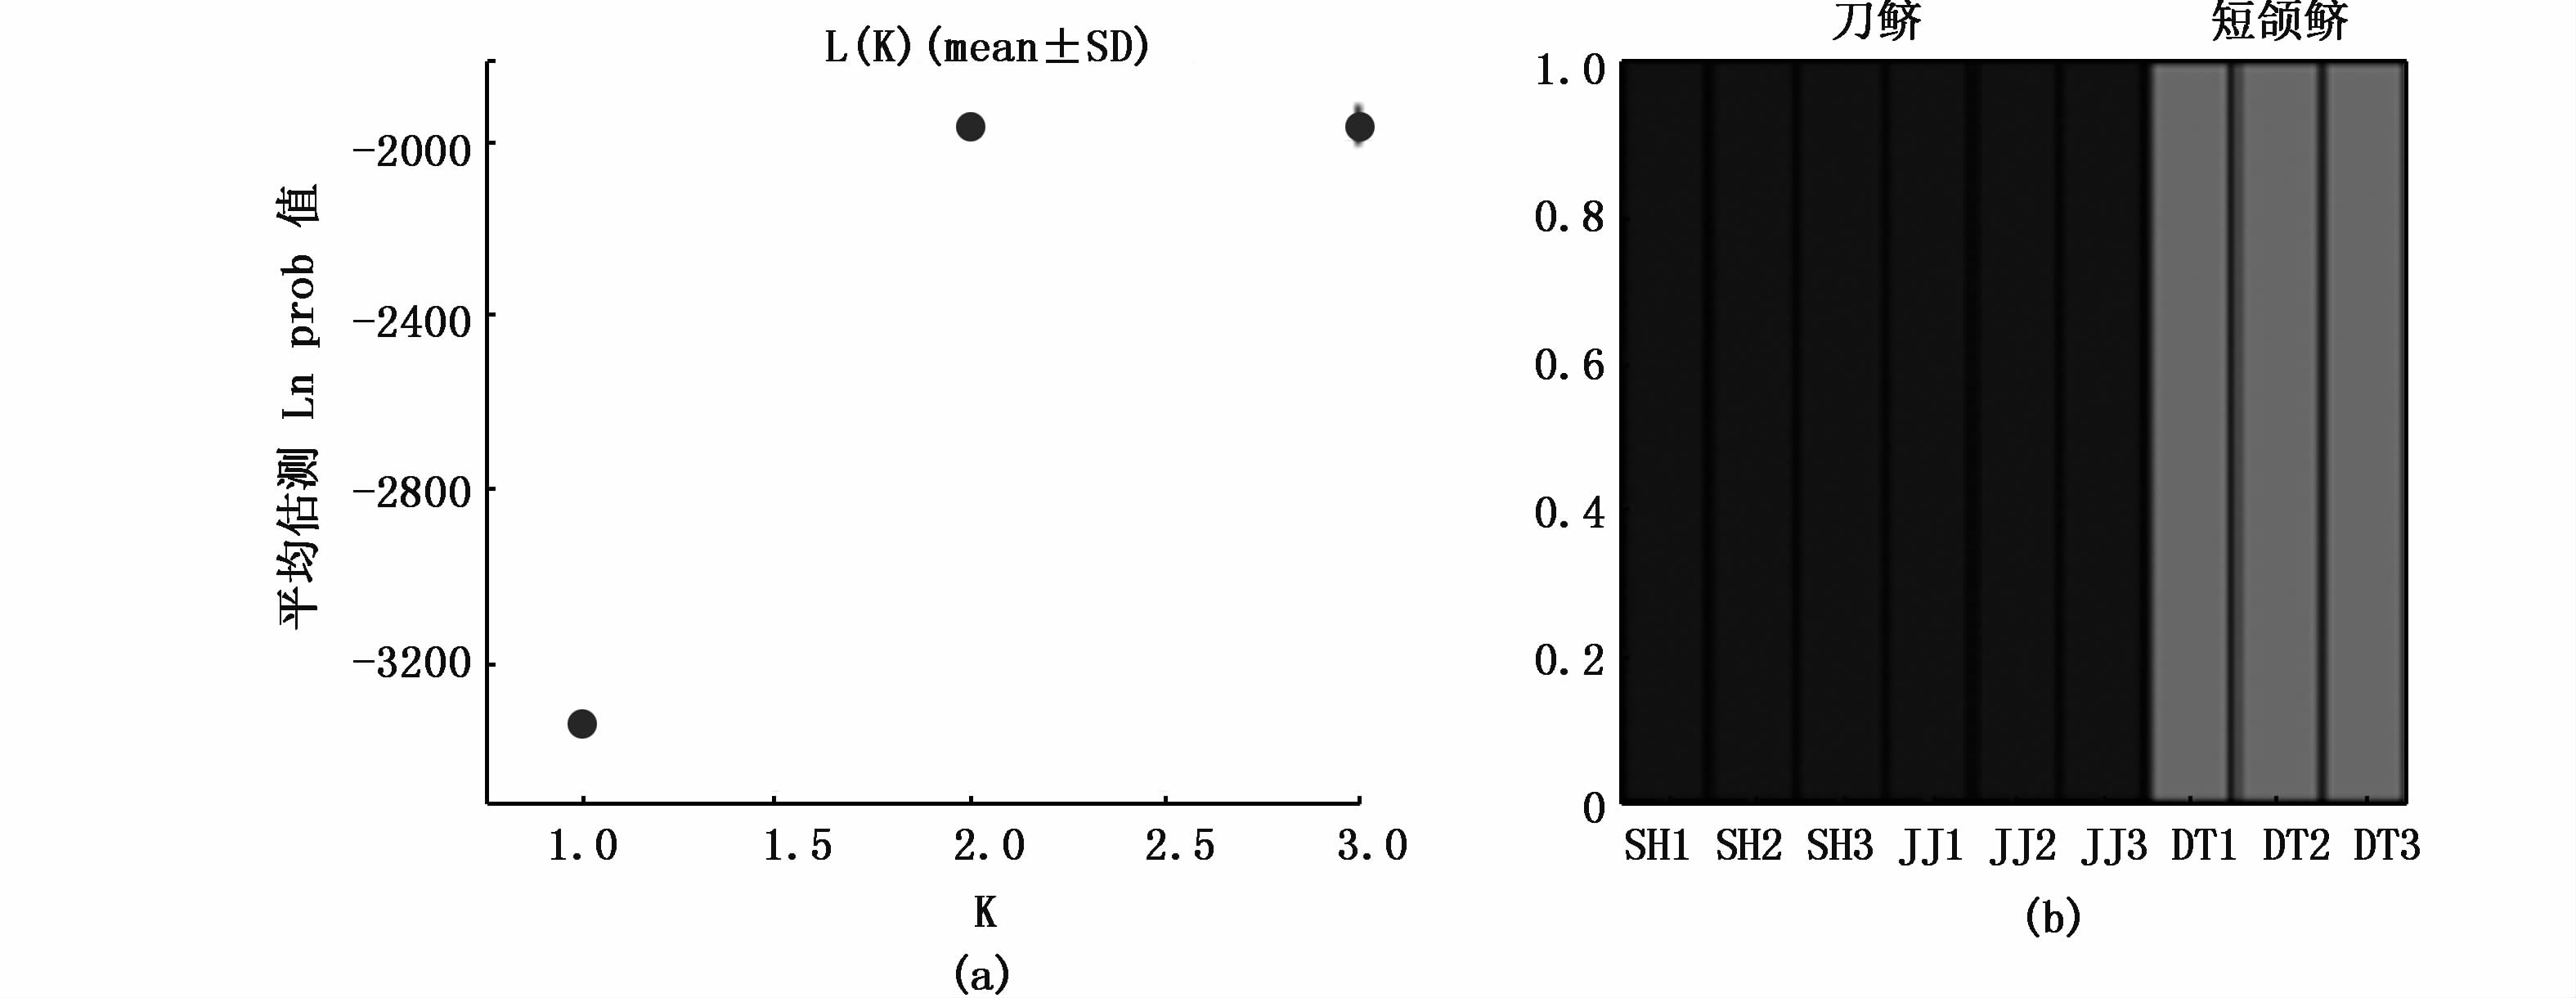
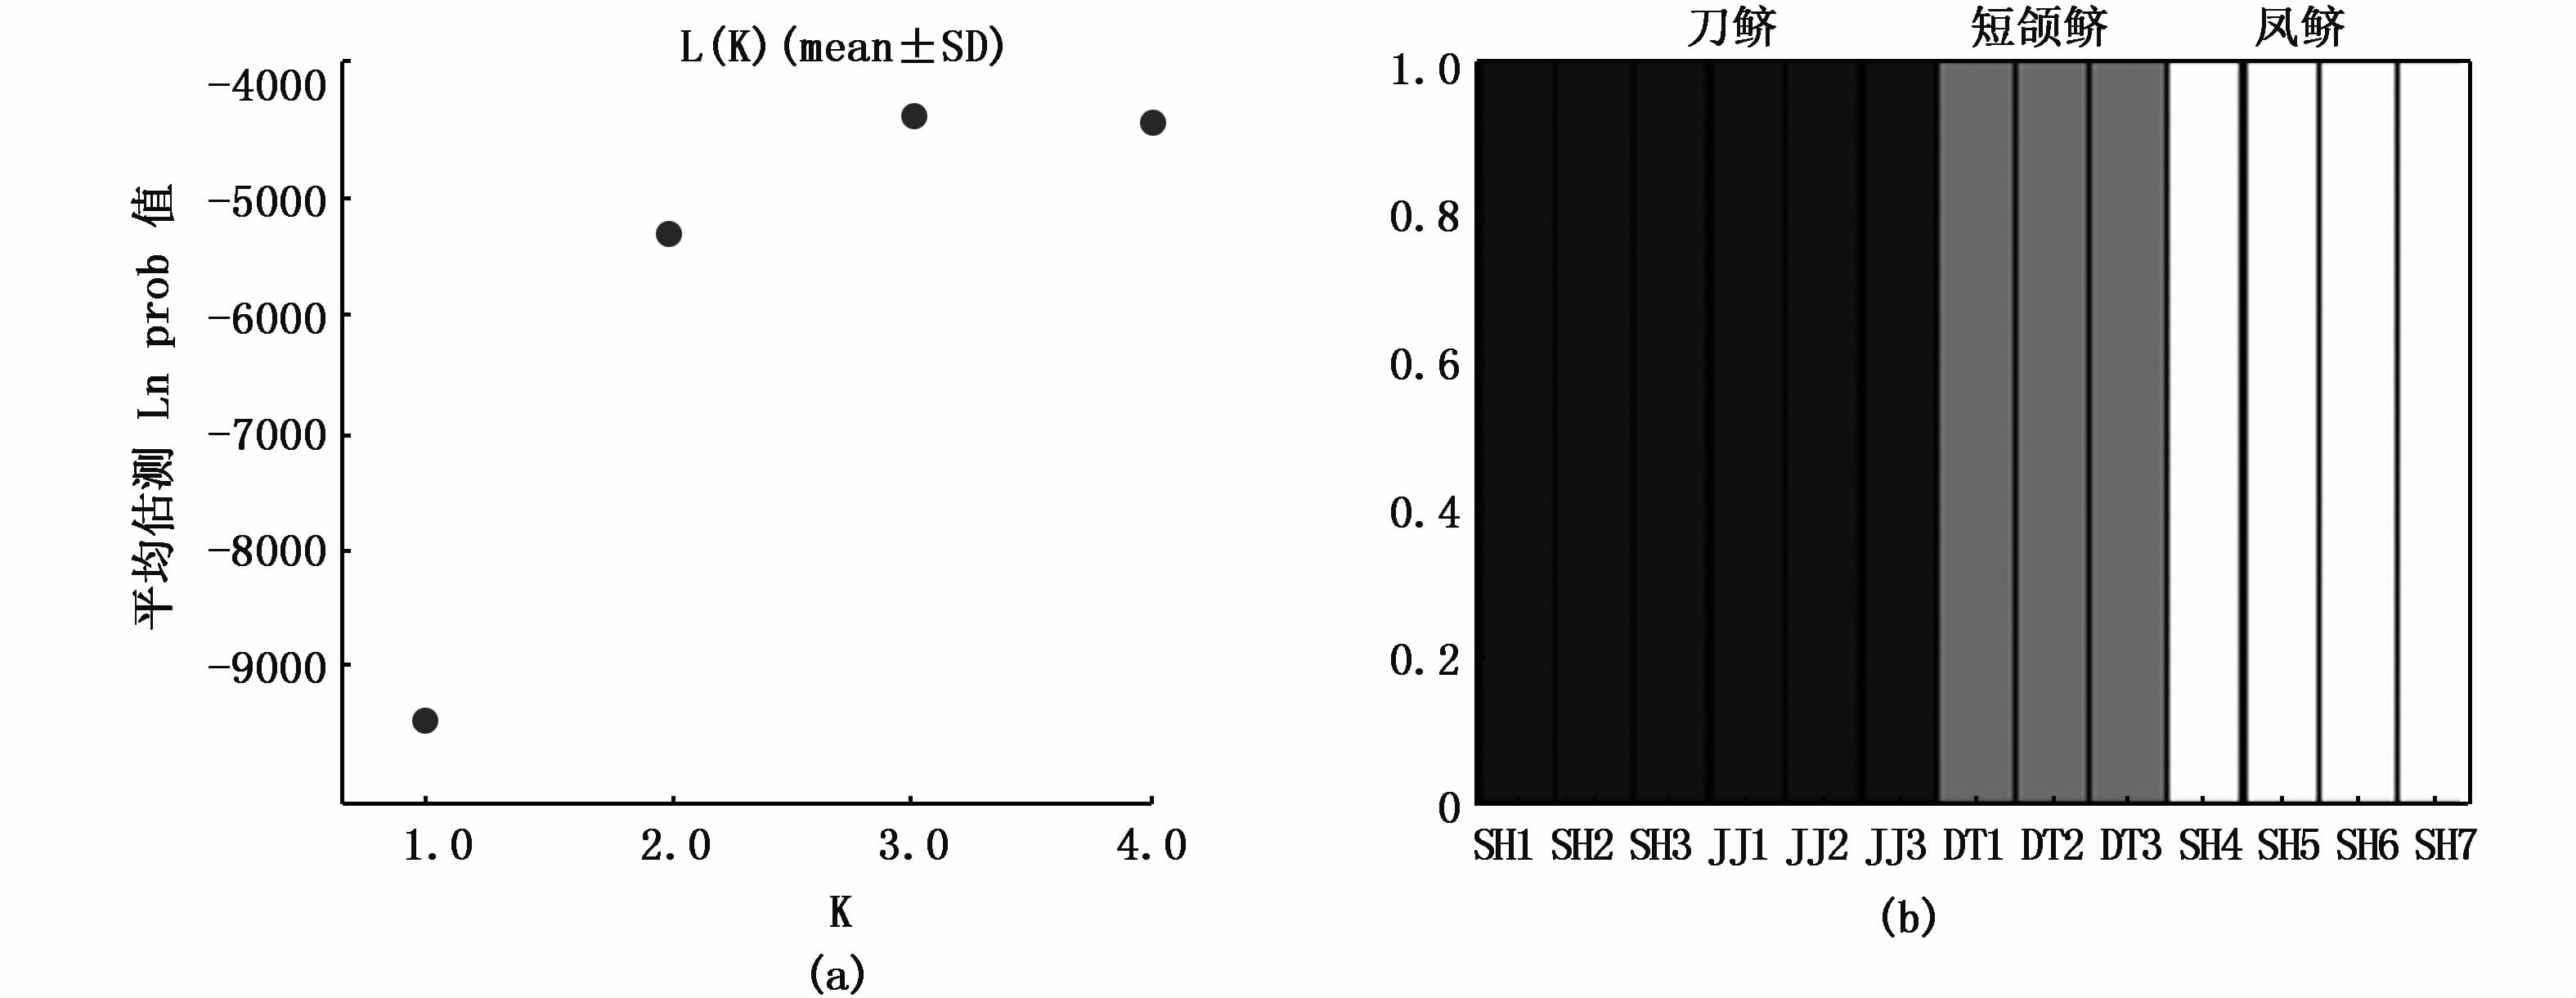
2.2 种群遗传结构分析在STRUCTURE分析中,我们的目标是评估刀鲚和“短颌鲚”的遗传结构,因此没有使用4个凤鲚的样本,造成一些SNP位点变成了无变异的位点,所以我们删除了这些位点,从而使SNPs总数从682减少到338。STRUCTURE分析结果支持将9个个体分为两组:洞庭湖区的“短颌鲚”样本为一组,靖江和上海的刀鲚样本作为另一组(图 3b),而对靖江和上海的样本进一步分组得不到数据的支持(图 3a)。我们也对所有13个样本的682个SNPs位点进行了分析,这些样本中包括了凤鲚样本,结果相同,即刀鲚和“短颌鲚”分为截然不同的两组(图 4)。

|
图 3 遗传结构分析
Fig. 3 Structure analyses
当K从1变为2时,估算的似然值增加了1 378单位,但是将样本分为更多组不被支持(a);9个鲚属样本被分为2组:洞庭湖的一组,靖江和上海的样本为另一组(b) Showed that the estimated likelihood of the data increased by 1378 units when K changed from one to two,while dividing the fish into more groups was not supported (a). The nine individuals of Coilia were clustered into two groups: fish from Lake Dongting as one group and samples from Jingjiang and Shanghai as the other group(b) |

|
图 4 13个个体的遗传结构分析,包括鲚属的两种鱼
Fig. 4 Structure analysis using all 13 fish,including both species of Coilia
|
采用新的Bayes factor种类划分方法BFD*检测了长江和沿海采集样本间是否存在遗传差异。用BEAST软件包运行SNAPP分析两种不同的情况,将来自靖江的样本和上海的样本作为一个物种,或将它们作为独立的物种。然后,我们用路径抽样计算了边际似然率。合并物种和区分独立物种的边缘似然值分别是-10 123.5和-10 112.2。两种情况的贝叶斯因子是11.3(Bayes factor = 11.3)。根据RAFTERY[55-56],当3 < Bayes factor <20时,对替代方案的支持是有利的,因此,BFD*分析结果表明长江和沿海地区采集的刀鲚之间存在着少量的遗传差异,但差异不显著。
3 讨论本研究所用的目标基因是根据所有脊椎动物,包括鲨鱼、辐鳍鱼类、两栖类、爬行类、鸟类和哺乳动物开发的单拷贝核基因标记[26, 57]。我们在鲚属中富集到了大部分标记基因。另外,我们还成功地将这些标记基因应用于鱼类(虾虎鱼,鲈鱼)、短吻鳄、鸟类和软骨鱼类的研究中,因此本研究所用的分子标记可以运用于富集大部分种类的脊椎动物。使用通用标记富集相比匿名标记有两大优点:首先,可以将富集到的序列与参考序列进行比较。比如在这次研究中,没有鲚属的参考基因组,可以用斑马鱼的序列作为参考序列来获得鲚属中的序列。其次,由于这些单拷贝基因在大多数的脊椎动物中比较保守,借此,可以获得不同物种的同源序列并重建系统发育关系,用来研究不同分类水平的系统发育问题。值得注意的是,通用标记并不意味着可以仅凭一组RNA探针可以富集到所有的脊椎动物的基因。应该用与目标物种亲缘关系最近的参考序列来设计探针。比如,用斑马鱼的探针来富集鲚属的目标基因,用鸡的基因组序列来富集鸟类中的目标基因。
大多数物种界定的方法必须先建立基因树,因此只能利用少量的位点进行分析[57]。BFD*通过将多物种溯祖的方法结合到SNAPP软件中[2],从而完全避免了对基因树的依赖,达到了真正意义上用基因组SNPs数据进行分析。BFD*唯一的限制是需要预先设定样本属于哪一个类群,所以我们先用STRUCTURE将样本分类,这一策略也见于其他的研究中[58]。
STRUCTURE个体之间的聚类分析,结果显示从洞庭湖中采得的“短颌鲚”样本与长江下游和沿海地区采得的刀鲚样本不同。洞庭湖的“短颌鲚”由于其具有较短的未覆盖到鳃边缘的上颌骨,因此被定为C. brachygnathus,而长江中“刀鲚”的上颌骨可以覆盖过鳃的边缘[34, 38]。后来在长江的其他区段以及相连接的湖中相继发现了具有上颌骨较短的生态型,因此有人认为C. brachygnathus已经扩散至这些水体中[36-37]。近年来分子研究多支持C. brachygnathus和C. nasus无法区分,因此,C. brachygnathus和C. nasus被认为是同物异名[32, 40-41]。然而,这些研究所用样本采自非典型的水域,比如太湖[32],或者只用了单个线粒体的位点,因此,这无法反映洞庭湖中的Coilia是C. brachygnathus还是C. nasus。而我们根据基因组水平数据的研究结果表明洞庭湖的“短颌鲚”样本和其他地区的刀鲚样本在STRUCTURE聚类分析和BFD*模型选择的数据支持下,应该属于不同的物种。因此今后有必要从洞庭湖和其他区域采集更多样本进行基因组水平的分析,结合物种界定的方法,来进一步验证C. brachygnathus是否是有效的种。我们认为上颌骨的长度不应该作为鉴别物种的依据,因为上颌骨长度相似的样本在遗传上有时相距甚远[32, 39, 41]。
在春季,C. nasus迁移到长江产卵,其中有些个体会更早地迁徙到河流中去产卵,有些个体则更多地停留在河口地区,因此它们可能有不同的产卵场,它们之间的基因交流可能会受到限制[42]。有研究表明栖居于河流和沿海地区的C. nasus的氨基酸组成不同[43-44],意味着它们之间可能存在着基因分化,但本研究BFD*分析显示将河流与沿海地区个体分成不同独立群体的支持度很低,这和STRUCTURE的分析结果是相同的。因此我们认为尽管长江中的刀鲚与沿海区域的刀鲚在空间与时间分布上存在差异,但根据我们基因组水平的遗传研究,认为应归为一个种群。本研究仅从3个采样点各选取了3个个体来研究它们之间的遗传差异,因此样本的数量是不够的,若要解决有关C. nasus复杂的系统分类问题需要从更广的区域采集更多的样本,比如陆封种群和其他地区的种群来研究它们之间的关系。不过,本研究的主要目标是结合基因富集、脊椎动物的通用标记以及BFD*方法来获得SNPs数据并进行物种界定研究,结果表明这一方法是可行的,为今后进一步研究刀鲚的分子系统学奠定了基础。
| [1] | EMERSON K J, MERZ C R, CATCHEN J M, et al.Resolving postglacial phylogeography using high-throughput sequencing[J]. Proceedings of the National Academy of Sciences of the United States of America, 2010, 107(37): 16196–16200. DOI:10.1073/pnas.1006538107 |
| [2] | LEACHÉ A D, FUJITA M K, MININ V N, et al.Species delimitation using genome-wide SNP data[J]. Systemtic Biology, 2014, 63(4): 534–542. DOI:10.1093/sysbio/syu018 |
| [3] | MILANO I, BABBUCCI M, CARIANI A, et al.Outlier SNP markers reveal fine-scale genetic structuring across European hake populations (Merluccius merluccius)[J]. Molecular Ecology, 2014, 23(1): 118–135. DOI:10.1111/mec.12568 |
| [4] | SATO T, NAKAGOME S, WATANABE C, et al.Genome-wide SNP analysis reveals population structure and demographic history of the ryukyu islanders in the southern part of the Japanese archipelago[J]. Molecular Biology and Evolution, 2014, 31(11): 2929–2940. DOI:10.1093/molbev/msu230 |
| [5] | The Wellcome Trust Case Control Consortium.Genome-wide association study of 14,000 cases of seven common diseases and 3000 shared controls[J]. Nature, 2007, 447(7145): 661–678. DOI:10.1038/nature05911 |
| [6] | VIQUEZ-ZAMORA M, VOSMAN B, VAN DE GEEST H, et al.Tomato breeding in the genomics era: insights from a SNP array[J]. BMC Genomics, 2013, 14: 354. DOI:10.1186/1471-2164-14-354 |
| [7] | WILLIAMS L M, MA X, BOYKO A R, et al.SNP identification, verification, and utility for population genetics in a non-model genus[J]. BMC Genetics, 2010, 11: 32. |
| [8] | GHOLAMI M, ERBE M, GÄRKE C, et al.Population genomic analyses based on 1 million SNPs in commercial egg layers[J]. PLoS One, 2014, 9(4): e94509. DOI:10.1371/journal.pone.0094509 |
| [9] | GOHLI J, LEDER E H, GARCIA-DEL-REY E, et al.The evolutionary history of Afrocanarian blue tits inferred from genomewide SNPs[J]. Molecular Ecology, 2015, 24(1): 180–191. DOI:10.1111/mec.13008 |
| [10] | OGDEN R, GHARBI K, MUGUE N, et al.Sturgeon conservation genomics: SNP discovery and validation using RAD sequencing[J]. Molecular Ecology, 2013, 22(11): 3112–3123. DOI:10.1111/mec.12234 |
| [11] | YU H H, XIE W B, LI J, et al.A whole-genome SNP array (RICE6K) for genomic breeding in rice[J]. Plant Biotechnology Journal, 2014, 12(1): 28–37. DOI:10.1111/pbi.12113 |
| [12] | HELYAR S J, HEMMER-HANSEN J, BEKKEVOLD D, et al.Application of SNPs for population genetics of nonmodel organisms: new opportunities and challenges[J]. Molecular Ecology Resources, 2011, 11(s1): 123–136. |
| [13] | XIA J H, WAN Z Y, NG Z L, et al.Genome-wide discovery and in silico mapping of gene-associated SNPs in Nile tilapia[J]. Aquaculture, 2014, 432: 67–73. DOI:10.1016/j.aquaculture.2014.04.028 |
| [14] | YU Y, WEI J K, ZHANG X J, et al.SNP discovery in the transcriptome of white Pacific shrimp Litopenaeus vannamei by next generation sequencing[J]. PLoS One, 2014, 9(1): e87218. DOI:10.1371/journal.pone.0087218 |
| [15] | HELYAR S J, LIMBORG M T, BEKKEVOLD D, et al.SNP discovery using next generation Transcriptomic sequencing in Atlantic herring (Clupea harengus)[J]. PLoS One, 2012, 7(8): e42089. DOI:10.1371/journal.pone.0042089 |
| [16] | MONTES I, CONKLIN D, ALBAINA A, et al.SNP discovery in European anchovy (Engraulis encrasicolus, L) by high-throughput transcriptome and genome sequencing[J]. PLoS One, 2013, 8(8): e70051. DOI:10.1371/journal.pone.0070051 |
| [17] | BAIRD N A, ETTER P D, ATWOOD T S, et al.Rapid SNP discovery and genetic mapping using sequenced RAD markers[J]. PLoS One, 2008, 3(10): e3376. DOI:10.1371/journal.pone.0003376 |
| [18] | WAGNER C E, KELLER I, WITTWER S, et al.Genome-wide RAD sequence data provide unprecedented resolution of species boundaries and relationships in the Lake Victoria cichlid adaptive radiation[J]. Molecular Ecology, 2013, 22(3): 787–798. DOI:10.1111/mec.12023 |
| [19] | BI K, LINDEROTH T, VANDERPOOL D, et al.Unlocking the vault: next-generation museum population genomics[J]. Molecular Ecology, 2013, 22(24): 6018–6032. DOI:10.1111/mec.12516 |
| [20] | CLARKE W E, PARKIN I A, GAJARDO H A, et al.Genomic DNA enrichment using sequence capture microarrays: a novel approach to discover sequence nucleotide polymorphisms (SNP) in Brassica napus L[J]. PLoS One, 2013, 8(12): e81992. DOI:10.1371/journal.pone.0081992 |
| [21] | COSART T, BEJA-PEREIRA A, CHEN S Y, et al.Exome-wide DNA capture and next generation sequencing in domestic and wild species[J]. BMC Genomics, 2011, 12: 347. DOI:10.1186/1471-2164-12-347 |
| [22] | CARPENTER M L, BUENROSTRO J D, VALDIOSERA C, et al.Pulling out the 1%: whole-genome capture for the targeted enrichment of ancient DNA sequencing libraries[J]. The American Journal of Human Genetics, 2013, 93(5): 852–864. DOI:10.1016/j.ajhg.2013.10.002 |
| [23] | MARIAC C, SCARCELLI N, POUZADOU J, et al.Cost-effective enrichment hybridization capture of chloroplast genomes at deep multiplexing levels for population genetics and phylogeography studies[J]. Molecular Ecology Resources, 2014, 14(6): 1103–1113. DOI:10.1111/men.2014.14.issue-6 |
| [24] | LIU G, WEI X M, CHEN R, et al.A novel mutation of the SLC25A13 gene in a Chinese patient with citrin deficiency detected by target next-generation sequencing[J]. Gene, 2014, 533(2): 547–553. DOI:10.1016/j.gene.2013.10.021 |
| [25] | COSART T, BEJA-PEREIRA A, CHEN S Y, et al.Exome-wide DNA capture and next generation sequencing in domestic and wild species[J]. BMC Genomics, 2011, 12: 347. DOI:10.1186/1471-2164-12-347 |
| [26] | LI C H, HOFREITER M, STRAUBE N, et al.Capturing protein-coding genes across highly divergent species[J]. BioTechniques, 2013, 54(6): 321–326. |
| [27] | MANDEL J R, DIKOW R B, FUNK V A, et al.A target enrichment method for gathering phylogenetic information from hundreds of loci: an example from the Compositae[J]. Applications in Plant Sciences, 2014, 2(2): 1300085. DOI:10.3732/apps.1300085 |
| [28] | ENCE D D, CARSTENS B C.SpedeSTEM: a rapid and accurate method for species delimitation[J]. Molecular Ecology Resources, 2011, 11(3): 473–480. DOI:10.1111/men.2011.11.issue-3 |
| [29] | GRUMMER J A, BRYSON Jr R J, REEDER T W.Species delimitation using Bayes factors: simulations and application to the Sceloporus scalaris species group (Squamata: Phrynosomatidae)[J]. Systematic Biology, 2014, 63(2): 119–133. DOI:10.1093/sysbio/syt069 |
| [30] | O’MEARA B C.New heuristic methods for joint species delimitation and species tree inference[J]. Systematic Biology, 2010, 59(1): 59–73. DOI:10.1093/sysbio/syp077 |
| [31] | PONS J, BARRACLOUGH T G, GOMEZ-ZURITA J, et al.Sequence-based species delimitation for the DNA taxonomy of undescribed insects[J]. Systematic Biology, 2006, 55(4): 595–609. DOI:10.1080/10635150600852011 |
| [32] | YANG Z H, RANNALA B.Bayesian species delimitation using multilocus sequence data[J]. Proceedings of the National Academy of Sciences of the United States of America, 2010, 107(20): 9264–9269. DOI:10.1073/pnas.0913022107 |
| [33] | BRYANT D, BOUCKAERT R, FELSENSTEIN J, et al.Inferring species trees directly from biallelic genetic markers: bypassing gene trees in a full coalescent analysis[J]. Molecular Biology and Evolution, 2012, 29(8): 1917–1932. DOI:10.1093/molbev/mss086 |
| [34] | WHITEHEAD P J P. FAO species catalogue: vol. 7. Clupeoid fishes of the world: an annotated and illustrated catalogue of the herrings, sardines, pilchards, sprats, shads, anchovies and wolf-herrings[R]. London, UK: FAO Species Catalogue, 1985: 125-127. |
| [35] | WONGRATANA T. Systematics of clupeoid fishes of the indo-pacific region[M]. London: University of London, 1980. |
| [36] | 袁传宓, 林金榜, 秦安舲, 等.关于我国鲚属鱼类分类的历史和现状兼谈改造旧鱼类分类学的几点体会[J]. 南京大学学报(自然科学版), 1976: 1–12. YUAN C M, LIN J B, QIN A L, et al.On the classification history and status quo of genus Colia in China[J]. Nanjing University (Natural Sciences), 1976: 1–12. |
| [37] | 袁传宓, 秦安黔, 刘仁华, 等.关于长江中下游及东南沿海各省的鲚属鱼类种下分类的探讨[J]. 南京大学学报(自然科学版), 1980: 67–82. YUAN C M, QIN A Q, LIU R H, et al.On the clasification of the anchovies, Coilia, from the lower Yangtze River and the southeast coast of China[J]. Nanjing University (Natural Sciences), 1980: 67–82. |
| [38] | KREYENBERG W, PAPPENHEIM P.Ein beitrag zur kenntnis der fische der jangtze und seiner zuflüsse[J]. Sitzungsberichte der Gesellschaft Naturforschender Freunde zu Berlin, 1908, 19: 95–109. |
| [39] | CHENG Q, ZHANG Q Y, MA C Y, et al.Genetic structure and differentiation of four lake populations of Coilia ectenes (Clupeiformes: Engraulidae) based on mtDNA control region sequences[J]. Biochemical Systematics and Ecology, 2011, 39(4/6): 544–552. |
| [40] | 程万秀, 唐文乔.长江刀鲚不同生态型间的某些形态差异[J]. 动物学杂志, 2011: 33–40. CHENG W X, TANG W Q.Some phenotypic varieties between different ecotypes of Coilia nasus in Yangtze River[J]. Chinese Journal of Zoology, 2011: 33–40. |
| [41] | 唐文乔, 胡雪莲, 杨金权.从线粒体控制区全序列变异看短颌鲚和湖鲚的物种有效性[J]. 生物多样性, 2007, 15(3): 224–231. DOI:10.1360/biodiv.060263 TANG W Q, HU X L, YANG J Q.Species validities of Coilia brachygnathus and C. nasus taihuensis based on sequence variations of complete mtDNA control region[J]. Biodiversity Science, 2007, 15(3): 224–231. DOI:10.1360/biodiv.060263 |
| [42] | JIANG T.Morphometric and microchemical studies on sagittal otoliths of Coilia nasus collected from the Yangtze River and adjacent sea areas[J]. Shanghai: Shanghai Ocean University, 2011. |
| [43] | 徐钢春, 顾若波, 张呈祥, 等.刀鲚两种生态类群“江刀”和“海刀”鱼肉营养组成的比较及品质的评价[J]. 海洋渔业, 2009, 31(4): 401–409. XU G C, GU R B, ZHANG C X, et al.Comparison and evaluation of nutrient composition of two ecological groups of Japanese grenadier anchovy-river-anchovy and sea-anchovy[J]. Marine Fisheries, 2009, 31(4): 401–409. |
| [44] | 张呈祥, 徐钢春, 顾若波, 等.2种生态类群刀鲚(江刀和海刀)肌肉游离氨基酸的差异[J]. 长江大学学报(自科版), 2010, 7(2): 32–35. ZHANG C X, XU G C, GU R B, et al.Comparative study on free amino acid composition and content between two ecological groups of Japanese grenadier anchovy, Coilia nasus (river-anchovy and sea-anchovy)[J]. Journal of Yangtze University (Natural Science Edition), 2010, 7(2): 32–35. |
| [45] | FALUSH D, STEPHENS M, PRITCHARD J K.Inference of population structure using multilocus genotype data: dominant markers and null alleles[J]. Molecular Ecology Notes, 2007, 7(4): 574–578. DOI:10.1111/j.1471-8286.2007.01758.x |
| [46] | MARTIN M.Cutadapt removes adapter sequences from high-throughput sequencing reads[J]. EMBnet Journal, 2011, 17: 10–12. |
| [47] | SIMPSON J T, WONG K, JACKMAN S D, et al.ABySS: a parallel assembler for short read sequence data[J]. Genome Research, 2009, 19(6): 1117–1123. DOI:10.1101/gr.089532.108 |
| [48] | LI H, DURBIN R.Fast and accurate short read alignment with burrows-wheeler transform[J]. Bioinformatics, 2009, 25(14): 1754–1760. DOI:10.1093/bioinformatics/btp324 |
| [49] | MCKENNA A, HANNA M, BANKS E, et al.The genome analysis toolkit: a MapReduce framework for analyzing next-generation DNA sequencing data[J]. Genome Research, 2010, 20(9): 1297–1303. DOI:10.1101/gr.107524.110 |
| [50] | DEPRISTO M A, BANKS E, POPLIN R, et al.A framework for variation discovery and genotyping using next-generation DNA sequencing data[J]. Nature Genetics, 2011, 43(5): 491–498. DOI:10.1038/ng.806 |
| [51] | VAN DER AUWERA G A, CARNEIRO M O, HARTL C, et al.From FastQ data to high confidence variant calls: the genome analysis toolkit best practices pipeline[J]. Current Protocols in Bioinformatics, 2013, 43: 10–13. |
| [52] | BOUCKAERT R, HELED J, KVHNERT D, et al.BEAST 2: a software platform for Bayesian evolutionary analysis[J]. PLoS Computational Biology, 2014, 10(4): e1003537. DOI:10.1371/journal.pcbi.1003537 |
| [53] | PRITCHARD J K, STEPHENS M, DONNELLY P.Inference of population structure using multilocus genotype data[J]. Genetics, 2000, 155(2): 945–959. |
| [54] | EARL D A, VONHOLDT B.STRUCTURE HARVESTER: a website and program for visualizing STRUCTURE output and implementing the Evanno method[J]. Conservation Genetics Resources, 2012, 4(2): 359–361. DOI:10.1007/s12686-011-9548-7 |
| [55] | EVANNO G, REGNAUT S, GOUDET J.Detecting the number of clusters of individuals using the software STRUCTURE: a simulation study[J]. Molecular Ecology, 2005, 14(8): 2611–2620. DOI:10.1111/mec.2005.14.issue-8 |
| [56] | RAFTERY A E. Hypothesis testing and model selection[M]//GILKS W R, RICHARDSON S, SPIEGELHALTER D. Markov Chain Monte Carlo in Practice. London: Chapman and Hall, 1996: 163-188. |
| [57] | CARSTENS B C, PELLETIER T A, REID N M, et al.How to fail at species delimitation[J]. Molecular Ecology, 2013, 22(17): 4369–4383. DOI:10.1111/mec.12413 |
| [58] | SATLER J D, CARSTENS B C, HEDIN M.Multilocus species delimitation in a complex of morphologically conserved trapdoor spiders (Mygalomorphae, Antrodiaetidae, Aliatypus)[J]. Systematic Biology, 2013, 62(6): 805–823. DOI:10.1093/sysbio/syt041 |
 2017,
Vol. 26


