扩展功能
文章信息
- 沈梦伟, 毕孟杰, 敬琴, 陈文德, 陈圣宾
- SHEN Mengwei, BI Mengjie, JING Qin, CHEN Wende, CHEN Shengbin
- 中国两栖动物物种丰富度省级地理分布格局及其与气候因子的关系
- Relationships between Geographic Amphibian Species Richness Provincial Pattern and Environmental Factors in China
- 四川动物, 2016, 35(1): 9-16
- Sichuan Journal of Zoology, 2016, 35(1): 9-16
- 10.11984/j.issn.1000-7083.20150239
-
文章历史
- 收稿日期: 2015-07-23
- 接受日期: 2015-10-29
2. 成都理工大学地球科学学院, 成都 610059;
3. 环境保护部南京环境科学研究所, 南京 210042
2. College of Earth Sciences, Chengdu University of Technology, Chengdu 610059, China;
3. Nanjing Institute of Environmental Sciences, Ministry of Environmental Protection, Nanjing 210042, China
物种丰富度的大尺度地理格局是宏生态学和生物地理学的中心议题之一,也是全球及区域物种多样性保护的重要参考和依据(Brown & Lomolino,2000;Gaston,2000)。物种丰富度在地理尺度上的变化及其与生物和非生物因素的关系,是理解物种地理分布和预测气候变化对生物多样性影响的重要基础(Chown & Gaston,2010;Comont et al.,2012)。
一定时空内物种的组成及数量受生物进化、地质历史、生态过程和当前环境的共同制约,其中环境因素如何影响物种丰富度的地理格局一直是研究的热点。以往关于物种丰富度大尺度地理格局的研究涉及各主要生物类群,包括植物(Currie & Paquin,1987;Francis & Currie,2003;Chen et al.,2011)、无脊椎动物(White & Kerr,2006;Chen et al .,2014)、鱼类(Zhao et al.,2006)、两栖类(Qian,2007;Hu et al.,2012)、爬行类(Qian et al.,2007)、鸟类(Ding et al.,2006;Orme et al.,2006)、哺乳类(Tognelli & Kelt,2004;Tognelli,2005)等,并且围绕地理格局的成因提出了多个假说,包括面积假说(Rahbek & Graves,2000;Sanders et al.,2007)、能量假说(Wright,1983)、气候稳定性假说(Klopfer,1959)、生境异质性假说(Kerr & Packer,1997)、历史假说(Latham & Ricklefs,1993;Qian & Ricklefs,2000)等。这些假说是基于不同的影响因子,来探讨大尺度上物种丰富度分布格局形成的机制。虽然各个假说在不同生物类群上进行了验证,但是对于形成物种丰富度大尺度格局的主导因子,目前仍存在广泛争议(Rosenzweig,2001)。
基于环境因子的能量假说、气候稳定性假说和生境异质性假说经常被认为是制约物种丰富度地理格局的主导因子,并受到更多的关注(Rosenzweig,2001;王志恒等,2009)。能量假说认为,物种丰富度主要受能量控制,能量越高则物种丰富度越高(Evans et al.,2005)。根据能量的不同形式,能量假说包括环境能量假说、生态学代谢假说、生产力假说、水分-能量动态假说以及寒冷忍耐假说(王志恒等,2009;陈胜东等,2011)。气候稳定性假说认为,稳定的气候环境能促进物种的特化,并使其生态位区域狭窄,因此环境能容纳更多的物种;相反在波动的气候环境下,物种需要更广泛的生理机能才能生存下来,因此物种丰富度较低(Stevens,1989)。生境异质性假说认为,生境异质性高的地区能够提供更多的生态位,也更有利于物种共存,因此物种丰富度也随之增加(Kerr & Packer,1997;Büchi et al.,2009)。
两栖动物起源于距今3.5亿年前的总鳍鱼类,隶属脊索动物门Chordata脊椎动物亚门Vertebrata两栖纲Amphibia。现存两栖动物分为蚓螈目Gymnophiona、有尾目Caudata和无尾目Anura。全球共有两栖动物约73科7426种(Amphibian species of the world,2015)。根据《中国两栖动物彩色图鉴》,记录我国两栖动物共370种(亚种),隶属11科64属(费梁等,2010)。由于两栖动物同时可以在水中和陆地生活,这种特殊的生物学和生态学特征使其经常成为生态监测的重要类群(Stuart et al.,2004),因而对于研究环境污染和气候变化有重要作用。并且研究大尺度两栖动物物种丰富度的格局及其气候制约因素对于生物多样性的保护和生态系统管理具有重要意义。
本文在省级尺度上探讨中国两栖动物物种丰富度的地理格局及其与气候因子,特别是温度(热量)的关系。由于两栖动物属于冷血动物,其生命活动所需的能量大部分来源于外部环境,因此,我们由此提出第1个假设:相比年水分因子,热量因子对两栖动物物种丰富度的空间分异影响更大;根据寒冷忍耐假说,物种难以在寒冷的冬季生存,因此,提出第2个假设:相比年均温,最冷月均温对物种分布的影响更大;根据气候稳定性假说,本文提出第3个假设,相比温度和水分因子,季节性因子同样对两栖动物的地理分布有重要影响。
1 材料与方法 1.1 研究概况本研究区域范围包括中国34个省、自治区、直辖市以及香港和澳门2个特别行政区。由于海陆热力性质差异显著,除青藏高原和西北内陆地区之外,中国大部分地区受来自太平洋的东南季风和来自印度洋的西南季风影响(冯建孟,徐成东,2009)。中国南北气候差异主要表现在温度方面,而水分差异在东西方向更为明显。从南到北,中国的地带性植被带依次为热带雨林季雨林带、亚热带常绿阔叶林带、暖温带落叶阔叶林带、温带针阔混交林带和寒温带针叶林带;从东向西,植被带依次为森林、森林草原植被带、草原植被带和荒漠半荒漠植被带(方精云,2001)。
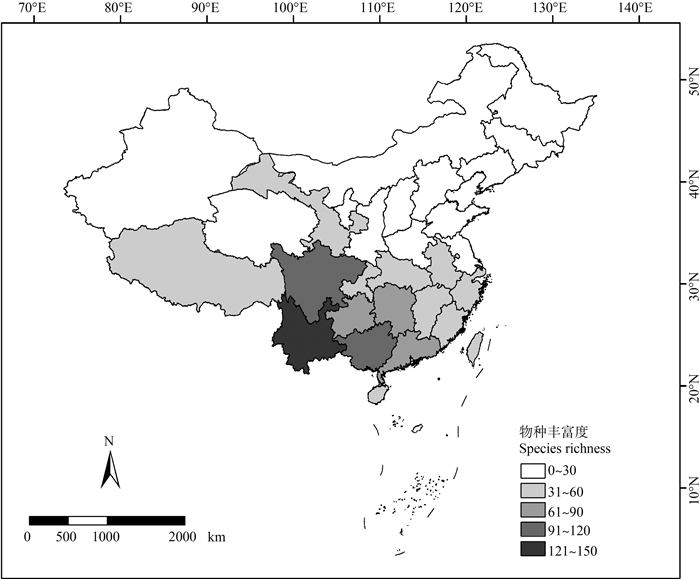
1.2 数据来源本文以费梁等(2010)编写的《中国两栖动物彩色图鉴》为蓝本,对照《中国两栖动物志》、中国动物数据库和近年来发表的相关文献。总共录入3目11科64属394种两栖动物,包括亚种。以“1”或“0”记录某种两栖动物在某省份的分布与否,建立物种分布数据库,进而计算各省物种丰富度。由于部分直辖市和特别行政区面积较小,将北京市和天津市并入河北省;将上海市并入浙江省; 将香港和澳门特别行政区并入广东省(图 1)。不同区域研究人员的数量和科研水平可能影响对两栖动物丰富度的估计,但由于相关数据的限制,本研究并未对此进行评估。

|
|
图 1 中国省级行政区尺度两栖动物物种丰富度
Fig. 1 The geographic pattern of amphibian species richness at provincial scale in China 注: 北京市和天津市并入河北省, 将上海市并入浙江省, 重庆市并入四川省, 香港和澳门特别行政区并入广东省。 Notes: Hebei province was merged with Beijing and Tianjin, Zhejiang province was merged with Shanghai, Sichuan province was merged with Chongqing, and Guangdong province was merged with Hong Kong and Macau. |
本研究共采集了代表热量、降水和季节性的12个气候因子(表 1):热量因子(energy availability)包括年均温(mean annual temperature,TEM)、最冷月均温(mean temperature of the coldest month,TEMmin)、最暖月均温(mean temperature of the warmest month,TEMmax)和净初级生产力(net primary productivity,NPP);水分因子(water availability)包括年均降水量(annual precipitation,PREC)、夏季降水量(annual precipitation in summer,PRECsum)、水分亏缺指数(water deficit,WD;即潜在蒸散量与实际蒸散量的差值)和湿润指数(moisture index,MI;即蒸散量/实际蒸散量);季节性因子(seasonality)包括年温度变化范围(annual temperature range,TEMvar;即TEMmax和TEMmin的差值)、月均温标准差(the st and ard deviation of mean monthly temperature,TEMsd)、年降水量变化范围(annual precipitation range,PRECvar,即最大和最小月均降水量的差值)、月均降水量标准差(the st and ard deviation of mean monthly precipitation,PRECsd)。NPP数据来源于http://atlas.sage.wisc.edu/,其他气候数据来源于WorldClim(http://www.worldclim.org),利用Arcgis 9.3将中国矢量地图切割成3844个0.5°像元,提取每个像元中心点的经纬度,运用DIVA-GIS软件,获取每个中心点的气候数据。各省内各像元气候因子的均值代表其平均气候条件。
| 影响因子 Influence factor | 气候因子Variable | 解释量 Explained by R2 | P值 P value |
| 热量因子 Energy availability | 年均温TEM | 0.365(+) | *** |
| 最冷月均温TEMmin | 0.522(+) | *** | |
| 最暖月均温TEMmax | 0.068(+) | ns | |
| 净初级生产力NPP | 0.639(+) | *** | |
| 水分因子 Water availability | 年均降水量PREC | 0.487(+) | *** |
| 夏季降水量PRECsum | 0.474(+) | *** | |
| 水分亏缺指数WD | 0.334(-) | ** | |
| 湿润指数MI | 0.409(+) | *** | |
| 季节性因子 Seasonality | 年温度变化范围TEMvar | 0.564(-) | *** |
| 月均温标准差TEMsd | 0.557(-) | *** | |
| 年降水量变化范围PRECvar | 0.343(+) | *** | |
| 月均降水量标准差PRECsd | 0.420(+) | *** | |
| 注: +. 正相关, -. 负相关, *P<0.05, **P<0.01, ***P<0.001, ns P>0.05; 下表同。 Notes: +. positive, -. negative, *P<0.05, **P<0.01, ***P<0.001, ns P>0.05; the same below. | |||
为了降低空间自相关,本文采用Moran’s I检验数据在不同空间距离上的空间自相关。取值范围在-1到1之间,正值表示正相关,负值表示负相关,0则表示空间格局是随机的。
本文首先采用基于普通最小二乘法(ordinary least squares,OLS)的一元线性回归模型考察各气候因子对两栖动物丰富度的解释能力。然后根据Akaike信息量准则(Akaike information criterion,AIC)筛选出最优模型(AIC值最小的1个因子)及其所包含的变量(Legendre & Legendre,1998)。
为了解决自变量共线的问题,本文采用了方差分解(variation partitioning)(Borcard et al.,1992)和多层次方差分解(hierarchical partitioning)(Mac Nally,2000)。这2种方法不能给出拟合预测的方程式,但能够帮助理解可能的因果关系和各自变量的解释能力。运用方差分解和多层次方差分解
把全部能够解释的方差分解成各个因子共同作用部分和独立作用部分,独立作用部分的大小表明某一个(类)因子的相对重要性(Mac Nally,2000)。
为了满足数据的正态性,将各省物种数进行对数转换。以上统计在SAM(spatial analysis in macroecology)和R(R Development Core Team,2013)中完成。
2 结果 2.1 物种丰富度与经纬度的关系本文共统计3目11科64属394种两栖动物,包括亚种。其中物种最多的目为无尾目,有326种,占总物种的82.7%,其次为有尾目67种,占17%,而蚓螈目仅1种,占0.3%;物种最多的科为蛙科Ranidae,有131种,占总物种的33.2%,其次为角蟾科Megophryidae 85种,占21.6%和树蛙科Rhacophoridaae 55种,占14%;物种最多的属为角蟾属Megophrys,有31种,占总物种的7.9%,其次为树蛙属Rhacophorus 26种(6.6%)和臭蛙属Odorrana 25种(6.3%)。
由图 1可知,物种丰富度热点主要集中在南方,而北方、西北干旱区和青藏高原的北部(青海)等省物种丰富度较低(图 1)。物种丰富度最高的为云南省,有131种,其次为四川、广西、贵州、湖南,物种数均在70种以上。物种丰富度最低的为宁夏,仅有6种,其次为新疆、青海、内蒙古,其物种数均低于10种。两栖动物物种丰富度没有明显的经度梯度(图 2:a)(R2=0.0085,P>0.05),而在纬度梯度上空间变异明显,即随纬度增加,物种丰富度显著降低(图 2:b)(R2=0.6286,P<0.001)。

|
| 图 2 中国省级行政区尺度两栖动物物种丰富度与经度(a)和纬度(b)的关系 Fig. 2 The relationships between amphibian species richness and longitude (a) and latitude (b) at provincial scale in China |
简单线性回归表明,物种丰富度除了与WD、TEMvar和TEMsd呈负相关,与其余气候因子均呈正相关(表 1)。在热量因子中,NPP(R2=0.639,P<0.001)对物种丰富度的影响最大,这也是所有因子中对物种丰富度影响最大的一个,其次为TEMmin(R2=0.522,P<0.01)和TEM(R2=0.365,P<0.05)。
在水分因素中,PREC对物种丰富度的影响最大(R2=0.487,P<0.001),其次为MI(R2=0.409,P<0.05)和PRECsum(R2=0.474,P<0.001)。在季节性因子中,TEMvar(R2=0.564,P<0.001)对物种丰富度的影响最大,其次为TEMsd(R2=0.557,P<0.001)和PRECsd(R2=0.420,P<0.001)。
根据AIC共筛选出4095种模型,其中最优模型由TEM、TEMmin、NPP、PRECvar和PRECsd这5项组成,AIC值为0.795,能够解释丰富度空间变异的77.7%(表 2)。将最优模型中因子进行多层次方差分解(图 3),结果表明,NPP的独立解释能力和总解释能力最强,分别能够解释模型方差的26.3%和63.9%;其次为TEMmin、PRECsd、TEM和PRECvar,分别能够解释方差的17.6%和52.2%、12.3%和42.0%、11.5%和36.5%以及10.0%和34.3%。 模型的残差没有明显的空间属性,这可以通过Moran’s I在不同距离上的显著性和残差与经纬度间的关系 看出(图 4)。丰富度Moran’s I指数在较短的距离
| 气候因子 Variable | 标准系数 Std. coeff | 标准误 Std. error | t值 t value | 解释量R2 Explained by R2 | P值 P value |
| 年均温TEM | -0.887 | -0.022 | -2.207 | 0.365 | * |
| 最冷月均温TEMmin | 0.908 | 0.014 | 2.354 | 0.589 | ** |
| 净初级生产力NPP | 0.794 | 0.277 | 3.571 | 0.766 | *** |
| 年降水量变化范围PRECvar | -0.793 | 0.004 | -1.022 | 0.768 | ns |
| 月均降水量标准差PRECsd | 0.75 | 0.013 | 0.935 | 0.777 | ns |

|
| 图 3 两栖动物物种丰富度主要影响因子的独立作用部分、交互作用部分 Fig. 3 Independent interpretation and joint interpretation of the main factors of amphibian species richness |

|
| 图 4 不同空间距离上物种丰富度(实线)和模型残差(虚线)的Moran’s I Fig. 4 Moran’s I of species richness (solid line) and model residuals (imaginary line) at different distance classes |
上呈正相关,在较长的距离上呈负相关;模型残差Moran’s I指数在较短的距离上呈负相关,之后又呈正相关,而在较长的距离上呈负相关并趋近于0,这表明所构建的模型能够很好地解释中国两栖动物物种丰富度格局,模型的残差主要是一些随机变化和取样误差。
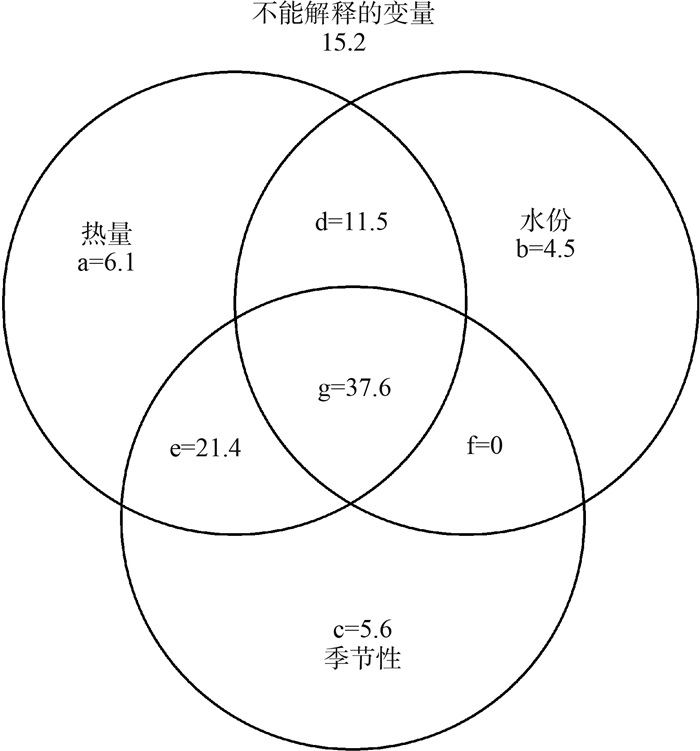
方差分解结果显示,热量因子中,TEM、TEMmin、TEMmax和NPP这4项能够解释全部方差的76.6%;水分因素中,PREC、PRECsum、WD和MI这4项能够解释全部方差的51.7%;季节性因子中,TEMvar、TEMsd、PRECvar和PRECsd这4项能够解释全部方差的62.7%。热量因子与季节性因子的交互作用最大为59.0%,其次是热量因子与水分因子之间的交互作用为49.1%,而水分因子和季节性因子之间的交互作用为37.6%。三者之间的交互作用为37.6%。热量因子的独立作用最大,为6.1%,其次为季节性因子,为5.6%,水分因子的独立解释作用仅为4.5%(图 5)。

|
|
图 5 影响两栖动物物种丰富度的各因子方差分解结果图示
Fig. 5 Results of variation partitioning for amphibian species richness in terms of the proportion of variation explained (%) a、b和c为热量、水分和季节性因子的独立解释作用;d、e、f和g表示它们之间的交互作用。 Variation of amphibian richness explained by three sets of variables: energy, water, and seasonality, and the unexplained variation; a, b, and c are unique effects of energy, water, and seasonality, respectively; while d, e, f and g indicates their joint effects. |
最优模型和方差分解的结果均表明,相比于水分,热量因子对两栖动物丰富度分布格局的影响更大,这一点也与前人的研究结果类似(Allen et al.,2002;Hawkins et al.,2003;冯建孟,徐成东,2009),同时也验证了本文的第1个假设。最优模型共包含5个变量,其中有3 个与热量相关的因子,并且这3个
因子能够解释物种丰富度分布格局的76.6%。从方差分解的结果来看,热量因子的总解释率和独立解释率分别为76.6%和6.1%,高于水分因子的51.7%和4.5%。热量影响着动物的各个方面,如体型、行为和进化进程等。两栖类动物在温度较高的地区可以拥有更多的时间觅食、繁殖,更快的生长速度和更高的存活率(Gotthardt et al.,2000;Chown & Gaston,2010)。Allen(2002)认为,植物物种分布格局主要受水分和热量共同作用的影响,而动物主要受热量的影响,水分的作用相对小一些。在动物之中,恒温动物的体温不随外界温度的变化而变化,因此,其丰富度分布格局受到生产力的影响。变温动物体温受外界环境的影响较大,因此,在温度较高的区域,其新陈代谢更快,进而缩短世代时间,最终提高物种形成的速率和物种多样性。
简单线性回归表明TEMmin(R2=0.522,P<0.001)的解释能力高于TEM(R2=0.365,P<0.001)。并且多层次方差结果显示,TEMmin的独立解释作用为17.6%,总解释作用为52.2%,而TEM的独立解释为11.5%,总解释作用为36.5%。与TEM相比,TEMmin对 两栖动物物种丰富度分布格局的影响更大。寒冷忍耐假说认为,很多物种由于不能忍受冬季的低温而无法生存。因此,随着冬季温度的降低,物种多样性也随之减少(Hawkins et al.,2003),这里的冬季温度通常是指最冷月平均温度,一些生态学家也将这一假说称为“低温限制假说”,许多研究结果也证明了这一假说。如Sakai和Weiser(1973)研究发现,北美洲部分树木的分布区主要受冬季低温的控制;Fang和Yoda(1991)指出中国的常绿阔叶林不能分布到平均极端最低温低于-3 ℃到-2 ℃的地区。另一种说法是,绝大部分物种的祖先是从热带地区或是一些湿热地区进化而来的,它们并不具备抵御寒冷的机制,因此,大部分物种分布受到低温的控制(Ricklefs,2007)。TEMmin的解释能力要大于TEM,这可能与研究区空间面较大,气候空间分异强烈,而TEM只能反映研究单元内总体的气候状况,包含的信息量较少,不能全面反映研究单元内气候的空间分异和季节性分析有关(冯建孟,2008)。
最优模型由TEM、TEMmin、NPP、PRECvar和PRECsd这5项组成,其中PRECvar和PRECsd为季节性因素。 多层次方差分解表明,PRECvar的独立解释能力和总解释能力分别为10.0%和34.3%,PRECsd的独立解释能力和总解释能力分别为12.3%和42.0%,略高于TEM的解释能力。方差分解结果表明,季节性因子的总解释能力(62.7%)略低于热量因子(76.6%),但高于水分因子(51.7%)。同样,其独立解释作用(5.6%)也低于热量因子(6.1%),但高于水分因子(4.5%)。以上都说明季节性因子对于我国两栖动物分布格局有着重要的影响,也验证了本文的第3个假设。季节性因子一定程度上代表了气候的稳定性。气候稳定性假说认为,稳定的气候环境能促进物种的特化,并使生态位区域狭窄,因此能容纳更多的物种;相反在波动的气候环境下,物种需要更广泛的生理机能才能生存下来,因此物种丰富度较低(Stevens,1989)。根据Rapport法则,温度和降水年较差和波动性由南向北有逐渐增大的趋势,这也说明了为什么我国南方地区物种丰富度相比北方地区要高(冯建孟,2008)。然而,季节性因子能否作为一个重要的预测因子,目前仍存在广泛的争论。对哺乳动物和鸟类的研究发现,季节性因子对其分布有着重要的影响(Andrews & O’Brien,2000;Badgley & Fox,2000;Tello & Stevens,2010),而在昆虫类群却得到了相反的结论(Kerr & Packer,1999;Schuldt & Assmann,2009),这可能由于研究的类群不同造成的,如冷血动物和恒温动物,或者由于它们的取样粒度不同造成的。
| 陈胜东, 徐海根, 曹铭昌, 等. 2011. 物种丰富度格局研究进展[J]. 生态与农村环境学报, 27(3): 1-9. |
| 方精云. 2001. 也论我国东部植被带的划分[J]. 植物学报, 43(5): 522-533. |
| 费梁, 叶昌媛, 江建平. 2010. 中国两栖动物彩色图鉴[M]. 成都: 四川科学技术出版社. |
| 冯建孟, 徐成东. 2009. 中国种子植物物种丰富度的大尺度分布格局及其与地理因子的关系[J]. 生态环境学报, 18(1): 249-254. |
| 冯建孟. 2008. 中国种子植物物种多样性的大尺度分布格局及其气候解释[J]. 生物多样性, 16(5): 470-476. |
| 王志恒, 唐志尧, 方精云. 2009. 物种多样性地理格局的能量假说[J]. 生物多样性, 17(6): 613-624. |
| Allen AP, Brown JH, Gillooly JF. 2002. Global biodiversity, biochemical kinetics, and the energetic-equivalence rule[J]. Science, 297(5586): 1545-1548. |
| Andrews P, O'Brien EM. 2000. Climate, vegetation, and predictable gradients in mammal species richness in southern Africa[J]. Journal of Zoology, 251(2): 205-231. |
| Badgley C, Fox DL. 2000. Ecological biogeography of North American mammals: species density and ecological structure in relation to environmental gradients[J]. Journal of Biogeography, 27(6): 1437-1467. |
| Borcard D, Legendre P, Drapeau P. 1992. Partialling out the spatial component of ecological variation[J]. Ecology, 73(3): 1045-1055. |
| Brown JH, Lomolino MV. 2000. Concluding remarks: historical perspective and the future of island biogeography theory[J]. Global Ecology and Biogeography, 9(1): 87-92. |
| Büchi L, Christin P, Hirzel AH. 2009. The influence of environmental spatial structure on the life-history traits and diversity of species in a metacommunity[J]. Ecological Modelling, 220(21): 2857-2864. |
| Chen S, Mao L, Zhang J, et al. 2014. Environmental determinants of geographic butterfly richness pattern in eastern China[J]. Biodiversity and Conservation, 23(6): 1453-1467. |
| Chen SB, Jiang GM, OuYang ZY, et al. 2011. Relative importance of water, energy, and heterogeneity in determining regional pteridophyte and seed plant richness in China[J]. Journal of Systematics and Evolution, 49(2): 95-107. |
| Chown SL, Gaston KJ. 2010. Body size variation in insects: a macroecological perspective[J]. Biological Reviews, 85(1): 139-169. |
| Comont RF, Roy HE, Lewis OT, et al. 2012. Using biological traits to explain ladybird distribution patterns[J]. Journal of Biogeography, 39(10): 1772-1781. |
| Currie DJ, Paquin V. 1987. Large-scale biogeographical patterns of species richness of trees[J]. Nature, 329(6137): 326-327. |
| Ding TS, Yuan HW, Geng S, et al. 2006. Macro-scale bird species richness patterns of the East Asian mainland and islands: energy, area and isolation[J]. Journal of Biogeography, 33(4): 683-693. |
| Evans KL, Greenwood JJ, Gaston KJ. 2005. Dissecting the species-energy relationship[J]. Proceedings of the Royal Society of London B: Biological Sciences, 272(1577): 2155-2163. |
| Fang J, Yoda K. 1991. Climate and vegetation in China V. Effect of climatic factors on the upper limit of distribution of evergreen broadleaf forest[J]. Ecological Research, 6(1): 113-125. |
| Francis AP, Currie DJ. 2003. A globally consistent richness-climate relationship for angiosperms[J]. The American Naturalist, 161(4): 523-536. |
| Gaston KJ. 2000. Global patterns in biodiversity[J]. Nature, 405(6783): 220-227. |
| Gotthardt M, Trommsdorff M, Nevitt MF, et al. 2000. Interactions of the low density lipoprotein receptor gene family with cytosolic adaptor and scaffold proteins suggest diverse biological functions in cellular communication and signal transduction[J]. Journal of Biological Chemistry, 275(33): 25616-25624. |
| Hawkins BA, Field R, Cornell HV, et al. 2003. Energy, water, and broad-scale geographic patterns of species richness[J]. Ecology, 84(12): 3105-3117. |
| Hu JH, Li C, Xie F, et al. 2012. Endemic amphibians and their distribution in China[J]. Asian Herpetological Research, 3(2): 163-171. |
| Kerr JT, Packer L. 1997. Habitat heterogeneity as a determinant of mammal species richness in high-energy regions[J]. Nature, 385(6613): 252-254. |
| Kerr JT, Packer L. 1999. The environmental basis of North American species richness patterns among Epicauta (Coleoptera: Meloidae)[J]. Biodiversity & Conservation, 8(5): 617-628. |
| Klopfer PH. 1959. Environmental determinants of faunal diversity[J]. American Naturalist, 93(837): 337-342. |
| Latham RE, Ricklefs RE. 1993. Global patterns of tree species richness in moist forests: energy-diversity theory does not account for variation in species richness[J]. Oikos, 67(2): 325-333. |
| Legendre P, Legendre L. 1998. Numerical ecology 2nd edition[M]. Amsterdam, NL: Elsevier Science. |
| Mac Nally R. 2000. Regression and model-building in conservation biology, biogeography and ecology: the distinction between- and reconciliation of- 'predictive'and 'explanatory'models[J]. Biodiversity & Conservation, 9(5): 655-671. |
| Orme CDL, Davies RG, Olson VA, et al. 2006. Global patterns of geographic range size in birds[J]. PLoS Biology, 4(7): e208. |
| Qian H, Ricklefs RE. 2000. Large-scale processes and the Asian bias in species diversity of temperate plants[J]. Nature, 407(6801): 180-182. |
| Qian H, Wang X, Wang S, et al. 2007. Environmental determinants of amphibian and reptile species richness in China[J]. Ecography, 30(4): 471-482. |
| Qian H. 2007. Relationships between plant and animal species richness at a regional scale in China[J]. Conservation Biology, 21(4): 937-944. |
| Rahbek C, Graves GR. 2000. Detection of macro-ecological patterns in south American hummingbirds is affected by spatial scale[J]. Proceedings of the Royal Society of London B: Biological Sciences, 267(1459): 2259-2265. |
| Ricklefs RE. 2007. History and diversity: explorations at the intersection of ecology and evolution[J]. The American Naturalist, 170(S2): S56-S70. |
| Rosenzweig ML. 2001. The four questions: what does the introduction of exotic species do to diversity?[J]. Evolutionary Ecology Research, 3(3): 361-367. |
| Sakai A, Weiser CJ. 1973. Freezing resistance of trees in North America with reference to tree regions[J]. Ecology, 54(1): 118-126. |
| Sanders NJ, Lessard JP, Fitzpatrick MC, et al. 2007. Temperature, but not productivity or geometry, predicts elevational diversity gradients in ants across spatial grains[J]. Global Ecology and Biogeography, 16(5): 640-649. |
| Schuldt A, Assmann T. 2009. Environmental and historical effects on richness and endemism patterns of carabid beetles in the western Palaearctic[J]. Ecography, 32(5): 705-714. |
| Stevens GC. 1989. The latitudinal gradient in geographical range: how so many species coexist in the tropics[J]. American Naturalist, 133(2): 240-256. |
| Stuart SN, Chanson JS, Cox NA, et al. 2004. Status and trends of amphibian declines and extinctions worldwide[J]. Science, 306(5702): 1783-1786. |
| Tello JS, Stevens RD. 2010. Multiple environmental determinants of regional species richness and effects of geographic range size[J]. Ecography, 33(4): 796-808. |
| Tognelli MF, Kelt DA. 2004. Analysis of determinants of mammalian species richness in south America using spatial autoregressive models[J]. Ecography, 27(4): 427-436. |
| Tognelli MF. 2005. Assessing the utility of indicator groups for the conservation of south American terrestrial mammals[J]. Biological Conservation, 121(3): 409-417. |
| White P, Kerr JT. 2006. Contrasting spatial and temporal global change impacts on butterfly species richness during the 20th century[J]. Ecography, 29(6): 908-918. |
| Wright DH. 1983. Species-energy theory: an extension of species-area theory[J]. Oikos, 17(3): 496-506. |
| Zhao S, Fang J, Peng C, et al. 2006. Patterns of fish species richness in China's lakes[J]. Global Ecology and Biogeography, 15(4): 386-394. |
 2016, Vol. 35


