The Chinese Meteorological Society
Article Information
- WANG, Lu, Tianjun ZHOU, Jian LI, et al., 2019.
- Convectively Coupled Equatorial Waves Simulated by CAMS-CSM. 2019.
- J. Meteor. Res., 33(5): 949-959
- http://dx.doi.org/10.1007/s13351-019-9021-1
Article History
- Received February 14, 2019
- in final form May 17, 2019
2. State Key Laboratory of Numerical Modeling for Atmospheric Sciences and Geophysical Fluid Dynamics, Institute of Atmospheric Physics, Chinese Academy of Sciences, Beijing 100029;
3. State Key Laboratory of Severe Weather, Chinese Academy of Meteorological Sciences, China Meteorological Administration, Beijing 100081
Convectively coupled equatorial waves (CCEWs) have been considered as essential modes of convection variabilities in the tropics, as they could account for a considerable fraction of rainfall, humidity, and cloudiness variabilities (Roundy and Frank, 2004). The well-known CCEWs include Kelvin wave, equatorial Rossby (ER) wave, mixed Rossby–gravity (MRG) wave, tropical depression-type (TD-type) wave, and eastward and westward inertia gravity (WIG) waves. They could influence the Madden–Julian oscillation (MJO) (Roundy et al., 2009), the genesis of tropical cyclones (Ventrice et al., 2012a, b), monsoons (Straub et al., 2006; Janicot et al., 2010; DeMott et al., 2011), and midlatitude weather through inducing teleconnections (Kawamura et al., 1996).
A large number of researchers have been devoted to documenting the observational characteristics of CCEWs, consisting of their structures, dispersion relationship, and propagation features (Wheeler et al., 2000; Kiladis et al., 2009). The horizontal patterns of observed CCEWs are shown to be largely consistent with the solutions of shallow water model developed by Matsuno (1966), but their phase propagation is generally much slower than the theoretical solutions.
In addition to the synoptic-scale properties, the climatological features of CCEWs are also focused on by observational studies. Distinct climatological spatial distributions and seasonal variations are found in different modes of CCEWs (Yang et al., 2007; Huang and Huang, 2011). For instance, MRG wave reaches its maximum in boreal summer, while WIG wave reaches its maximum in boreal winter. ER wave reaches its maximum over the Northern (Southern) Hemisphere in boreal summer (winter). The strength of Kelvin wave is roughly constant during various seasons. Seasonal variations of environmental status are considered to be crucial in the seasonal cycle of CCEWs (Wang and Chen, 2016, 2017). CCEWs also exhibit marked interannual variations. It is found that there is good correlation relationship between the interannual variation of CCEWs over the central and eastern Pacific and the local convection and sea surface temperature (SST), while there is no significant relationship over other regions (Huang and Huang, 2011).
The simulation of CCEWs has been considered as an important metric for assessing a model’s performance (Huang et al., 2013). Unfortunately, the current state-of-the-art climate models have limited capability in reproducing the realistic CCEWs. For instance, Lin et al. (2006) analyzed the space–time spectra and zonal variance distribution of CCEWs in 14 coupled general circulation models (GCMs) from the Coupled Model Intercomparison Project phase 3 (CMIP3). The results showed that only half of the 14 coupled GCMs have prominent signals of CCEWs, while their intensities are much weaker compared to the observation. For the simulations in Coupled Model Intercomparison Project phase 5 (CMIP5),Huang et al. (2013) found that most of them underestimated the amplitudes of CCEWs compared to the observation. Wang and Li (2017) provided a detailed evaluation of one mode of CCEWs, i.e., Kelvin wave, in CMIP5 coupled GCMs and showed a common bias that nearly all of the simulations overestimated the Kelvin wave activity over the southern Pacific Ocean. It has been suggested that the simulation biases are primarily due to the convective parameterization scheme, but there is no consensus on the specific physical process. Thus, it is still one of the great challenges for GCMs to simulate CCEWs.
Recently, a new coupled climate system model (CSM) has been developed at the Chinese Academy of Meteorological Sciences (CAMS), which is known as CAMS-CSM, by employing several state-of-the-art component models. The model is aimed to participate in the upcoming Coupled Model Intercomparison Project phase 6 (CMIP6). Preliminary evaluation studies have demonstrated that this model is able to capture the climatological features of major climate systems and the major climate variability modes reasonably, such as the MJO and El Ni
The rest of the paper is organized as follows. The data and analysis methods are described in Section 2. The assessment results and analysis of prominent discrepancies are shown in Section 3. The concluding remarks are given in Section 4.
2 Data and analysis methodsThe CAMS-CSM consists of several best component models in the world. The atmospheric component model was originally developed by the Max Planck Institute for Meteorology, known as ECHAM5 (v5.4) (Rayner et al., 2003), but has been modified in CAMS-CSM in the advection scheme and radiation transfer parameterization. The cumulus convective scheme is developed by Tiedtke (1989) and Nordeng (1994). It has a horizontal resolution of T106 and 31 vertical levels extending from the surface to 10 hPa. The ocean component is Geophysical Fluid Dynamics Laboratory (GFDL) Modular Ocean Model version 4 (MOM4; Griffies et al., 2004), with zonal resolution of 1° and meridional resolution of 1/3° between 10°S and 10°N, which linearly increases to 1° poleward of 30°S and 30°N. There are 50 layers in the vertical with 23 layers in the upper 230 m. The sea ice component of CAMS-CSM is the GFDL Sea Ice Simulator (SIS) and the land component is the Common Land Model (CoLM; Dai et al., 2003). For an additional detailed description of the CAMS-CSM, please refer to Rong et al. (2018).
In this study, the daily output of precipitation from a 23-yr coupled integration based on CAMS-CSM is analyzed. The verification data employed are the rainfall data from One Degree Daily (1DD) Global Precipitation Climatology Project (GPCP) v1.1 based on satellite and gauge observations (Huffman et al., 2001) for the period 1997–2014.
The zonal wavenumber–frequency spectral analysis and filtering for CCEWs are employed on the observed and simulated precipitation. Note that in the spectra and filtering analysis, we use the raw data without equatorial symmetric and antisymmetric decomposition as inStraub and Kiladis (2002) and Roundy and Frank (2004). To clearly show the spectral peaks of dominant wave modes associated with tropical precipitation, we only show the ratio of raw spectrum to the background spectrum obtained by smoothing the raw spectrum using a 1-2-1 filter (Wheeler and Kiladis, 1999). In the spectral analysis, we focus on the meridional range of 15°S–15°N following many previous studies (Wheeler and Kiladis, 1999; Kiladis et al., 2009). We also examine the spectrum result over the Northern Hemisphere (0°–15°N) and the Southern Hemisphere (15°S–0°) separately to illustrate some information about the different performance in wave activity and wave propagation. The filter domain for each wave is chosen according to the wavenumber–frequency spectrum of observed CCEWs. The standard deviation of daily-filtered rainfall anomaly for each wave mode is calculated in every calendar month to represent monthly wave activity. The seasonal cycles of wave activity are the long-term mean monthly wave activity (Huang and Huang, 2011).
3 Simulation of CCEWs 3.1 Climatological features of simulated CCEWsTo examine the general performance of CAMS-CSM in simulating the wave intensity and propagation of CCEWs, we first calculate the wavenumber–frequency spectrum of daily precipitation over the tropics in the observation and simulation. Note that in the following we show the ratio of raw spectrum to the background spectrum.Figures 1a, b display the results for the meridional range of 15°S–15°N from observation and simulation, respectively. In the observational diagram of zonal wavenumber and frequency, dominant modes shown by spectrum peaks are MJO, Kelvin wave, ER wave, MRG wave, and TD-type wave (Fig. 1a). This is consistent with previous studies using the same analysis method (Roundy and Frank, 2004). The spectrum power generated by the simulated precipitation by CAMS-CSM resembles the observation very well (Fig. 1b), including the magnitudes of spectrum of each wave mode as well as the location of each wave mode relative to the equivalent depth lines. For both observation and simulation, the maximum spectrum of each wave mode is confined to the curves representing equivalent depths of 25 m. Because equivalent depths correspond to various phase speeds, the phase speeds of simulated waves are close to those of observed ones. Calculations show that the pattern correlation coefficient between the observation and simulation is 0.7, and the root-mean-square-error (RMSE) is 0.0015.

|
| Figure 1 Zonal wavenumber–frequency power of precipitation over 15°S–15°N divided by the background spectrum based on (a) observation (OBS) and (b) CAMS-CSM output. Superimposed are the dispersion curves of equatorial waves for the three equivalent depths of 8, 25, and 90 m. The signals with positive (negative) zonal wave number propagate eastward (westward). Note: cpd denotes cycle per day. |
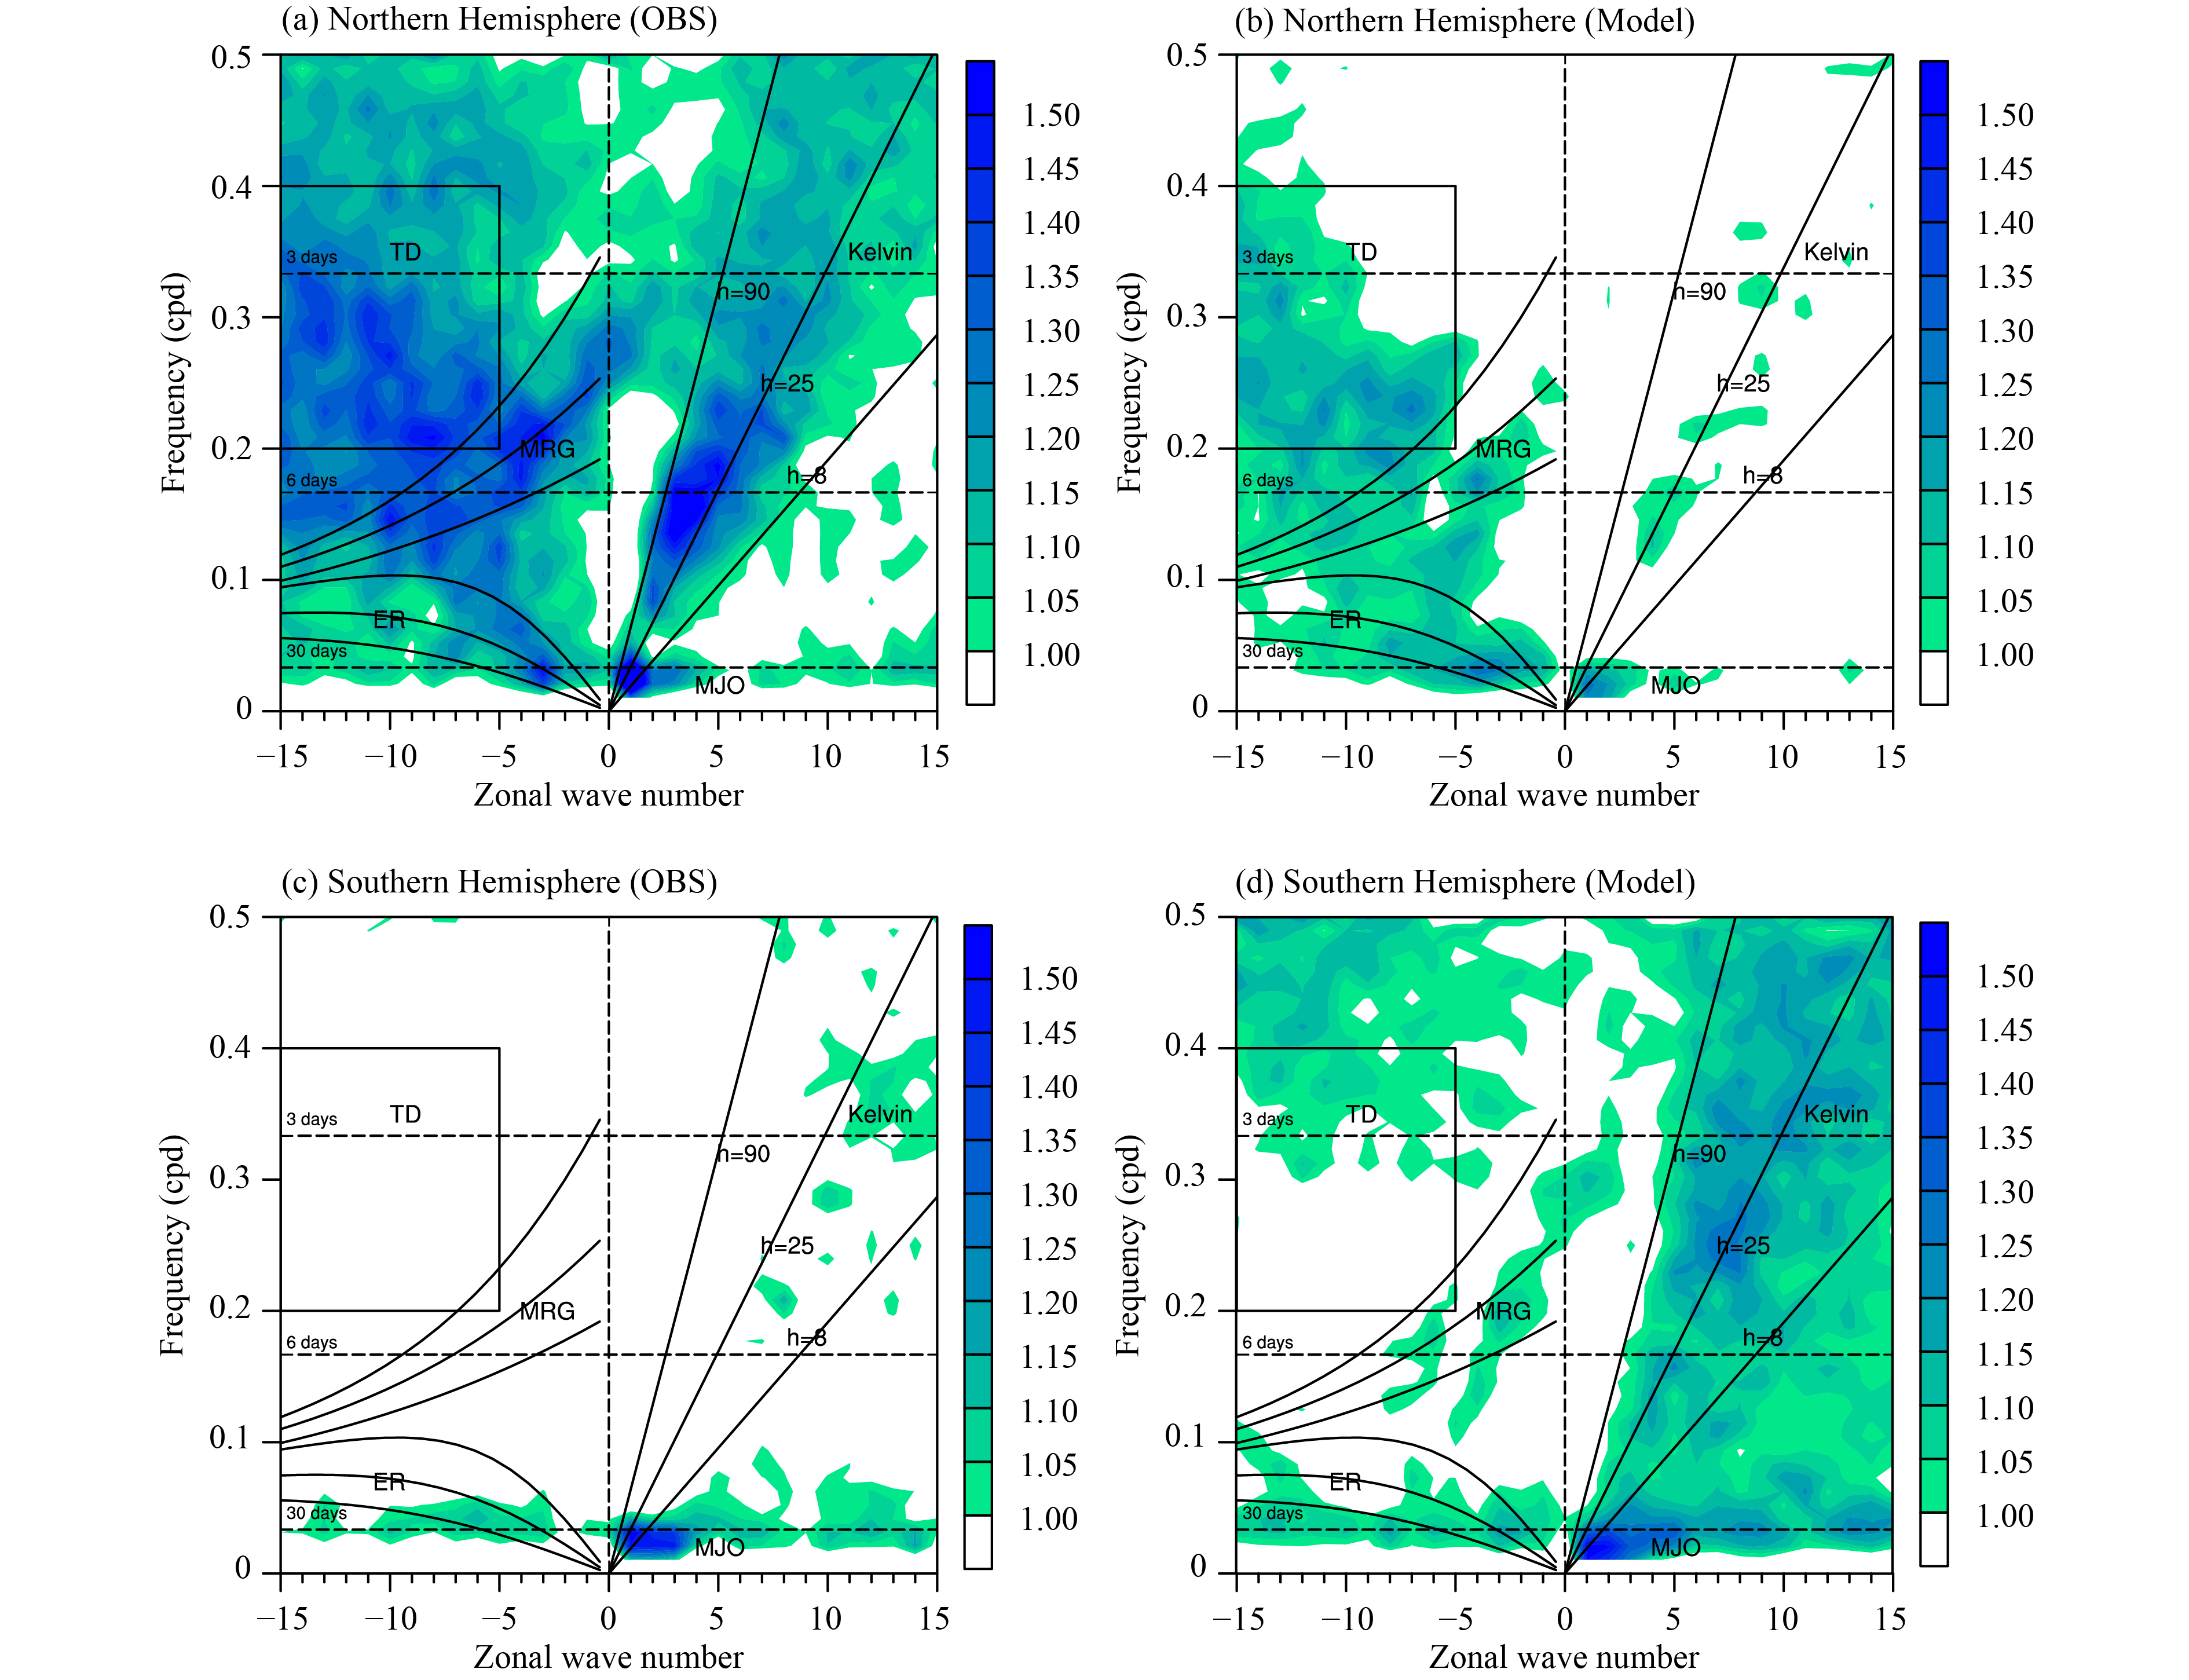
We further examine the space–time spectrum of observed and simulated precipitation over the Northern Hemisphere (0°–15°N) and the Southern Hemisphere (15°S–0°) separately (Fig. 2). The observational result (Figs. 2a, c) clearly shows that most of the spectrum power near the dispersion lines representing Kelvin, MRG, and TD waves is confined to the Northern Hemisphere, indicating that these wave modes are primarily active to the north of the equator. This is understandable, because the convection anomalies associated with TD waves are mainly over the western North Pacific, especially during boreal summer (Lau and Lau, 1990). The spectrum power near the dispersion lines representing ER and MJO could be seen in both the Northern and Southern Hemispheres. The spectrum power associated with MJO is even heavier over the Southern Hemisphere than the Northern Hemisphere, because the convection anomalies associated with MJO are observed over the southern Indian Ocean, especially during boreal winter (Madden and Julian, 1994). The simulated results show marked discrepancy compared to the observation, especially for the Kelvin, MRG, and TD waves (Figs. 2b, d). The spectrum power near the Kelvin wave dispersion lines is mainly seen over the Southern Hemisphere rather than the Northern Hemisphere. This indicates that the simulated Kelvin wave convection is most active to the south of the equator. For the MRG and TD waves, the spectrum power is seen to both north and south of the equator. The above results reveal that CCEW activities have inhomogeneous distributions to the north and south of the equator, and such a feature is poorly simulated by CAMS-CSM.
|
| Figure 2 As in Fig. 1, but for estimates of the Northern Hemisphere (0°–15°N, a and b) and Southern Hemisphere (15°S–0°, c and d), respectively. The left panels are based on observational data, while the right panels are based on CAMS-CSM output. The signals with positive (negative) zonal wave number propagate eastward (westward). |
Next, we filter the raw precipitation data to extract each wave mode based on the observational spectrum power distribution shown in Fig. 1a. In the present study, four dominant modes of CCEWs including the Kelvin, ER, MRG, and TD-type waves are isolated. The wave-filtering bands are shown in Table 1. The “TD-type” filter used is identical to that used by Huang and Huang (2011).
| Kelvin | ER | MRG | TD-type | |
| Period (day) | 3–20 | 10–30 | 3–10 | 2.5–5 |
| Wavenumber | 2–14 | −10 to −2 | −10 to −1 | −15 to −5 |
| Equivalent depth (m) | 8–90 | 8–90 | 8–90 | Not specified |
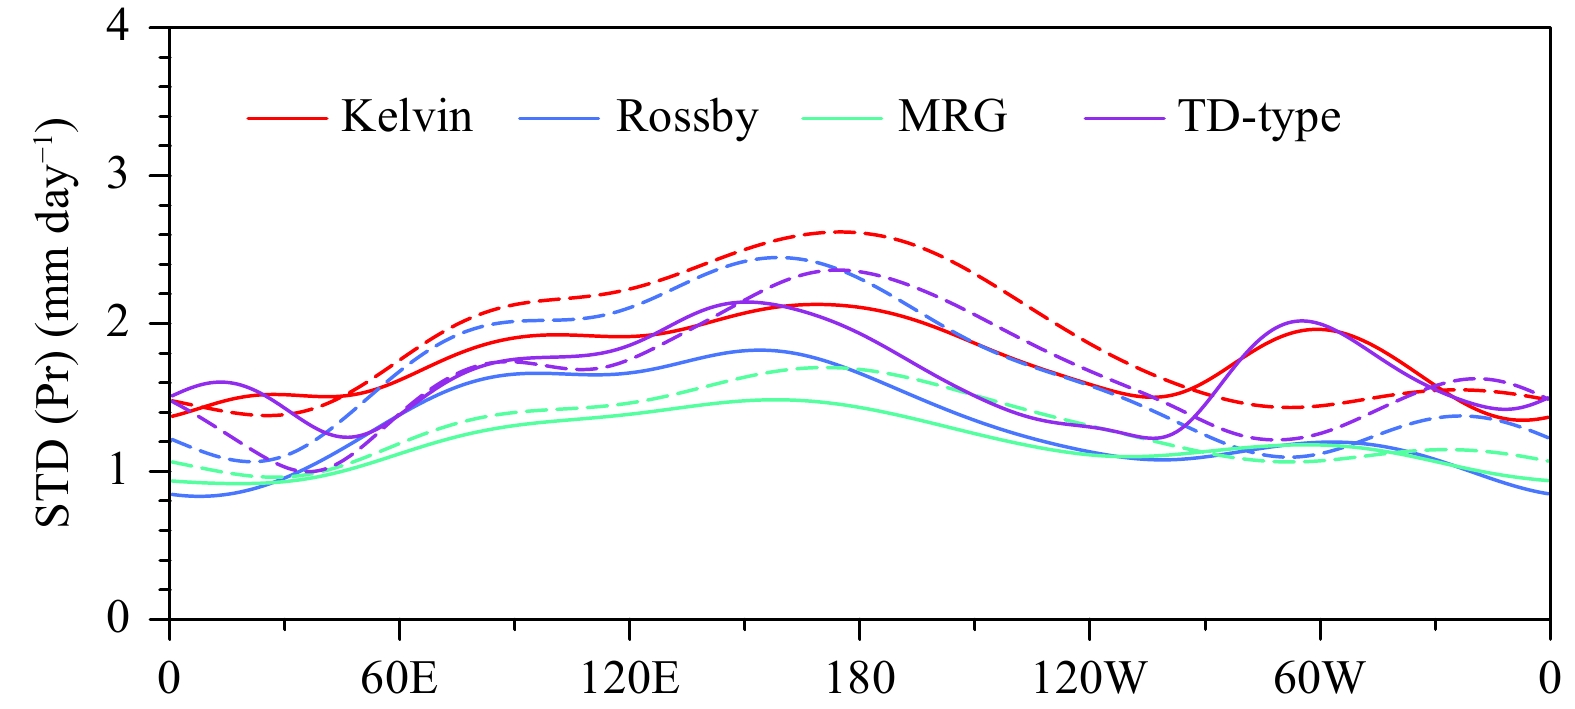
Figure 3 displays the 15°S–15°N average of the standard deviation of precipitation anomaly associated with each wave mode for observation and simulation. The solid lines represent the results based on GPCP data while the dashed lines represent those from simulation. For most of the wave modes, the rainfall maximum has one peak over the Indian Ocean and another over the Pacific Ocean, except that the rainfall of Kelvin wave has a second peak near 60°W. It is shown that the model is able to simulate the precipitation center over the Indian and the Pacific Ocean very well, and the values are even higher than the observation.
|
| Figure 3 Zonal distributions of annual mean standard deviation (STD) of precipitation (Pr) filtered for the Kelvin (red), ER (blue), MRG (green), and TD-type (purple) waves averaged over 15°S to 15°N. The solid lines represent the observation and the dashed lines represent the simulation results. |
The above results are a big improvement compared to those from CMIP3 and CMIP5 coupled models, because it has been revealed that most CMIP3/CMIP5 coupled models simulate too weak precipitation anomalies associated with various wave modes; about half of CMIP3 models simulate the values only half of the observation (Lin et al., 2006; Huang et al., 2013). In addition, the CMIP3 models simulate too deep the equivalent depths, implying that the simulated phase speeds of CCEWs are too fast. Only two models, i.e., CNRM-CM3 (Centre National de la Recherche Scientifique/Météo-France-Coupled Model v3) and ECHAM5/MPI-OM, among the analyzed CMIP3 simulations, produce more realistic CCEW signals (Lin et al., 2006). It was argued that the good performance of the two best models in CMIP3 may be related to the deep convection schemes, because only they employed the moisture–convergence-type closure. It is hypothesized that the moisture–convergence-type closures/triggers tie the convection more closely to large-scale wave circulation and thus enhance the wave–heating feedback in the CCEWs. Note that one of the best models in CMIP3 is ECHAM5/MPI-OM, which used the same atmospheric component model (i.e., ECHAM5) as the CAMS-CSM. Therefore, the good performance of CAMS-CSM in simulating CCEW signals may be due to the moisture–convergence-type closure used in its atmospheric component. However, such a hypothesis needs further validation.
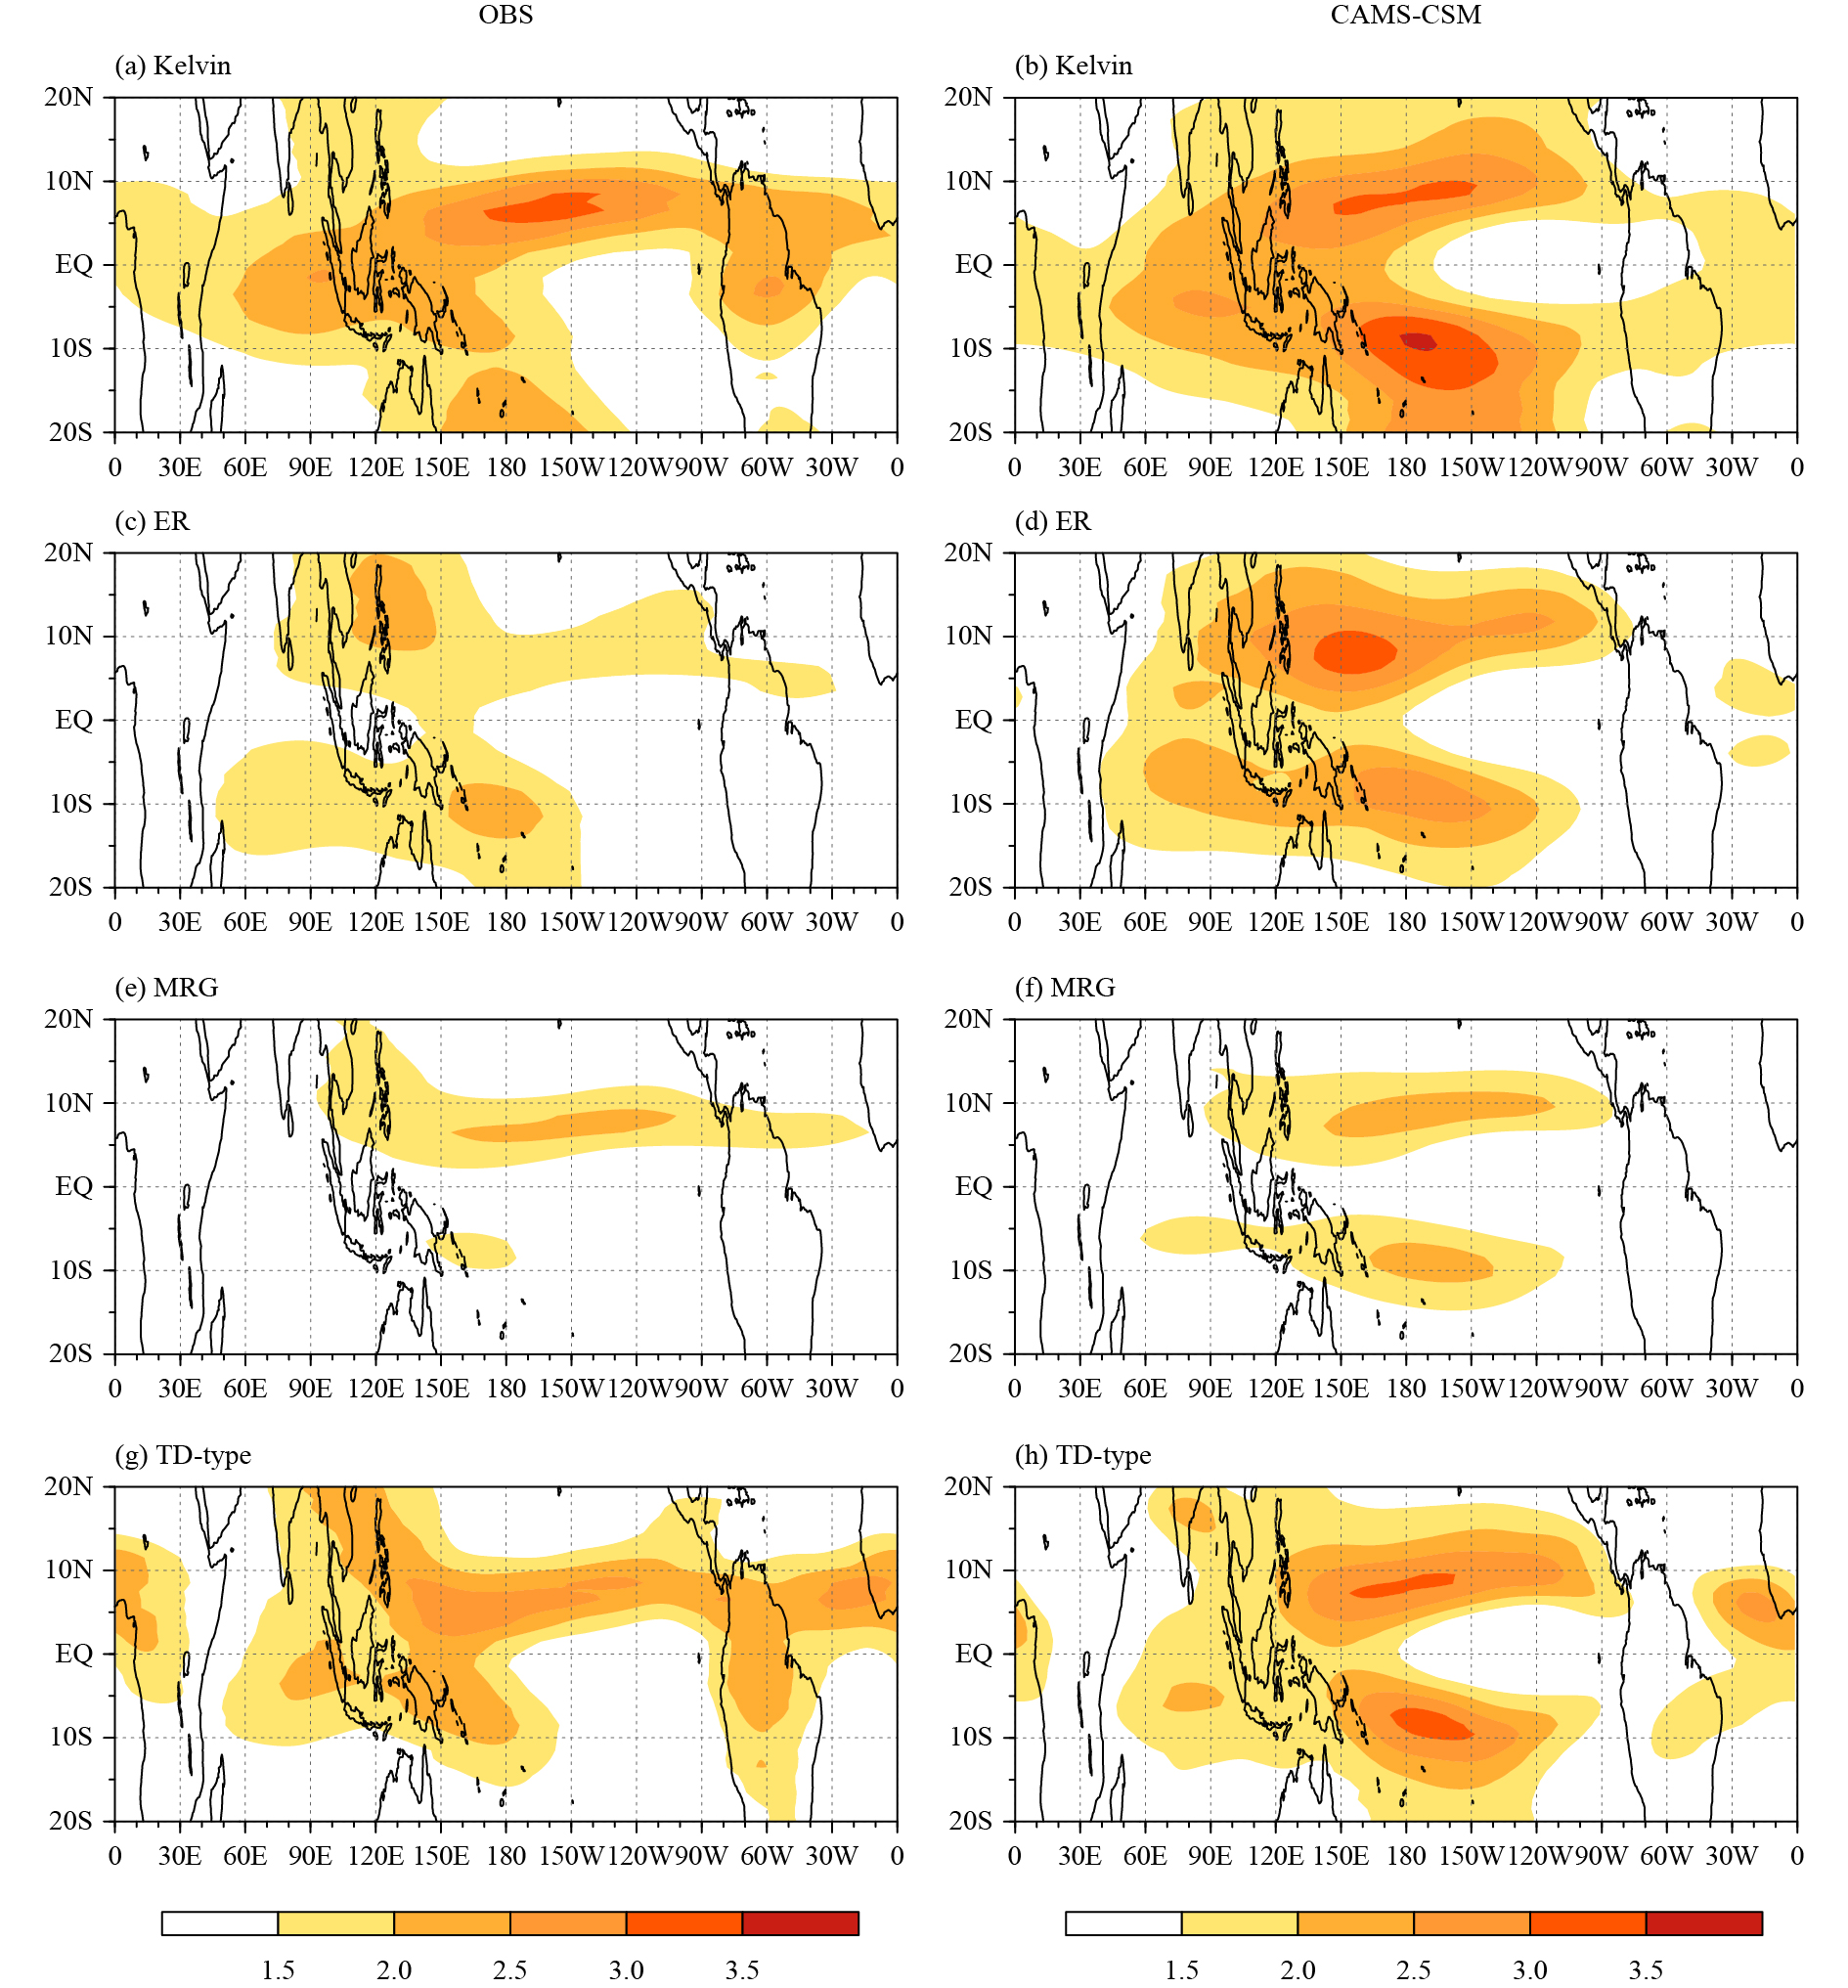
Another question is how realistic the wave associated precipitation anomalies in the model are in terms of spatial patterns and amplitudes. Figure 4 displays the horizontal maps of standard deviation of each wave associated rainfall anomalies. In observation, the Kelvin and TD-type waves show similar spatial distributions (Figs. 4a, g). The most active region is primarily located along the zonal band within 0°–10°N over the western and central Pacific, while the active regions could extend into as far as the Atlantic Ocean. The secondary active regions are seen over the Southeast Indian Ocean near Sumatra Island and the Southwest Pacific near New Guinea. The spatial distributions of the wave activity are consistent with those of climatological SST and moisture (figure omitted), suggesting that warm SST and abundant moisture in background favor the genesis and development of convections associated with the two wave modes. Meanwhile, in the model simulation, these wave modes share similar discrepancies (Figs. 4b, h): two branches of active wave regions symmetric to the equator appear from the western Pacific to the eastern Pacific, with the southern branch even stronger than the northern one. This suggests that the wave activity over the southwestern Pacific is grossly overestimated. In addition, the two branches are located more poleward compared to the observation.
|
| Figure 4 Horizontal distributions of annual mean standard deviation of precipitation filtered for (a, b) Kelvin, (c, d) ER, (e, f) MRG, and (g, h) TD-type waves. The left (right) panels represent the observation (simulation). |
The observed ER wave has two active centers: one is near the Philippine Sea and the other is over the South-west Pacific (Fig. 4c). The simulated ER wave shows excessive amplitude over both hemispheres compared to the observation (Fig. 4d). The observed MRG wave is primarily active within the belt of 5°–10°N over the Pacific Ocean (Fig. 4e). The simulated MRG wave shows comparable activity in the northern Pacific and southern Pacific (Fig. 4f).
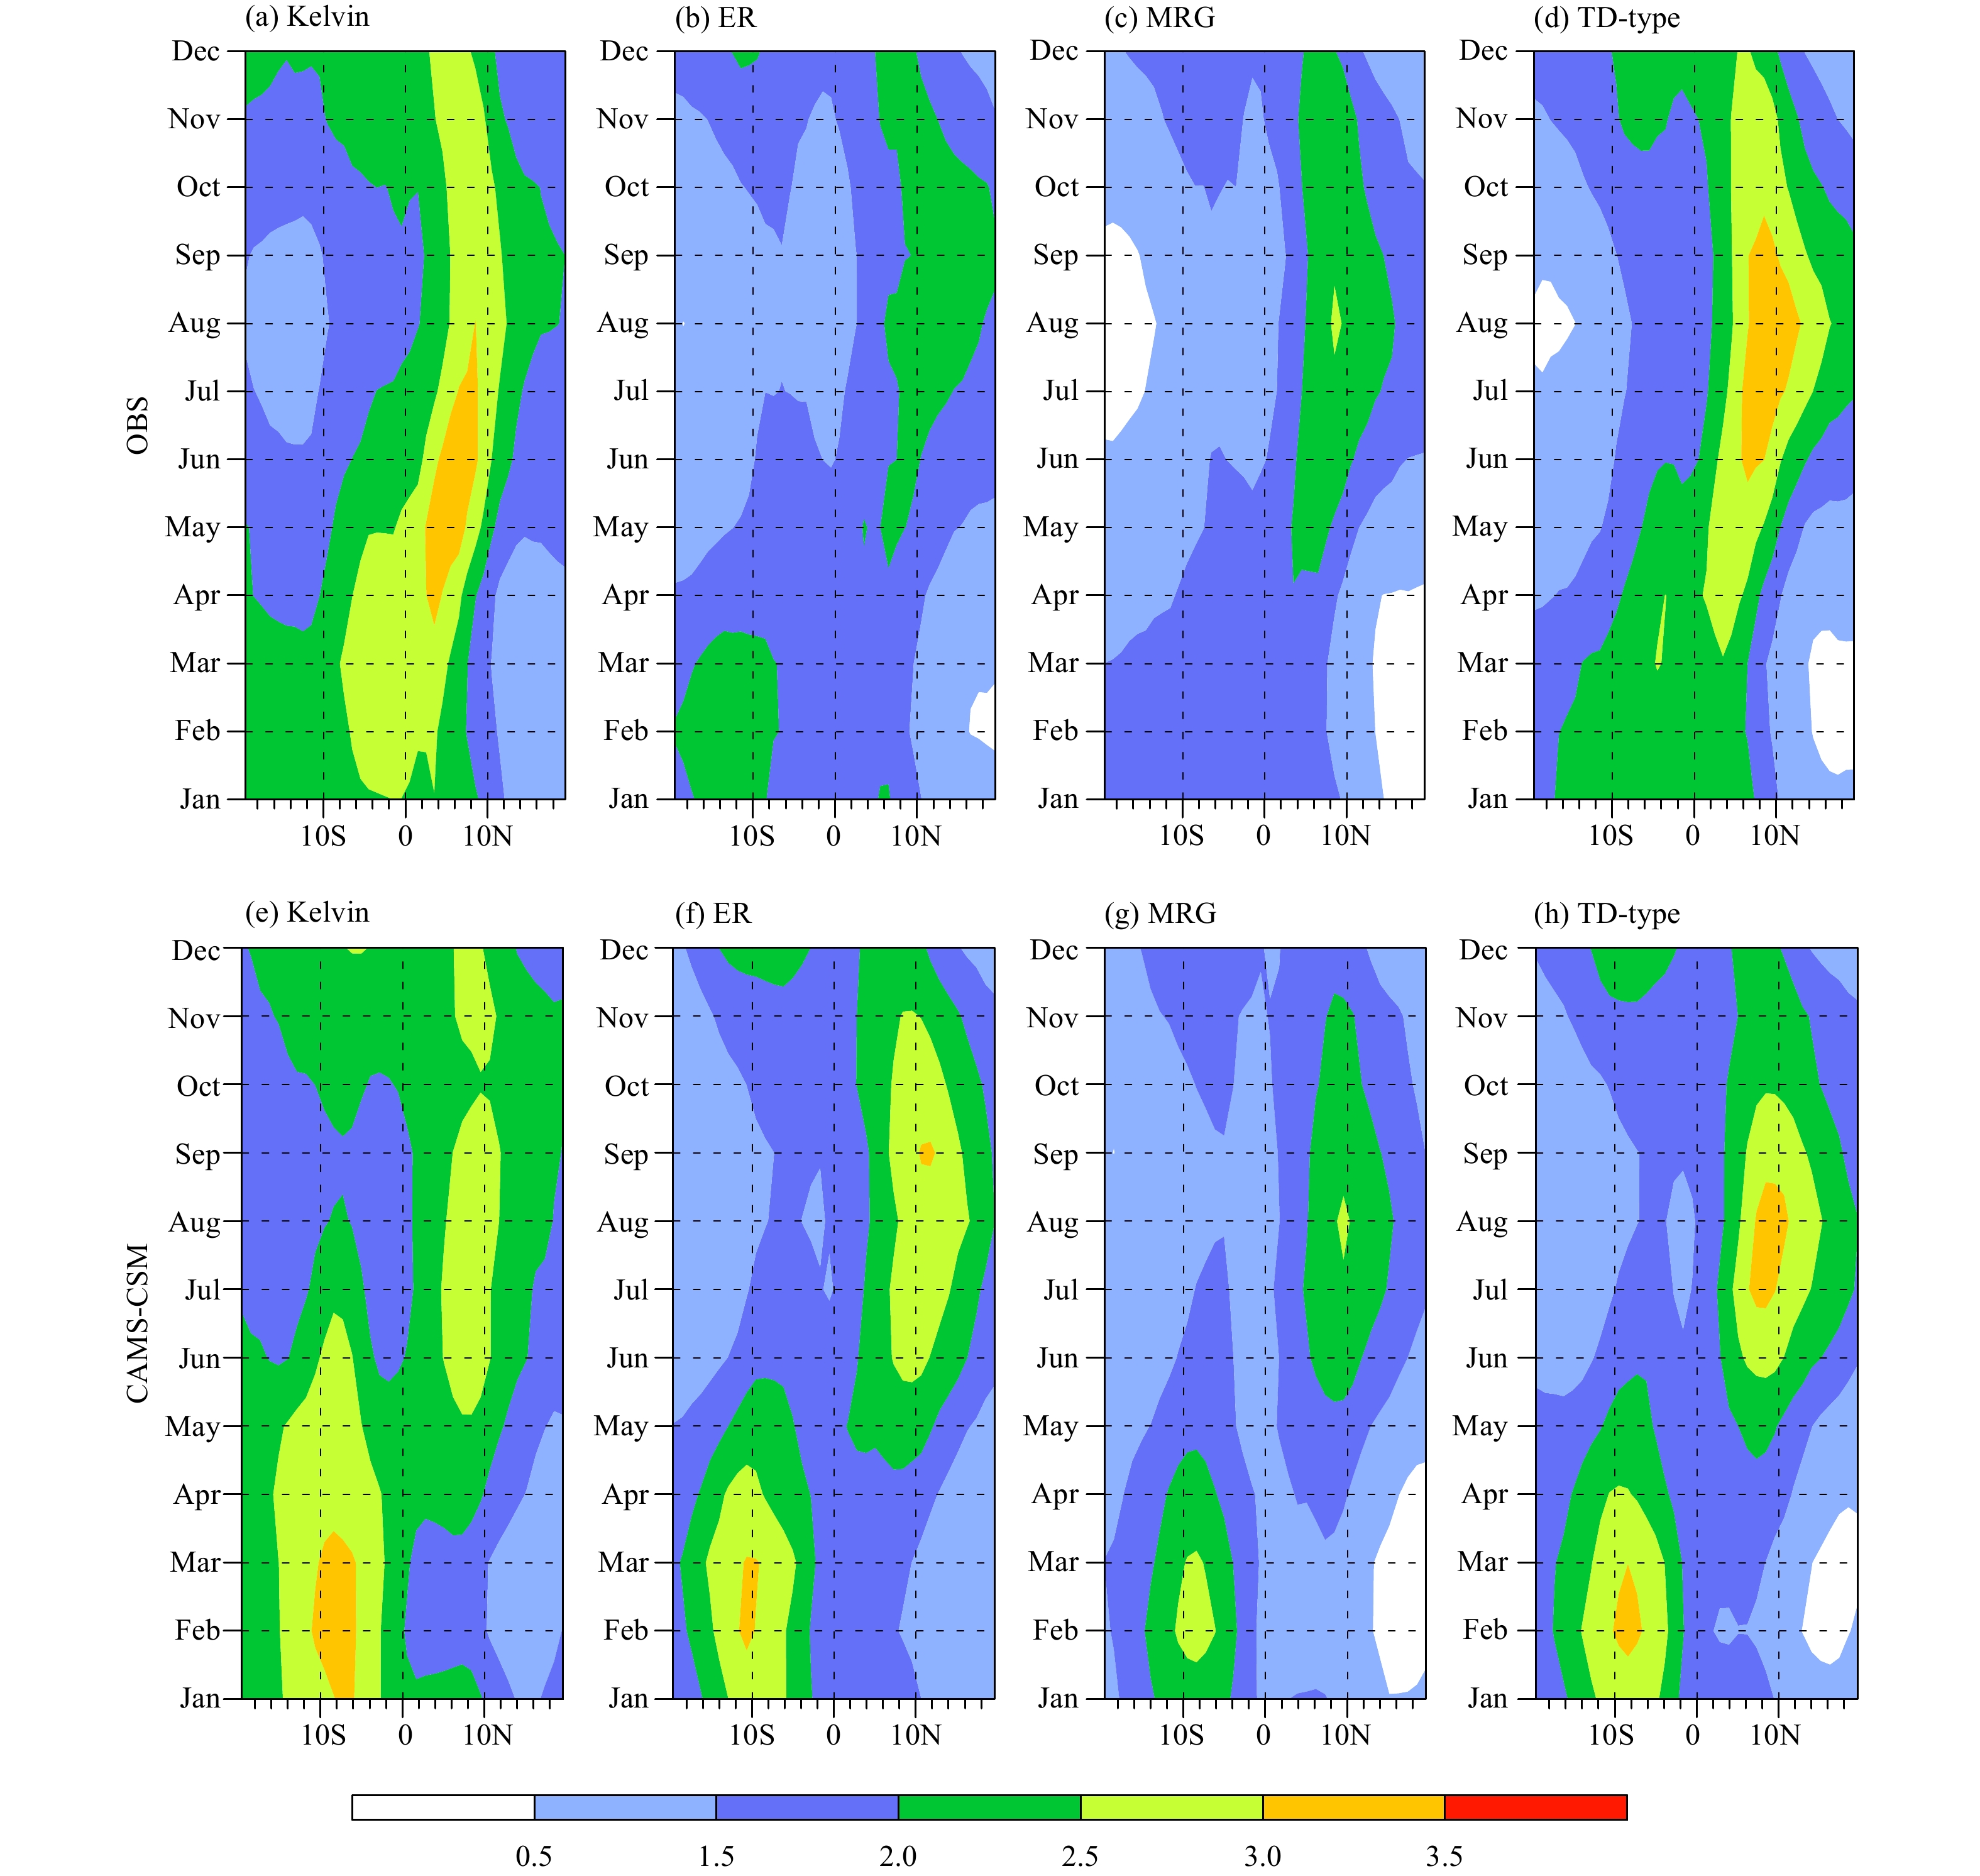
3.2 Seasonal cycle of simulated CCEWsFigure 5 shows the seasonal evolution of zonal mean wave activity. In observation, the Kelvin wave is active to the north of the equator throughout the calendar year, with its maximum from April to July. The ER wave maximizes in the Northern Hemisphere in boreal summer (July–October) and in the Southern Hemisphere in boreal winter (December–March), which is consistent with the seasonal evolution of solar radiation. The MRG and TD-type waves look similar, with their maximum appearing from June to September to the north of the equator.
|
| Figure 5 Seasonal evolution of zonal-mean wave activity for (a, e) Kelvin, (b, f) ER, (c, g) MRG, and (d, h) TD-type waves. The upper (lower) panels represent the observation (simulation). |
In model simulation, the prominent discrepancy is that an excessive activity center appears to the south of the equator in boreal winter in each wave mode, and it is even stronger than the one to the north of the equator in boreal summer. In addition, there is a discrepancy in the seasonal peak for the Kelvin wave, which is earlier than that in observation.
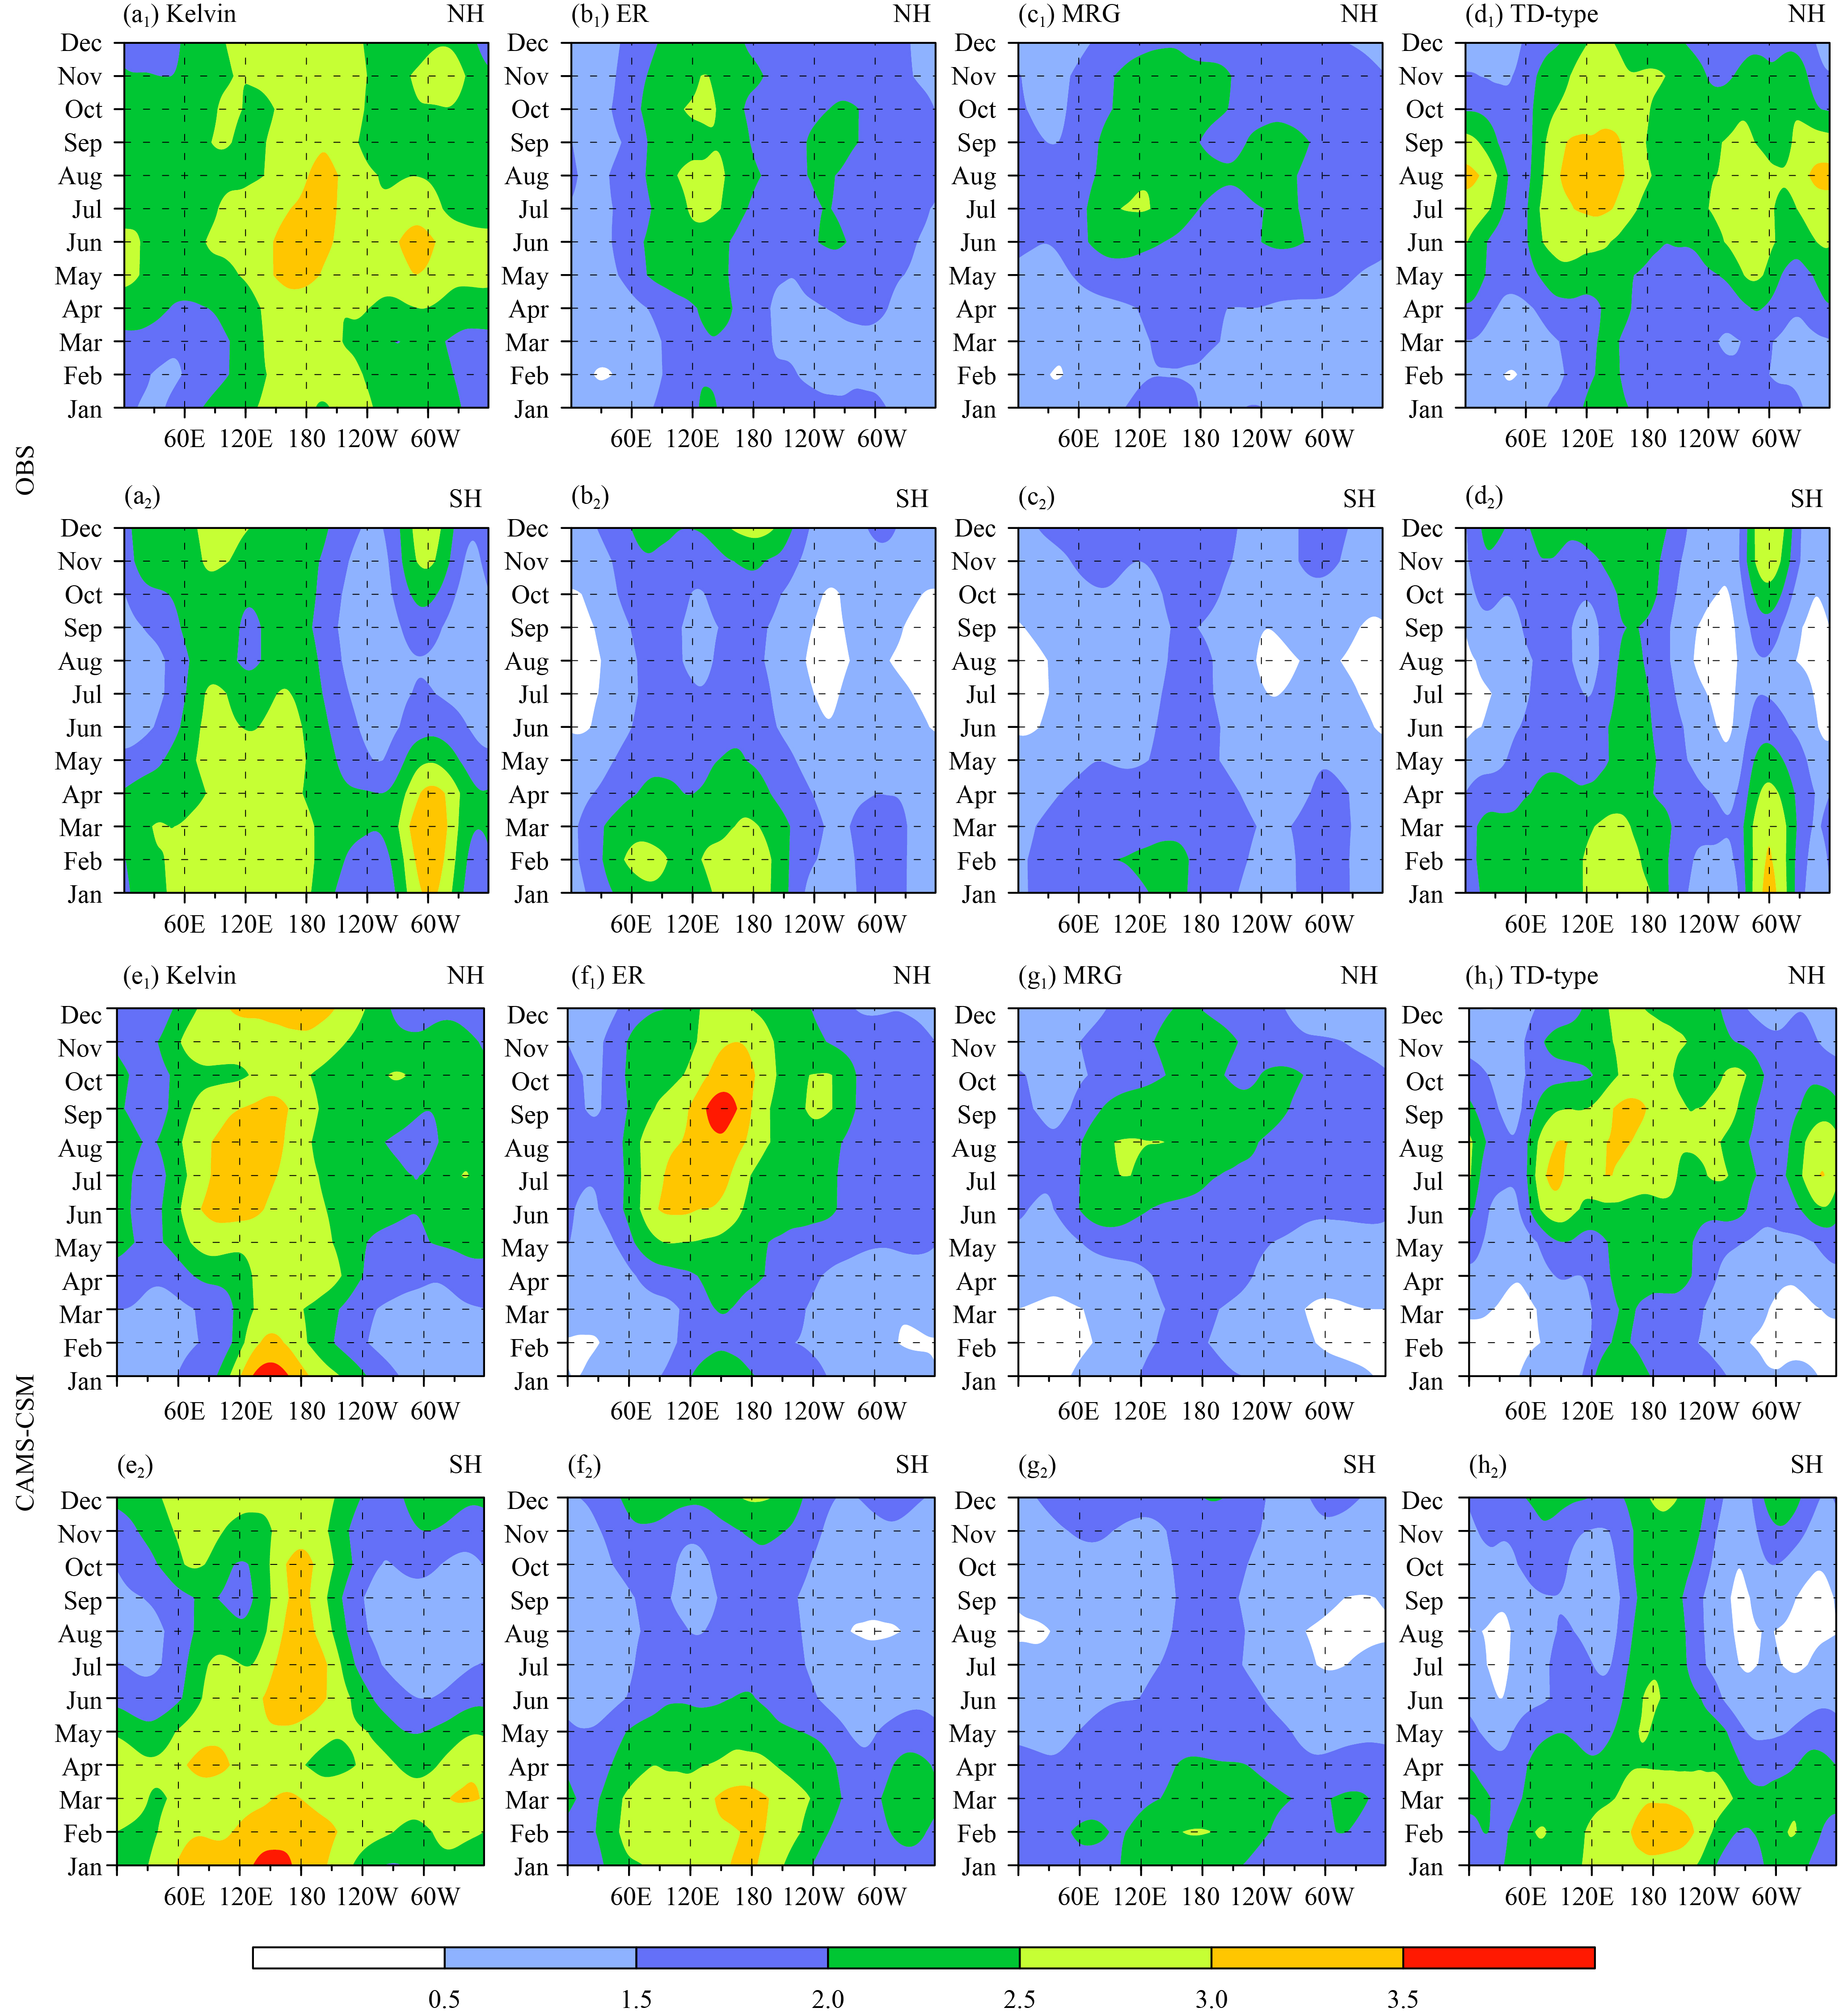
Figure 6 further shows seasonal evolution of Northern Hemisphere and Southern Hemisphere mean wave activities. For the Kelvin wave, the Northern (Southern) Hemisphere mean is obtained by average from the equator to 12.5°N (°S), while for the other wave modes, it is calculated from the equator to 20°N (°S).
|
| Figure 6 Seasonal evolution of meridional-mean wave activity for (a, e) Kelvin, (b, f) ER, (c, g) MRG, and (d, h) TD-type waves. The first and third rows are average over the Northern Hemisphere while the second and fourth rows are average over the Southern Hemisphere. The upper (lower) panels represent the observation (simulation). |
The observed Kelvin wave maximizes over the central Pacific (near 180°) and South America (near 60°W) near the equator throughout the whole calendar year. The observed ER, MRG, and TD-type waves maximize over the Northwest Pacific (near 120°E) during boreal summer while over the southern Indian Ocean and the Southwest Pacific during boreal winter. Compared to the observation, the simulated results overestimate the wave activity in the Southern Hemisphere. Meanwhile, the activity of Kelvin wave over South America is underestimated.
3.3 Biases in simulation of CCEWsThe above analysis reveals a prominent bias of the model in simulating the CCEWs; that is, the simulated wave associated rainfall anomalies show excessive amplitude over the Southwest Pacific Ocean. Then, what causes the deviation of wave associated rainfall anomalies in the simulation? Wang and Li (2017) assessed the Kelvin wave associated rainfall anomalies in 20 simulations from CMIP5 historical experiment database. They found that most of the analyzed models simulate too excessive Kelvin wave–rainfall activity over the Southwest Pacific Ocean. The authors further found a significant positive correlation between the deviation of Kelvin wave associated rainfall activity and the deviation of climatological SST or precipitation among the analyzed simulations. The result indicates that warmer SST over the Southwest Pacific Ocean corresponds to more precipitation and stronger Kelvin wave activity. It is possibly because warm SST favors more convective instability and more moisture locally (Chen et al., 2015, 2019). Such an argument may apply to the other CCEW modes.
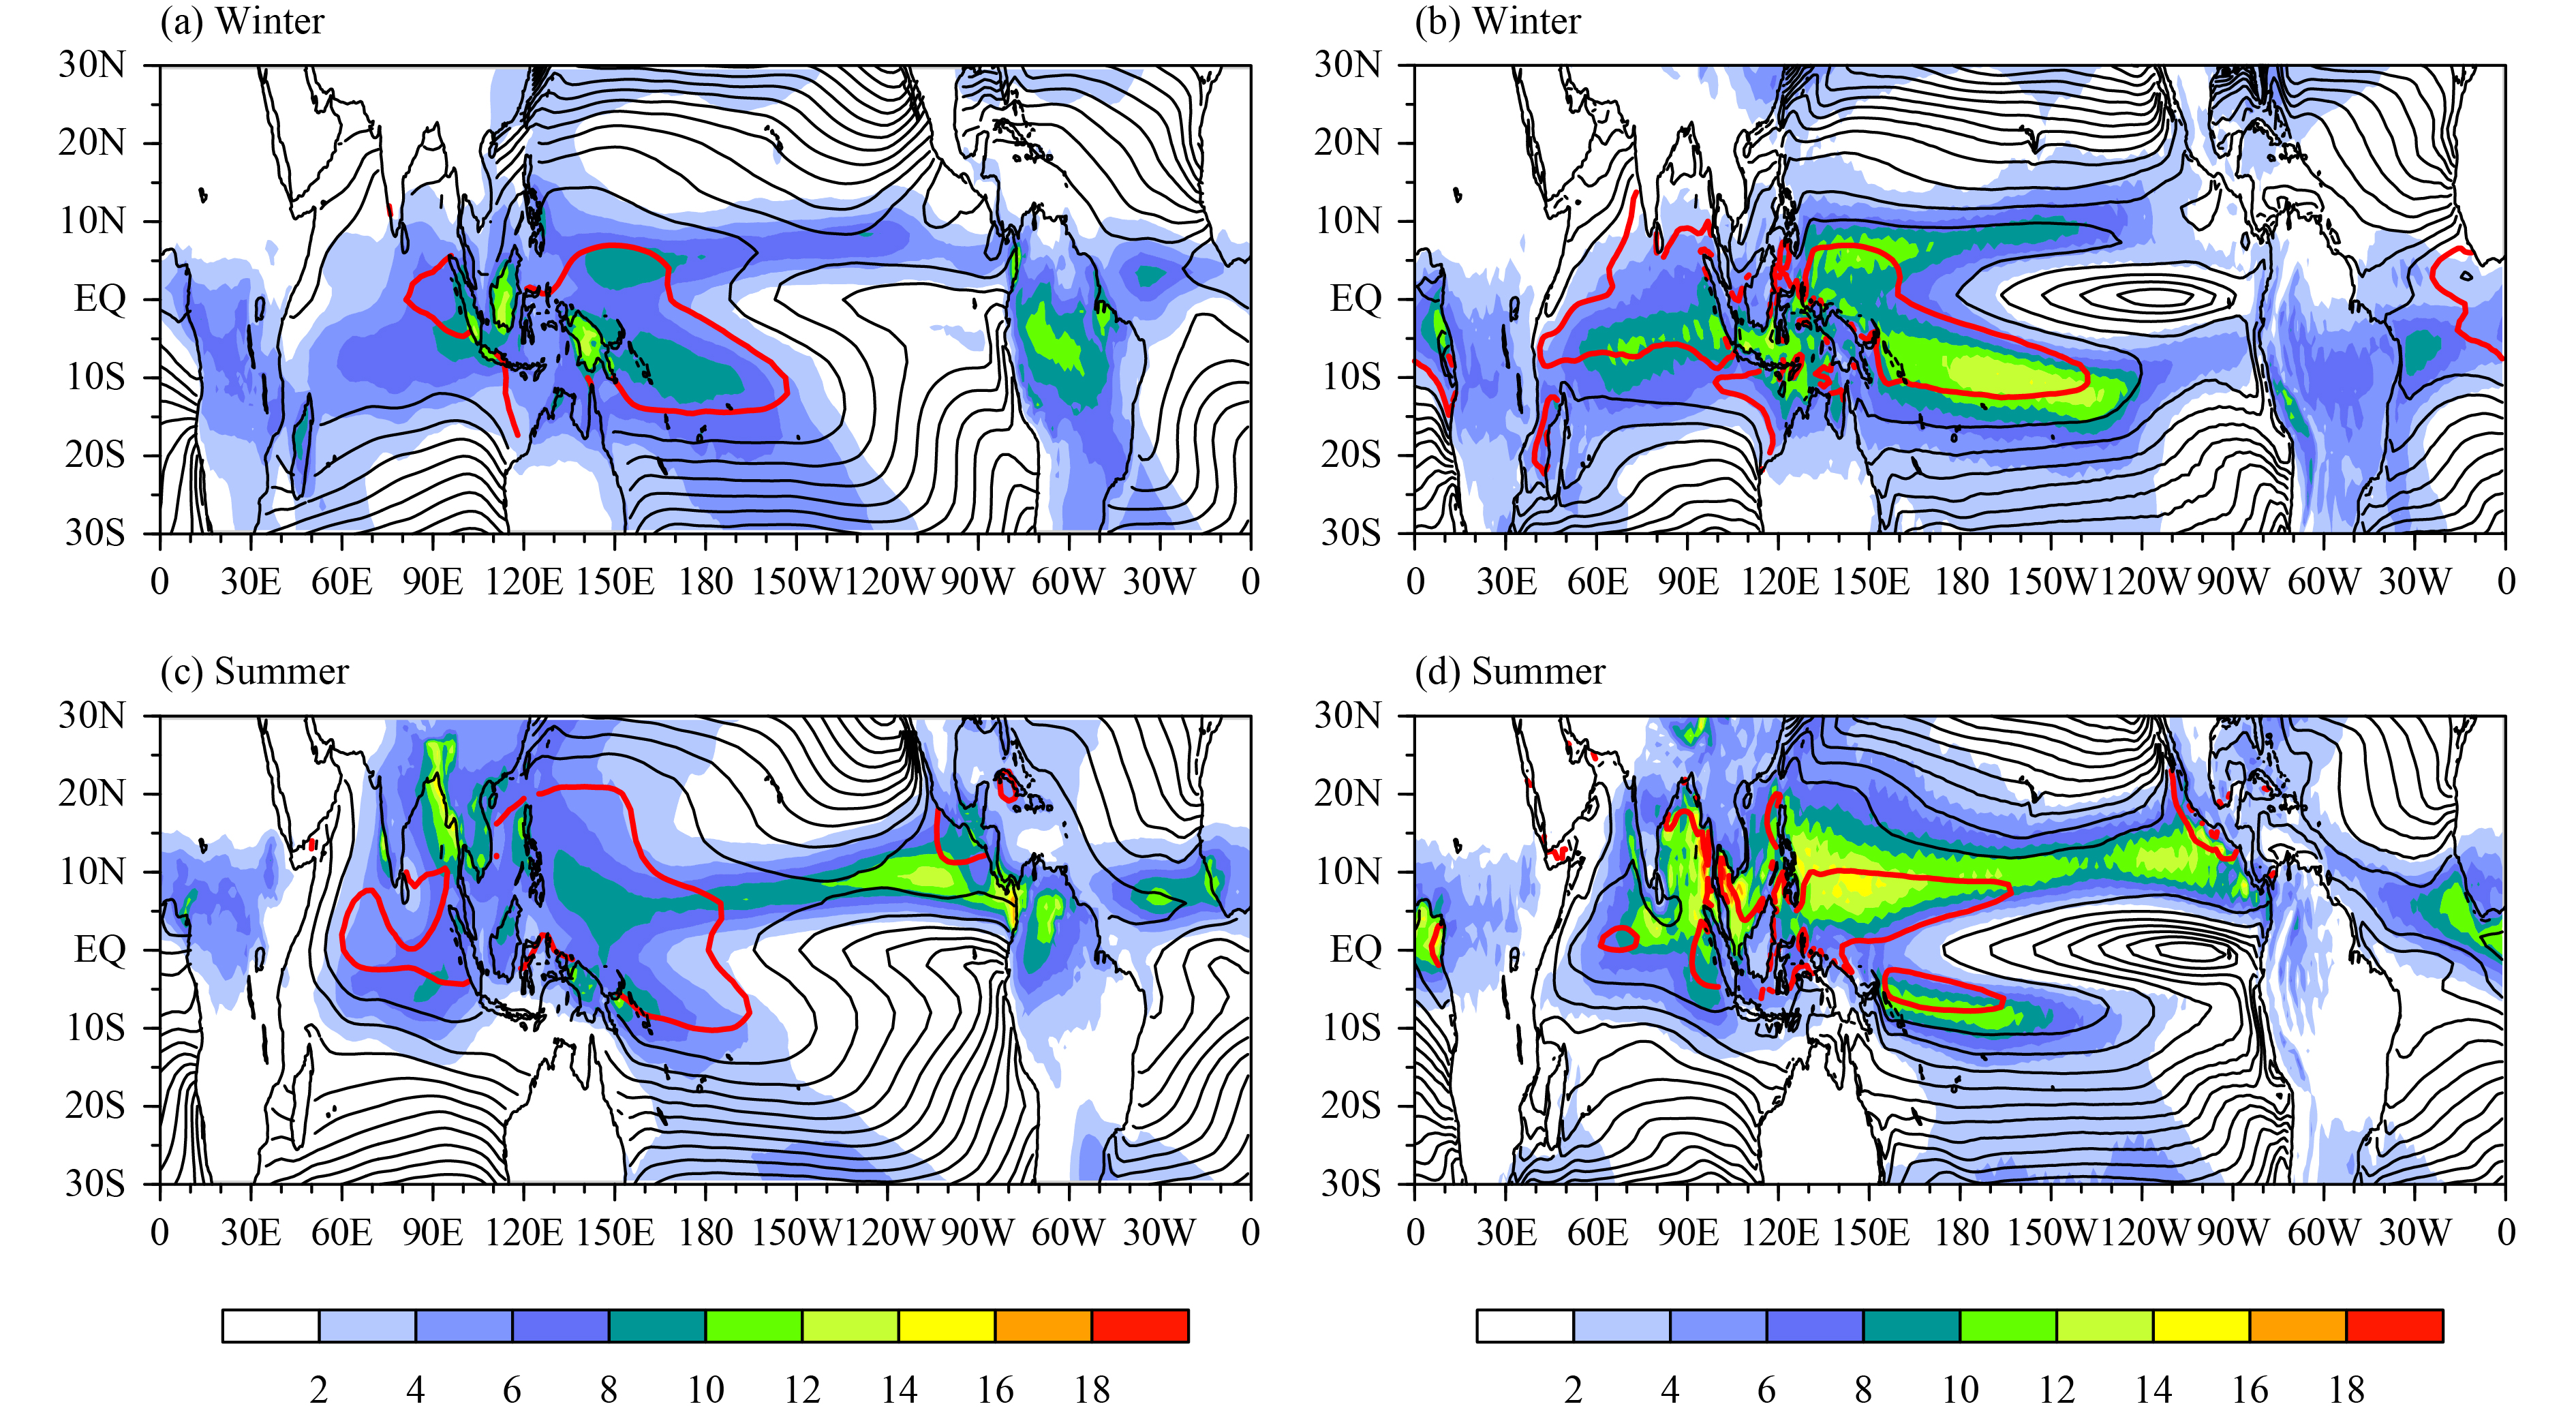
Figure 7 displays the winter and summer mean precipitation and SST in observation and simulation, respectively. As can be seen, the double-intertropical convergence zone (ITCZ) bias is clear in the simulation, especially in boreal winter, which means that the climatological rainfall is overestimated over the Southwest Pacific. The underlying SST also shows a warmer bias over the tropical Southwest Pacific. Therefore, it is probable that the bias of mean SST distribution is the reason for the bias of wave related rainfall anomaly.
|
| Figure 7 Climatological mean precipitation (shaded, mm day−1) and SST (contours with interval of 1°C) during (a, b) boreal winter (November–April) and (c, d) boreal summer (May–October) for (a, c) observation and (b, d) simulation. The red contours represent SST of 29°C |
The double-ITCZ problem is a commonly simulated deviation in tropical areas among coupled models, which does not improve significantly from CMIP3 to CMIP5 (Zhang et al., 2015). Therefore, this is a big challenge to the current coupled GCM simulations. Specifically, the simulated precipitation bias is due to the deviation of SST simulation; that is, the simulated warmer SST over the tropical Southwest Pacific results in the eastward extension of rainfall and thus leads to the emergence of the double-ITCZ. However, the explanation cannot be so simple, because the double-ITCZ deviation is a result of the interaction of the entire tropical atmosphere–ocean system (Li and Xie, 2014; Oueslati and Bellon, 2015). Further study is needed to explore the root cause of the formation of double-ITCZ so as to understand the wave associated excessive rainfall south of the equator.
4 SummaryThis study presents an assessment of the performance in modeling the CCEWs by a newly developed model known as CAMS-CSM. The daily precipitation result from a 23-yr coupled run was analyzed, and was compared with the observation based on GPCP daily precipitation data from 1997 to 2014.
The CAMS-CSM could capture the space–time spectrum characteristics of each wave mode represented by tropical averaged precipitation very well, including the magnitudes as well as the location of each wave mode relative to the equivalent depth lines. The latter indicates reasonable performance of CAMS-CSM in simulating wave phase speed. The pattern correlation coefficient between the observation and simulation in the spectrum diagram is about 0.7, with very low root-mean-square-error. Furthermore, four dominant modes of CCEWs including the Kelvin, ER, MRG, and TD-type waves are investigated respectively. It is shown that the model is able to simulate the zonal distribution of wave associated precipitation well, with the maximum centers appearing over the Indian Ocean and the Pacific Ocean, and the values are even higher than the observation. The good performance of CAMS-CSM in simulating the characteristics of CCEWs may lie in its atmospheric component model (i.e., ECHAM5), in which the convective closure/trigger parameterization is considered critical (Lin et al., 2006).
It is of interest to note that although CAMS-CSM is able to simulate reasonable space–time spectra of tropical averaged precipitation (15°S–15°N averaged), the meridional distributions of the wave activities in the simulation show prominent deviations compared to the observation, especially the Kelvin wave, TD wave, and MRG wave. These wave modes tend to appear to the north of the equator in the observation, while the simulation results show excessive wave activity to the south of the equator, especially over the southern Pacific Ocean. The seasonal cycle of each wave mode is generally captured by the model, but their amplitudes over the Southern Hemisphere during boreal winter are grossly overestimated. The excessive intensity of CCEWs in the southern equatorial Pacific is possibly related to the overestimated SST over the southern Pacific convergence zone in the simulation. However, overestimated SST and precipitation over the southern Pacific Ocean, which are usually related to the double-ITCZ bias, have been reported as a common problem among coupled models. What causes the biased mean SST and precipitation distribution needs further investigation.
Acknowledgments. We thank the anonymous reviewers and the editor for their constructive comments, which significantly improved this paper.
| Chen, L., T. Li, and Y. Q. Yu, 2015: Causes of strengthening and weakening of ENSO amplitude under global warming in four CMIP5 models. J. Climate, 28, 3250–3274. DOI:10.1175/jcli-d-14-00439.1 |
| Chen, L., W. P. Zheng, and P. Braconnot, 2019: Towards understanding the suppressed ENSO activity during mid-Holocene in PMIP2 and PMIP3 simulations. Climate Dyn., 53, 1095–1110. DOI:10.1007/s00382-019-04637-z |
| Dai, Y. J., X. B. Zeng, R. E. Dickinson, et al., 2003: The Common Land Model. Bull. Amer. Meteor. Soc., 84, 1013–1024. DOI:10.1175/BAMS-84-8-1013 |
| DeMott, C. A., C. Stan, D. A. Randall, et al., 2011: The Asian monsoon in the superparameterized CCSM and its relationship to tropical wave activity. J. Climate, 24, 5134–5156. DOI:10.1175/2011JCLI4202.1 |
| Griffies, S. M., M. J. Harrison, P. C. Pacanowski, et al., 2004: A Technical Guide to MOM4. GFDL Ocean Group Technical Report No. 5, Princeton, NJ, NOAA/Geophysical Fluid Dy- namics Laboratory, 339 pp. |
| Huang, P., and R. H. Huang, 2011: Climatology and interannual variability of convectively coupled equatorial waves activity. J. Climate, 24, 4451–4465. DOI:10.1175/2011JCLI4021.1 |
| Huang, P., C. Chou, and R. H. Huang, 2013: The activity of convectively coupled equatorial waves in CMIP3 global climate models. Theor. Appl. Climatol., 112, 697–711. DOI:10.1007/s00704-012-0761-4 |
| Huffman, G. J., R. F. Adler, M. M. Morrissey, et al., 2001: Global precipitation at one-degree daily resolution from multisatellite observations. J. Hydrometeor., 2, 36–50. DOI:10.1175/1525-7541(2001)002<0036:GPAODD>2.0.CO;2 |
| Janicot, S., F. Mounier, S. Gervois, et al., 2010: The dynamics of the West African monsoon. Part V: The detection and role of the dominant modes of convectively coupled equatorial Rossby waves. J. Climate, 23, 4005–4024. DOI:10.1175/2010JCLI3221.1 |
| Kawamura, R., T. Murakami, and B. Wang, 1996: Tropical and mid-latitude 45-day perturbations over the western Pacific during the northern summer. J. Meteor. Soc. Japan, 74, 867–890. DOI:10.2151/jmsj1965.74.6_867 |
| Kiladis, G. N., M. C. Wheeler, P. T. Haertel, et al., 2009: Convectively coupled equatorial waves. Rev. Geophys., 47, RG2003. DOI:10.1029/2008rg000266 |
| Lau, K.-H., and N.-C. Lau, 1990: Observed structure and propagation characteristics of tropical summertime synoptic scale disturbances. Mon. Wea. Rev., 118, 1888–1913. DOI:10.1175/1520-0493(1990)118<1888:OSAPCO>2.0.CO;2 |
| Li, G., and S.-P. Xie, 2014: Tropical biases in CMIP5 multimodel ensemble: The excessive equatorial Pacific cold tongue and double ITCZ problems. J. Climate, 27, 1765–1780. DOI:10.1175/JCLI-D-13-00337.1 |
| Lin, J.-L., G. N. Kiladis, B. E. Mapes, et al., 2006: Tropical intraseasonal variability in 14 IPCC AR4 climate models. Part I: Convective signals. J. Climate, 19, 2665–2690. DOI:10.1175/JCLI3735.1 |
| Madden, R. A., and P. R. Julian, 1994: Observations of the 40–50-day tropical oscillation—A review. Mon. Wea. Rev., 122, 814–837. DOI:10.1175/1520-0493(1994)122<0814:OOTDTO>2.0.CO;2 |
| Matsuno, T., 1966: Quasi-geostrophic motions in the equatorial area. J. Meteor. Soc. Japan, 44, 25–43. DOI:10.2151/jmsj1965.44.1_25 |
| Nordeng, T. E., 1994: Extended Versions of the Convective Para- meterization Scheme at ECMWF and Their Impact on the Mean and Transient Activity of the Model in the Tropics. Technical Memorandum 206, Reading, UK, ECMWF, 41 pp. |
| Oueslati, B., and G. Bellon, 2015: The double ITCZ bias in CMIP5 models: Interaction between SST, large-scale circulation and precipitation. Climate Dyn., 44, 585–607. DOI:10.1007/s00382-015-2468-6 |
| Rayner, N. A., D. E. Parker, E. B. Horton, et al., 2003: Global analyses of sea surface temperature, sea ice, and night marine air temperature since the late nineteenth century. J. Geophys. Res. Atmos., 108, 4407. DOI:10.1029/2002JD002670 |
| Rong, X. Y., J. Li, H. M. Chen, et al., 2018: The CAMS climate system model and a basic evaluation of its climatology and climate variability simulation. J. Meteor. Res., 32, 839–861. DOI:10.1007/s13351-018-8058-x |
| Roundy, P. E., and W. M. Frank, 2004: A climatology of waves in the equatorial region. J. Atmos. Sci., 61, 2105–2132. DOI:10.1175/1520-0469(2004)061<2105:ACOWIT>2.0.CO;2 |
| Roundy, P. E., C. J. Schreck III, and M. A. Janiga, 2009: Contributions of convectively coupled equatorial Rossby waves and Kelvin waves to the real-time multivariate MJO indices. Mon. Wea. Rev., 137, 469–478. DOI:10.1175/2008MWR2595.1 |
| Straub, K. H., and G. N. Kiladis, 2002: Observations of a convectively coupled Kelvin wave in the eastern Pacific ITCZ. J. Atmos. Sci., 59, 30–53. DOI:10.1175/1520-0469(2002)059<0030:OOACCK>2.0.CO;2 |
| Straub, K. H., G. N. Kiladis, and P. E. Ciesielski, 2006: The role of equatorial waves in the onset of the South China Sea summer monsoon and the demise of El Niño during 1998. Dyn. Atmos. Oceans, 42, 216–238. DOI:10.1016/j.dynatmoce.2006.02.005 |
| Tiedtke, M., 1989: A comprehensive mass flux scheme for cumulus parameterization in large-scale models. Mon. Wea. Rev., 117, 1779–1800. DOI:10.1175/1520-0493(1989)117<1779:ACMFSF>2.0.CO;2 |
| Ventrice, M. J., C. D. Thorncroft, and M. A. Janiga, 2012a: Atlantic tropical cyclogenesis: A three-way interaction between an African easterly wave, diurnally varying convection, and a convectively coupled atmospheric Kelvin wave. Mon. Wea. Rev., 140, 1108–1124. DOI:10.1175/MWR-D-11-00122.1 |
| Ventrice, M. J., C. D. Thorncroft, and C. J. Schreck III, 2012b: Impacts of convectively coupled Kelvin waves on environmental conditions for Atlantic tropical cyclogenesis. Mon. Wea. Rev., 140, 2198–2214. DOI:10.1175/MWR-D-11-00305.1 |
| Wang, L., and L. Chen, 2016: Interannual variation of convectively-coupled equatorial waves and their association with environmental factors. Dyn. Atmos. Oceans, 76, 116–126. DOI:10.1016/j.dynatmoce.2016.10.004 |
| Wang, L., and L. Chen, 2017: Effect of basic state on seasonal variation of convectively coupled Rossby wave. Dyn. Atmos. Oceans, 77, 54–63. DOI:10.1016/j.dynatmoce.2016.11.002 |
| Wang, L., and T. Li, 2017: Convectively coupled Kelvin waves in CMIP5 coupled climate models. Climate Dyn., 48, 767–781. DOI:10.1007/s00382-016-3109-4 |
| Wheeler, M., and G. N. Kiladis, 1999: Convectively coupled equatorial waves: Analysis of clouds and temperature in the wavenumber–frequency domain. J. Atmos. Sci., 56, 374–399. DOI:10.1175/1520-0469(1999)056<0374:CCEWAO>2.0.CO;2 |
| Wheeler, M., G. N. Kiladis, and P. J. Webster, 2000: Large-scale dynamical fields associated with convectively coupled equatorial waves. J. Atmos. Sci., 57, 613–640. DOI:10.1175/1520-0469(2000)057<0613:LSDFAW>2.0.CO;2 |
| Yang, G.-Y., B. Hoskins, and J. Slingo, 2007: Convectively coupled equatorial waves. Part I: Horizontal and vertical structures. J. Atmos. Sci., 64, 3406–3423. DOI:10.1175/JAS4017.1 |
| Zhang, X. X., H. L. Liu, and M. H. Zhang, 2015: Double ITCZ in coupled ocean–atmosphere models: From CMIP3 to CMIP5. Geophys. Res. Lett., 42, 8651–8659. DOI:10.1002/2015GL065973 |
 2019, Vol. 33


