The Chinese Meteorological Society
Article Information
- CHEN, Mingcheng, Tim LI, and Xiaohui WANG, 2019.
- Asymmetry of Atmospheric Responses to Two-Type El Niño and La Niña over Northwest Pacific. 2019.
- J. Meteor. Res., 33(5): 826-836
- http://dx.doi.org/10.1007/s13351-019-9022-0
Article History
- Received February 13, 2019
- in final form July 19, 2019
2. International Pacific Research Center and Department of Atmospheric Sciences, School of Ocean and Earth Science and Technology, University of Hawaii at Manoa, Honolulu, HI 96822, USA
As the most important interannual signal, ENSO can influence the global climate (Rasmusson and Carpenter, 1982; Philander, 1990; Webster et al., 1998; Chang et al., 2000a, b; Chen et al., 2013; Chen et al., 2018). According to Rasmusson and Carpenter (1982), ENSO achieves its peak phase in winter. During the El Niño mature phase, an anomalous anticyclone often occurs over the western North Pacific (WNP), which is called the western North Pacific anomalous anticyclone (WNPAC). It can stay from the current winter to the next summer and has a profound impact on East Asian and WNP winter and summer monsoon and rainfall (Chang et al., 2000a, b; Wang et al., 2000; Li and Wang, 2005).
The role of WNPAC in corresponding El Niño and East Asian climate is introduced in two sets of studies (Zhang et al., 1996; Chang et al., 2000a, b; Wang et al., 2000). Both sets of studies found that in the WNP, an anomalous anticyclone shows up, and it persists from the current winter to the decaying summer. The physical process of the WNPAC influencing rainfall in East Asia during the decaying summer is summarized as follows (Chang et al., 2000a). First of all, the WNPAC prevents Meiyu fronts from moving southward, thus prolonging stationary rainfall. Second, it amplifies the pressure gradient to its northwest, leading to more intense front and rainfall. Third, the easterly anomalies of anomalous anticyclone induce positive heating anomaly by increasing downwelling, thus higher moisture. High mean moisture is transported to the subtropical East Asia by the southerly anomalies of the WNPAC.
The formation mechanisms of the WNPAC have been proposed in many previous studies, and Li et al. (2017) discussed these mechanisms in details. Two of the mechanisms are mostly relevant in winter. The first theory is based on air–sea interaction, which is proposed by Wang et al. (2000). Based on the Gill model (Gill, 1980), the anomalous heating is enhanced due to positive sea surface temperature anomaly (SSTA) over the equatorial central–eastern Pacific (CEP) in El Niño winter, which may induce an anomalous cyclonic Rossby wave response. To the west side of the anomalous cyclone, the abnormal northeasterly enhances the northeasterly trade wind, which strengthens evaporation on surface, inducing negative SSTA and suppressing local convection. The negative anomaly of heating can further stimulate an anticyclonic anomaly in the tropical WNP. The other theory is the moist enthalpy advection and Rossby wave modulation mechanism (Wu et al., 2017a,b). Different to the first theory, it is a pure atmospheric process. The northerly anomalies of the anomalous cyclone, which is induced by positive heating anomaly over the CEP, advect dry air to equatorial Pacific, suppressing convection in situ and inducing an anomalous anticyclone.
Wu et al. (2010) showed that atmospheric responses to heating anomaly of La Niña and El Niño are asymmetric over the WNP. In La Niña, the anomalous cyclone (e.g., WNPC) center shifts westward relative to that in El Niño, and the size of WNPC is smaller than WNPAC. Wu et al. (2010) proposed that there are two factors that are mainly responsible for the asymmetry. One is the longitudinal shifting of heating anomalies over the CEP between La Niña and El Niño, and the other is the asymmetry of local SSTA amplitude. Wu et al. (2010) focused on the second factor and explained the cause of the asymmetry based on the local interaction between air and sea. Mean zonal wind speed is small in the crux region of WNP during the ENSO developing summer. Both easterly anomalies in La Niña and westerly anomalies in El Niño cause enhanced evaporation, weaken the warming in La Niña, and strengthen the cooling in El Niño, which results in the asymmetric local SSTA tendencies between La Niña and El Niño, and further leads to asymmetric local SSTA and atmospheric responses.
The asymmetry of WNPAC and WNPC is important to the evolution of asymmetric La Niña and El Niño (Wu et al., 2010; Chen et al., 2016); thus, it can induce different rainfall features during both winter and decaying summer in East Asia (Wu et al. 2010; Tao et al., 2017).
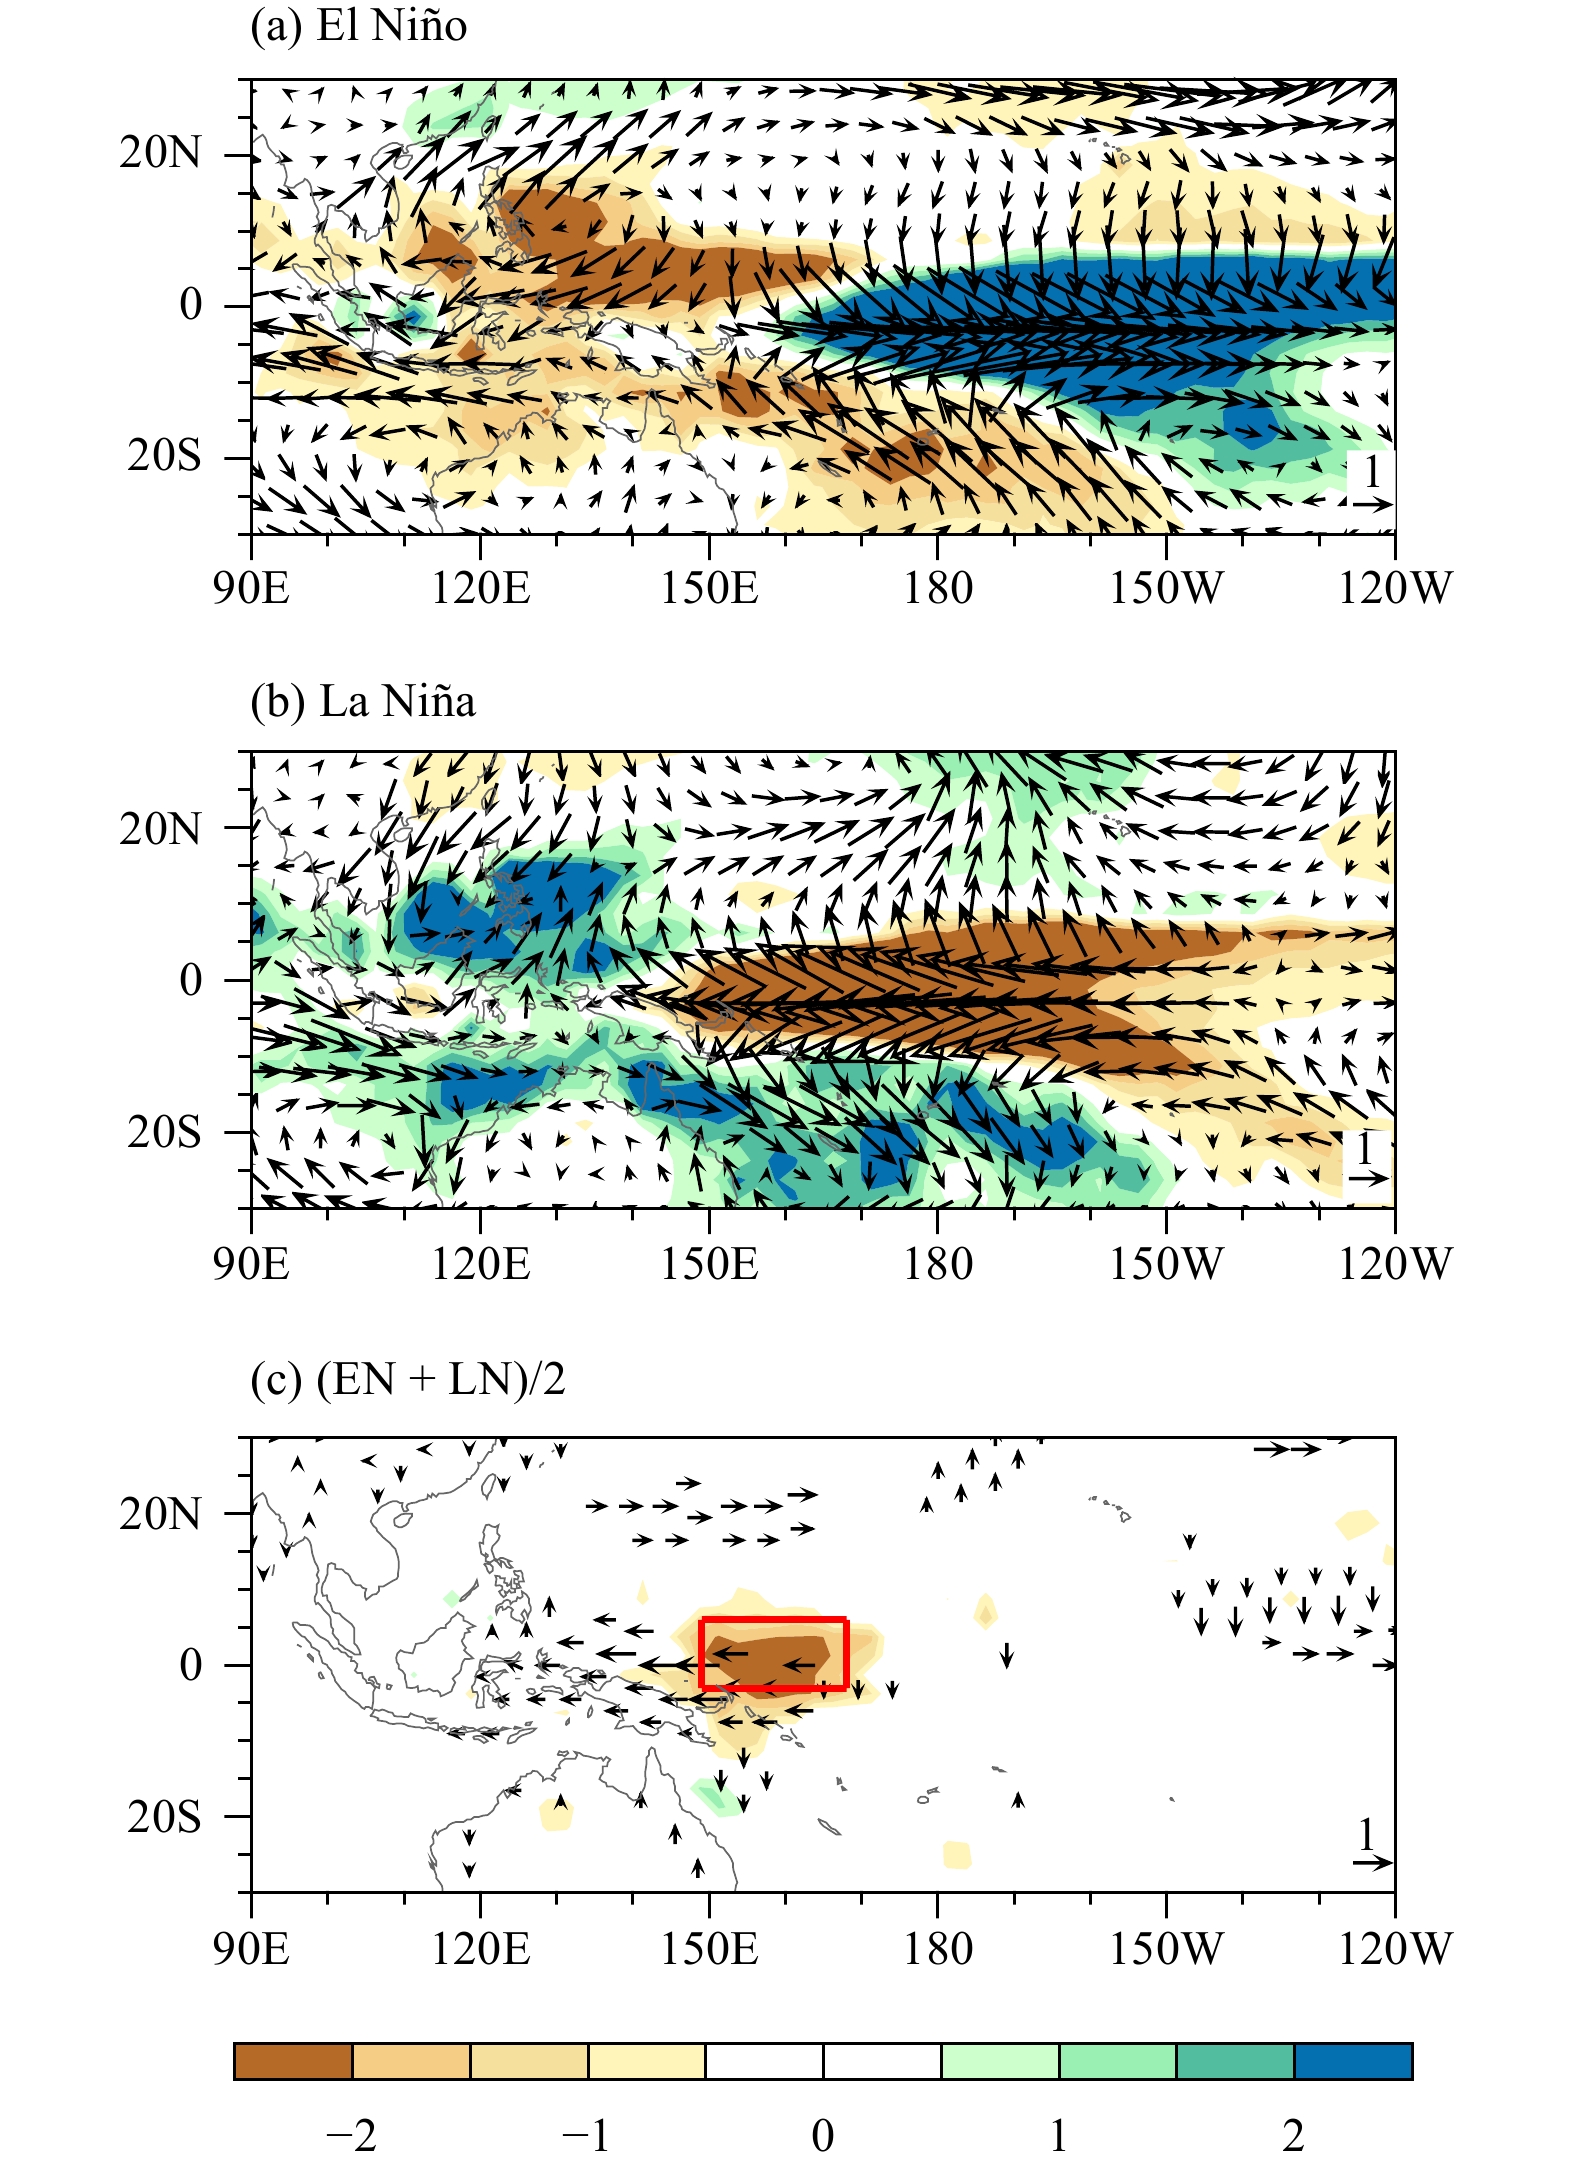
Our studies show that the asymmetry of WNPAC and WNPC is caused by a nonlinear atmospheric process (Wang et al., 2019). We also found that negative rainfall and an anomalous anticyclone occupy the tropical WNP in El Niño winter (Fig. 1a), while the anomalous cyclone and positive precipitation in La Niña divert to the west of El Niño counterpart (Fig. 1b). The anti-symmetric component of La Niña and El Niño is dominated by negative precipitation anomalies and an anticyclone anomaly in the WNP (Fig. 1c). In (Wang et al., 2019), the cause of asymmetric negative precipitation anomalies was investigated to reveal the mechanism responsible for asymmetric atmospheric circulation response, and the column integrated moist static energy (MSE) equations were diagnosed. The result of moisture budget shows that the negative rainfall anomalies are caused by descending anomalies (term 6 in Table 1) in the key region (red box in Fig. 1c). Further analysis reveals that the nonlinear advection of anomalous moist enthalpy (term 7 of MSE budget) is the major term that leads to downward anomalies during both La Niña and El Niño winters, indirectly resulting in asymmetric circulation responses to La Niña and El Niño.
|
| Figure 1 Wind (vector; m s–1) at 925 hPa and D(0)JF(1)-mean rainfall (shadow; mm day–1) anomalies for (a) El Niño (EN), (b) La Niña (LN), and (c) their anti-symmetric component [(EN + LN)/2]. Year 0 (1) represents the ENSO developing (decaying) year. In (c), only the values of the precipitation and wind anomalies passing the 10% significance level are shown. |
| Moisture budget (mm day−1) | MSE budget (W m−2) | ||||||||||||||
| P' | E' |
|
|
|
|
NL |
|
F'net |
|
|
|
|
|
||
| EN | –0.61 | 0.04 | 0.04 | 0.16 | –0.04 | –0.81 | –0.33 | –5.60 | 4.07 | 1.02 | 3.37 | –4.07 | 6.22 | –14.70 | |
| LN | –3.18 | –0.11 | –0.14 | –0.28 | –0.22 | –2.00 | –0.45 | –20.85 | –14.20 | –6.23 | –6.02 | –5.32 | 8.49 | –21.72 | |
El Niño can be classified into two types: the eastern Pacific (EP) and central Pacific (CP) El Niño, according to the spatial pattern of positive SSTA over CEP (Larkin and Harrison, 2005;Ashok et al., 2007). The maximum of positive SSTA for EP El Niño exists near the coast of South America, while the center of positive SSTA in CP El Niño is around the dateline. The asymmetry of atmospheric responses to EP El Niño and La Niña can be attributed to the first factor mentioned above, namely longitudinal shifting of heating anomalies. The SSTA patterns are approximately symmetric between CP El Niño and La Niña, but the reason for asymmetric circulation anomalies in CP El Niño and La Niña is different from EP El Niño and La Niña.
The work mentioned above (Wang et al., 2019) composited EP and CP El Niño together, and ignored the difference between them. The current study will further reveal the physical mechanism in causing the asymmetry between CP El Niño and La Niña. It is known that the amplitude of EP El Niño is often larger than CP El Niño (Chung and Li, 2013; Zheng et al., 2014), and most of super El Niño events are EP El Niño, such as those in 1972, 1982, and 1997. Are the circulation anomalies over tropical WNP during EP and CP El Niño winters different? What is the physical mechanism responsible for the difference between them? We will focus on these three questions in the present study.
The rest of the paper is arranged as follows. The datasets and methods are introduced in Section 2. The cause of asymmetric atmospheric circulation anomalies be-tween CP El Niño and La Niña are investigated in Section 3. Section 4 discusses the difference of circulation anomalies between two types of El Niño. The conclusions and discussion are given in Section 5.
2 Datasets and methods 2.1 DatasetsThe monthly precipitation in the study is derived from the Global Precipitation Climatology Project (GPCP). Monthly SST we used is from the Met Office Hadley Centre’s sea ice and SST dataset (HadISST; Rayner et al., 2003). Atmospheric variables such as wind, temperature, geopotential height, and heat fluxes are from the interim reanalysis products of ECMWF (ERA-Interim; Dee et al., 2011). The horizontal resolutions are 2.5° × 2.5°, 1° × 1°, and 1.5° × 1.5° for the GPCP, HadISST, and ERA-Interim data, respectively. The study period is from 1979 to 2016 for all analyses.
2.2 MethodsSix CP El Niño, five La Niña, and three EP El Niño events are selected during 1979–2016 (Table 2). Based on the threshold of 3-month running mean Niño3.4 index (the area-averaged SSTA over the region 5°S–5°N, 120°–170°W), El Niño and La Niña events are determined. Year 0 (1) represents the ENSO developing (decaying) year. EP and CP El Niño events are defined by the spatial pattern of positive SSTA centers, when the center is east (west) of 130°W (i.e., center of 180°–80°W), an EP (CP) El Niño event is defined.
| ENSO type | ENSO year |
| CP El Niño | 1991, 1994, 2002, 2004, 2009, 2015 |
| EP El Niño | 1982, 1987, 2006 |
| La Niña | 1983, 1995, 1998, 2007, 2010 |
A moisture equation is diagnosed to explain the generation of negative rainfall anomalies over the tropical WNP (Wu et al., 2017a), and it can be written as:
| $ {\partial _t} < q{ > '} + < { V}\cdot{\nabla _h}q{ > '} + \left\langle {\omega {\partial _p}q} \right\rangle ' = E' - P', $ | (1) |
in which angle bracket is the mass integral from 1000 to 100 hPa, prime represents monthly anomaly with annual cycle removed, E denotes evaporation, and P represents precipitation. According to Wu et al. (2017a), the first term in Eq. (1) is much smaller than other terms on the interannual timescale, so it can be neglected. Equation (1) can be written as follows after linearization:
| $P' \cong E' - \left\langle {\overline { V} \cdot {\nabla _h}q'} \right\rangle - \left\langle { V' \cdot{\nabla _h}\bar q} \right\rangle - \left\langle {\bar \omega {\partial _p}q'} \right\rangle - \left\langle {\omega '{\partial _p}\bar q} \right\rangle + {\rm NL},$ | (2) |
where bar represents the annual cycle of multi-year data, and NL represents the total of the nonlinear terms. As seen from Table 1, the tropical rainfall anomalies are primarily caused by anomalous vertical motion [the 5th term on the righ-hand side of Eq. (2)]. The MSE equation is diagnosed to comprehend the vertical movement (Neelin and Held, 1987; Wu et al., 2017a). The anomalous MSE equation is written as (Neelin, 2007):
| ${\partial _t}\left\langle {\left({{c_p}T + {L_v}q} \right)} \right\rangle ' + < { V}\cdot{\nabla _h}\left({{c_p}T + {L_v}q} \right){ > '} + < \omega {\partial _p}h{ > '} = {{F}_{\rm net}'},$ | (3) |
in which cpT
+ Lvq
is moist enthalpy,
| $\begin{split} \left\langle {\omega '{\partial _p}\bar h} \right\rangle \cong & F_{\rm net}' - \left\langle {\overline { V}\cdot {\nabla _h}{{\left({{c_p}T + {L_v}q} \right)}'}} \right\rangle - \left\langle {{{ V}'}\cdot{\nabla _h}\overline {\left({{c_p}T + {L_v}q} \right)} } \right\rangle \\ & -\left\langle {\bar \omega {\partial _p}h'} \right\rangle - \left\langle {\omega '{\partial _p}h'} \right\rangle - \left\langle {{ V'}\cdot{\nabla _h}{{\left({{c_p}T + {L_v}q} \right)}'}} \right\rangle . \end{split}$ | (4) |
In Eq. (4), the rightmost two terms are nonlinear.
To measure the anti-symmetric patterns between La Niña and El Niño quantitatively, the anti-symmetric components for each physical variable are defined as the average of La Niña and El Niño (Hoerling et al., 1997; Wu et al., 2010).
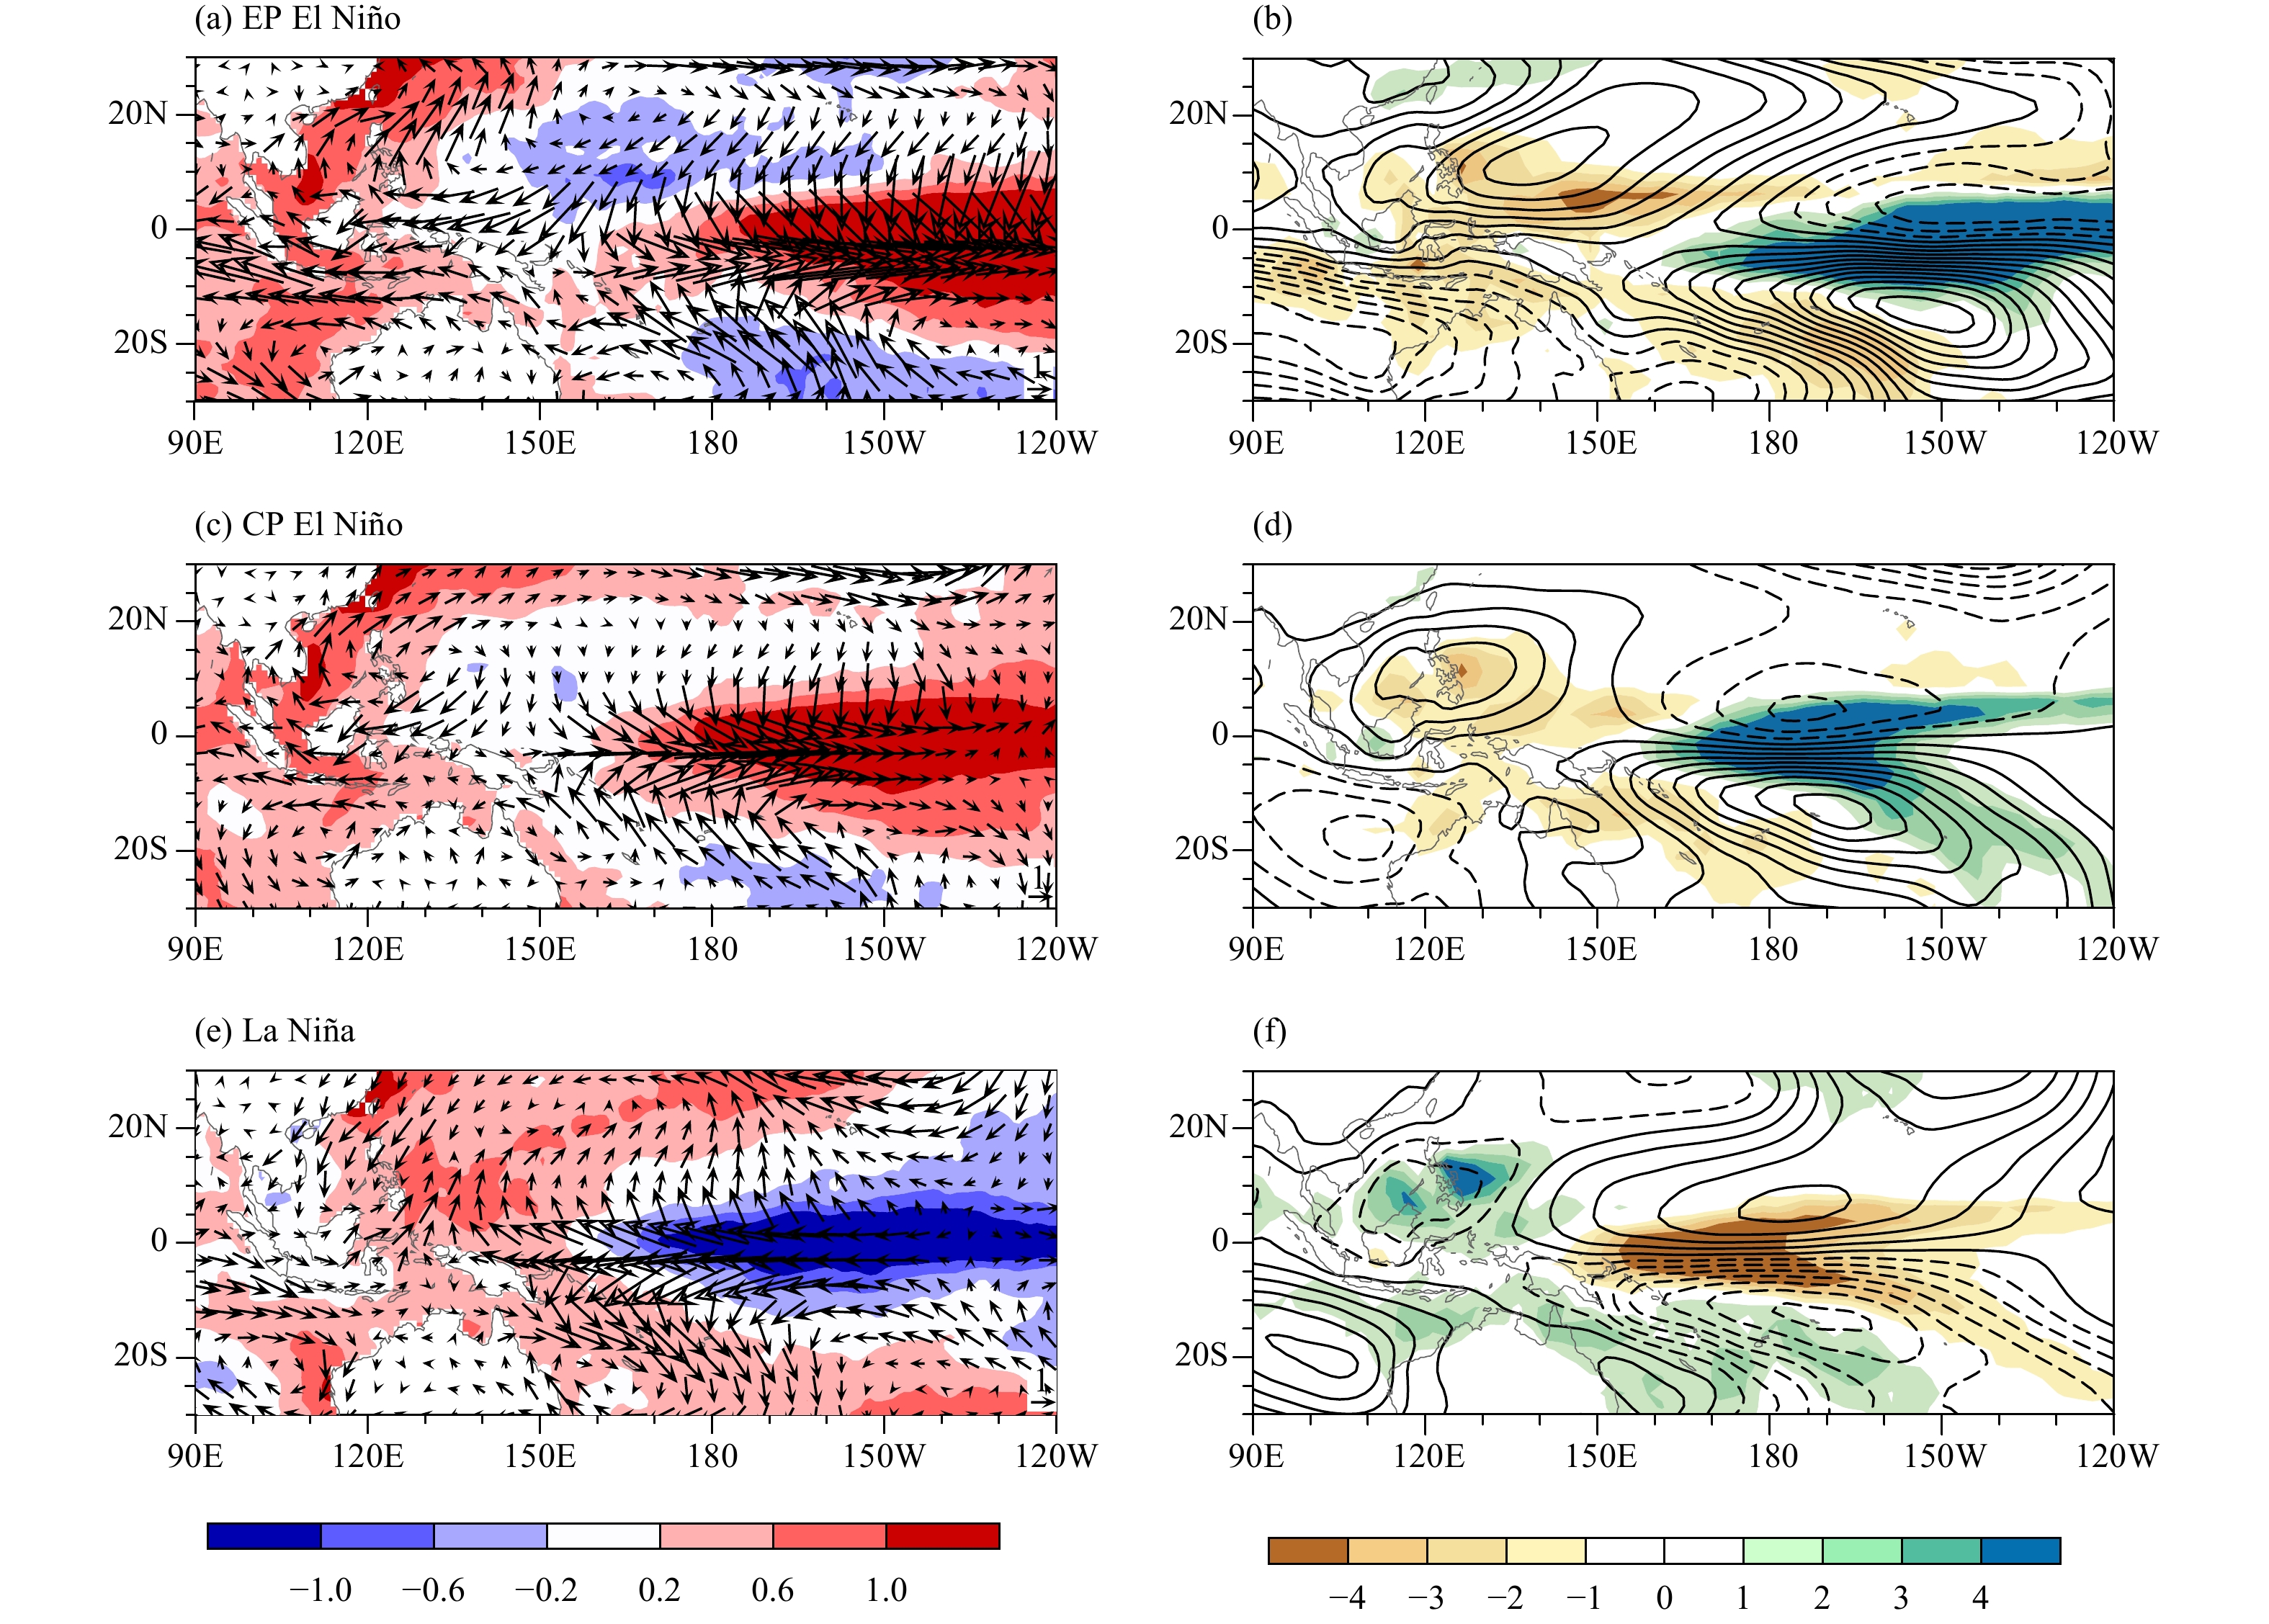
3 Physical mechanism for asymmetric atmospheric responses to CP El Niño and La Niña 3.1 Asymmetric circulation patternFigure 2 shows the D(0)JF(1)-mean spatial distributions of anomalous low-level wind, SST, precipitation, and stream function in the EP and CP El Niño, and La Niña composites. The positive SSTA occupies the equatorial CEP (Fig. 2a), with v-shaped negative SSTA on its west in EP El Niño winter. An anomalous large-scale anticyclone appears to the west of negative SSTA. The precipitation anomalies correspond well to SSTA in the tropical Pacific, but shift slightly westward (Fig. 2b). Similar with EP El Niño, the WNP is controlled by an anomalous anticyclone and weaker negative SSTA in CP El Niño winter (Fig. 2c). The center of positive SSTA over CEP shifts westward relative to EP El Niño. The precipitation and stream function anomalies also shift to the west compared with EP El Niño (Fig. 2d), and the anomalous anticyclone and negative precipitation anomalies are much weaker in intensity. In La Niña winter, the patterns of wind anomalies and SSTAs are contrary to those in EP and CP El Niño (Fig. 2e). A small cyclone and positive SSTA appear in the WNP. The precipitation anomalies are in consistent with SSTA (Fig. 2f). The center of SSTA over tropical CEP is near 160°W in CP El Niño and 165°W in La Niña, and the amplitude of positive SSTA is 1.9°C in CP El Niño, while the amplitude of negative SSTA is –1.8°C during La Niña. It is important to note that the SSTAs are approximately symmetric over the CEP between CP El Niño and La Niña, the center of anomalous anticyclone is east of Philippines in CP El Niño, while the center of anomalous cyclone is in the South China Sea in La Niña. Though the amplitude of negative SSTA in CP El Niño is much smaller than that of positive SSTA in La Niña (Figs. 2c, e), the anticyclone anomaly in CP El Niño is stronger than the cyclone anomaly in La Niña (Figs. 2d, f).
|
| Figure 2 (a, c, e) D(0)JF(1)-mean SST (shaded; °C) and 925-hPa wind anomalies (vector; m s−1), and (b, d, f) precipitation (shadow; mm day−1) and stream function anomalies [contour with an interval of 0.4 × 10⁶ m2 s−1; solid (dashed) lines are positive (negative)] at 925 hPa for (a, b) EP El Niño, (c, d) CP ElNiño, and (e, f) La Niña composites. |
To better characterize the asymmetric features be-tween EP El Niño, CP El Niño, and La Niña, the anti-symmetric components are revealed (Fig. 3). The anti-symmetric component is dominated by negative precipitation anomalies and an anomalous anticyclone in the WNP in the composite of EP El Niño and La Niña (Fig. 3a). The negative SSTA is west of negative precipitation anomalies in the anti-symmetric component (Fig. 3b). Note that the anti-symmetric components of precipitation and circulation anomalies between CP El Niño and La Niña are similar to those between EP El Niño and La Niña over the WNP (Fig. 3c). In the anti-symmetric component of CP El Niño and La Niña, intensities of negative rainfall and circulation anomalies are weaker and the SSTAs are almost positive in the tropical Pacific (Fig. 3d), suggesting that the local air–sea interaction is not a major process that causes negative precipitation anomalies. The reason of asymmetric negative precipitation anomalies in the crux region (red box inFig. 3) are investigated next.

|
| Figure 3 (a, c) Anti-symmetric component of D(0)JF(1)-mean precipitation (shadow; mm day−1) and stream function anomalies at 925 hPa [contour; at intervals of 0.2 × 10⁶ m2 s−1; solid (dashed) lines denote positive (negative)], and (b, d) wind (vector; m s−1) and SST (shadow; °C) anomalies at 925 hPa between (a, b) La Niña and EP El Niño, and (c, d) CP El Niño and La Niña |
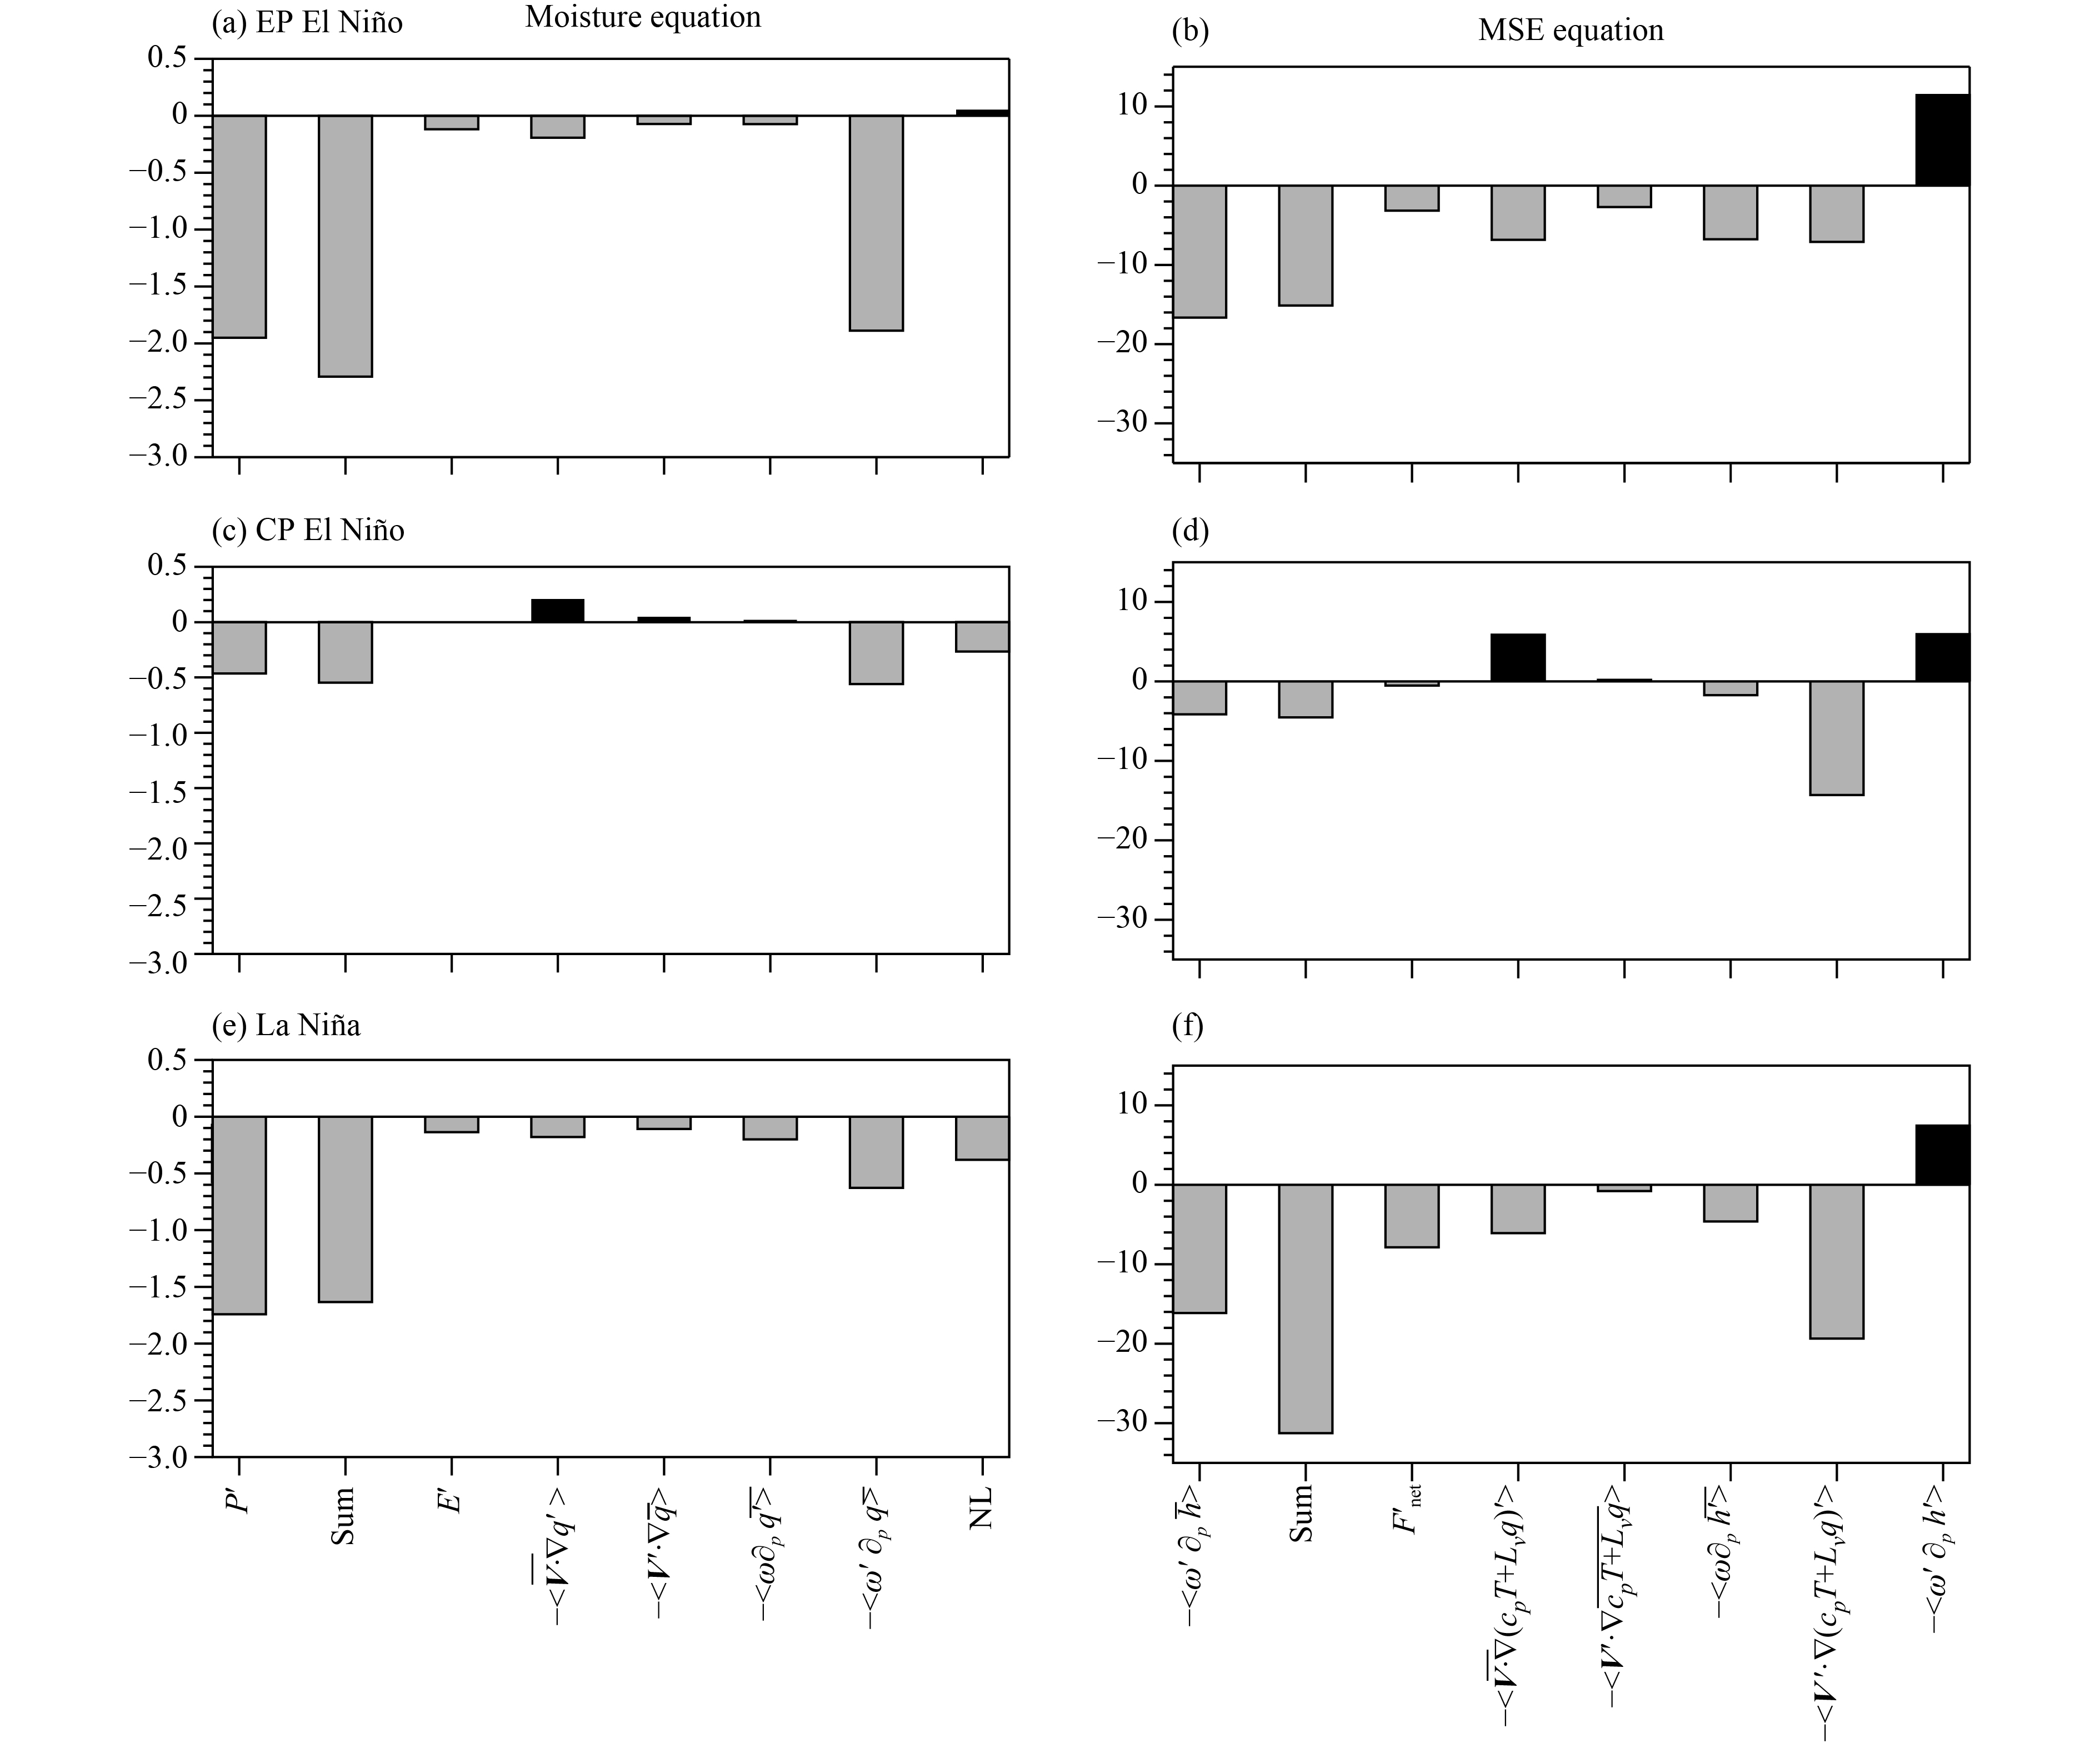
The moisture equation is diagnosed to explain the generation of negative precipitation anomalies in anti-symmetric components (Figs. 3a, c), and the region to diagnose is 5°S–10°N, 140°–170°E (red box in Fig. 3). The moisture budget result shows that the negative anomalies of rainfall are mainly due to the negative advection of climatological specific humidity by downward air motion anomalies [
|
| Figure 4 Analysis results of (a, c, e) moisture budget (mm day−1) and (b, d, f) moist static energy budget (W m−2) for (a, b) EP El Niño, (c, d) CP El Niño, and (e, f) La Niña composite over 5°S–10°N, 140°–170°E |
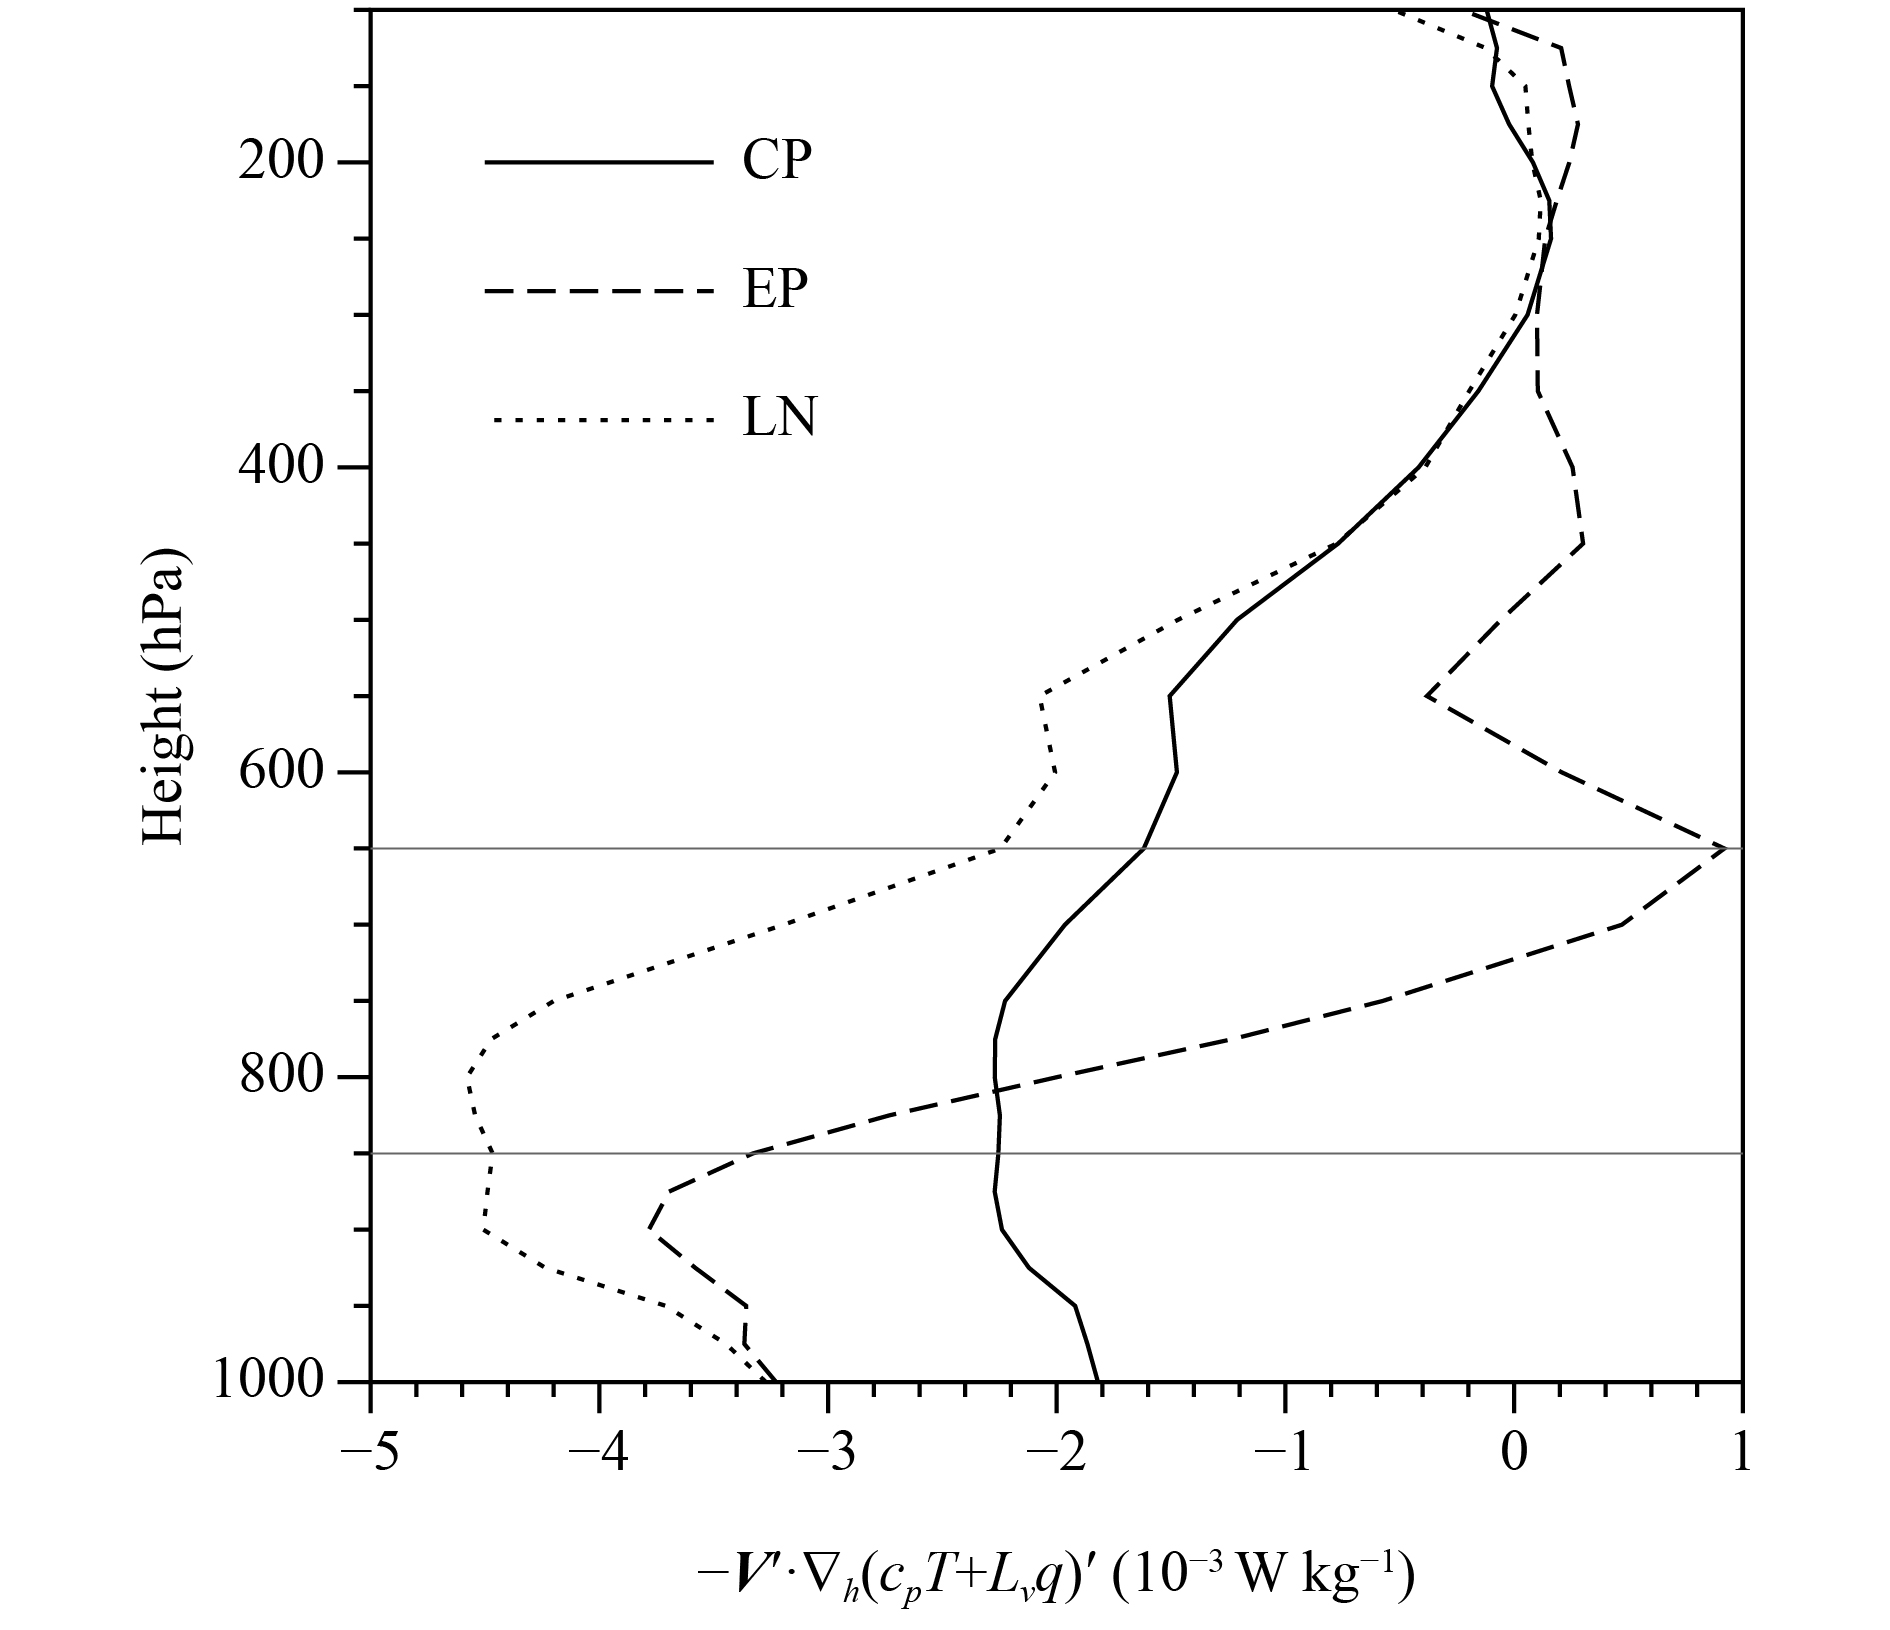
As is demonstrated in Fig. 5, the nonlinear term [
|
|
Figure 5 Vertical profile of box-averaged
|
|
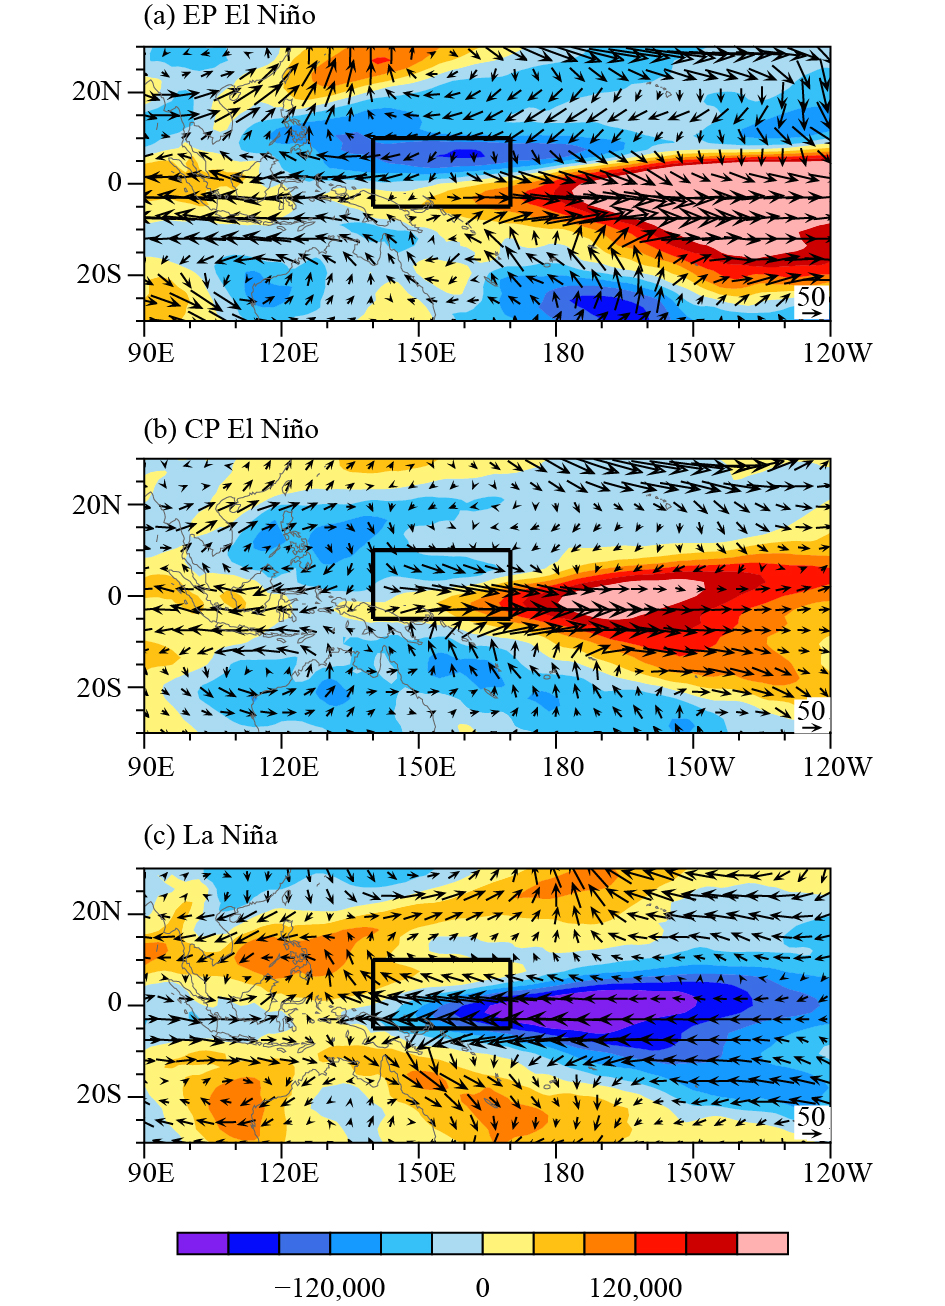
| Figure 6 Composite D(0)JF(1)-mean 1000–500-hPa integrated moist enthalpy (shading; 102 J m−2) and wind (vector; 102 kg m−1 s−1) anomalies during (a) EP El Niño, (b) CP El Niño, and (c) La Niña winters. The range of black box is the same as that of red box in Fig. 3. |
The analyses above show that the negative moist enthalpy advection leads to descending anomalies in the key WNP region (Fig. 3) in both winters. The descending anomalies suppress local convection and further induce an anomalous anticyclone (Fig. 3c), strengthening (weakening) the abnormal anticyclone (cyclone) in CP El Niño (La Niña), which results in the asymmetry of anomalous circulation between them.
4 The difference between EP and CP El Niño 4.1 The amplitude difference of nonlinear moist enthalpy advectionAs is mentioned above, based on Bjerknes feedback (Bjerknes, 1969), the SSTA amplitude is smaller in CP El Niño (Zheng et al., 2014). Meanwhile, the anomalous moist enthalpy and atmospheric response are smaller (Figs. 6a, b). However, in the MSE budget result, the nonlinear term [
The vertical profile of the nonlinear term (Fig. 5) indicates the area-averaged nonlinear term is negative below 500 hPa in CP El Niño, but it turns positive near 700 hPa, and reaches its maximum at 650 hPa during EP El Niño. The key to explain the amplitude difference of nonlinear term between CP and EP El Niño lies in understanding the cause of the difference above 700 hPa. The anomalous wind and moist enthalpy above and below 700 hPa are illustrated in Fig. 7. The positive moist enthalpy anomalies over CEP induce an anomalous cyclo-nic Rossby wave response in EP El Niño at 850 hPa (Fig. 7a). The northeasterly anomalies to the western flank of the anomalous cyclone transport low moist enthalpy anomalies southward, causing negative moist enthalpy advection. Similar to EP El Niño, the northwesterly anomalies of the anomalous cyclonic Rossby wave response to positive moist enthalpy anomalies cause negative moist enthalpy advection in CP El Niño (Fig. 7c). The wind anomalies in CP El Niño are weaker, with weaker negative moist enthalpy advection (Fig. 7e), which is corresponding to the vertical profile of the nonlinear term (Fig. 5). It is quite different at 650 hPa. The moist enthalpy anomalies are similar with 850 hPa, with slightly westward shifting. In EP El Niño, the key region is on the west side of the anomalous cyclone, which is dominated by the southwesterly anomalies of the southern branch of cyclonic Rossby wave (Fig. 7b). The southwesterly anomalies advect high moist enthalpy anomalies northward, leading to positive moist enthalpy advection. In contrast, the westerly anomalies on the southern flank of the anomalous cyclone cause negative moist enthalpy advection in CP El Niño (Fig. 7d). For the entire low level, the positive advection above 700 hPa offsets partial negative advection below 700 hPa in EP El Niño, leading to a smaller negative nonlinear term (Fig. 4b). While anomalous moist enthalpy advection is negative above 700 hPa in CP El Niño, amplifying the negative advection below 700 hPa, causing nonlinear term to be 1.7 times larger than that in EP El Niño, which can also be derived from Figs. 7e, f.

|
|
Figure 7 Composite moist enthalpy (shaded; J kg–1) and D(0)JF(1)-mean wind anomalies (vector; m s–1) at (a, c, e) 850 and (b, d, f) 650 hPa during (a, b) EP El Niño and (c, d) CP El Niño. The red box denotes the key region. (e, f) The zonal (red) and meridional (blue) advection of nonlinear moist enthalpy [
|
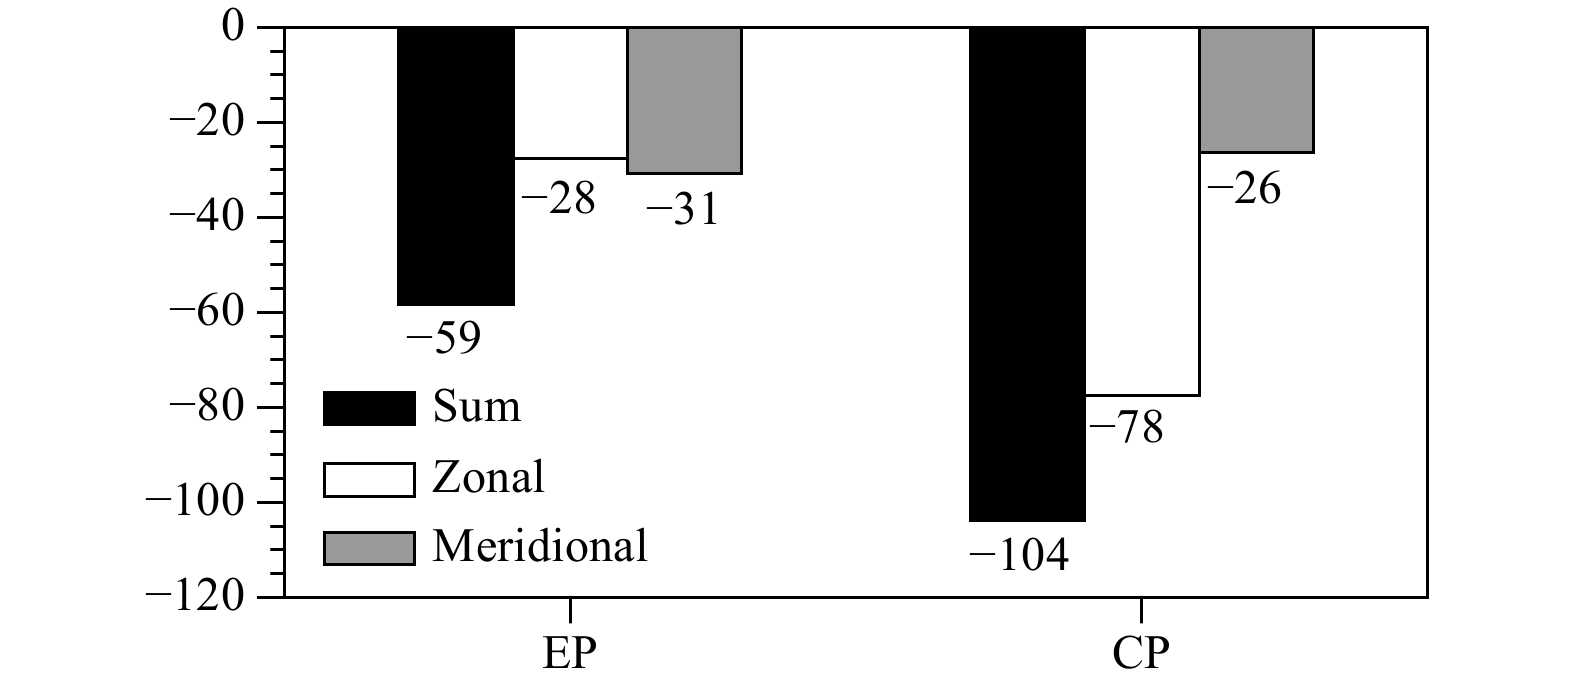
The budget analyses are based on the entire column (1000–100 hPa), and the meridional and zonal advection terms are both considered. A question arises as to which term is more important? The 1000–100-hPa integrated zonal and meridional nonlinear terms are calculated to solve the question. The meridional and zonal advection terms are close in magnitude in EP El Niño (Fig. 8), while the zonal advection is much larger (3 times) than meridional advection in CP El Niño. The zonal and meridional advection terms are both negative in winters below 700 hPa (Fig. 7e). The meridional advection contributes more to the nonlinear term in EP El Niño, whereas the zonal advection has a larger contribution during CP El Niño. The meridional advection is a major contributor to positive nonlinear term while the zonal advection has negative contribution in EP El Niño above 700 hPa (Fig. 7f). In addition, the zonal advection is a major contributor to nonlinear term but meridional advection contributes little in CP El Niño. The positive meridional advection above 700 hPa offsets partial negative meridional advection below 700 hPa in EP El Niño, and the zonal advection is constant, so the zonal and meridional advection values of nonlinear term are similar. The meridional advection has little contribution above 700 hPa in CP El Niño, resulting in 3 times smaller values than zonal advection for the entire column integrated result.
|
| Figure 8 D(0)JF(1)-mean nonlinear zonal (white) and meridional (gray) advection anomalies of moist enthalpy (10−3 W m−2) integrated between 1000 and 100 hPa and averaged over 5°S–10°N, 140°–170°E (red box in Fig. 3). Black bar represents the total of zonal and meridional advection. “EP” (“CP”) represents EP (CP) El Niño. |
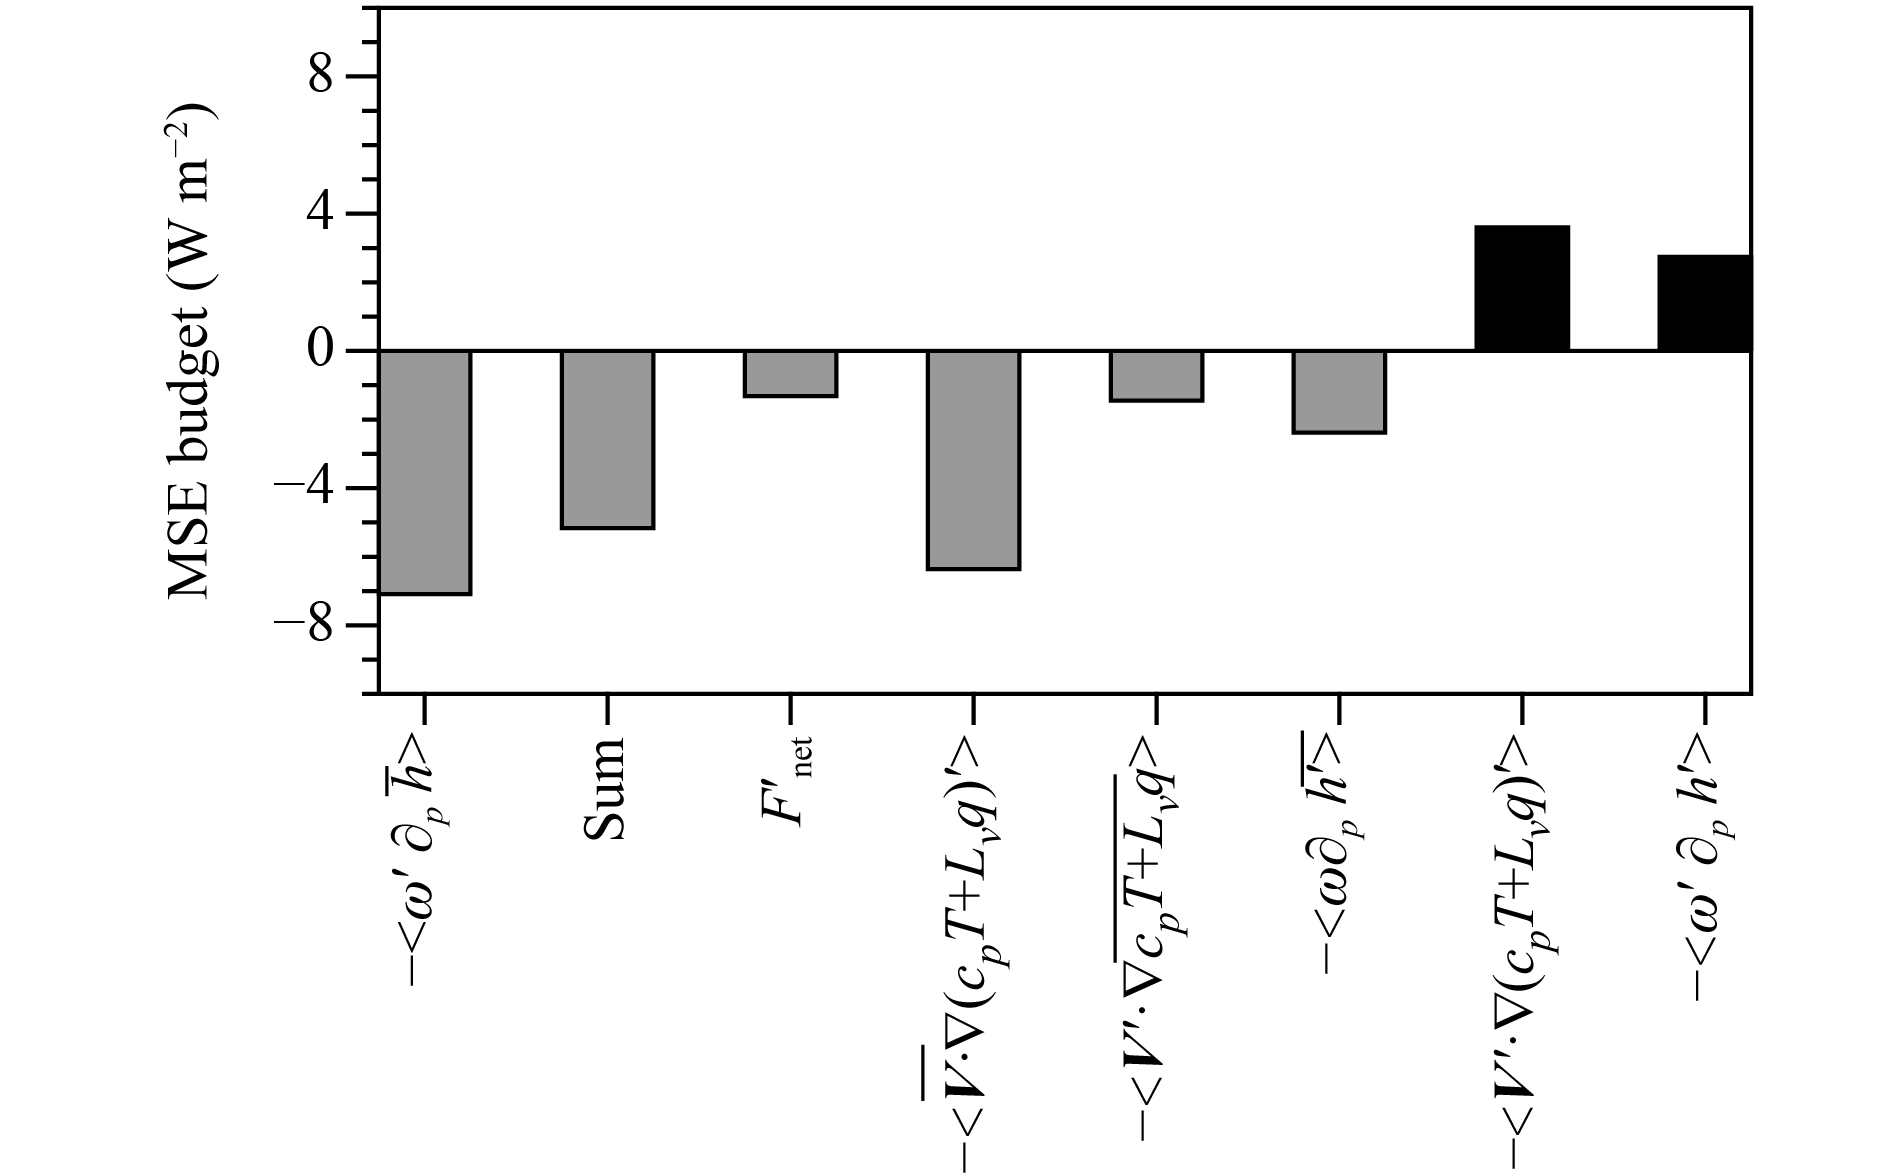
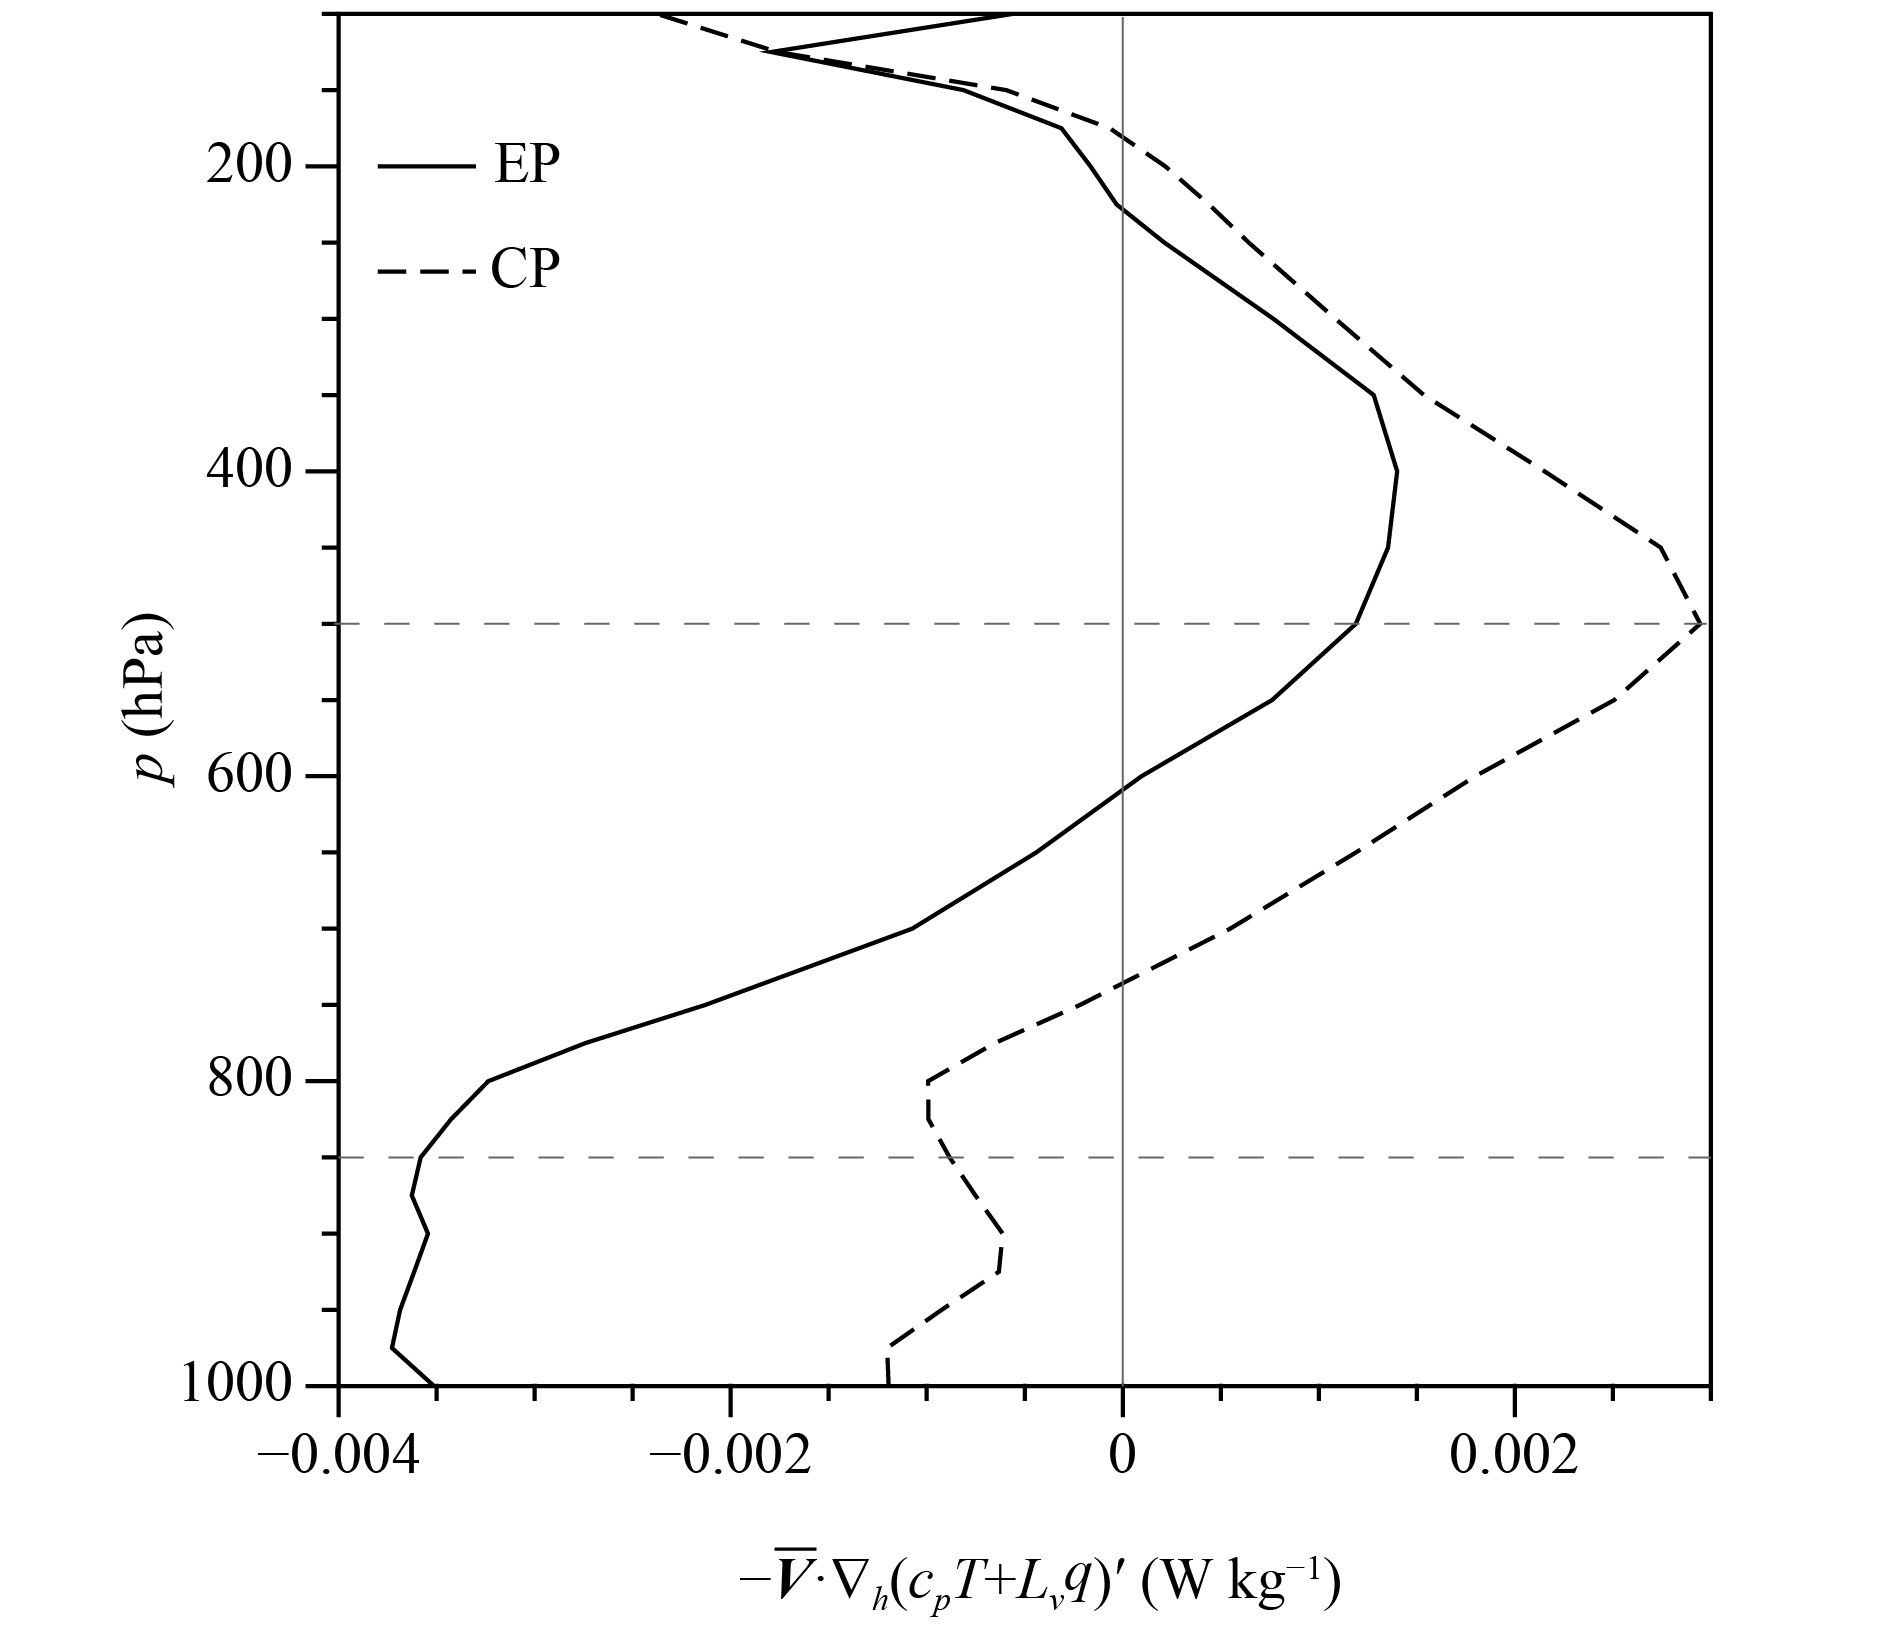
The MSE budget analysis shows a weaker nonlinear term in EP El Niño relative to CP El Niño (Figs. 4b, d), while the negative precipitation anomalies are greater in EP El Niño (Figs. 2b, d). The effect of local negative SSTA is an important factor causing the difference in precipitation anomalies between EP and CP El Niño, but here we focus on the pure atmospheric process. In Fig. 9, the major difference between them is the linear term [
|
| Figure 9 MSE budget (W m–2) analysis result for the difference in various terms between EP and CP El Niño over 5°S–10°N, 140°–170°E (red box in Fig. 3). |
|
|
Figure 10 The vertical profile of box-averaged
|
|
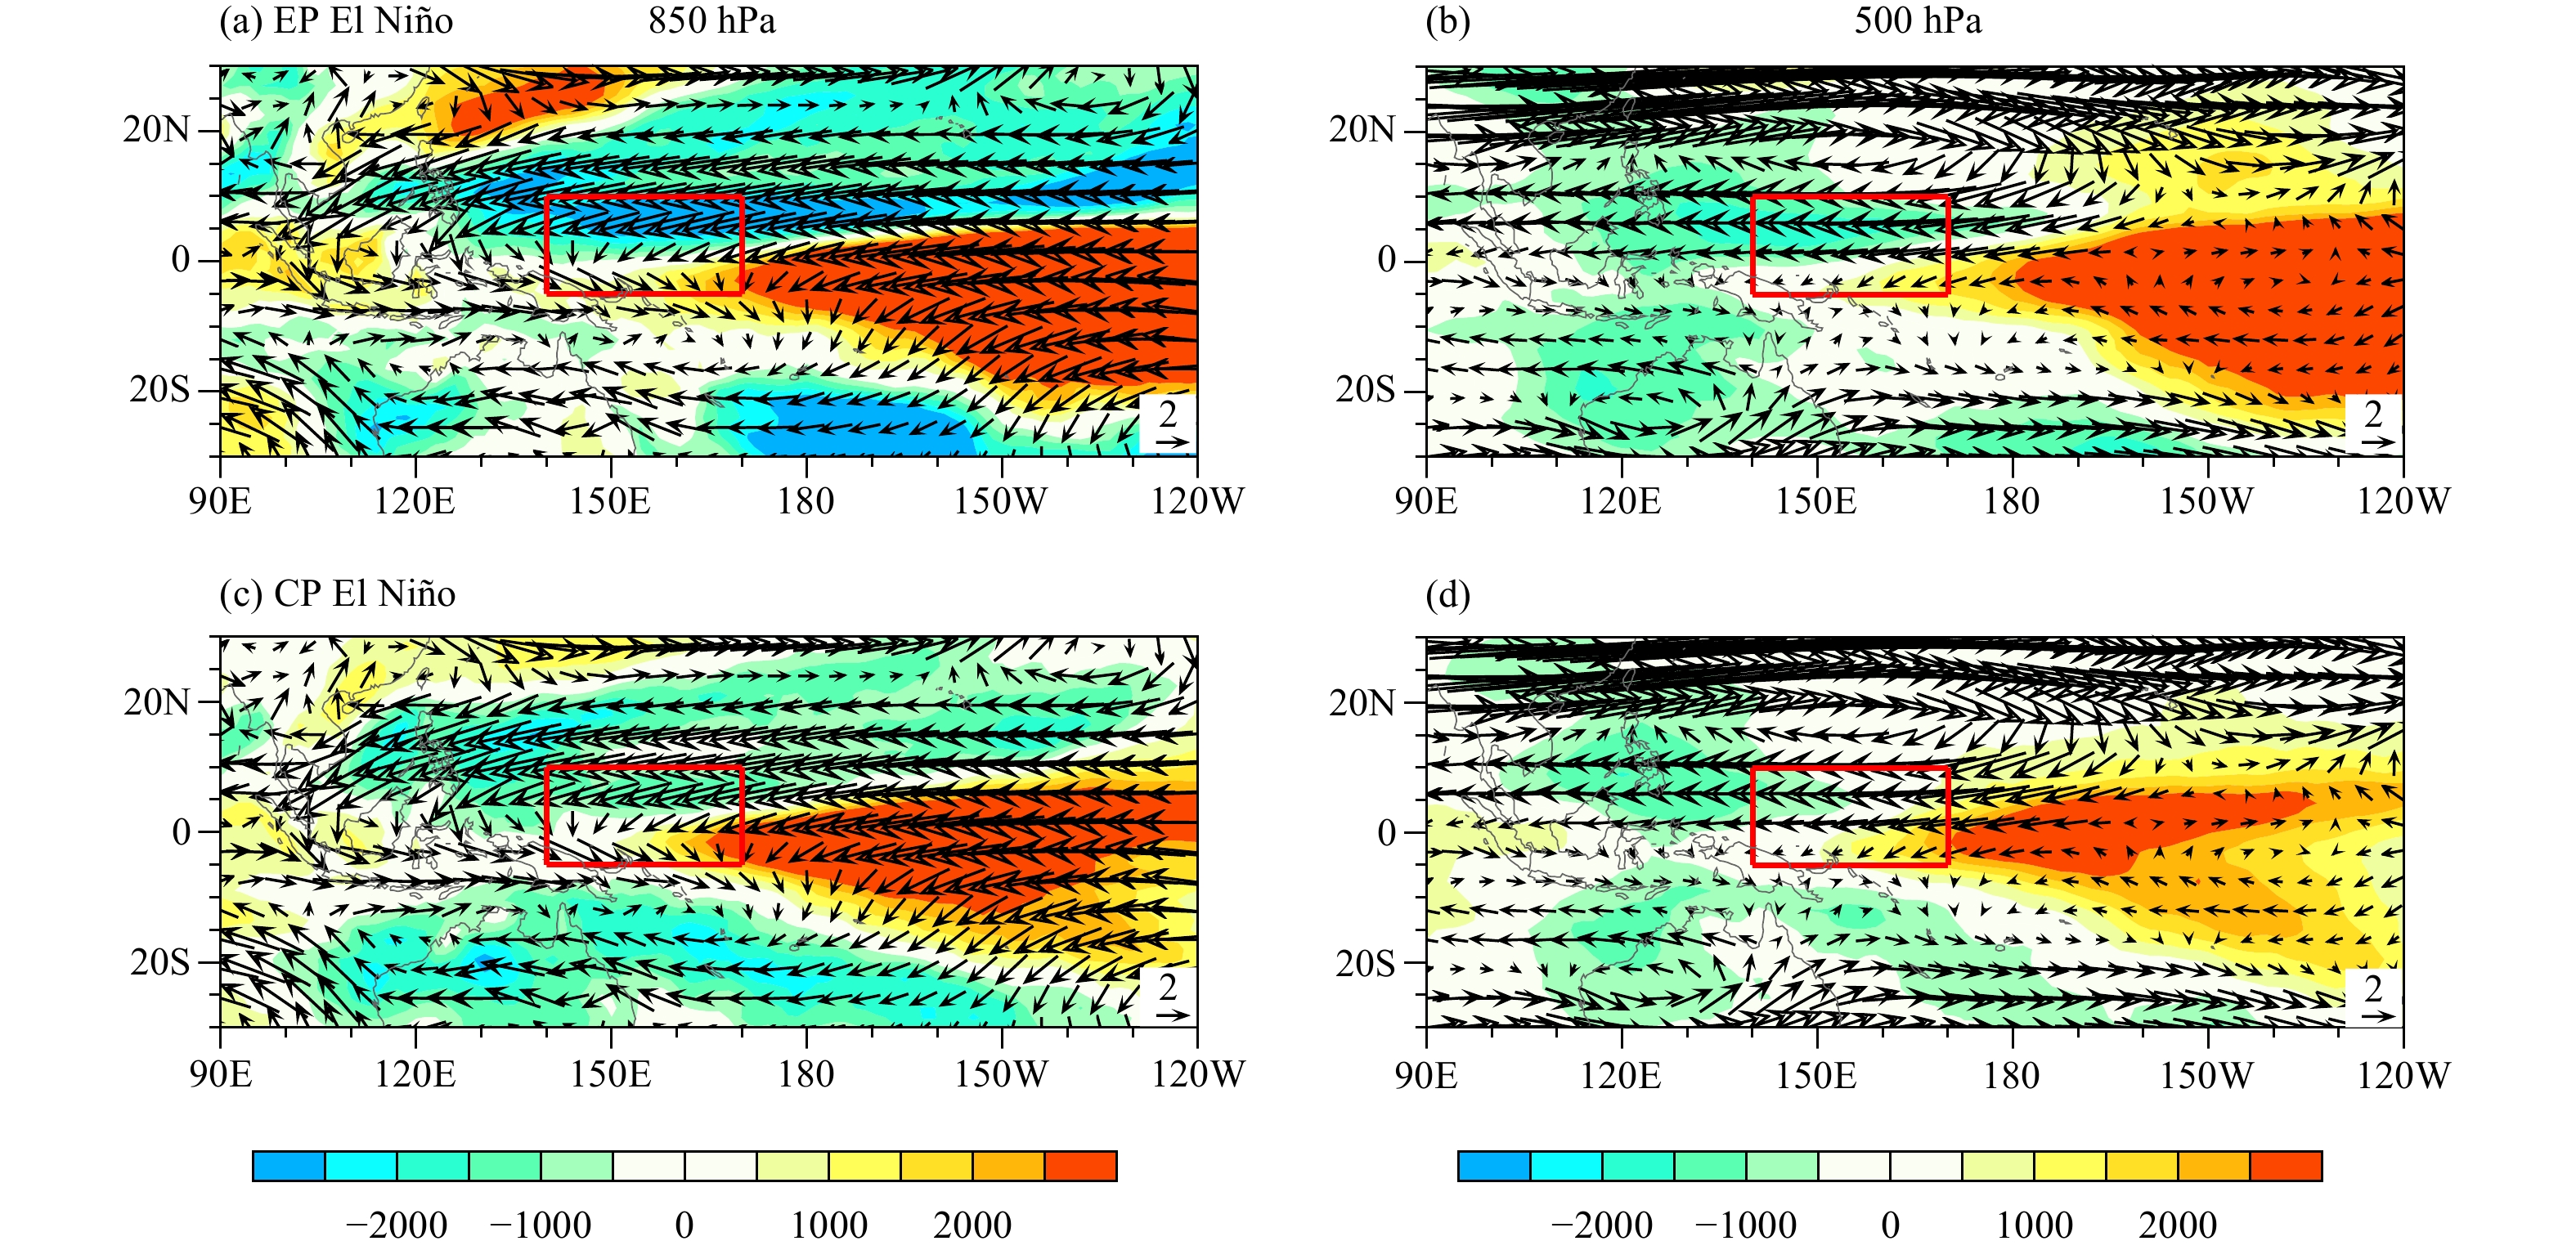
| Figure 11 (a, c) 850- and (b, d) 500-hPa wind climatology (vector; m s–1) and moist enthalpy anomaly (shaded; J kg–1) in winter of (a, b) EP El Niño and (c, d) CP El Niño. The red box denotes the key region. |
The WNPAC can connect El Niño with the East As-ian summer and winter climate variability. The asymmetry of atmospheric responses to El Niño and La Niña over the tropical WNP is important to ENSO evolution asymmetry (Chen et al., 2016) and the variability of East Asian summer rainfall (Tao et al., 2017). El Niño can be classified into two types: CP and EP El Niño (Kug et al., 2009). The asymmetric WNPAC and WNPC between EP El Niño and La Niña may be attributed to the longitudinal shifting of heating anomalies over the CEP. However, the SSTA patterns of CP El Niño and La Niña are approximately symmetric (Figs. 2c, e), and the cause of asymmetric atmospheric responses to the heating anomalies is confusing.
The column-integrated moisture and MSE equations are diagnosed to reveal the mechanism responsible for asymmetric negative precipitation anomalies over the key WNP region in La Niña and CP El Niño winters. The result shows that the nonlinear term [
The SSTA amplitude of CP El Niño is often smaller, but the nonlinear term is nearly twice larger (Figs. 4b, d). The nonlinear term turns positive at 700 hPa in EP El Niño, which is a critical difference between CP and EP El Niño (Fig. 5). The northeasterly (northwesterly) anomalies cause negative moist enthalpy advection over the key region below 700 hPa in EP (CP) El Niño winter (Figs. 7a, c). Above 700 hPa, the southerly anomalies of the southern branch of the cyclonic Rossby wave cause positive advection of anomalous moist enthalpy in EP El Niño (Fig. 7b), while the westerly anomalies cause negative advection in CP El Niño (Fig. 7d). The positive advection above 700 hPa offsets partial negative advection below 700 hPa, leading to a smaller nonlinear term for entire column in EP El Niño. The negative moist enthalpy advection is strengthened as the advection above 700 hPa is negative in CP El Niño, resulting in a larger nonlinear term relative to EP El Niño.
In CP El Niño, though a larger nonlinear term appears, the negative precipitation anomalies are weaker in the key region. The MSE budget analysis indicates that the difference in the linear term [
The asymmetry of the circulation anomalies between EP El Niño and La Niña is partially attributed to the longitudinal shifting of heating anomalies over the CEP, but the cause of asymmetric SSTA pattern is still unclear up to now.
| Ashok, K., S. K. Behera, S. A. Rao, et al., 2007: El Niño Modoki and its possible teleconnection. J. Geophys. Res. Oceans, 112, C11007. DOI:10.1029/2006JC003798 |
| Bjerknes, J., 1969: Atmospheric teleconnections from the equator-ial Pacific. Mon. Wea. Rev., 97, 163–172. DOI:10.1175/1520-0493(1969)097<0163:ATFTEP>2.3.CO;2 |
| Chang, C. P., Y. S. Zhang, and T. Li, 2000a: Interannual and interdecadal variations of the East Asian summer monsoon and tropical Pacific SSTs. Part I: Roles of the subtropical ridge. J. Climate, 13, 4310–4325. DOI:10.1175/1520-0442(2000)013<4310:IAIVOT>2.0.CO;2 |
| Chang, C. P., Y. S. Zhang, and T. Li, 2000b: Interannual and interdecadal variations of the East Asian summer monsoon and tropical Pacific SSTs. Part II: Meridional structure of the monsoon. J. Climate, 13, 4326–4340. DOI:10.1175/1520-0442(2000)013<4326:IAIVOT>2.0.CO;2 |
| Chen, M. C., T. Li, X. Y. Shen, et al., 2016: Relative roles of dynamic and thermodynamic processes in causing evolution asymmetry between El Niño and La Niña. J. Climate, 29, 2201–2220. DOI:10.1175/JCLI-D-15-0547.1 |
| Chen, S. F., W. Chen, and K. Wei, 2013: Recent trends in winter temperature extremes in eastern China and their relationship with the Arctic Oscillation and ENSO. Adv. Atmos. Sci., 30, 1712–1724. DOI:10.1007/s00376-013-2296-8 |
| Chen, W., S. Y. Ding, J. Feng, et al., 2018: Progress in the study of impacts of different types of ENSO on the East Asian monsoon and their mechanisms. Chinese J. Atmos. Sci., 42, 640–655. DOI:10.3878/j.issn.1006-9895.1801.17248 |
| Chung, P. H., and T. Li, 2013: Interdecadal relationship between the mean state and El Niño types. J. Climate, 26, 361–379. DOI:10.1175/JCLI-D-12-00106.1 |
| Dee, D. P., S. M. Uppala, A. J. Simmons, et al., 2011: The ERA-Interim reanalysis: Configuration and performance of the data assimilation system. Quart. J. Roy. Meteor. Soc., 137, 553–597. DOI:10.1002/qj.828 |
| Gill, A. E., 1980: Some simple solutions for heat-induced tropical circulation. Quart. J. Roy. Meteor. Soc., 106, 447–462. DOI:10.1002/qj.49710644905 |
| Hoerling, M. P., A. Kumar, and M. Zhong, 1997: El Niño, La Niña, and the nonlinearity of their teleconnections. J. Climate, 10, 1769–1786. DOI:10.1175/1520-0442(1997)010<1769:ENOLNA>2.0.CO;2 |
| Kug, J. S., F. F. Jin, and S. I. An, 2009: Two types of El Niño events: Cold tongue El Niño and warm pool El Niño. J. Climate, 22, 1499–1515. DOI:10.1175/2008JCLI2624.1 |
| Larkin, N. K., and D. E. Harrison, 2005: On the definition of El Niño and associated seasonal average U.S. weather anomalies. Geophys. Res. Lett., 32, L13705. DOI:10.1029/2005GL022738 |
| Li, T., and B. Wang, 2005: A review on the western North Pacific monsoon: Synoptic-to-interannual variabilities. Terr. Atmos. Oceanic Sci., 16, 285–314. DOI:10.3319/TAO.2005.16.2.285(A) |
| Li, T., B. Wang, B. Wu, et al., 2017: Theories on formation of an anomalous anticyclone in western North Pacific during El Niño: A review. J. Meteor. Res., 31, 987–1006. DOI:10.1007/s13351-017-7147-6 |
| Neelin, J. D., 2007: Moist dynamics of tropical convection zones in monsoons, teleconnections, and global warming. The Global Circulation of the Atmosphere, T. Schneider and A. Sobel, Eds., Princeton University Press, Princeton, 267–301. |
| Neelin, J. D., and I. M. Held, 1987: Modeling tropical convergence based on the moist static energy budget. Mon. Wea. Rev., 115, 3–12. DOI:10.1175/1520-0493(1987)115<0003:MTCBOT>2.0.CO;2 |
| Philander, S. G. H., 1990: El Niño, La Niña, and the Southern Oscillation. Academic Press, London, 289 pp, doi: 10.1017/CBO9781107415324.004. |
| Rasmusson, E. M., and T. H. Carpenter, 1982: Variations in tropical sea surface temperature and surface wind fields associated with the Southern Oscillation/El Niño. Mon. Wea. Rev., 110, 354–384. DOI:10.1175/1520-0493(1982)110<0354:VITSST>2.0.CO;2 |
| Rayner, N. A., D. E. Parker, E. B. Horton, et al., 2003: Global analyses of sea surface temperature, sea ice, and night marine air temperature since the late nineteenth century. J. Geophys. Res. Atmos., 108, 4407. DOI:10.1029/2002JD002670 |
| Tao, W. C., G. Huang, R. G. Wu, et al., 2017: Asymmetry in summertime atmospheric circulation anomalies over the north-west Pacific during decaying phase of El Niño and La Niña. Climate Dyn., 49, 2007–2023. DOI:10.1007/s00382-016-3432-9 |
| Wang, B., R. G. Wu, and X. H. Fu, 2000: Pacific–East Asian teleconnection: How does ENSO affect East Asian climate?. J. Climate, 13, 1517–1536. DOI:10.1175/1520-0442(2000)013<1517:PEATHD>2.0.CO;2 |
| Wang, X. H., T. Li, and M. C. Chen, 2019: Mechanism for asymmetric atmospheric responses in the western North Pacific to El Niño and La Niña. Climate Dyn., 1–13. DOI:10.1007/s00382-019-04767-4 |
| Webster, P. J., V. O. Magaña, T. N. Palmer, et al., 1998: Monsoons: Processes, predictability, and the prospects for prediction. J. Geophys. Res. Oceans, 103, 14451–14510. DOI:10.1029/97JC02719 |
| Wu, B., T. Li, and T. J. Zhou, 2010: Asymmetry of atmospheric circulation anomalies over the western North Pacific between El Niño and La Niña. J. Climate, 23, 4807–4822. DOI:10.1175/2010JCLI3222.1 |
| Wu, B., T. J. Zhou, and T. Li, 2017a: Atmospheric dynamic and thermodynamic processes driving the western North Pacific anomalous anticyclone during El Niño. Part I: Maintenance mechanisms. J. Climate, 30, 9621–9635. DOI:10.1175/JCLI-D-16-0489.1 |
| Wu, B., T. J. Zhou, and T. Li, 2017b: Atmospheric dynamic and thermodynamic processes driving the western North Pacific anomalous anticyclone during El Niño. Part II: Formation processes. J. Climate, 30, 9637–9650. DOI:10.1175/JCLI-D-16-0495.1 |
| Zhang, R. H., A. Sumi, and M. Kimoto, 1996: Impact of El Niño on the East Asian monsoon: A diagnostic study of the ’86/87 and ’91/92 events. J. Meteor. Soc. Japan, 74, 49–62. DOI:10.2151/jmsj1965.74.1_49 |
| Zheng, F., X. H. Fang, J. Y. Yu, et al., 2014: Asymmetry of the Bjerknes positive feedback between the two types of El Niño. Geophys. Res. Lett., 41, 7651–7657. DOI:10.1002/2014GL062125 |
 2019, Vol. 33


