The Chinese Meteorological Society
Article Information
- LIU, Yuzhi, Bing WANG, Qingzhe ZHU, et al., 2019.
- Dominant Synoptic Patterns and Their Relationships with PM2.5 Pollution in Winter over the Beijing–Tianjin–Hebei and Yangtze River Delta Regions in China . 2019.
- J. Meteor. Res., 33(4): 765-776
- http://dx.doi.org/10.1007/s13351-019-9007-z
Article History
- Received January 28, 2019
- in final form April 3, 2019
2. Meteorological Observatory Unit 95021, Yichang 441000
Emissions of particulate matter have exacerbated air pollution problems in China in recent years, particularly in areas with a high population density that have undergone rapid industrialization. Fine particulate matter with an aerodynamic diameter ≤ 2.5 μm (PM2.5) has become the primary atmospheric pollutant in China (Guo and Wei, 2013; Han et al., 2014) and has attracted much attention from researchers (Tao et al., 2013; Wang Q. M. et al., 2016; Miao et al., 2018). PM2.5 has a complex composition and its concentration varies on both temporal and spatial scales. PM2.5 can cause both cardiovascular and respiratory diseases (Cao et al., 2012; Nowak et al., 2013; Meng and Zhou, 2014; Lu et al., 2015; Madaniyazi et al., 2015; Meng et al., 2016; Ma Y. X. et al., 2017, 2018) and can influence atmospheric visibility (Leung et al., 2009; Kan et al., 2012) and the earth’s radiation budget (Huang et al., 2009; Liu et al., 2014; Hu and Liu, 2017; Jia et al., 2018). High concentrations of particulate matter intensify the episodes of haze (Zhu et al., 2018), which may affect crop production by influencing the photosynthesis of plants and the subsequent formation of proteins (Yan et al., 2014). Research into PM2.5 in the earth’s atmosphere is therefore imperative and will continue until this pollution problem is solved.
The Beijing–Tianjin–Hebei (BTH) and Yangtze River Delta (YRD) regions, which account for 30% of the Chinese economy and about 19% of the total population, are the two most developed and populous regions in China. PM2.5 pollution has become a serious problem over the BTH and YRD regions in recent decades (Wang A. Y. et al., 2015; Zhang et al., 2015; Batterman et al., 2016), especially during the winter months. The daily mean concentration of PM2.5 can exceed 500 μg m−3 when serious pollution episodes occur over the BTH region (Wang et al., 2014). Most research is focused on the spatial and temporal distributions of PM2.5 (Wang Z. B. et al., 2015; Liu et al., 2016; Wang G. L. et al., 2016; Li et al., 2017; Mao et al., 2017), the relationship between the concentrations of PM2.5 and meteorological factors (Pan et al., 2012; Jin et al., 2015; Yang X. C. et al., 2017; Zhou and Zhao, 2017; Gao et al., 2018; Leung et al., 2018), and the relevant weather circulation patterns in individual cities or regions (Zhang et al., 2012; Wang X. Y. et al., 2016; Xu et al., 2016; Ma X. H. et al., 2017; Yang X. et al., 2017; Chen X. et al., 2018).
Although many studies have been carried out on PM2.5 pollution, some questions remain, including the identification of the dominant synoptic-scale patterns in PM2.5 pollution episodes and the trajectories of pollutants under different circulation patterns. In this paper, we combine PM2.5 concentration data and meteorological data with the Hybrid Single Particle Lagrangian Integrated Trajectory model (HYSPLIT4) to distinguish the main synoptic-scale patterns and transport paths of PM2.5 pollutants under different weather circulation patterns during PM2.5 pollution episodes over BTH region in winter. This provides a basis for forecasting air quality and pollution prevention, based on the analysis of synoptic-scale patterns.
A description of the data and analytical methodology are given in Section 2. The spatial and temporal distributions of PM2.5 concentrations, dominant synoptic patterns, and cluster analyses on the transport of pollutants under different synoptic weather patterns are presented in Section 3. A summary is provided in Section 4.
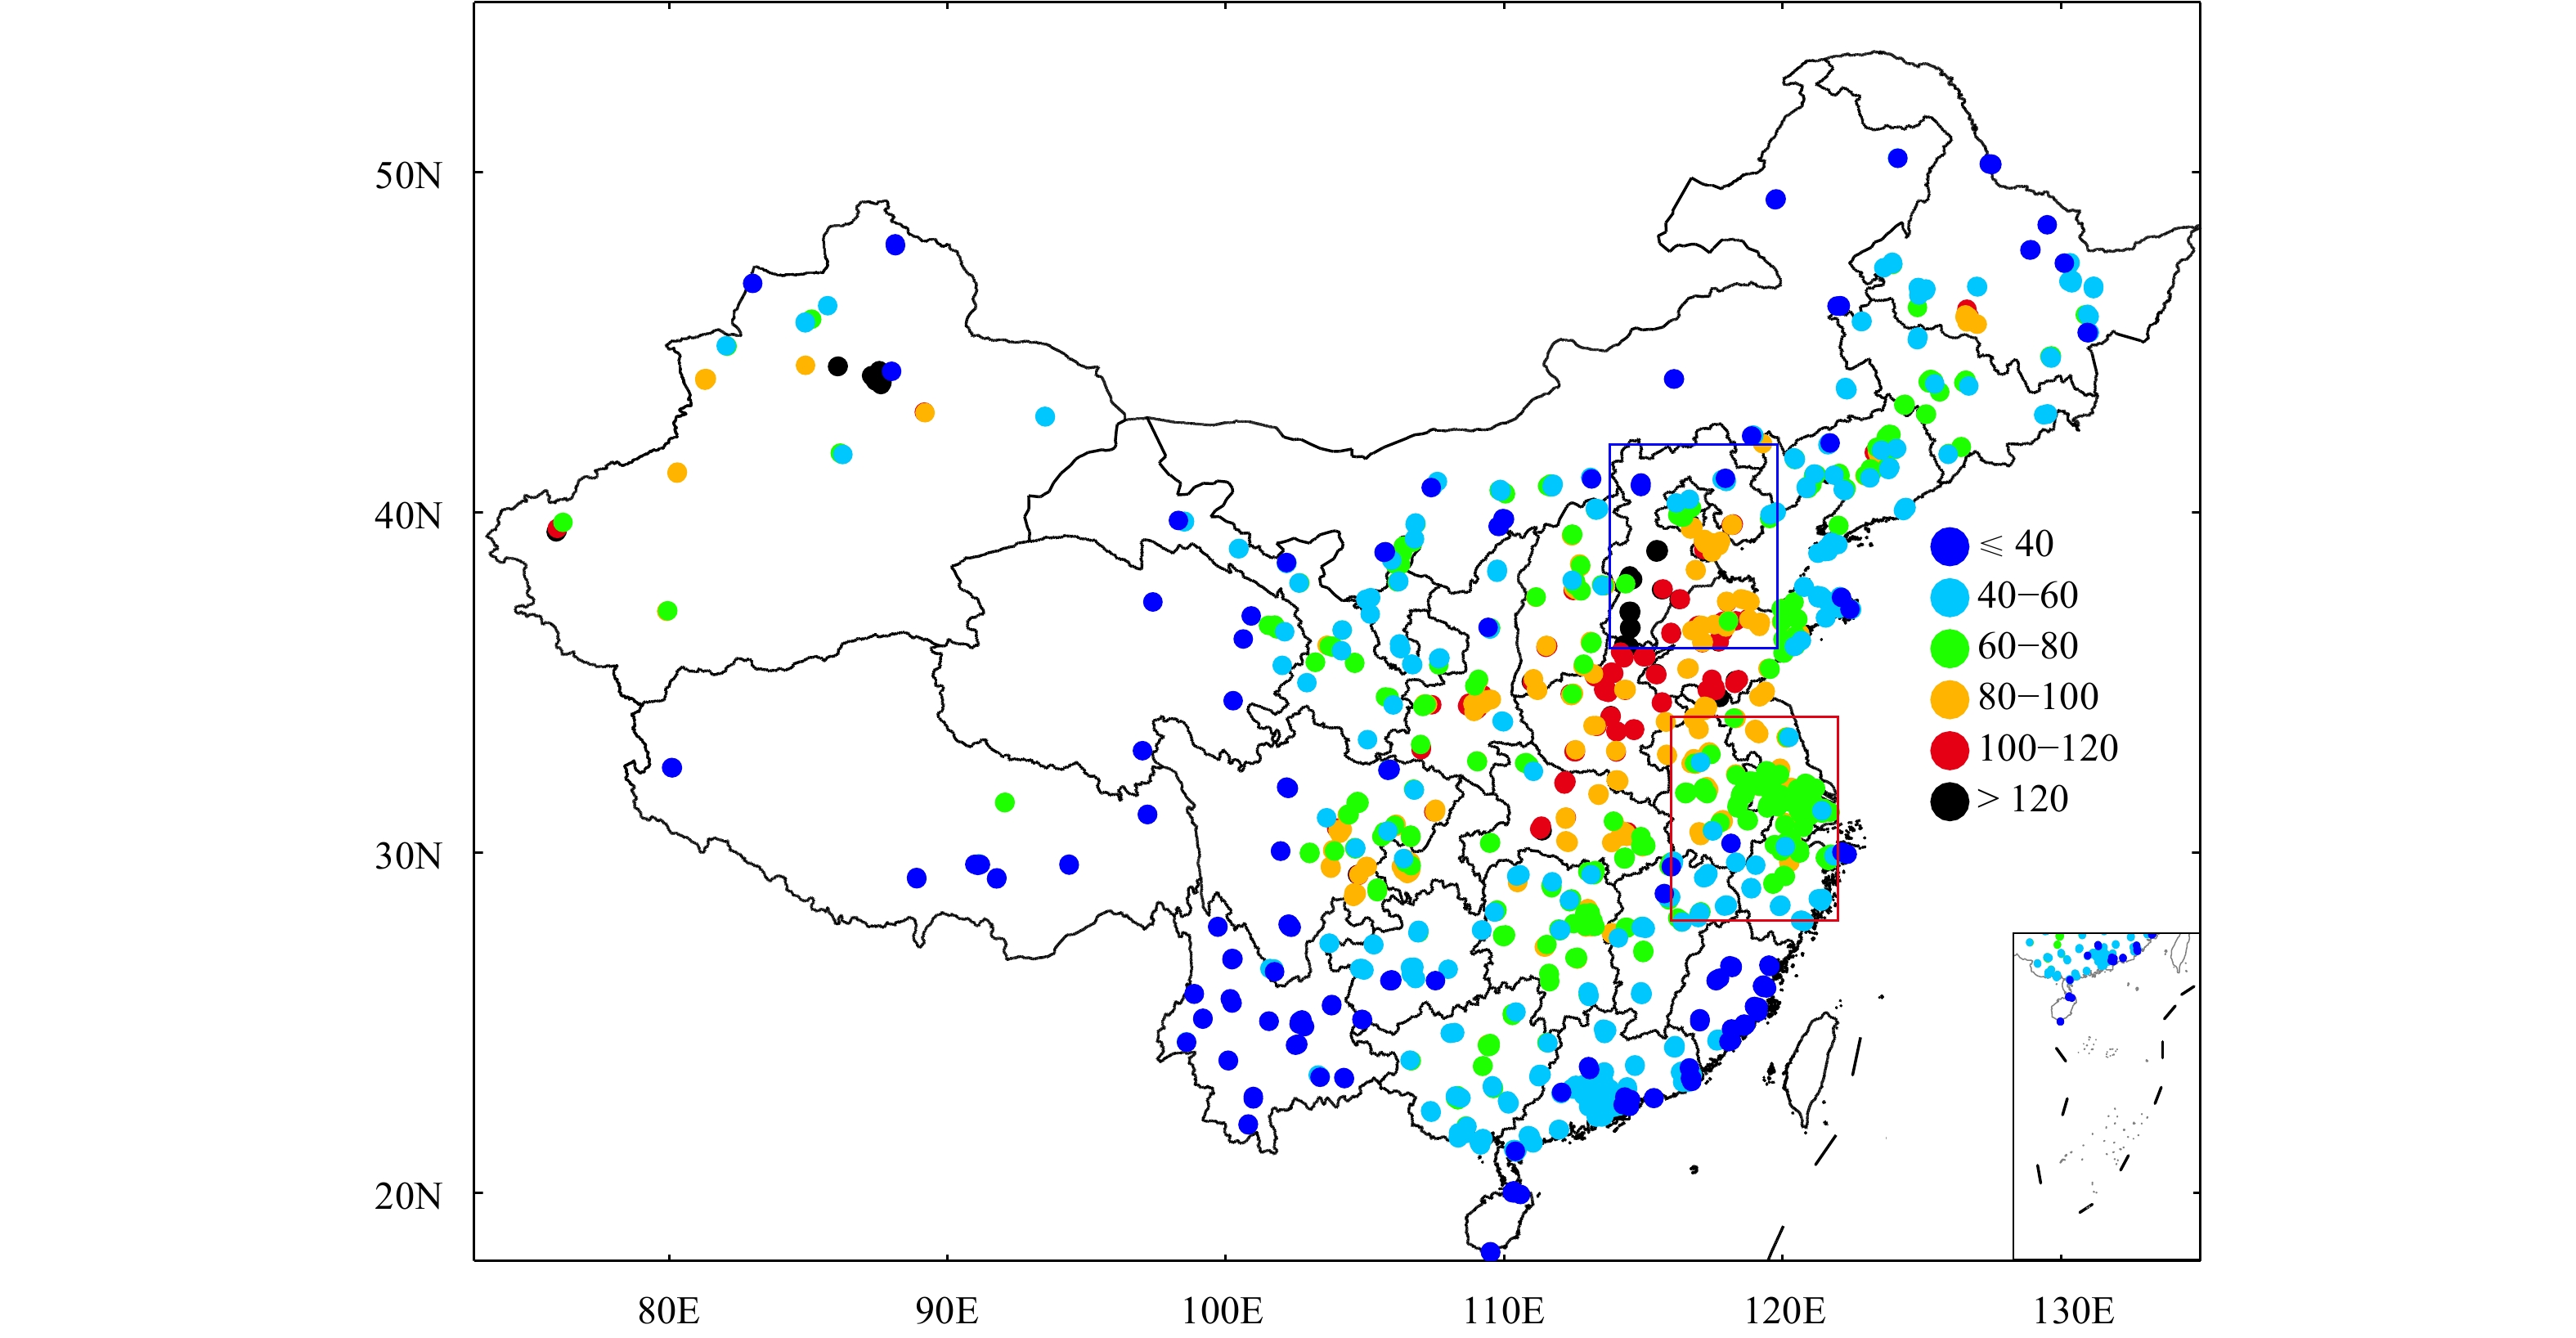
2 Datasets and analysis methodology 2.1 DatasetsBefore the PM2.5 monitoring network was set up in China, our knowledge of PM2.5 concentrations in the atmosphere was mainly based on estimates from satellite retrieval data (Ma et al., 2016; Xue et al., 2017). PM2.5 monitoring was introduced into the national air quality monitoring network of China in 2012 after the publication of the third revision of the National Ambient Air Quality Standards (Zhang and Cao, 2015). In this study, the hourly mean PM2.5 concentrations in cities during the winters from December 2014 to February 2018 were derived by using data obtained from the China National Environmental Monitoring Center of the Chinese Ministry of Environmental Protection. These data are archived at 13 city sites over the BTH (36°–42°N, 114°–120°E) and 26 sites of YRD (28°–34°N, 116°–122°E), respectively. The locations of the monitoring sites are shown in Fig. 1.
|
| Figure 1 Distribution of average PM2.5 concentrations over China in the winters of 2014–17. The blue and red rectangles indicate the BTH and YRD region, respectively. The dots denote the position of the monitoring sites, and the colors indicate the levels of PM2.5 concentrations (μg m−3). |
The meteorological data for the BTH and YRD regions from December 2014 to February 2018 were obtained from the ECMWF ERA-Interim reanalysis with a horizontal spatial resolution of 0.25° × 0.25° and a time interval of 6 h (0000, 0600, 1200, and 1800 UTC). The data analyzed include the mean sea-level pressure, the U and V components of the wind field at 10-m altitude, and the relative vorticity at 850 hPa.
We also analyze the daily mean meteorological data from the China Earth International Exchange Station Climate Data Daily Value Data Set (V3.0), provided by the China Meteorological Administration. The variables analyzed include the surface air temperature, relative humidity, precipitation, and the sunshine duration during the winter months of 2014–17.
2.2 HYSPLIT4 modelThe HYSPLIT4 model was developed by the NOAA based on the Lagrangian–Eulerian method for calculating and analyzing the transport and diffusion trajectories of atmospheric pollutants, which has been widely used for studying the dispersion of pollutants (Sun et al., 2016; Chen Y. R. X. et al., 2018; Zhang et al., 2018; Zhao et al., 2019). The three-dimensional meteorological fields as the driving data were from the Global Data Assimilation System of the NCEP. The transport trajectories of pollutants under different weather patterns over the BTH region were simulated by using the HYSPLIT4 model. The start point was set at Handan city in the BTH region, and the pollutants were considered to be transported to the YRD region when the trajectories passed the area of the YRD.
2.3 Analysis methodologyThe data were screened once the hourly concentration of PM2.5 was ≥ 900 or < 0 μg m −3. Simultaneously, the daily mean PM2.5 concentration was calculated for the days with ≥ 20 h of data, and it was recorded as a valid day. If the valid days were < 81 in winter, the city site would be ignored for that year. Winter was defined as December of the current year to February of the following year. For example, winter 2014 was defined as the period from December 2014 to February 2015. According to these rules, the PM 2.5 concentration for 349 winter days (referred to as valid days in the analysis) from December 2014 to February 2018 (the winters during 2014–17) were selected and analyzed over the BTH and YRD regions. Based on the meteorological fields at 0000, 0600, 1200, and 1800 UTC on the selected days, the daily mean sea-level pressure field was used to analyze the dominant weather patterns and their relationships with PM2.5 pollution.
3 Results 3.1 PM2.5 distribution in winter over the BTH and YRD regionsWe analyzed the average PM2.5 concentration over China based on the hourly PM2.5 concentrations data obtained from the China National Environmental Monitoring Center during the winters of 2014–17 (Fig. 1). High PM2.5 concentrations were seen over eastern–central China (30°–40°N, 105°–120°E). We selected two typical regions (the BTH and YRD) to investigate the spatial and temporal variations in detail. Table 1 lists the information for the city sites in the BTH and YRD regions.
| Region | City site |
| BTH | Beijing, Tianjing, Shijiazhuang, Tangshan, Qinghuangdao, Handan, Baoding, Zhangjiakou, Chengde, Langfang, Cangzhou, Hengshui, Xingtai |
| YRD | Shanghai, Nanjing, Suzhou, Nantong, Yangzhou, Wuxi, Changzhou, Zhenjiang, Taizhou, Yancheng, Hangzhou, Ningbo, Shaoxing, Huzhou, Jiaxing, Taizhou, Zhoushan, Jinhua, Hefei, Wuhu, Maanshan, Tongling, Anqing, Chuzhou, Chizhou, Xuancheng |
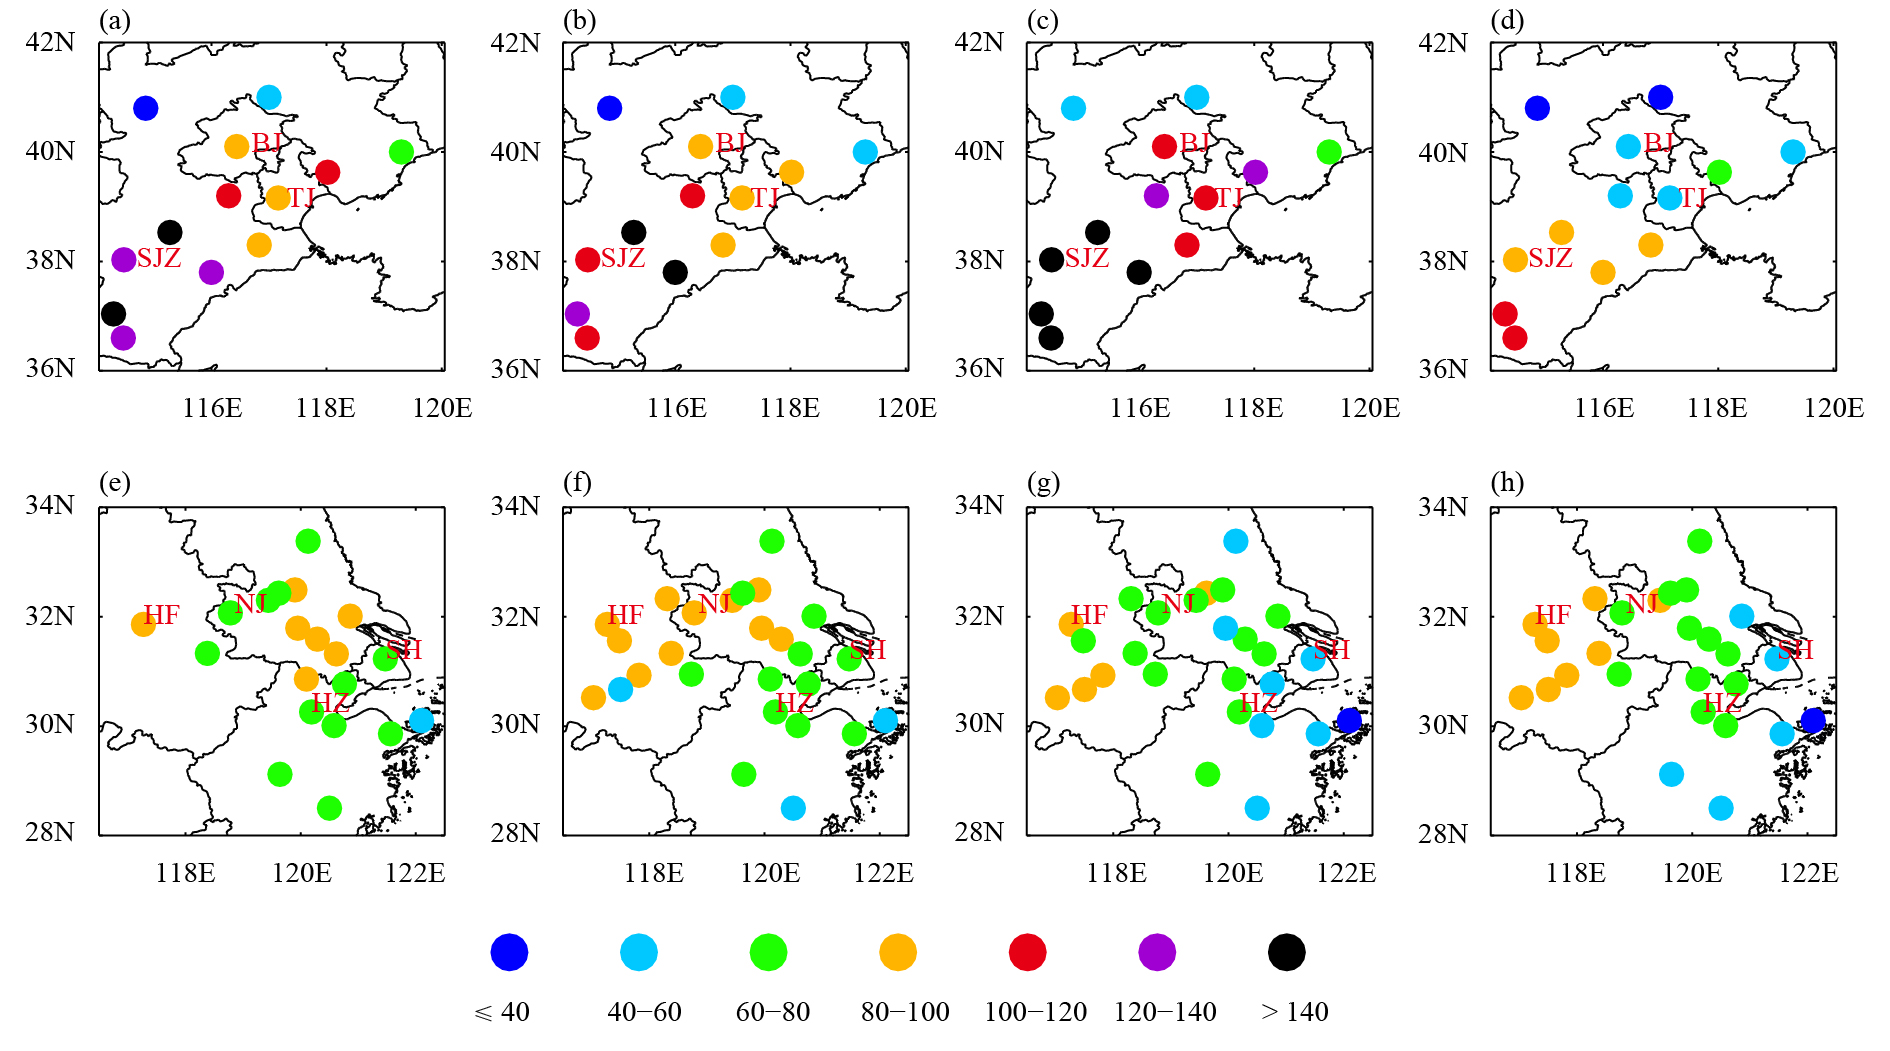
Figure 2 shows distributions of the PM2.5 concentrations over the BTH and YRD regions in the winters of 2014–17. The PM2.5 concentration was significantly high over the BTH region with an average value of 97 μg m−3. The PM2.5 concentration increased gradually from north to south in the BTH region. The lowest values of the average PM2.5 concentration (< 60 μg m−3) were seen over Chengde, Zhangjiakou, and Qinhuangdao, north of the BTH region, and the highest average values (> 120 μg m−3) over Shijiazhuang and Xingtai, south of the BTH region. The most serious PM2.5 pollution occurred in 2016, when the average PM2.5 concentration was > 122 μg m −3. The PM2.5 pollution in winter over the YRD region was lower than the pollution over the BTH region (Figs. 2e–h). The highest concentrations of PM2.5 were distributed over the interior of the YRD, and the most severe winter pollution occurred there during the study period. The PM2.5 pollution was lower over the coastal area of the YRD region.
|
| Figure 2 PM2.5 concentration over the (a–d) BTH and (e–h) YRD regions in the winters of 2014–17. The colors indicate the PM2.5 concentration (μg m−3). (a, e) winter 2014 (December 2014–February 2015), (b, f) winter 2015, (c, g) winter 2016, and (d, h) winter 2017. BJ: Beijing, TJ: Tianjin, SJZ: Shijiazhuang, HF: Hefei, NJ: Nanjing, HZ: Hangzhou, and SH: Shanghai. |
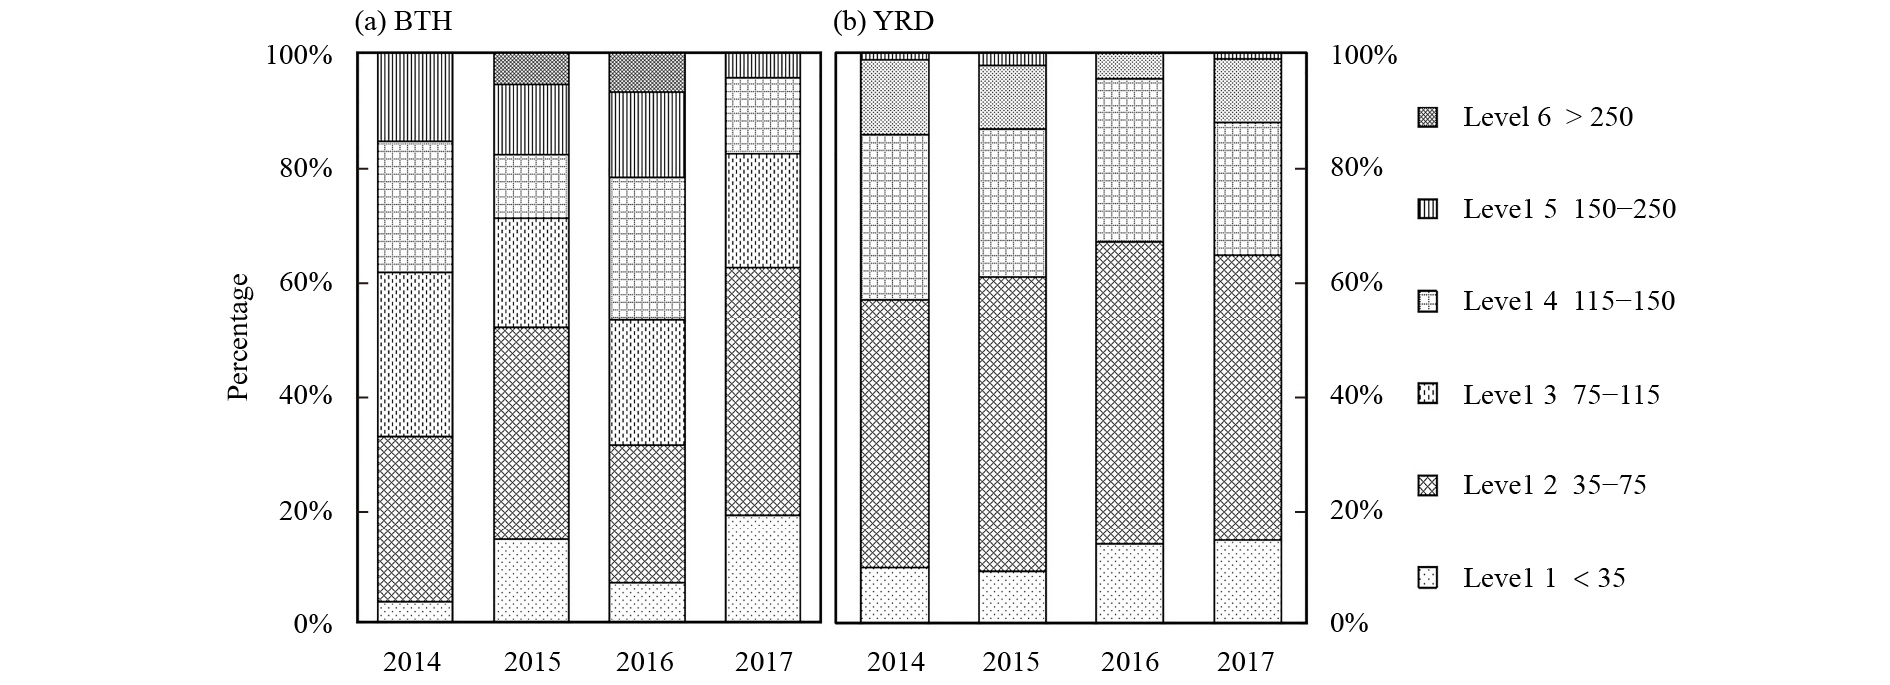
Figure 3 shows the percentage of days with different levels of air quality over the BTH and YRD regions during the winters of 2014–17. The air quality during winter in these two regions improved from 2014 to 2017. The air qualities are divided into six levels based on the PM2.5 concentration, where level 1 corresponds to a PM2.5 concentration < 35 μg m −3 and level 6 to a PM2.5 concentration > 250 μg m −3. The other levels are shown to the right of the legend in Fig. 3. The annual mean air quality compliance rates, defined as the percentage of the total number of valid days with a daily mean PM2.5 concentration ≤ 75 μg m−3 in winter over the BTH region were 32.5%, 51.6%, 31%, and 62.2% in 2014, 2015, 2016, and 2017, respectively. The average air quality compliance rate during the winters of 2014–17 was 47.2% (for a total of 349 valid days). The rate of heavy pollution, calculated for air quality levels ≥ 5 (corresponding to a PM2.5 concentration > 150 μg m −3) during the winters of 2014–2017 over the BTH region was 14.9%. The annual mean air quality compliance rates over the YRD region (54%, 60%, 66.7%, and 64.4% in 2014, 2015, 2016, and 2017, respectively) were higher than those over the BTH region. Although the rate of heavy pollution was only 3.6% over the YRD region, some heavy PM2.5 pollution episodes (> 200 μg m−3) at many sites were recorded.
|
| Figure 3 Percentage of days with different air quality levels (left-hand side of legend) over (a) the BTH and (b) YRD regions. The values on the right-hand side of the legend denote the PM2.5 concentrations (μg m−3) corresponding to each air quality level. |
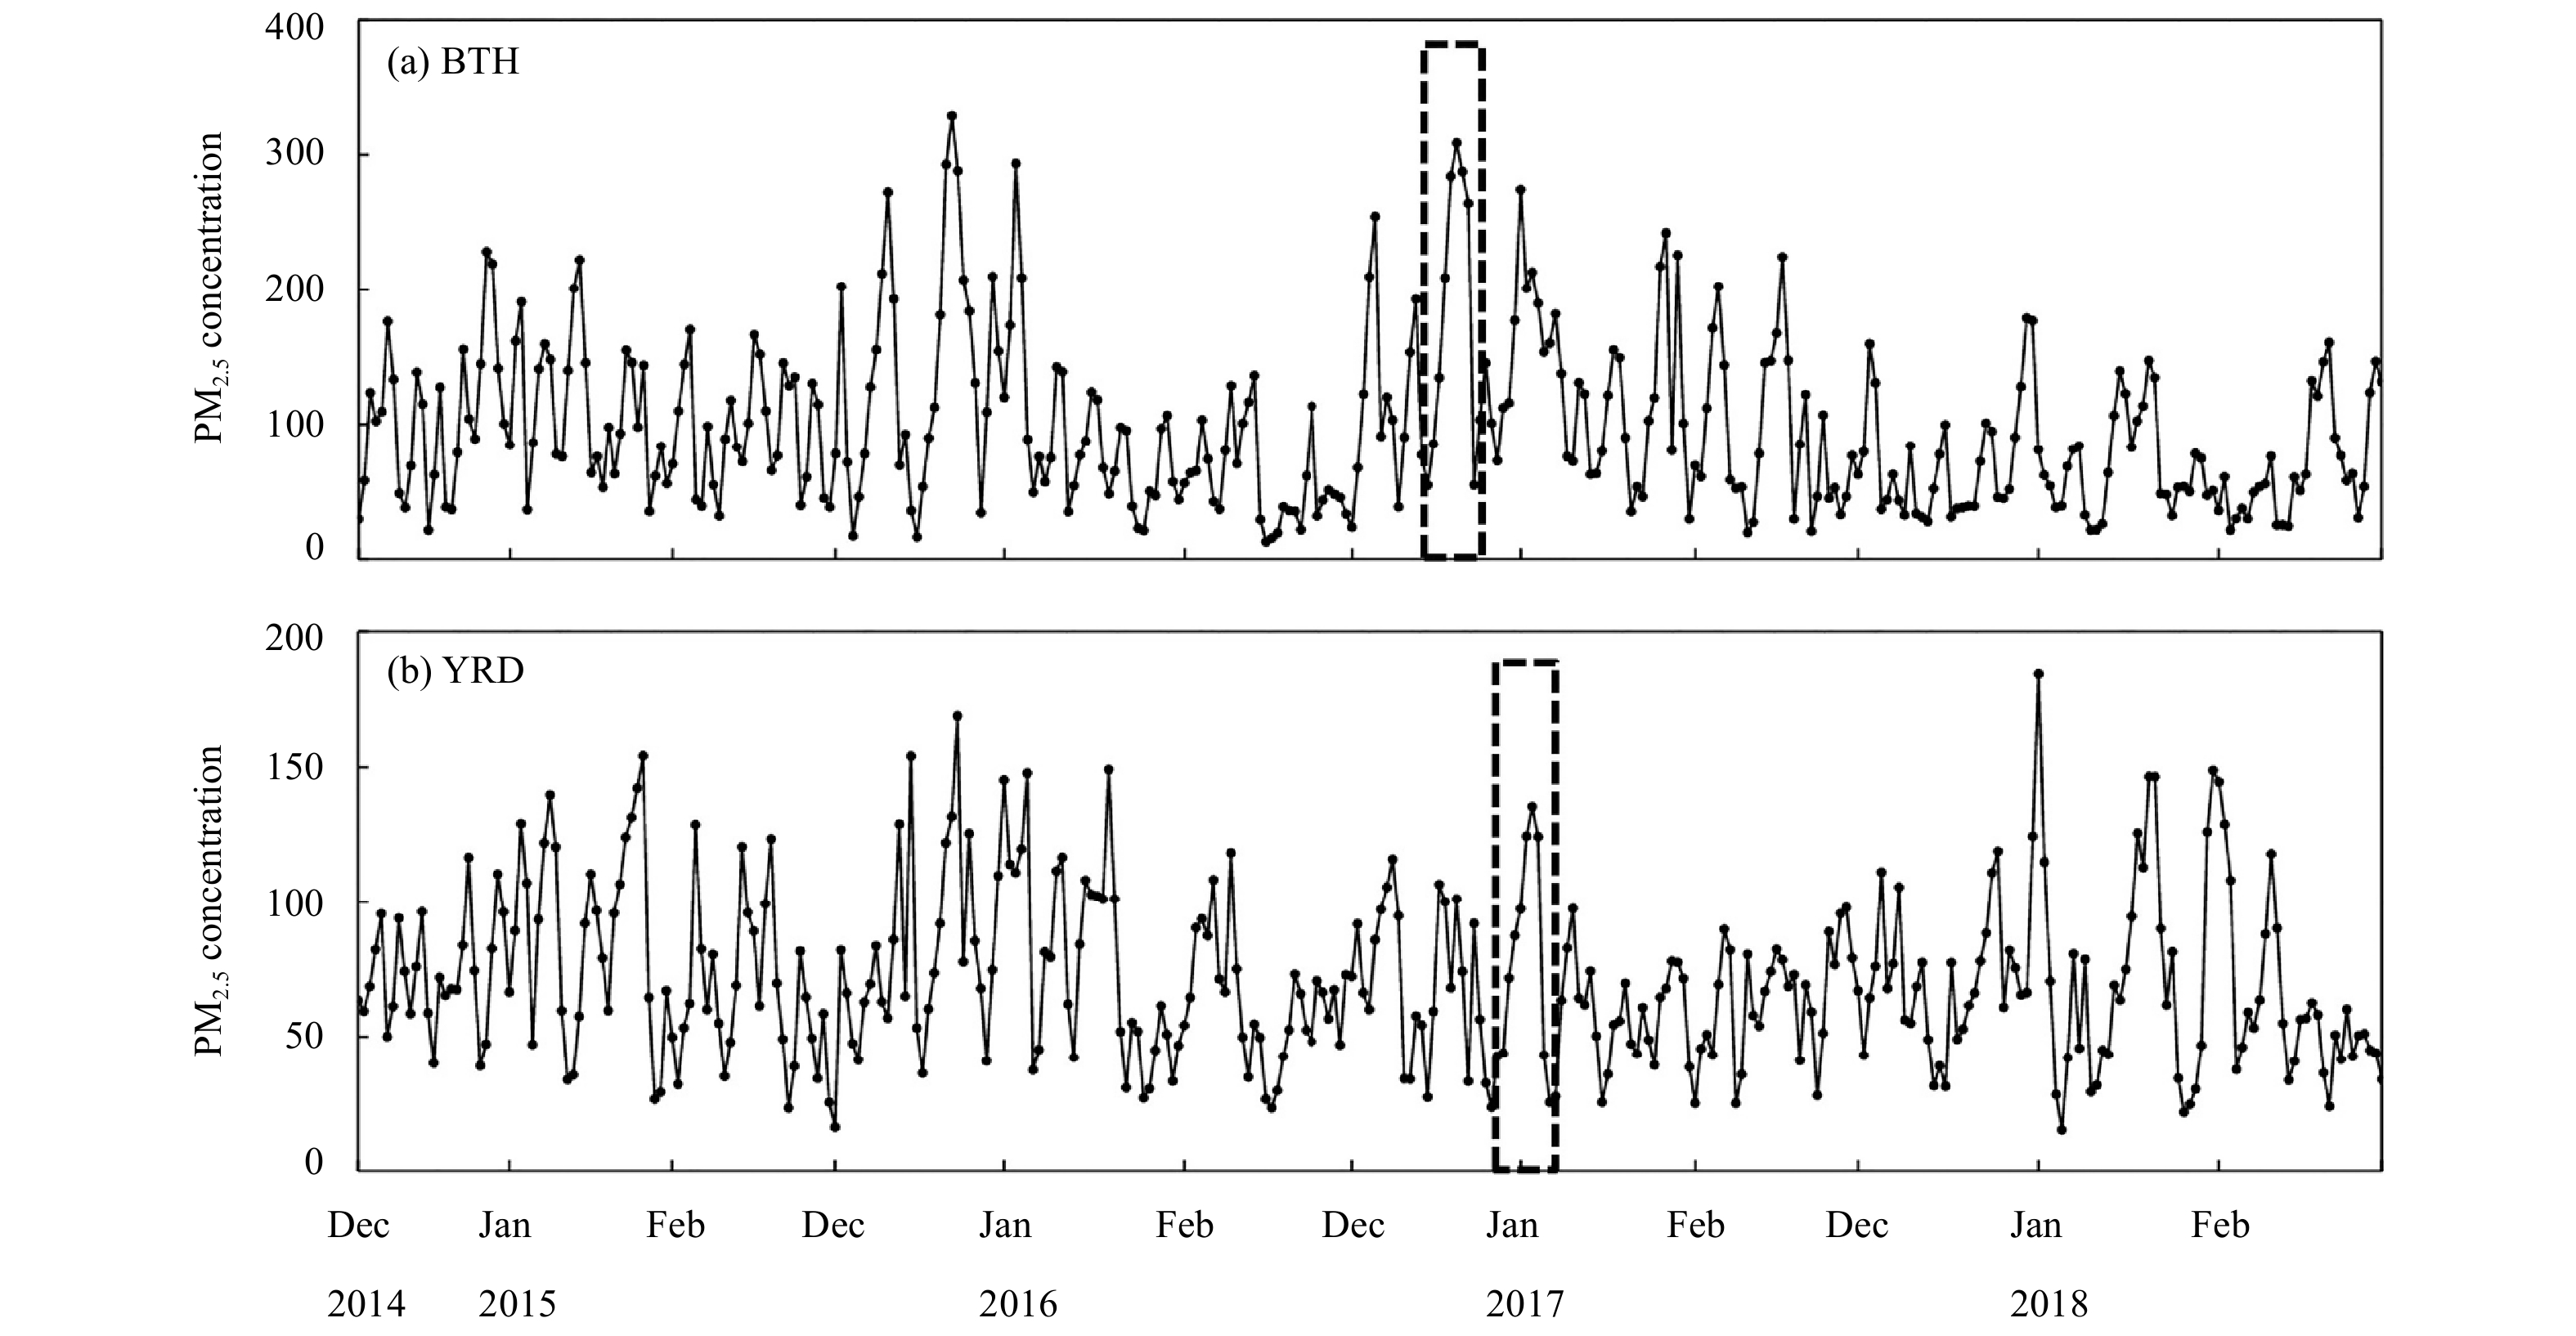
Figure 4 shows the time series for the PM2.5 concentrations over the BTH and YRD regions during the winters of 2014–17. We defined a peak (valley) value when the regional daily mean PM2.5 concentration was higher (lower) than that on the days before (after). In general, a pollution episode was considered to be sustained for about 7–10 days (shown by the rectangles in Fig. 4). We defined a polluted (clean) episode when two neighboring peaks (valleys) in the PM2.5 concentration lasted for > 5 days. The larger (smaller) PM 2.5 concentration was selected for the neighboring peaks (valleys) within 5 days of the pollution (clean) episode. A typical pollution episode was recorded when the valid peak value of the PM2.5 concentration was > 75 μg m −3. A typical clean event was defined when the valley value was ≤ 75 μg m−3.
|
| Figure 4 Time series of PM2.5 concentrations (μg m−3) for the valid days (349 days) in the winters of 2014–17 over the (a) BTH and (b) YRD regions. The dashed rectangle indicates the pollution episode sustained for about 7–10 days. |
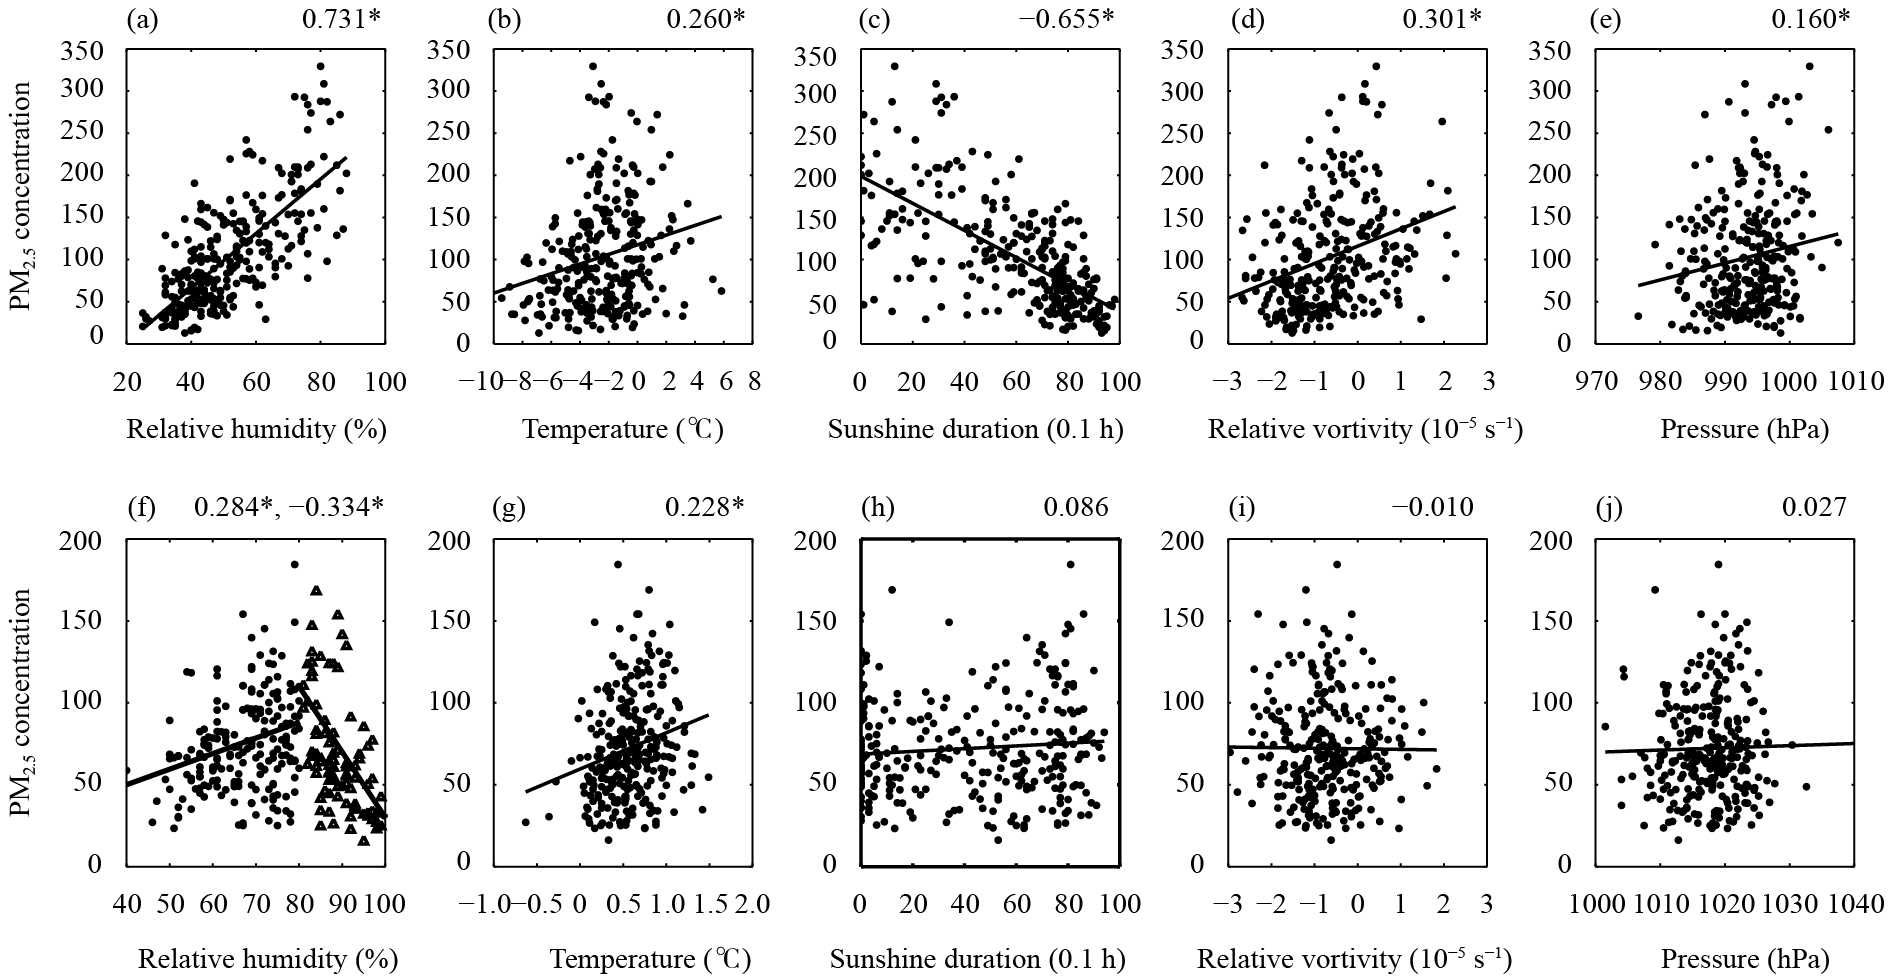
Figure 5 shows the correlation coefficients between the PM2.5 concentration and the meteorological factors. The meteorological variables showed a close relationship with the PM2.5 concentration over the BTH region. The correlation coefficients were significant above the 95% confidence level. The relatively humidity, pressure, relative vorticity, and temperature, but not the sunshine duration, were positively correlated with the PM2.5 concentration. By contrast, the correlation between the meteorological variables and the PM2.5 concentration was more complicated in the YRD region.
|
| Figure 5 Scatter diagrams of PM2.5 concentration (μg m−3) versus meteorological factors: (a, f) relative humidity (%); (b, g) temperature (℃); (c, h) sunshine duration (0.1 h); (d, i) relative vortivity (10−5 s−1), and (e, j) pressure (hPa) over (a–e) the BTH and (f–j) YRD regions during the winters of 2014–17. The numbers on the top right of each panel indicate the correlation coefficients between the two corresponding variables, and the star (*) next to the correlation coefficient denotes the value above the 95% confidence level. |
Figure 5a shows that there was a high correlation (r = 0.731) between the PM2.5 concentration and the relative humidity over the BTH region. A relative humidity of < 50% occurred on 53.4% of days in the study period and there was no day with a relative humidity > 90%. All the relative humidity values were > 70% when the PM 2.5 concentration was > 250 μg m −3. High levels of moisture in the atmosphere and high temperatures (Fig. 5b) favored the formation of PM2.5 pollution. The average relative humidity over the YRD region was 25.9% higher than BTH, and the relative humidity was < 50% on only 1.4% of days and ≥ 70% on 61% of days during 2014–17 over the YRD region. On the days when the relative humidity was < 80%, the PM 2.5 concentration increased as the relative humidity increased (r = 0.284), whereas when the relative humidity was > 80%, the PM 2.5 concentration decreased as the relative humidity increased (r = −0.334) (Fig. 5f). Further analysis shows that rainy days accounted for 83.3% and 97% of the days when the relative humidity was > 80% and > 90%, respectively. Therefore it tended to cause precipitation over the YRD region when the relative humidity was > 80% and this precipitation favored the wet deposition of PM 2.5. By contrast, it was difficult to rain over the BTH region even the relative humidity was > 80% and therefore the pollutants could not be easily removed via precipitation scavenging and wet deposition.
When the sunshine duration was long, the height of the boundary layer raised and this favored the upward diffusion of pollutants (Fig. 5c). A longer sunshine duration also increased the movement of air molecules (Wang H. C. et al., 2015), accelerating the dispersion of pollutants. A decrease in relative vorticity (Fig. 5d) corresponded to the descent of the airflow and the formation of a high-pressure system. The weak pressure gradient and winds in this type of circulation pattern favored the accumulation of pollutants. High-pressure conditions (Fig. 5e) often occurred under stable atmospheric conditions and enhance air pollution. The PM2.5 concentration in the YRD region showed a weak relation with the meteorological conditions compared with the BTH region (Figs. 5f, h–j), except for the temperature (Fig. 5g).
3.3 Dominant synoptic patterns in winter over the BTH and YRD regionsA statistical analysis was performed based on the distinction of polluted and clean episodes over the BTH and YRD regions. The results indicate that the episodes of PM2.5 pollution over both the BTH and YRD regions in winter have tended to decrease from 2014 to 2017 (Table 2).
| Region | Episode | Year | Total | |||
| 2014 | 2015 | 2016 | 2017 | |||
| BTH | Pollution | 17 | 13 | 12 | 13 | 55 |
| Clean | 10 | 10 | 7 | 9 | 36 | |
| YRD | Pollution | 12 | 10 | 10 | 8 | 40 |
| Clean | 15 | 12 | 11 | 10 | 48 | |
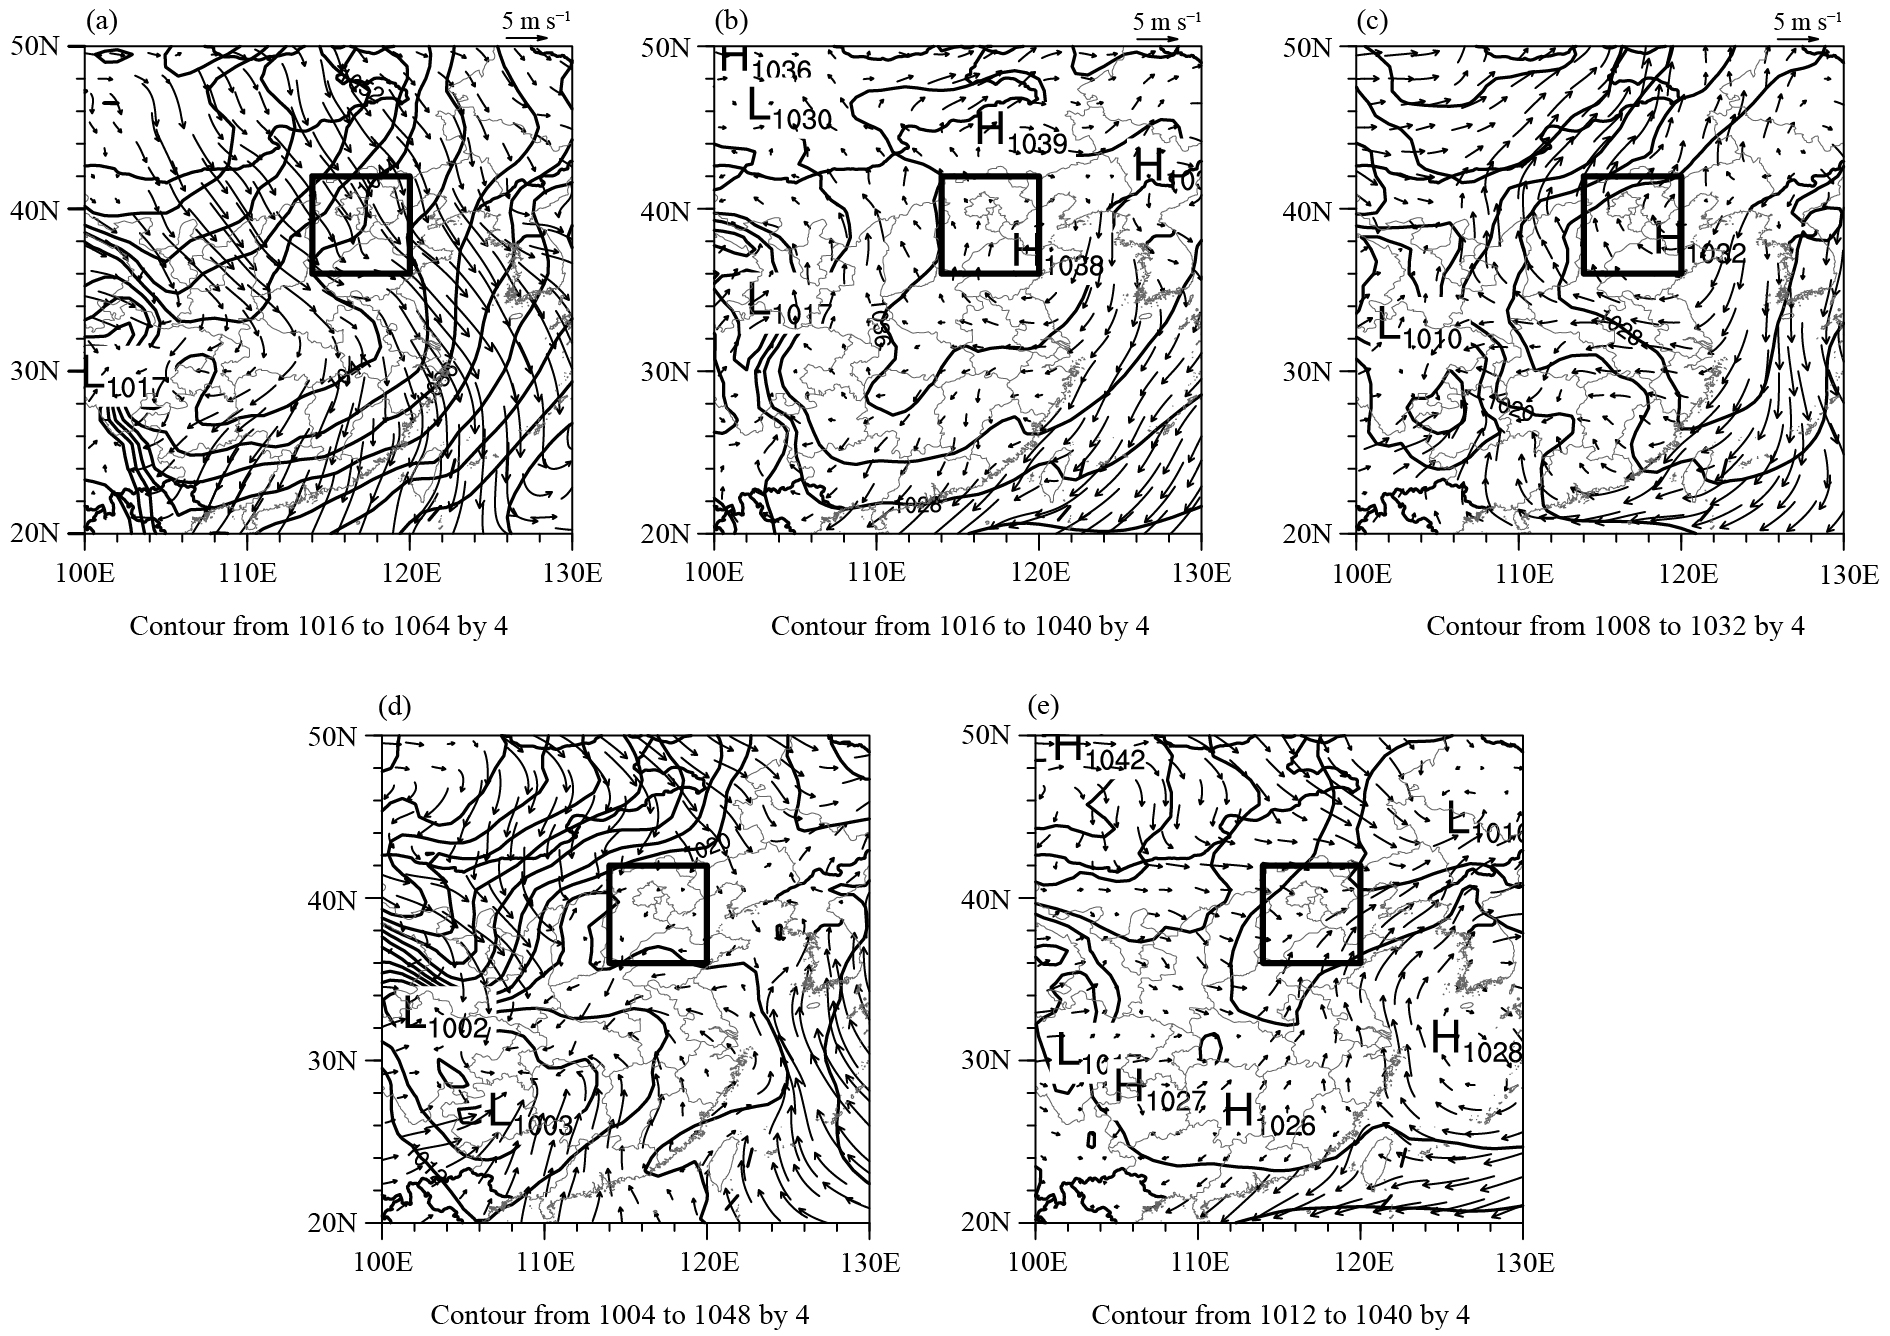
Based on the polluted and clean episodes listed in Table 2, we analyzed the dominant synoptic-scale patterns. The main weather patterns over the BTH region in winter were the front of a high-pressure, a high-pressure field, the rear of a high-pressure system approaching the sea, the leading edge of a cold front and a saddle pressure field (Fig. 6). In general, the dispersion of pollution may be related to the wind speed and direction. When the BTH region was controlled by the front of a high-pressure system (Fig. 6a), the strong northwest air stream facilitated the dispersion of pollutants. When a wide high-pressure system was centered over the BTH region, the weak pressure gradient and winds did not favor the dispersal of pollutants (Fig. 6b). A region of high pressure over the Bohai Bay configured the low-pressure system centered over Mongolia and Southwest China, and the southerly and southeasterly winds transported the pollutants to the north of the BTH region (Fig. 6c). When the BTH region was located in the leading edge of a cold front, the pollutants surrounding the BTH region were suspended for only a short time as a result of the weak winds in the warm air masses. After the cold front passed across the BTH region, the intensified winds favored the dispersal of pollutants out of the region (Fig. 6d). When a high–low–high saddle pressure field occurred in the northwest–southeast of the BTH region and a low-pressure system was distributed over the BTH region (Fig. 6e), the irregular winds helped to suspend the pollutants. Furthermore, pollutants of south BTH region (most polluted regionin Fig. 1) were easily transported to the north by the convergence of airflow.
|
| Figure 6 Daily mean wind vectors (arrows) at 10 m and mean sea-level pressure (hPa) under the main synoptic patterns: (a) the front of a high-pressure field, (b) a high-pressure field, (c) the rear of a high-pressure system approaching the sea, (d) the leading edge of a cold front, and (e) a cold-pressure field over the BTH region (denoted by the rectangle). |
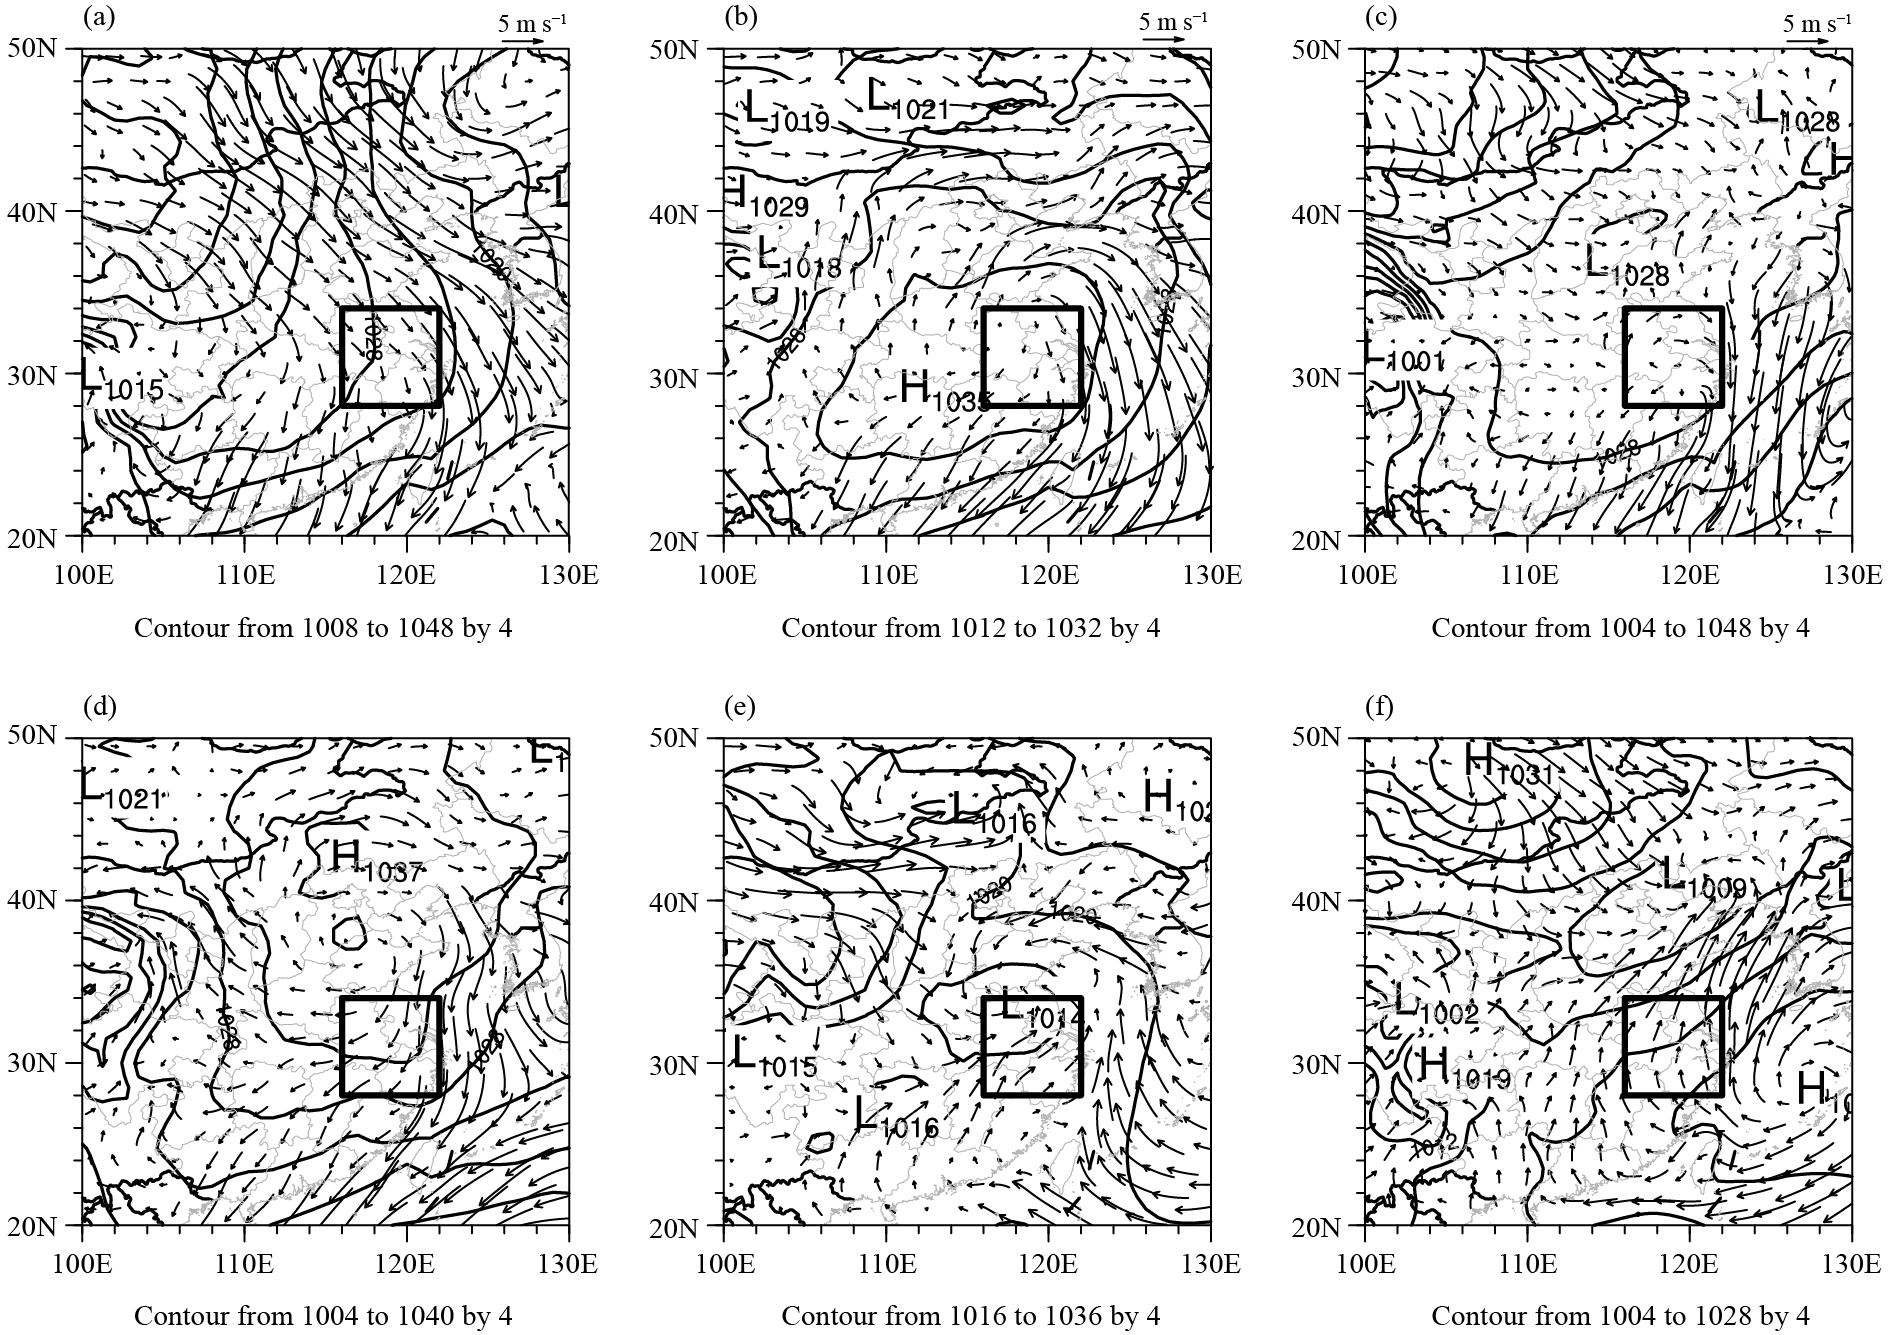
The external transport of cold air, a high-pressure field, a uniform pressure field, the bottom of a high-pressure system, an inverted trough, and the rear of a high-pressure system approaching the sea were the dominant weather systems over the YRD region in winter (Fig. 7). When most areas of Northwest China were controlled by a high-pressure system (Fig. 7a), northerly and northwesterly winds could be entrained with the cold air moving from North China to the YRD region. The external transport of cold air over the YRD region and the front high pressure over the BTH region were almost the same system and corresponded to an area of cold high pressure over land in winter, which continuously influenced the dispersion of air pollution over the BTH and YRD regions (Fig. 7a). Similar to the situation in Fig. 6b, the weak pressure gradient and winds under the control of a center of high pressure over the YRD region did not favor the dispersal of pollutants (Fig. 7b). When the YRD region was controlled by a wide uniform pressure field with a low gradient, it was difficult for the PM2.5 pollution over the YRD region to spread outward, and long-term pollution was induced as a result of the weak winds and irregular wind direction (Fig. 7c). By contrast, if the YRD region was controlled by the bottom (south) of a high-pressure system (Fig. 7d), a strong northeasterly wind from the sea was present in the YRD region. In an inverted trough pattern, the southwesterly wind might prevent the transport of pollutants to the YRD region (Fig. 7e). When a center of high pressure was located over the eastern China Sea and the YRD region was located at the rear of a center of high pressure, strong southerly winds favored the dispersion of pollutants (Fig. 7f).
|
| Figure 7 Daily mean wind vectors (arrows) at 10 m and mean sea-level pressure (hPa) under the main synoptic patterns: (a) the external transport of cold air, (b) a high-pressure field, (c) a uniform pressure field, (d) the bottom of a high-pressure system, (e) an inverted trough, and (f) the rear of a high-pressure system approaching the sea over the YRD region (denoted by the rectangle). |
We statistically calculated the average PM2.5 concentration under these synoptic-scale patterns in the winters of 2014–17 over the BTH and YRD regions (Table 3). Based on the average PM2.5 concentration, clean episodes were often found under the front of an area of high pressure system over the BTH region when the average PM2.5 concentration was 68 μg m−3. However, PM2.5 pollution over the BTH region in winter often occurred under a high-pressure field, the rear of a high-pressure system approaching the sea, the leading edge of a cold front, and saddle pressure field synoptic systems, with corresponding average PM2.5 concentrations of 113, 162, 157, and 144 μg m−3, respectively. Among the PM2.5 pollution episodes during the winters of 2014–17, the most serious episodes over the BTH region were associated with the high-pressure field pattern with a daily mean PM2.5 concentration > 300 μg m −3. The clean episodes in the YRD region occurred under the rear of a high-pressure system approaching the sea, the bottom of a high-pressure system, and inverted trough patterns, with average PM2.5 concentrations of 59, 53, and 50 μg m−3, respectively. The mean PM2.5 concentrations under the external transport of cold air, high-pressure field, and uniform pressure field patterns were 86, 80, and 87 μg m−3, respectively. The heaviest pollution was associated with the synoptic high-pressure field pattern with a maximum PM2.5 concentration of 186 μg m−3.
| Year | BTH region | YRD region | ||||||||||
| FHP | HPF | RHP | LCF | SPF | ETCA | HPF | UPF | BHP | IT | RHP | ||
| 2014 | 81 | 78 | 135 | 160 | 132 | 117 | 62 | 82 | 57 | 60 | – | |
| 2015 | 43 | 329 | – | 176 | 163 | 103 | 75 | 62 | 83 | – | 35 | |
| 2016 | 100 | 119 | 274 | 165 | 190 | 70 | 82 | 88 | 43 | 34 | 82 | |
| 2017 | 56 | 69 | – | 130 | 121 | 52 | 125 | 106 | 52 | – | – | |
| AVE | 68 | 113 | 162 | 157 | 144 | 86 | 80 | 87 | 53 | 50 | 59 | |
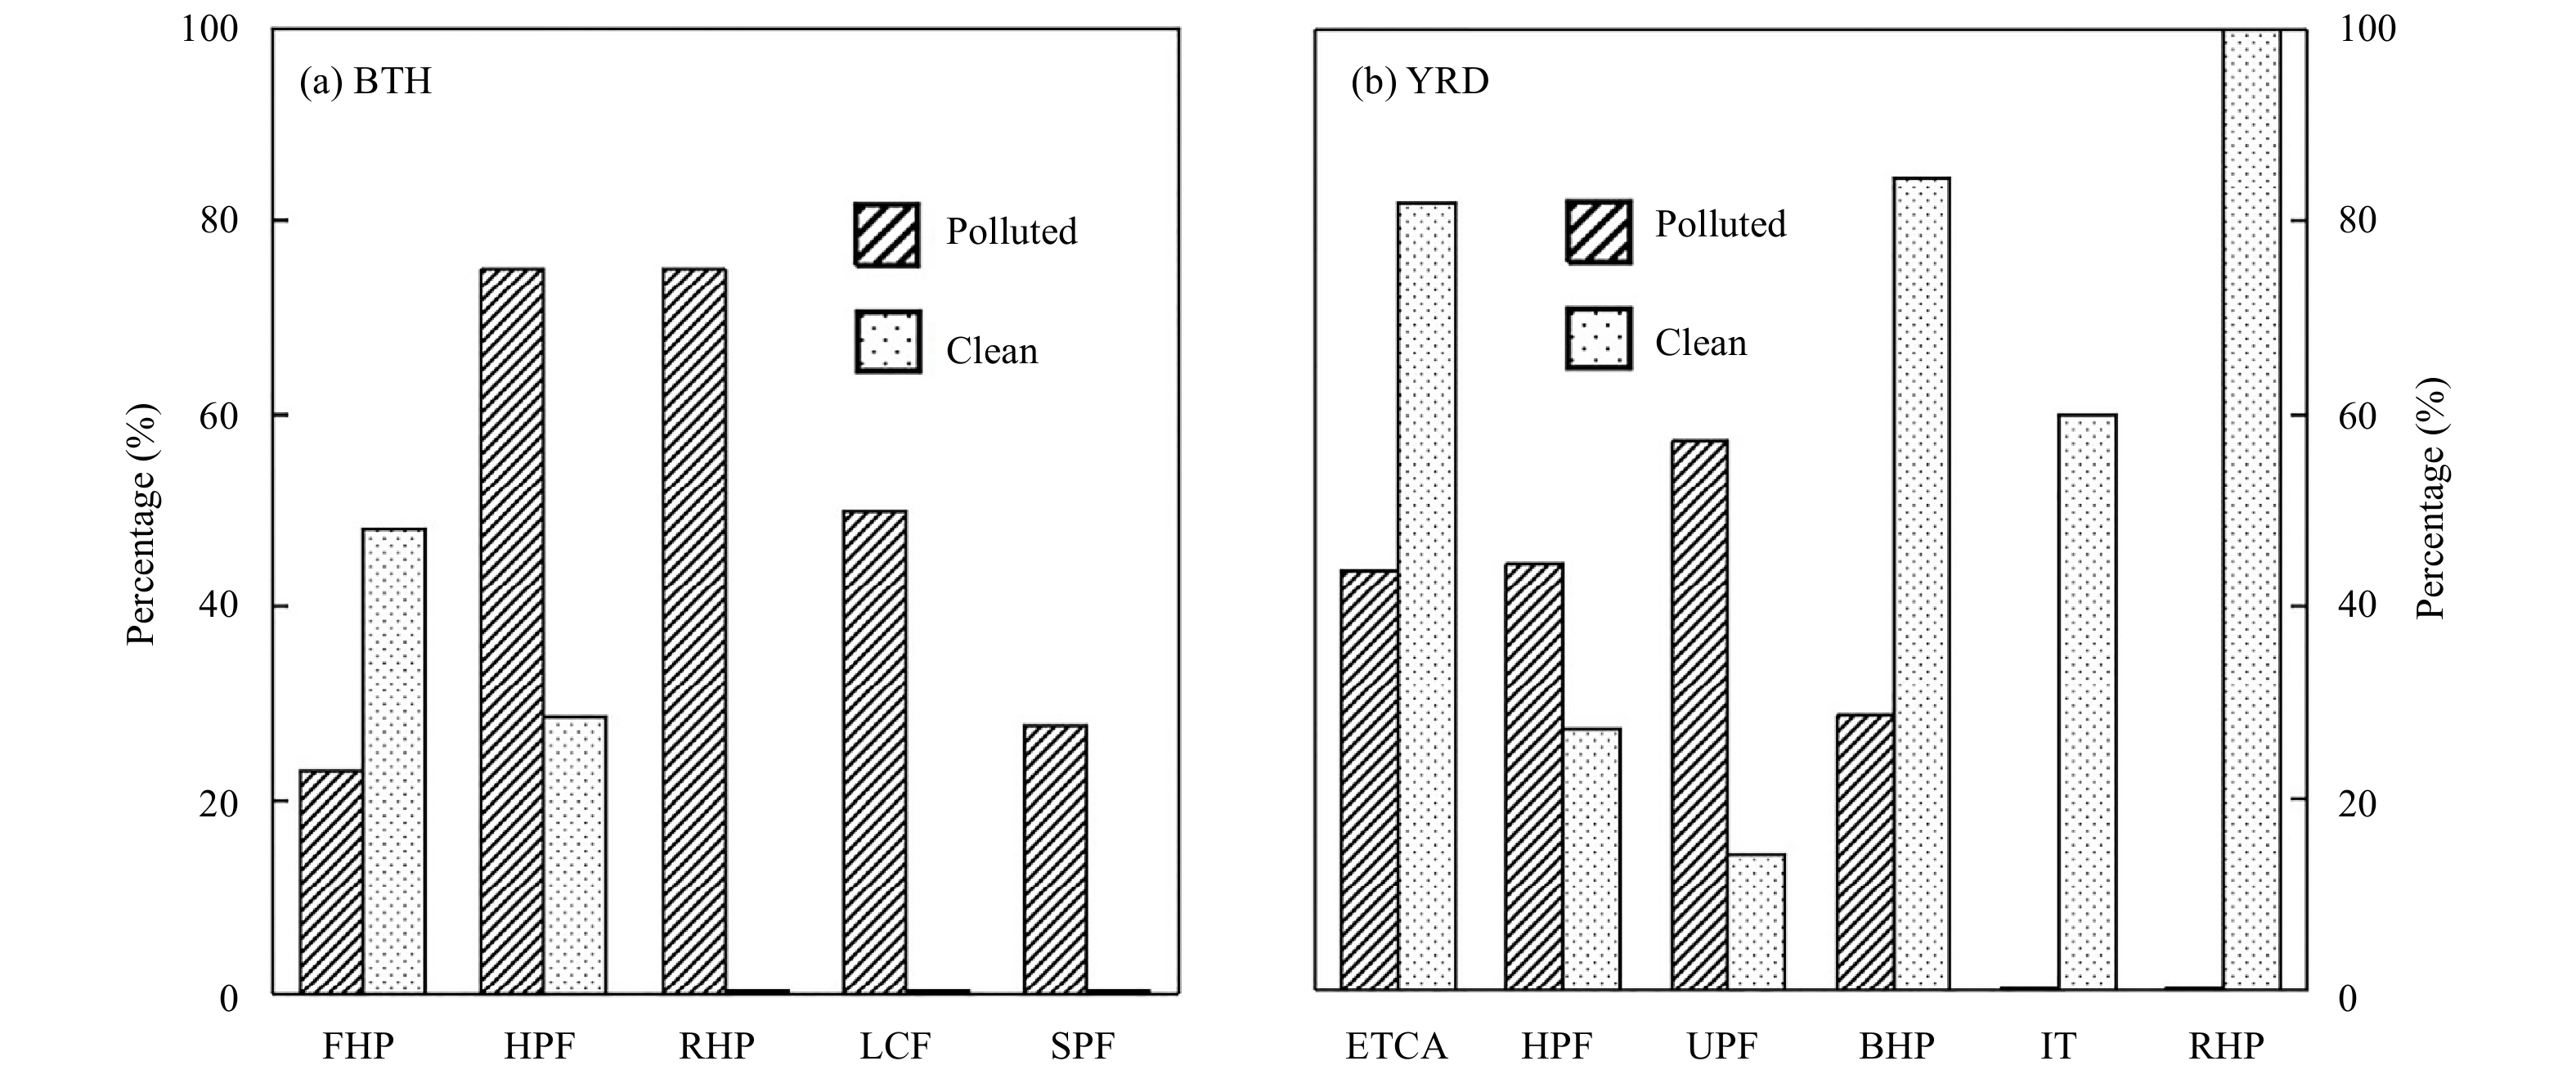
We calculated the average PM2.5 concentrations during polluted and clean episodes for each synoptic pattern, respectively. Figure 8 shows the frequency percentages of PM2.5 pollution (clean) episodes under each weather pattern with higher (lower) than average concentration for all the pollution (clean) episodes in the winters of 2014–17. The frequency percentages reflected the degree of pollution in the polluted and clean episodes. Figure 8a indicates that the percentage of pollution episodes over the BTH region under a high-pressure field, the rear of a high-pressure system approaching the sea, the leading edge of a cold front, and saddle pressure field systems were 75%, 75%, 50%, and 28%, respectively. Although the percentage of pollution episodes with a higher PM2.5 concentration under the front of an area of high pressure (23%) appeared to be close with that under the saddle pressure field (28%), the percentage of clean episodes with a lower PM2.5 concentration under the front of an area of high pressure (48%) was significantly higher than that under the saddle pressure field (0%). Therefore, the dominant synoptic-scale patterns controlling PM2.5 pollution over the BTH region were a high-pressure field, the rear of a high-pressure system approaching the sea, the leading edge of a cold front, and a saddle pressure field. The dominant pattern for clean episodes was the front of an area of high pressure. The percentages of pollution episodes with a higher PM2.5 concentration under the external transport of cold air, high-pressure field, uniform pressure field, and bottom of a high-pressure system were 44%, 44%, 57%, and 29%, respectively, in the YRD region (Fig. 8b), much higher than those under an inverted trough and the rear of a high-pressure system approaching the sea. The percentage of pollution episodes with a higher PM2.5 concentration under the external transport of cold air system was higher than that under the bottom of a high-pressure system. Simultaneously, the percentage of clean episodes with a lower PM2.5 concentration under the external transport of cold air was lower than that under the bottom of a high-pressure system. Additionally, the mean PM2.5 concentration under the external transport of cold air and bottom of a high-pressure were 86 (> 75) and 53 (< 75) μg m−3, respectively. Therefore, the external transport of cold air was one of the dominant polluted patterns. As reported by Yang X. C. et al. (2017), cold high-pressure systems were the main weather conditions over land in winter and northerly winds not only transported the pollutants from North China to the YRD region, but also improved the air quality when the air quality over the upstream area was good. Therefore, the dominant synoptic-scale patterns controlling PM2.5 pollution over the YRD region were the external transport of cold air, high-pressure field, and uniform pressure field systems, and the dominant patterns controlling the clean episodes were the bottom of a high-pressure system, an inverted trough, and the rear of a high-pressure system approaching the sea.
|
| Figure 8 Frequency percentage of PM2.5 polluted (clean) episodes with higher (lower) PM2.5 concentrations than the average concentration for all the polluted (clean) episodes during the winters of 2014–17 over the (a) BTH and (b) YRD regions, respectively. The abbreviations are the same as in Table 3. |
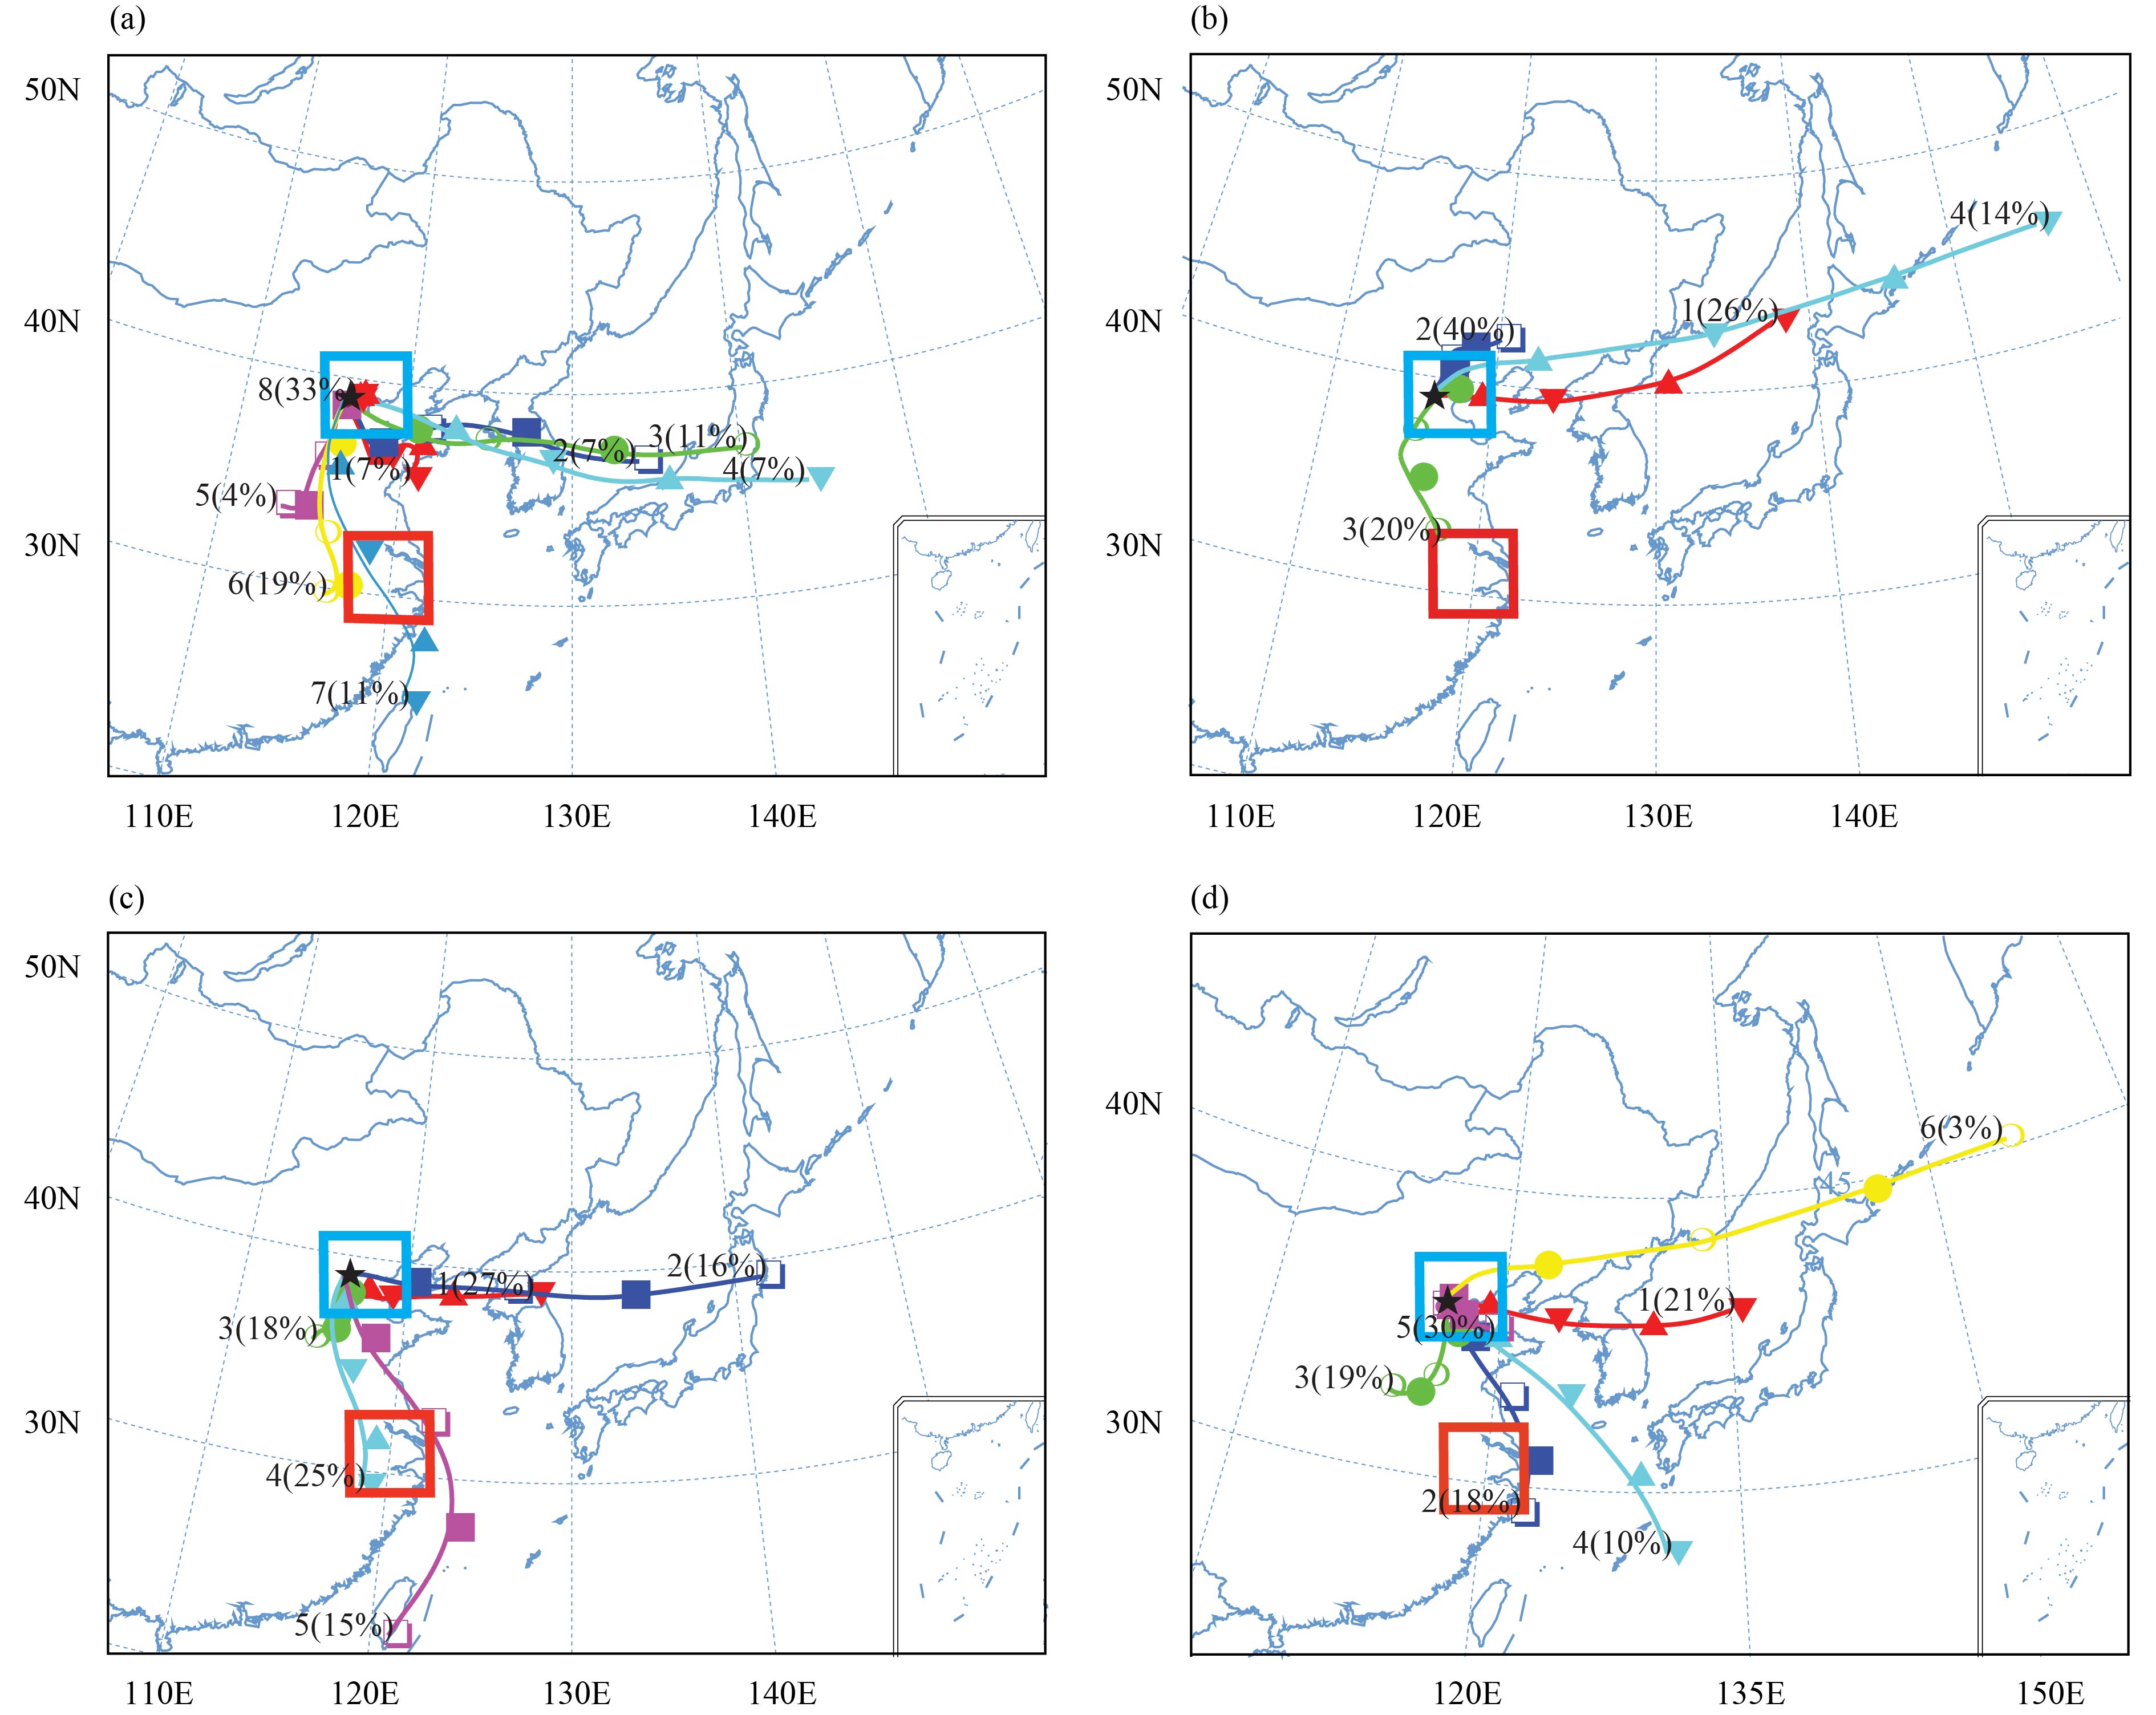
The BTH region was a potential source of pollutants to the downstream YRD region during the winter months according to the analysis. To clarify the potential contribution of pollutants over the BTH region to the YRD region, the transport trajectories of pollutants from the BTH region (with a start point at Handan city) to the YRD region were simulated under the four dominant weather patterns (high-pressure field, the rear of a high-pressure system approaching the sea, the leading edge of a cold front, and a saddle pressure field) during PM2.5 pollution episodes.
Figure 9a shows that 33% of the pollutants were constrained within the BTH region (path 8) under the high-pressure field, about 22% of the pollutants over the BTH region were transported eastward toward the sea (paths 2–4) under the high-pressure field, and 11% of the pollutants were transported to the YRD region within 24 h (path 7). Under this weather system, only a small part of pollutants present over the BTH region were transported over large distances within 24 h, causing a wide range of air pollution episodes in eastern China (see paths 1–8). Under the rear of a high-pressure system approaching the sea over the BTH region (Fig. 9b), most pollutants over the BTH region were transported to the northeast (paths 1, 2, and 4). A new weather pattern with northerly winds formed under the rear of a high-pressure system approaching the sea over the BTH and drove the pollutants toward the YRD region. The simulation shows that 20% of the pollutants could be transported to the YRD region within 48 h (path 3). When the weather was controlled by the leading edge of a cold front over the BTH region (Fig. 9c), > 80% of the pollutants were constrained within eastern China within 24 h (paths 1 and 3–5), and 25% of the pollutants were transported to the YRD region within 30 h (path 4). When the weather in the BTH region was controlled by the saddle pressure field, 30% of the pollutants were constrained around the BTH region (path 5) ( Fig. 9d). The air quality over the YRD region would not be influenced by this weather system over the BTH region.
|
| Figure 9 Transport trajectories with the series number and percentage of pollutants under different polluted weather patterns: (a) a high-pressure field, (b) the rear of a high-pressure system approaching the sea, (c) the leading edge of a cold front, and (d) a saddle pressure field over the BTH region. The asterisk (★) denotes the start point in the trajectory simulation. The blue and red rectangles indicate the BTH and YRD regions, respectively. |
We identified the dominant synoptic-scale atmospheric patterns associated with PM2.5 pollution episodes over the BTH and YRD regions based on an analysis of the variation in the PM2.5 concentration during the winters of 2014–17.
The BTH region was affected by more serious PM2.5 pollution than the YRD region. The average PM2.5 concentrations over the BTH and YRD regions during winters of 2014–17 were 98 and 71 μg m−3, respectively. The PM2.5 concentration was more significantly correlated with meteorological factors over the BTH region than over the YRD region, with the highest correlation coefficient of 0.731 between the relative humidity and PM2.5 pollution over the BTH region. By analyzing the synoptic-scale patterns during typical episodes in winter, four and three types of dominant synoptic patterns were found over the BTH and YRD regions, respectively. In the BTH region, the rear of a high-pressure system approaching the sea, the leading edge of a cold front, a saddle pressure field, and a high-pressure field were associated with PM2.5 pollution, whereas over the YRD region, a high-pressure field, a uniform pressure field, and the external transport of cold air systems favored the occurrence of PM2.5 pollution. When the weather over the BTH region was controlled by a high-pressure field, the rear of a high-pressure system approaching the sea, and the leading edge of a cold front, the PM2.5 pollutants were transported to the YRD region in about 24, 48, and 30 h, respectively.
Acknowledgments. The PM2.5 monitoring data were obtained from the China National Environmental Monitoring Center of the Chinese Ministry of Environmental Protection. The meteorological data were from the China Meteorological Administration. The authors gratefully acknowledge the efforts of these institutions in making these data available online.
| Batterman, S., L. Z. Xu, F. Chen, et al., 2016: Characteristics of PM2.5 concentrations across Beijing during 2013–2015 . Atmos. Environ., 145, 104–114. DOI:10.1016/j.atmosenv.2016.08.060 |
| Cao, J. J., H. M. Xu, Q. Xu, et al., 2012: Fine particulate matter constituents and cardiopulmonary mortality in a heavily polluted Chinese city. Environ. Health Persp., 120, 373–378. DOI:10.1289/ehp.1103671 |
| Chen, X., X. L. Wang, Y. Y. Yue, et al., 2018: Study on weather classification of PM2.5 heavy pollution in Hubei Province . Environ. Sci. Technol., 41, 54–64. DOI:10.19672/j.cnki.1003-6504.2018.11.009 |
| Chen, Y. R. X., and Y. L. Luo, 2018: Analysis of paths and sources of moisture for the South China rainfall during the presummer rainy season of 1979–2014. J. Meteor. Res., 32, 744–757. DOI:10.1007/s13351-018-8069-7 |
| Gao, S., R. Tian, B. Guo, et al., 2018: Characteristics of PM2.5 concentration and its relations with meteorological factors in typical cities of the Yangtze River Delta . Sci. Technol. Eng., 18, 142–155. DOI:10.3969/j.issn.1671-1815.2018.09.021 |
| Guo, X. B., and H. Y. Wei, 2013: Progress on the health effects of ambient PM2.5 pollution . Chinese Sci. Bull., 58, 1171–1177. DOI:10.1360/972013-147 |
| Han, L. J., W. Q. Zhou, W. F. Li, et al., 2014: Impact of urbanization level on urban air quality: A case of fine particles (PM2.5) in Chinese cities . Environ. Pollut., 194, 163–170. DOI:10.1016/j.envpol.2014.07.022 |
| Hu, S. L., and H. N. Liu, 2017: Effects of PM2.5 on the urban radiation and air temperature in Hefei . J. Meteor. Sci., 37, 78–85. DOI:10.3969/2015jms.0077 |
| Huang, J. P., Q. Fu, J. Su, et al., 2009: Taklimakan dust aerosol radiative heating derived from CALIPSO observations using the Fu–Liou radiation model with CERES constraints. Atmos. Chem. Phys., 9, 4011–4021. DOI:10.5194/acp-9-4011-2009 |
| Jia, R., Y. Z. Liu, S. Hua, et al., 2018: Estimation of the aerosol radiative effect over the Tibetan Plateau based on the latest CALIPSO product. J. Meteor. Res., 32, 707–722. DOI:10.1007/s13351-018-8060-3 |
| Jin, Y., D. W. Song, and X. P. Wu, 2015: Meteorological conditions and weather situation of PM2.5 air pollution in Changzhou during 2012–2013 . J. Environ. Sci. Manag., 40, 46–50. DOI:10.3969/j.issn.1673-1212.2015.01.012 |
| Kan, H. D., R. J. Chen, and S. L. Tong, 2012: Ambient air pollution, climate change, and population health in China. Environ. Int., 42, 10–19. DOI:10.1016/j.envint.2011.03.003 |
| Leung, D. M., A. P. K. Tai, L. J. Mickley, et al., 2018: Synoptic meteorological modes of variability for fine particulate matter (PM2.5) air quality in major metropolitan regions of China . Atmos. Chem. Phys., 18, 6733–6748. DOI:10.5194/acp-18-6733-2018 |
| Leung, Y. K., M. C. Wu, and K. K. Yeung, 2009: A study on the relationship among visibility, atmospheric suspended particulate concentration, and meteorological conditions in Hong Kong. Acta Meteor. Sinica, 23, 250–260. |
| Li, S. X., B. Zou, X. Q. Liu, et al., 2017: Pollution status and spatial–temporal variations of PM2.5 in China during 2013–2015 . Res. Environ. Sci., 30, 678–687. DOI:10.13198/j.issn.1001-6929.2017.01.93 |
| Liu, Y. L., Q. M. Sun, M. Y. Zhong, et al., 2016: Temporal and spatial distribution characteristics of PM2.5 in Chongqing urban areas . Environ. Sci., 37, 1219–1229. DOI:10.13227/j.hjkx.2016.04.005 |
| Liu, Y. Z., R. Jia, T. Dai, et al., 2014: A review of aerosol optical properties and radiative effects. J. Meteor. Res., 28, 1003–1028. DOI:10.1007/s13351-014-4045-z |
| Lu, F., D. Q. Xu, Y. B. Cheng, et al., 2015: Systematic review and meta-analysis of the adverse health effects of ambient PM2.5 and PM10 pollution in the Chinese population . Environ. Res., 136, 196–204. DOI:10.1016/j.envres.2014.06.029 |
| Ma, X. H., X. N. Liao, Y. X. Tang, et al., 2017: Weather pattern and case analysis of air heavy pollution days in Beijing. J. Meteor. Environ., 33, 53–60. DOI:10.3969/j.issn.1673-503X.2017.05.007 |
| Ma, Y. X., Y. X. Zhao, S. X. Yang, et al., 2017: Short-term effects of ambient air pollution on emergency room admissions due to cardiovascular causes in Beijing, China. Environ. Pollut., 230, 974–980. DOI:10.1016/j.envpol.2017.06.104 |
| Ma, Y. X., S. X. Yang, J. D. Zhou, et al., 2018: Effect of ambient air pollution on emergency room admissions for respiratory diseases in Beijing, China. Atmos. Environ., 191, 320–327. DOI:10.1016/j.atmosenv.2018.08.027 |
| Ma, Z. W., X. F. Hu, A. M. Sayer, et al., 2016: Satellite-based spatiotemporal trends in PM2.5 concentrations: China, 2004–2013 . Environ. Health Perspect., 124, 184–192. DOI:10.1289/ehp.1409481 |
| Madaniyazi, L., T. Nagashima, Y. M. Guo, et al., 2015: Projecting fine particulate matter-related mortality in East China. Environ. Sci. Technol., 49, 11141–11150. DOI:10.1021/acs.est.5b01478 |
| Mao, W. L., J. H. Xu, D. B. Lu, et al., 2017: An analysis of the spatial–temporal pattern and influencing fctors of PM2.5 in the Yangtze River Delta in 2015 . Resour. Environ. Yangtze Basin, 26, 264–272. DOI:10.11870/cjlyzyyhj201702012 |
| Meng, C. C., L. T. Wang, F. F. Zhang, et al., 2016: Characteristics of concentrations and water-soluble inorganic ions in PM2.5 in Handan City, Hebei Province, China . Atmos. Res., 171, 133–146. DOI:10.1016/j.atmosres.2015.12.013 |
| Meng, M., and Q. S. Zhou, 2014: Progress in PM2.5-caused tumor neovascularization and Metastasis . Sci. Technol. Rev., 32, 52–57. DOI:10.3981/j.issn.1000-7857.2014.26.007 |
| Miao, X. Y., H. L. Zhan, K. Zhao, et al., 2018: Terahertz-dependent PM2.5 monitoring and grading in the atmosphere . Sci. China Phys. Mech. Astron., 61, 104211. DOI:10.1007/s11433-018-9237-1 |
| Nowak, D. J., S. Hirabayashi, A. Bodine, et al., 2013: Modeled PM2.5 removal by trees in ten U.S. cities and associated health effects . Environ. Pollut., 178, 395–402. DOI:10.1016/j.envpol.2013.03.050 |
| Pan, B. F., Y. L. Zhao, J. J. Li, et al., 2012: Analysis of the scavenging efficiency on PM2.5 concentration of some kinds of meteorological factors . Environ. Sci. Technol., 25, 41–44. DOI:10.3969/j.issn.1674-4829.2012.06.012 |
| Sun, J. H., H. J. Wang, J. Wei, et al., 2016: The sources and transportation of water vapor in persistent heavy rainfall events in the Yangtze–Huaihe River Valley. Acta Meteor. Sinica, 74, 542–555. DOI:10.11676/qxxb2016.047 |
| Tao, J., T. T. Cheng, R. J. Zhang, et al., 2013: Chemical composition of PM2.5 at an urban site of Chengdu in southwestern China . Adv. Atmos. Sci., 30, 1070–1084. DOI:10.1007/s00376-012-2168-7 |
| Wang, A. Y., Y. Pan, and Y. B. Tong, 2015: Research of temporal and spatial distribution of air pollution in the major cities of the Yangtze River Delta. Environ. Prot. Sci., 41, 131–136. DOI:10.3969/j.issn.1004-6216.2015.05.025 |
| Wang, G. L., J. J. Xue, and J. Z. Zhang, 2016: Analysis of spatial–temporal distribution characteristics and main cause of air pollution in Beijing–Tianjin–Hebei Region in 2014. Meteor. Environ. Sci., 39, 34–42. DOI:10.16765/j.cnki.1673-7148.2016.01.005 |
| Wang, H. C., Z. B. Wu, J. B. Zhou, et al., 2015: Relationship between PM2.5 concentration and meteorological elements at Shangdianzi station of Beijing . J. Meteor. Environ., 31, 99–104. DOI:10.3969/j.issn.1673-503X.2015.05.014 |
| Wang, Q., M. Liu, Y. P. Yu, et al., 2016: Characterization and source apportionment of PM2.5-bound polycyclic aromatic hydrocarbons from Shanghai city, China . Environ. Pollut., 218, 118–128. DOI:10.1016/j.envpol.2016.08.037 |
| Wang, X. Y., Y. P. Jiang, H. N. Liu, et al., 2016: Analysis of the characteristics of different weather condition impact on air quality in Hangzhou by case studies. Environ. Monit. For., 8, 1–8. |
| Wang, Y. S., L. Yao, L. L. Wang, et al., 2014: Mechanism for the formation of the January 2013 heavy haze pollution episode over central and eastern China. Sci. China Earth Sci., 57, 14–25. DOI:10.1007/s11430-013-4773-4 |
| Wang, Z. B., C. L. Fang, G. Xu, et al., 2015: Spatial–temporal characteristics of the PM2.5 in China in 2014 . Acta Geogr. Sinica, 70, 1720–1734. DOI:10.11821/dlxb201511003 |
| Xu, J. M., L. Y. Chang, J. H. Ma, et al., 2016: Objective synoptic weather classification on PM2.5 pollution during autumn and winter seasons in Shanghai . Acta Sci. Circum., 36, 4303–4314. DOI:10.13671/j.hjkxxb.2016.0224 |
| Xue, T., Y. X. Zheng, G. N. Geng, et al., 2017: Fusing observational, satellite remote sensing and air quality model simulated data to estimate spatiotemporal variations of PM2.5 exposure in China . Remote Sens., 9, 221. DOI:10.3390/rs9030221 |
| Yan, X., W. Z. Shi, W. J. Zhao, et al., 2014: Impact of aerosols and atmospheric particles on plant leaf proteins. Atmos. Environ., 88, 115–122. DOI:10.1016/j.atmosenv.2014.01.044 |
| Yang, X. C., W. J. Zhao, Q. L. Xiong, et al., 2017: Spatial–temporal distribution of PM2.5 in Beijing–Tianjin–Hebei (BTH) area in 2016 and its relationship with meteorological factors . Ecol. Environ. Sci., 26, 1747–1754. DOI:10.16258/j.cnki.1674-5906.2017.10.014 |
| Yang, X., X. L. Zhang, Y. Z. Kang, et al., 2017: Circulation weather type classification for air pollution over the Beijing–Tianjin–Hebei region during winter. China Environ. Sci., 37, 3201–3209. DOI:10.3969/j.issn.1000-6923.2017.09.001 |
| Zhang, J. P., T. Zhu, Q. H. Zhang, et al., 2012: The impact of circulation patterns on regional transport pathways and air quality over Beijing and its surroundings. Atmos. Chem. Phys., 12, 5031–5053. DOI:10.5194/acp-12-5031-2012 |
| Zhang, Y. J., X. Chen, G. D. Xie, et al., 2015: Pollution status and spatial distribution of PM2.5 in China . Resour. Sci., 37, 1339–1346. |
| Zhang, Y. L., and F. Cao, 2015: Fine particulate matter (PM2.5) in China at a city level . Sci. Rep., 5, 14884. DOI:10.1038/srep14884 |
| Zhang, Y. Y., J. L. Lang, S. Y. Cheng, et al., 2018: Chemical composition and sources of PM1 and PM2.5 in Beijing in autumn . Sci. Total Environ., 630, 72–82. DOI:10.1016/j.scitotenv.2018.02.151 |
| Zhao, S. P., Y. Yu, D. H. Qin, et al., 2019: Analyses of regional pollution and transportation of PM2.5 and ozone in the city clusters of Sichuan Basin, China . Atmos. Pollut. Res., 10, 374–385. DOI:10.1016/j.apr.2018.08.014 |
| Zhou, Y. M., and X. Y. Zhao, 2017: Correlation analysis between PM2.5 concentration and meteorological factors in Beijing area . Acta Sci. Nat. Univ. Pekinens., 53, 111–124. DOI:10.13209/j.0479-8023.2017.002 |
| Zhu, Q. Z., Y. Z. Liu, R. Jia, et al., 2018: A numerical simulation study on the impact of smoke aerosols from Russian forest fires on the air pollution over Asia. Atmos. Environ., 182, 263–274. DOI:10.1016/j.atmosenv.2018.03.052 |
 2019, Vol. 33


