The Chinese Meteorological Society
Article Information
- ZHANG, Qingchi, Tim LI, and Jia LIU, 2019.
- Contrast of Evolution Characteristics of Boreal Summer and Winter Intraseasonal Oscillations over Tropical Indian Ocean. 2019.
- J. Meteor. Res., 33(4): 678-694
- http://dx.doi.org/10.1007/s13351-019-9015-z
Article History
- Received February 25, 2019
- in final form April 28, 2019
2. International Pacific Research Center and Department of Atmospheric Sciences, University of Hawaii at Manoa, Honolulu, Hawaii 96822, USA
The Madden–Julian oscillation (MJO; Madden and Julian, 1971, 1972) is the most conspicuous mode of intraseasonal variability in the tropics. It is characterized by the eastward propagation of planetary-scale tropospheric circulation (Madden and Julian, 1972; Li and Zhou, 2009) with a dominant period of 20–90 days (Krishnamurti and Subrahmanyam, 1982; Murakami and Nakazawa, 1985; Sperber et al., 1997; Zhang, 2005; Li and Hsu, 2018).
MJO exhibits pronounced seasonality in its intensity (Madden, 1986), frequency (Hartmann et al., 1992), and movement (Wang and Rui, 1990; Madden and Julian, 1994; Wu et al., 2006). In boreal winter, MJO is dominated by eastward propagation along the equator, with maximum variability shifting slightly south of the equator (Zhao et al., 2013). In boreal summer, eastward propagating intraseasonal oscillation (ISO) signals substantially weaken, whereas northward propagating signals prevail in the Indian monsoon and South China Sea regions (Yasunari, 1979; Hartmann and Michelsen, 1989; Jiang et al., 2004) and northwestward propagating signals prevail over the western North Pacific (WNP; Murakami, 1980; Hsu and Weng, 2001).
Due to the distinctive evolution characteristics, the eastward-propagating ISO in boreal winter is referred to as MJO, while the ISO in northern summer is often referred to as boreal summer ISO (BSISO). The cause of the ISO seasonality is primarily attributed to the asymmetry of summer and winter mean state (Li, 2014). In a theoretical analysis, Li (2014) demonstrated that under the boreal winter mean state where the maximum convection is near the equator, atmospheric moist Kelvin waves are unstable while Rossby waves are stable. As a result, ISO perturbation can maintain its amplitude near the equator as it moves eastward. Under the boreal summer mean state when the monsoon trough over the Maritime Continent longitudes is located beyond one Rossby radius of deformation, atmospheric Rossby waves become unstable while Kelvin waves are stable. As a result, equatorial convection dissipates while off-equatorial perturbations associated with Rossby waves grow, promoting the northward propagation of ISO convection.
Various theories have been proposed in understanding MJO eastward propagation. Early studies suggested that MJO is a moist Kelvin wave forced by convective heating through the wave-CISK (conditional instability of the second kind) mechanism (Chang, 1977; Lau and Peng, 1987) or results from the wind-induced surface heat exchange (WISHE) process (Emanuel, 1987; Neelin et al., 1987; Li et al., 2002). Wang and Li (1994) proposed that MJO is a Kelvin–Rossby wave couplet in the presence of atmospheric planetary boundary layer (PBL). More recently, a moisture mode theory was proposed, and a key to the moisture mode theory is the zonal asymmetry of the ISO-scale moisture or moist static energy anomaly (e.g., Sobel et al., 2001; Fuchs and Raymond, 2002; Hsu and Li, 2012; Sobel and Maloney, 2013; Kim et al., 2014; Jiang et al., 2015; Wang et al., 2017, among many others). For example, Hsu and Li (2012) showed that PBL moistening in front of MJO convection, caused primarily by anomalous vertical advection, is critical for atmospheric destabilization in situ and MJO eastward propagation.
MJO initiation often happens over western tropical Indian Ocean (Matthew, 2000, 2008; Seo and Kim, 2003; Jiang and Li, 2005; Li et al., 2008; Seo and Song, 2012). Based on a 20-yr observational data analysis, Zhao et al. (2013) showed that the dominant precursory signal for MJO initiation is PBL moistening caused by the advection of mean moisture by easterly anomalies associated with the preceding opposite-phase MJO. Another precursory signal is the occurrence of anomalous ascending motion in lower troposphere caused by warming advection (Li et al., 2015; Mei et al., 2015). In addition, anomalous SST warming over southwest tropical Indian Ocean (Li et al., 2008) and midlatitude Rossby waves (Hsu et al., 1990; Zhao et al., 2013) are possible triggers for MJO initiation.
Most of the previous studies focused on ISO characteristics in a particular season and paid less attention to a thorough comparison of the winter and summer ISO. The objective of the current study is to analyze the summer and winter ISO in the same diagnosis framework, with a particular emphasis on evolution (propagation and initiation) characteristics over the tropical Indian Ocean. The remaining paper is organized as follows. In Section 2, the data and analysis methods are described. Section 3 illustrates observed structure and evolution characteristics of MJO and BSISO. The cause of distinctive propagation features in summer and winter is investigated in Section 4, while mechanisms responsible for the winter–summer initiation difference are discussed in Section 5. Finally, the conclusions are given in Section 6.
2 Data and methodThe primary data used in this study include (1) daily mean satellite-observed outgoing longwave radiation (OLR) from the NOAA; (2) daily NOAA optimum interpolation (OI) sea surface temperature (SST) product that was derived from satellite retrievals and ship and buoy observations; and (3) daily atmospheric variables that include specific humidity (q), horizontal wind velocity (zonal u and meridional v components), vertical velocity (ω), temperature (T), and surface wind stress from the ECMWF Interim reanalysis (ERA-Interim). The observed OLR is used as a proxy to represent atmospheric deep convection in the tropics. It has a resolution of 2.5° × 2.5° and covers a period of 1982–2012. The OI SST has a resolution of 0.5° × 0.5° from 1982 to 2012. The ERA-Interim dataset has a 1.5° × 1.5° latitude–longitude grid, covering the same period from 1982 to 2012.
To understand moisture associated with ISO, moisture budgets will be diagnosed. Following Yanai et al. (1973), moisture tendency equations may be written as:
| $ \frac{{\partial {{q}}}}{{\partial t}} = - { V} \cdot \nabla q - \omega \frac{{\partial q}}{{\partial p}} - \frac{{{Q_2}}}{L}, $ | (1) |
where
A Lanczos band-pass filter was used to separate a given field, A, into a low-frequency background state component (LFBS; with a 90-day low-pass filter), an ISO-scale (20–90-day band-pass filter) component, and a higher-frequency (with a 20-day high-pass filter) component:
| $ A = \bar A + A' + {A^*}, $ | (2) |
where an overbar denotes the LFBS, a prime the ISO component, and an asterisk the higher-frequency component.
By applying a 20–90-day band-pass filtering operator to Eq. (1), intraseasonal moisture tendency equations may be written as:
| $ {\left({\frac{{\partial q}}{{\partial t}}} \right)^\prime } = {\left({ - { V} \cdot \nabla {{q}}} \right)^\prime } - {\left({\omega \frac{{\partial q}}{{\partial p}}} \right)^\prime } + {\left({\frac{{{Q_2}}}{L}} \right)^\prime }. $ | (3) |
Each of the nonlinear terms in the right hand side of Eq. (3) can be decomposed into nine terms. Through the diagnosis of the moisture budgets, major processes that affect the intraseasonal moisture tendencies can be revealed.
To consider the equivalent degree of freedom of the significance test, we follow the approach proposed by Davis (1976) and Chen (1982). When the correlation coefficient of two variables (x and y) are strongly persistent or highly auto-correlated, the equivalent degree of freedom is
| $ {R_{xx}}(\tau) = \frac{1}{{n - \tau }}\sum\limits_{t = 1}^{n - \tau } {x_\tau ^\sigma } \cdot x_{t + \tau }^\sigma, $ | (4) |
| $ {R_{{\rm{yy}}}}(\tau) = \frac{1}{{n - \tau }}\sum\limits_{t = 1}^{n - \tau } {y_\tau ^\sigma } \cdot y_{t + \tau }^\sigma, $ | (5) |
where τ is time lag and is usually one-half of n, and σ represents standardization.
Because the goal of the present study is to reveal the seasonal contrast of ISO evolution over the tropical Indian Ocean (IO), we will focus on analyzing and comparing the ISO behaviors in boreal summer (JJAS) and boreal winter (DJFM).
3 Distinctive evolution characteristics of MJO and BSISO over Indian OceanTo clearly illustrate the ISO evolution difference between boreal summer and winter, we conducted an EOF analysis of the time−longitudinal section of the OLR anomaly averaged over equatorial IO. Figure 1 shows the so-calculated EOF patterns in boreal winter and summer seasons, respectively. The most striking feature is that when the BSISO experiences a stationary oscillation with maximum OLR variability confined in the longitudinal zone of 70°−90°E, the MJO exhibits clear eastward-propagation from 50°E all the way to 100°E. The two leading EOF modes exhibit the similar evolution characteristics in the respective season. The sum of the two leading EOF modes explains a similar amount of total variance (32%) for both the summer and winter.

|
| Figure 1 The leading EOF patterns of time−longitude section of 20–90-day filtered OLR anomalies from 1982 to 2012 for boreal summer (top) and winter (bottom) seasons. For boreal summer (winter) the anomalous OLR is averaged over 10°S–10°N (15°S–5°N). The green arrow indicates the direction of propagation. |
Another way to illustrate the summer−winter difference is to carry out an ordinary EOF analysis of 1D daily OLR field averaged over the equatorial IO for a 30-yr period [separated for the summer (JJAS) and winter (DJFM) seasons. The time series of so calculated first and second EOF modes in boreal winter are significantly lagged correlated, indicating that they reflect a propagating mode. However, the time series of leading two EOF modes in boreal summer are not significantly correlated, and the first mode (which explains a total variance of 64%) is well separated from the other modes. As a result, the dominant ISO mode in boreal summer exhibits a quasi-stationary oscillation at the equator. The winter and summer ISO evolution characteristics derived from this ordinary EOF analysis (figure omitted) are consistent with those shown in Fig. 1.
The EOF analyses above indicate that ISO has distinctive evolution characteristics in boreal winter and summer. In boreal winter, ISO is initiated over western IO (WIO) and them propagates eastward across the entire IO basin into the Maritime Continent (MC). However, in boreal summer, ISO is initiated over central IO and dissipates before it reaches MC. With maximum amplitude being confined over eastern IO (EIO), the summer ISO at the equator looks more likely a stationary oscillation mode.
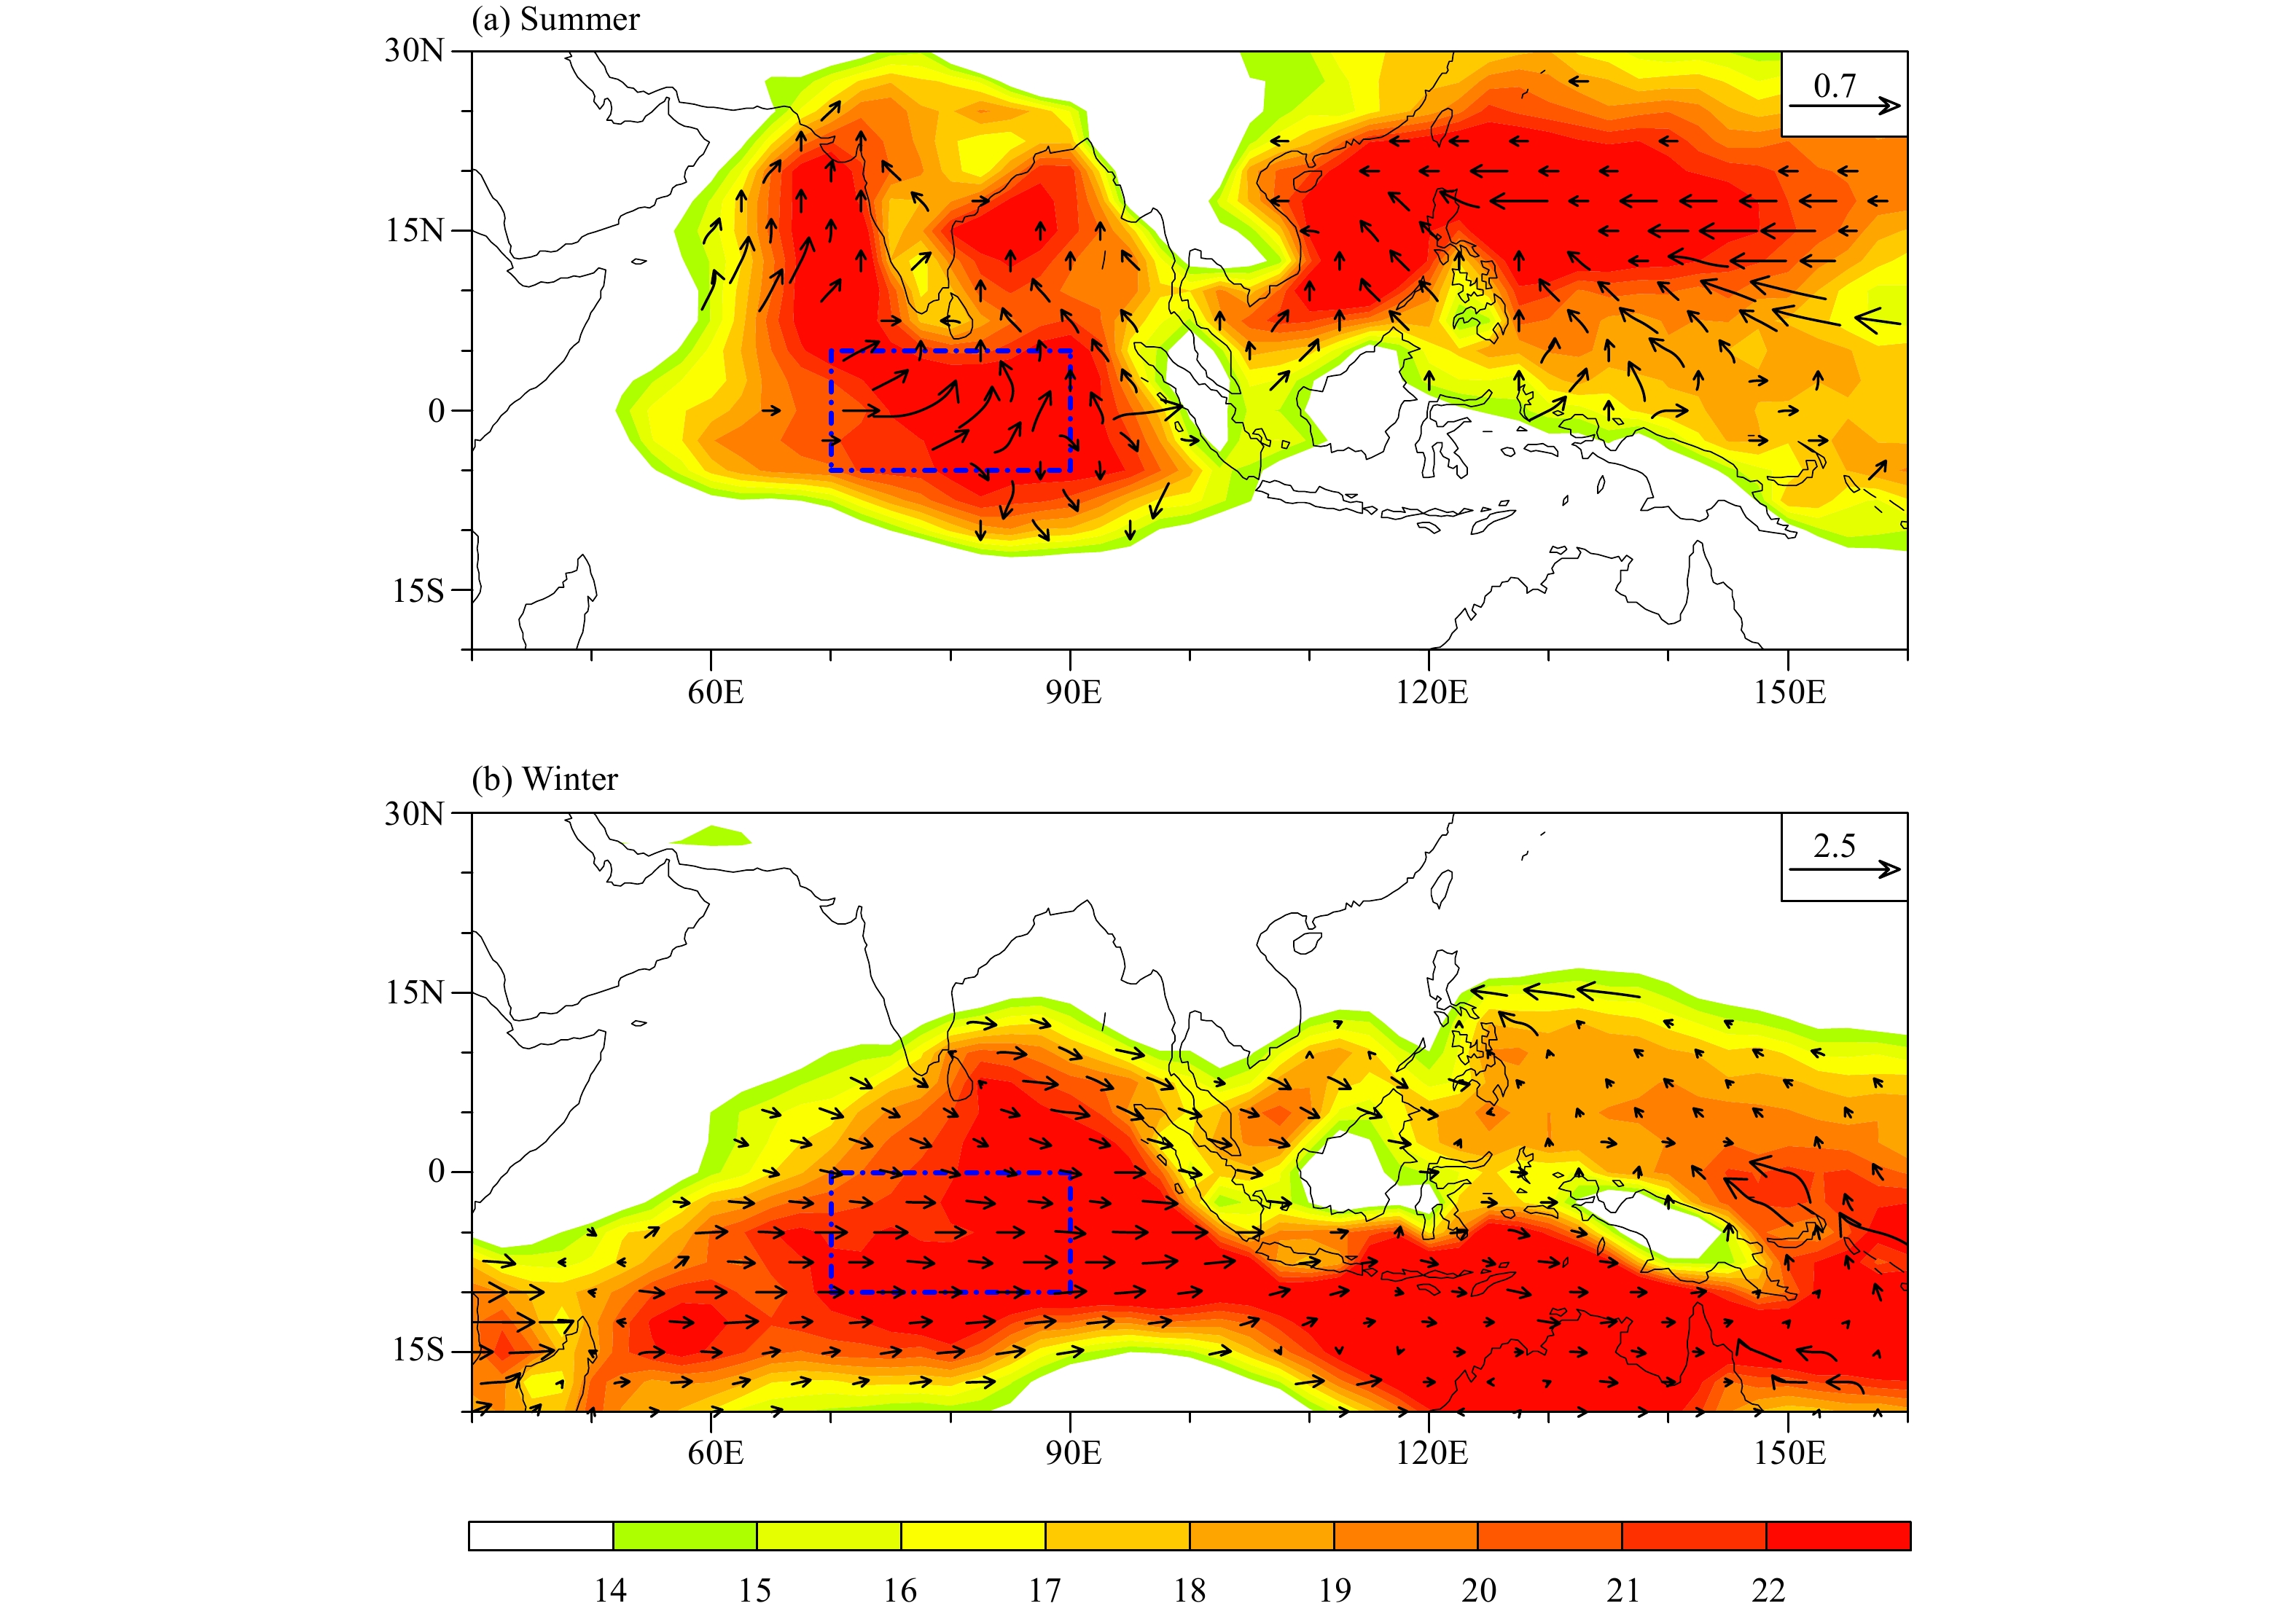
Such a seasonal contract can be further seen from the horizontal patterns of standard deviation of 20–90-day filtered OLR field (Fig. 2). Maximum intraseasonal OLR variability is confined over the EIO in boreal summer. In contrast, strong ISO variability is seen cover entire IO basin, extending from southwestern to eastern IO in boreal winter.
|
| Figure 2 The standard deviation (shaded) of 20–90-day band-pass filtered OLR field and the propagation vector (arrow) calculated based on the OLR anomalies at the near grids. The blue box is a reference region for subsequent regression analyses. |
Vectors in Fig. 2 represent the direction of ISO propagation. The propagation vectors were calculated based on the lead−lag correlation of the OLR anomaly in situ and in the surrounding region (Li and Wang, 2005). As shown in Fig. 2b, after initiated over WIO, MJO moves eastward along the climatological intertropical convergence zone (ITCZ) that tilts northeastward from 10°–15°S over WIO to near the equator over EIO. In boreal summer, pronounced northward propagation happens over the EIO.
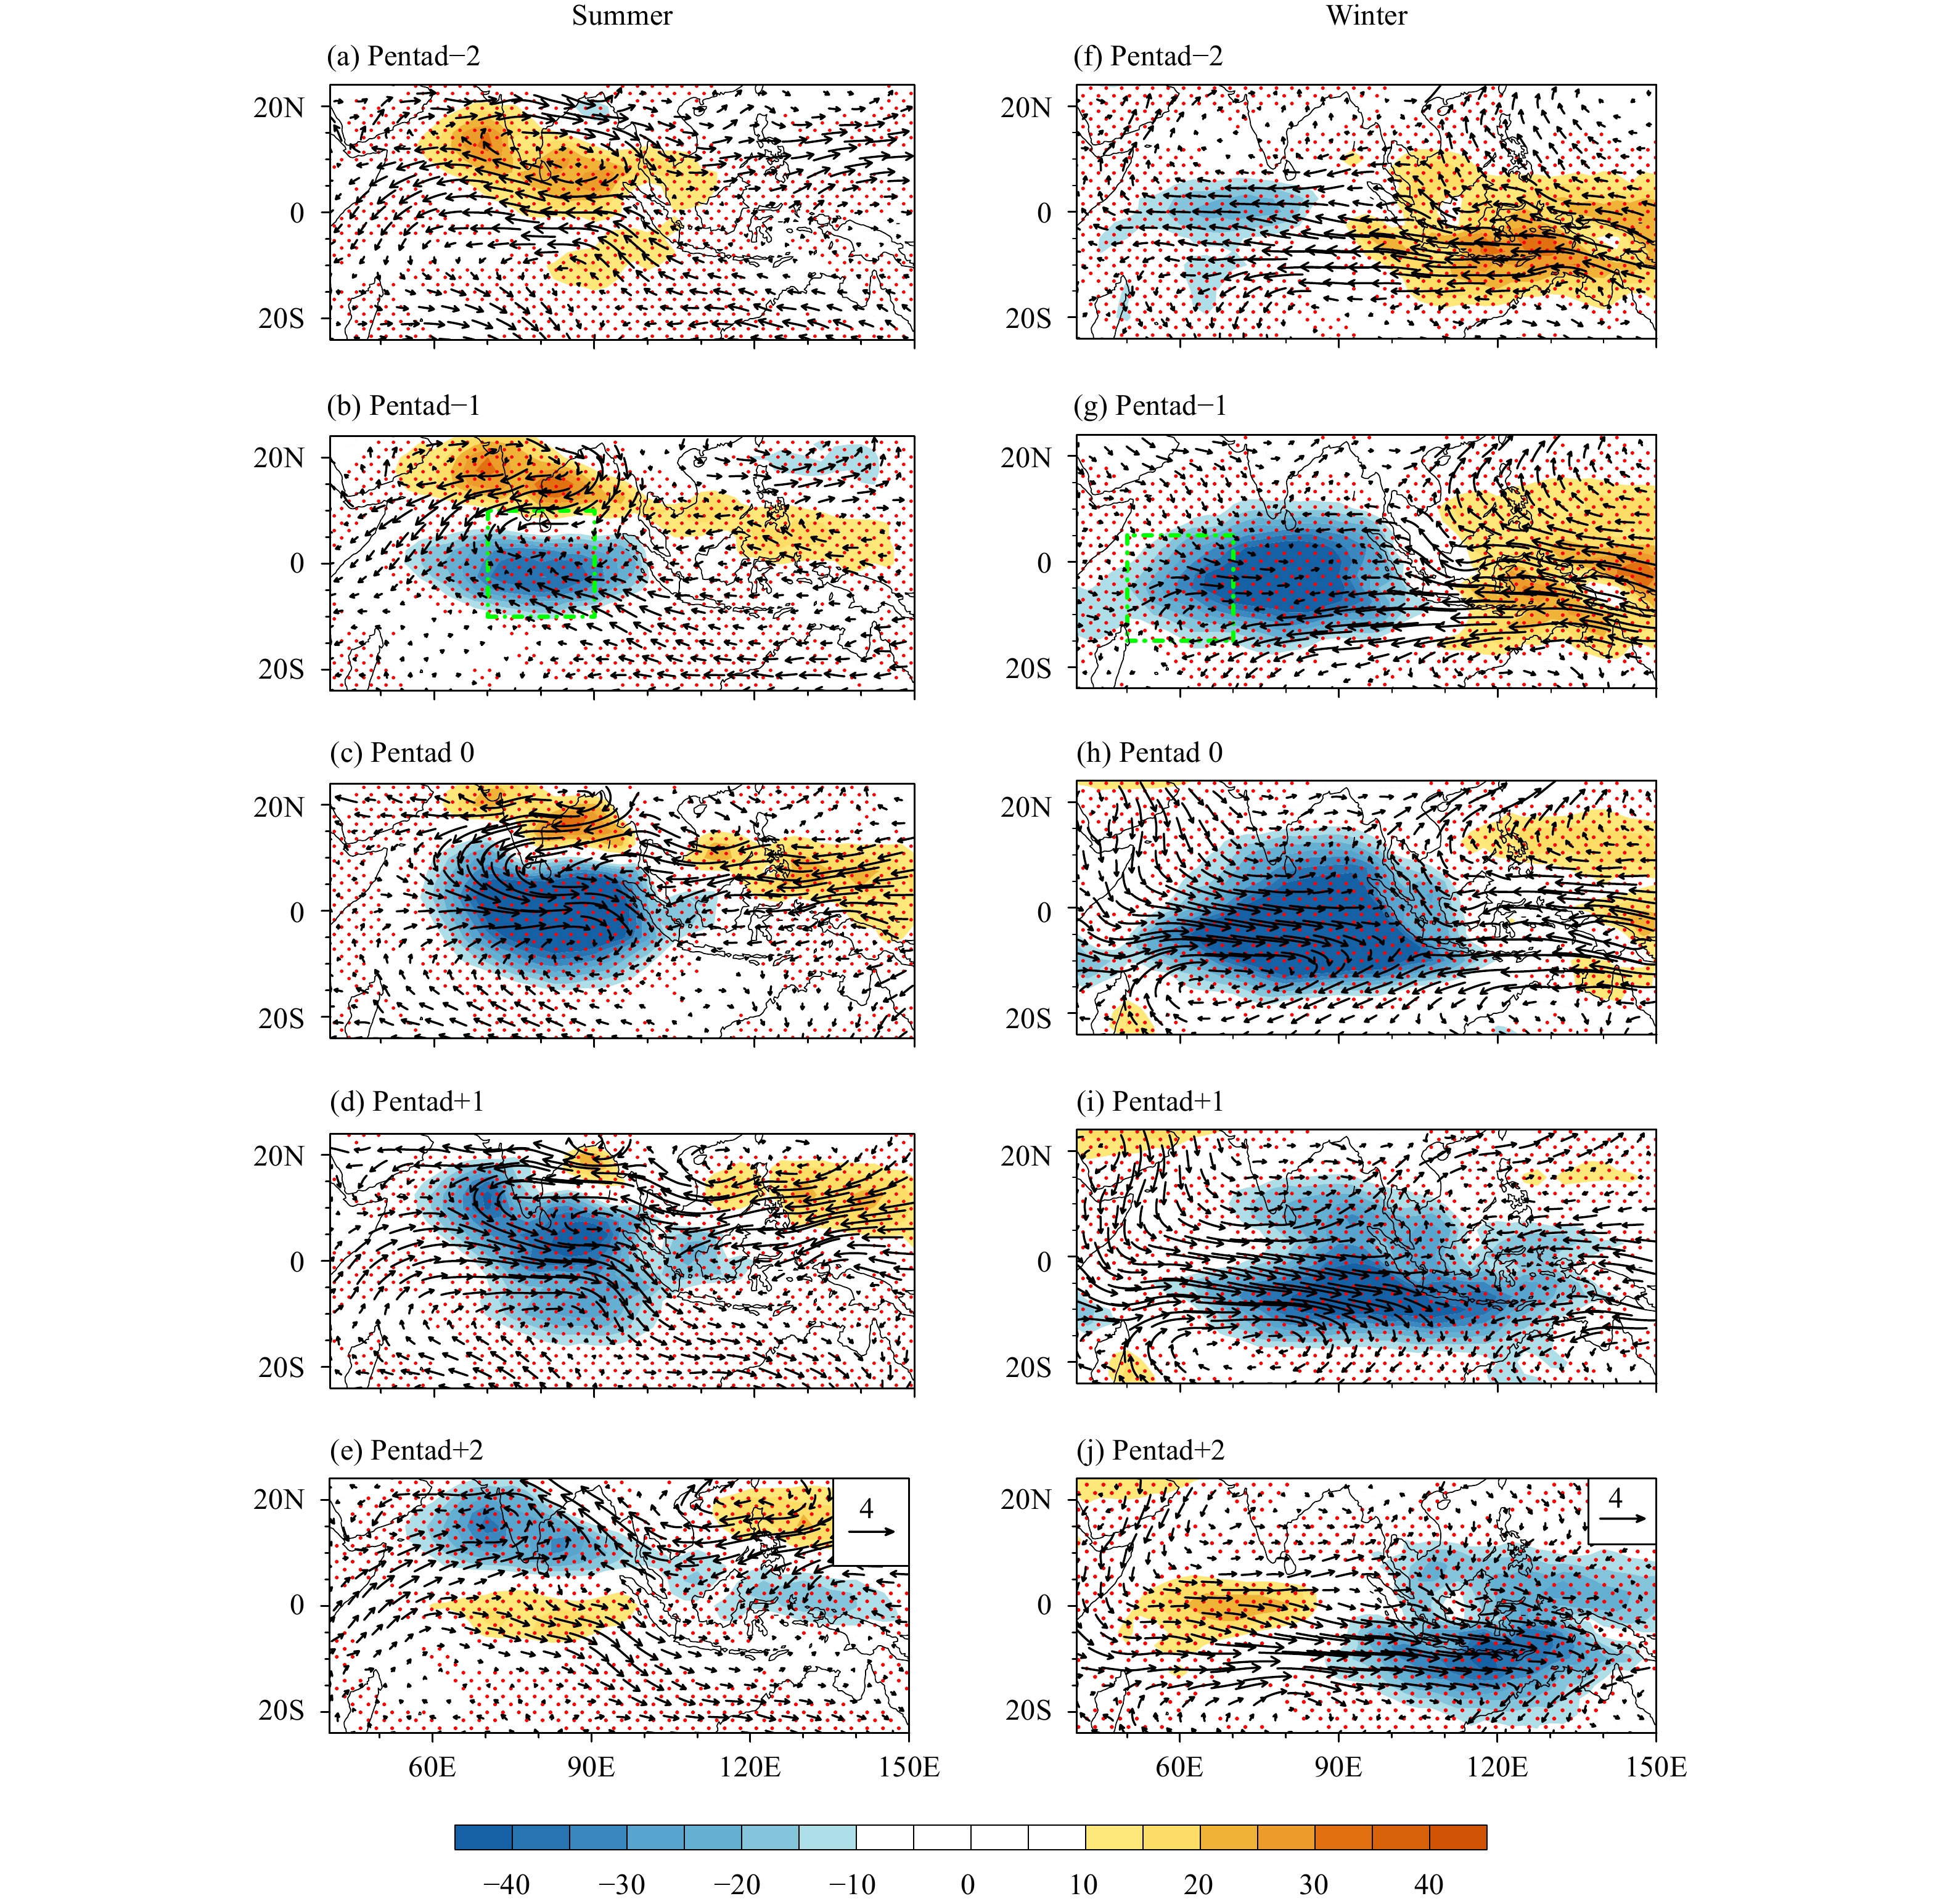
To illustrate the dominant evolution patterns of the summer and winter ISO, we regressed the OLR and wind anomalies onto a reference OLR time series averaged over the blue dashed boxes shown in Fig. 2. The left panel of Fig. 3 shows the evolution of the OLR and 850-hPa wind anomaly fields in boreal summer. A negative OLR anomaly, representing the convective phase of BSISO, appears in central IO in pentad −1. It strengthens and reaches maximum intensity in pentad 0. Then the main convective branch of BSISO shifts northward, with a northwest–southeast oriented rain belt over northern IO in pentad 1. As the rain belt continues moving northward, a positive OLR anomaly center emerges in the equatorial central IO in pentad 2.
|
| Figure 3 Evolutions of regressed OLR (W m–2) and 850-hPa wind (m s–1) anomaly patterns from pentads –2 to +2 during boreal summer (left pa-nels) and winter (right panels). Pentad 0 represents the time when ISO convection is located over the central equatorial Indian Ocean (blue box in Fig. 2). The green boxes in (b, g) represent the key regions for ISO initiation in boreal summer and winter respectively. The anomalous wind that exceeds the 99% confidence level is shown, and the red dotted area indicates that the OLR field passes the 99% confidence test. |
In contrast, the MJO evolution patterns are very different (right panel of Fig. 3). A convective anomaly first develops over WIO in pentad −2. Then this convective anomaly gradually amplifies as it moves eastward from pentads −1 to 1. Eventually in pentad 2, the MJO convection pass over the MC region (10°–5°S, 100°–140°E), while a negative convective anomaly is initiated over WIO.
Figure 3 clearly illustrates the evolution difference over IO between BSISO and MJO. In boreal summer, ISO appears quasi-stationary at the equator, and is dominated by northward propagation. In boreal winter, ISO activity covers a much larger longitudinal region and is dominated by eastward propagation. In the following, we will attempt to understand mechanisms responsible for the difference.
4 Cause of winter–summer difference in ISO propagationFigures 3c and 3h illustrate that in pentad 0 when maximum convection appears over equatorial EIO, ISO exhibits a northward moving tendency in boreal summer but an eastward moving tendency in boreal winter. What causes such a difference? In the following, through the diagnosis of PBL moisture budget, we intend to address the question.
Figure 4 shows the zonal–vertical cross-sections of anomalous specific humidity and specific humidity tendency fields averaged over the near-equatorial region. When the ISO convective center is near 90°E, the specific humidity anomaly shows a clear vertically tilting structure with PBL moisture anomaly leading the convection in both the summer and winter. Such a feature is consistent with previous studies (e.g., Sperber, 2003; Hsu and Li, 2012). However, the specific humidity tendency field shows a distinctive feature between the summer and winter in front of the ISO convection, that is, a negative (positive) tendency appears in boreal summer (winter) over 120°–140°E. It is the distinctive humidity tendency that causes the eastward propagation in boreal winter but the dissipation of convection over MC in boreal summer.

|
| Figure 4 Zonal–vertical distributions of anomalous specific humidity (contour; 10–3 kg kg–1) and specific humidity tendency (shaded; 10–3 kg kg–1 day–1) fields averaged over 5°–10°S in pentad 0 during (a) boreal summer and (b) boreal winter. The dotted area indicates that the anomalous specific humidity field passes the 99% confidence test. Only specific humidity tendency that exceeds 99% confidence level is shown. Red triangles represent the location of ISO convective center. |
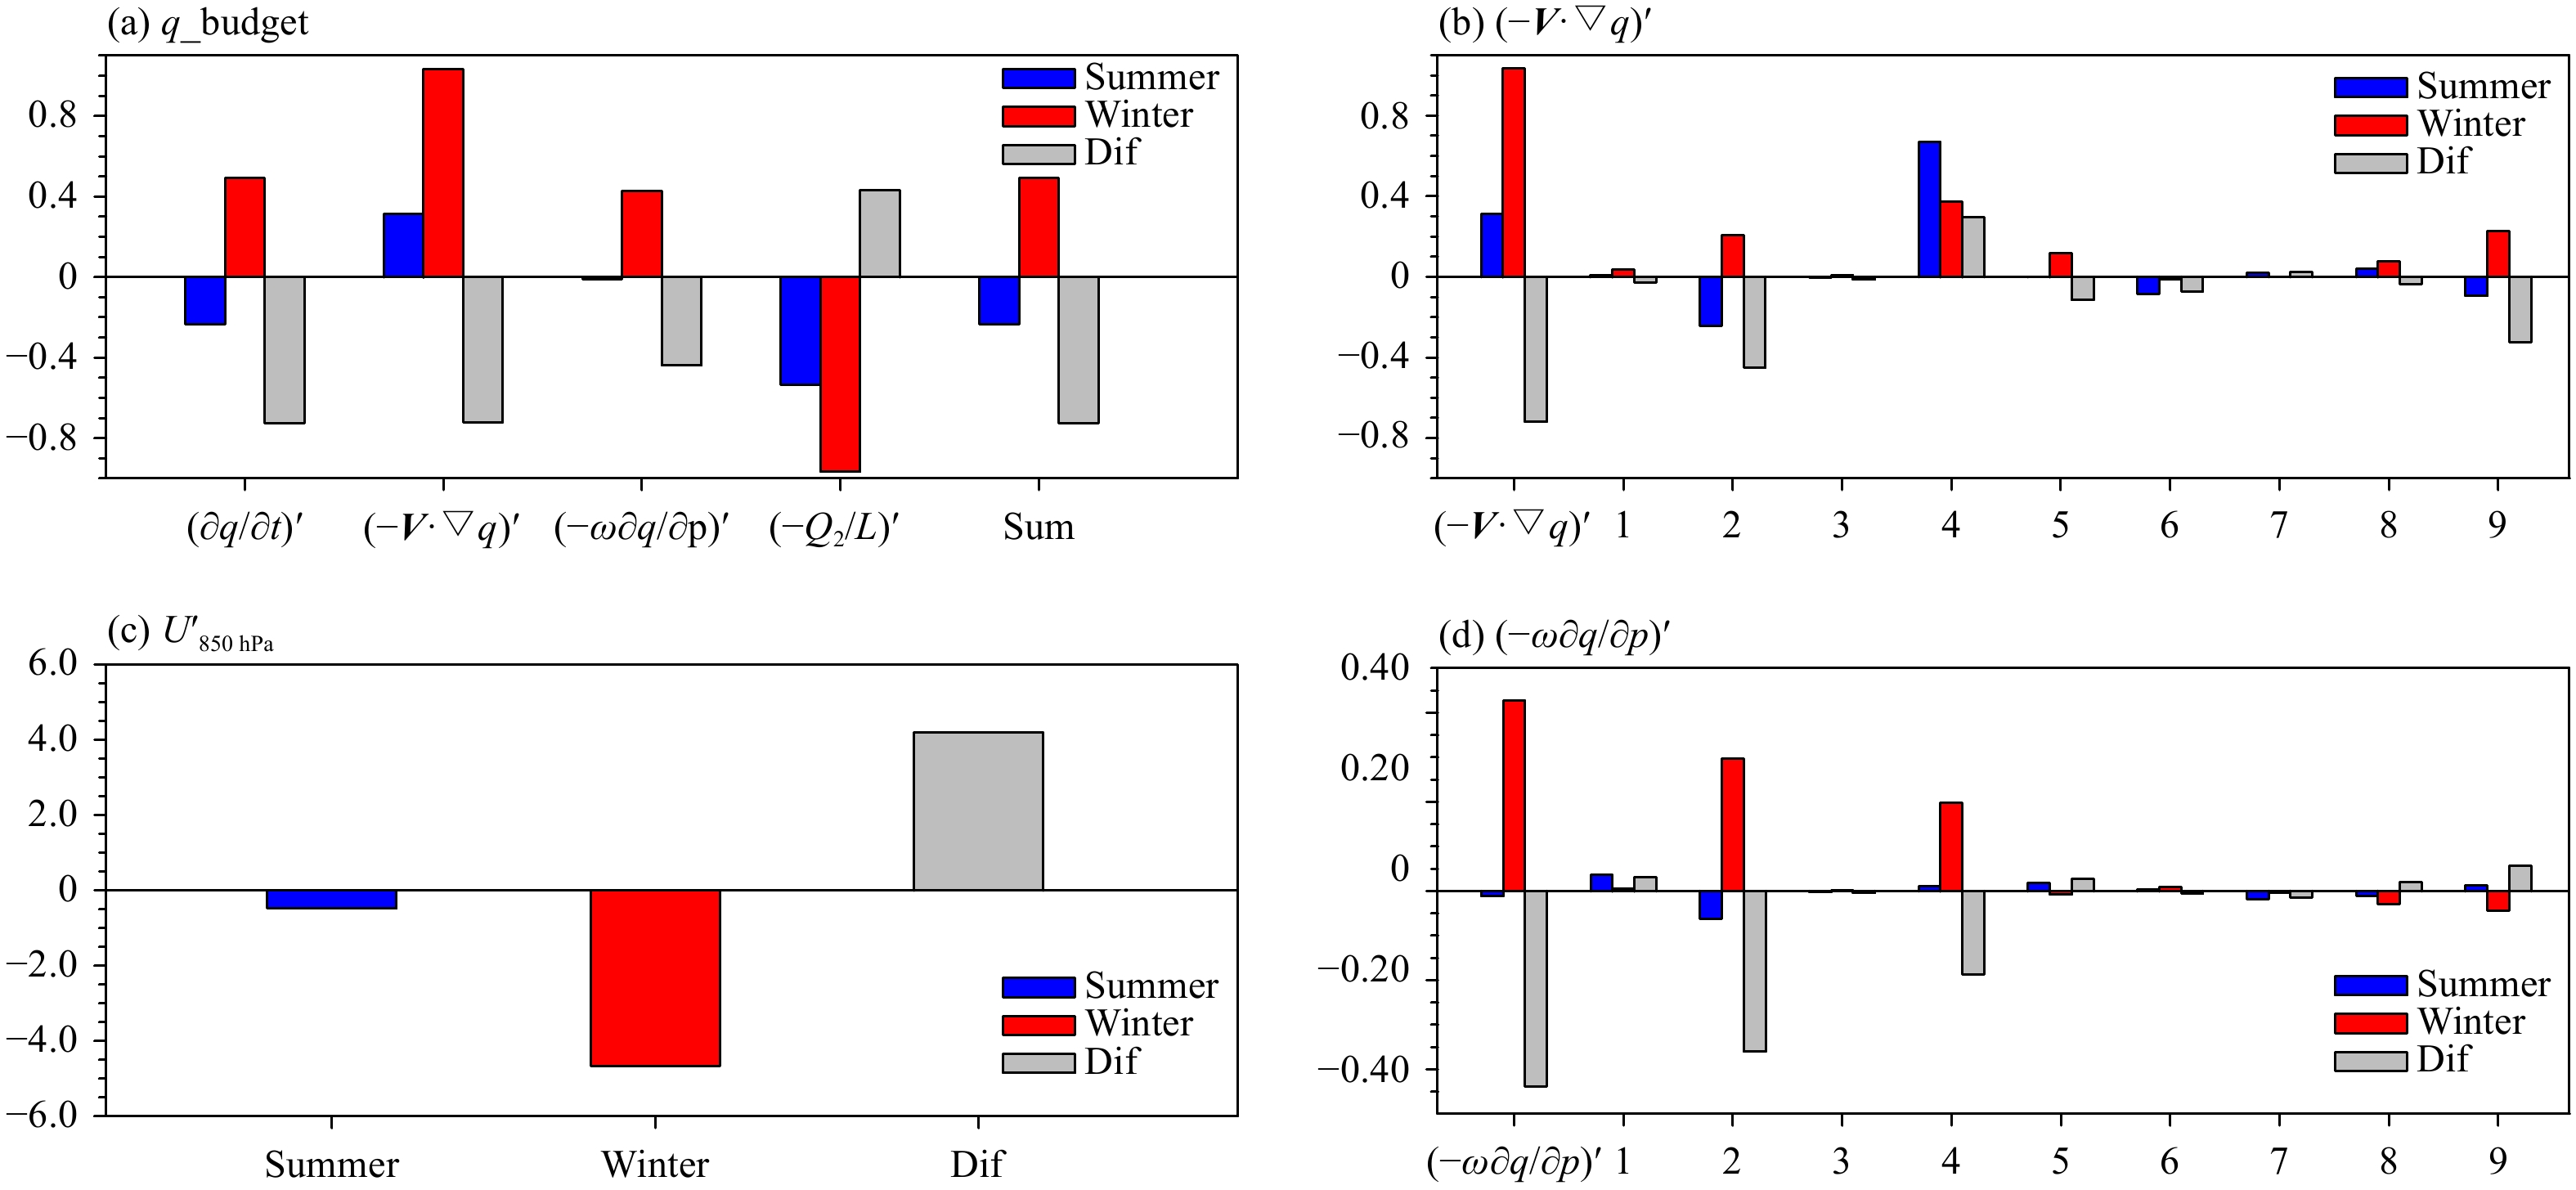
To reveal the cause of the distinctive moisture tendencies between the summer and winter, we conduct a vertically integrated (1000–500 hPa) moisture budget analysis over 10°–5°S, 120°–140°E. Figure 5a shows the contribution from each of the moisture budget terms in Eq. (3). The major contribution to the winter–summer tendency difference arises from horizontal advection, while vertical advection also plays a role.
|
|
Figure 5 (a) Vertically integrated (1000–500 hPa) intraseasonal moisture budget terms averaged over 5°–10°S, 120°–140°E in pentad 0 (black box in Fig. 4). From left to right, observed specific humidity tendency, horizontal moisture advection, vertical moisture advection, apparent moisture source, and sum of the last three terms. (b) Individual components of the anomalous horizontal moisture advection, with term 1–9 representing, respectively,
|
To examine specific horizontal advection processes that contribute to the tendency difference, we further calculated the contributions from each of nine horizontal advection terms (Fig. 5b). The result shows that the maxi-mum contribution arises from the advection of anomalous intraseasonal moisture by the LFBS flow (i.e., term 2), followed by nonlinear higher-frequency moisture advection process (term 9).
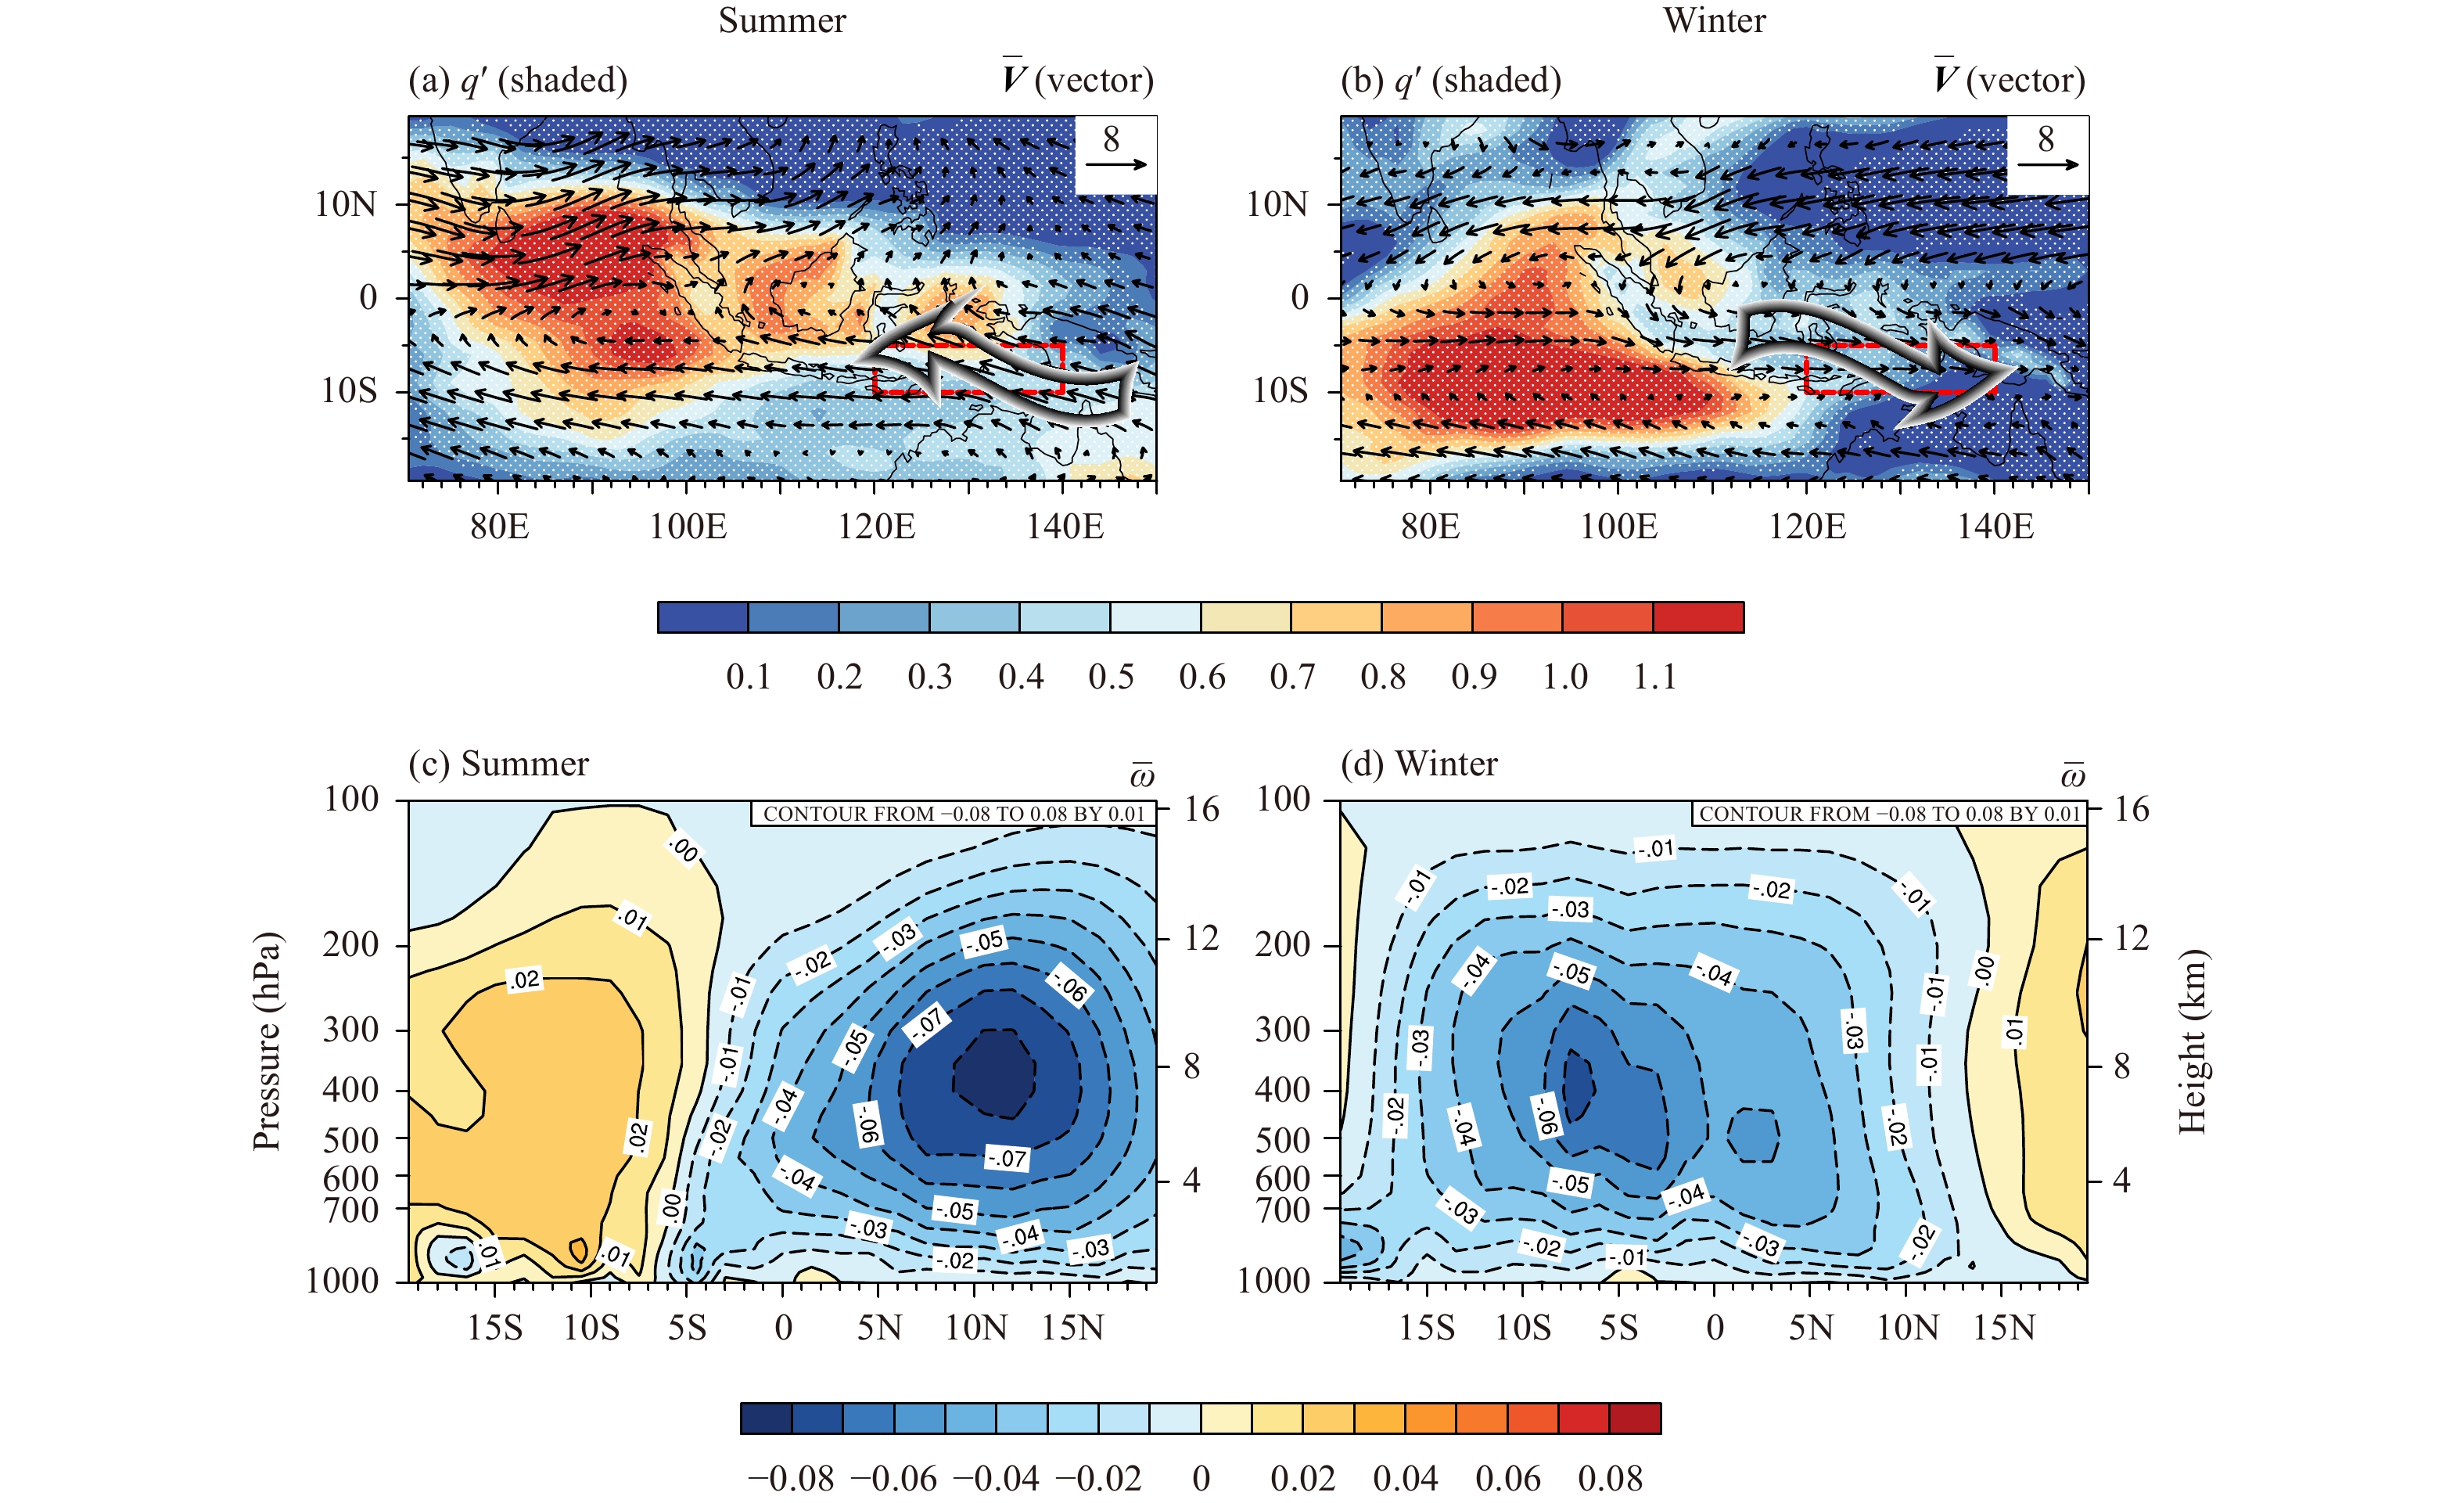
The cause of the anomalous moisture advection by the LFBS flow may be explained as following. While the zonal gradient of the intraseasonal moisture anomaly has the same sign in the key analysis region (red box in Figs. 6a, b), the mean flow is opposite between boreal summer and winter. The LFBS flow in the region is dominated by easterly in boreal summer but changes to westerly in boreal winter. Because of the seasonal change of the mean wind, a positive (negative) humidity tendency is resulted in boreal winter (summer).
|
| Figure 6 (Top) Vertically integrated (1000–500 hPa) LFBS wind (m s–1) and intraseasonal specific humidity (shaded; 10–3 kg kg–1) fields during the active phase of ISO over EIO in (a) boreal summer and (b) winter. The dotted area indicates that the anomalous specific humidity field passes the 99% confidence test. (Bottom) Meridional–vertical distributions of LBFS vertical p-velocity (Pa s–1) averaged over 120°–140°E in (c) boreal summer and (d) winter. |
A stronger nonlinear eddy moisture advection in boreal winter than in boreal summer is possibly attributed to the background wind. Compared to boreal summer, a stronger intraseasonal easterly appears in the key region in boreal winter (Fig. 5c). It has been shown that a stronger low-level easterly and associated westerly vertical shear tend to suppress the synoptic scale activity (Maloney, 2009), leading to a weaker intrusion (or meridional mixing) of dry subtropical air into the equatorial region and thus a positive specific humidity tendency anomaly in boreal winter.
The difference of anomalous vertical advection between boreal summer and winter is primarily attributed to the advection of anomalous intraseasonal moisture by the LFBS vertical velocity (term 2) (Fig. 5d). In boreal summer, the maximum mean ascending branch averaged appears at 10°N, 120°–140°E, and the region of 10°–5°S is dominated by mean downward motion (Fig. 6c). This is in great contrast to boreal winter when maximum mean ascending motion is located over 10°–5°S (Fig. 6d). Given that intraseasonal moisture anomalies have a maximum in lower troposphere (Fig. 4), the mean ascending (descending) motion in boreal winter (summer) south of the equator would induce a positive (negative) vertical advection anomaly in situ.
In addition, the advection of mean moisture by anomalous intraseasonal vertical velocity (term 4:
Because of the distinctive specific humidity tendency in front of the ISO convection between the summer and winter (Fig. 4), the MJO continues moving eastward across the MC, while the BSISO in EIO does not have an eastward moving tendency, rather it moves northward (Fig. 3). The cause of the northward propagation in boreal summer was discussed by Jiang et al. (2004), who proposed the following two mechanisms are most relevant: the vertical shear mechanism and the moisture-circulation feedback mechanism. Our diagnosis confirms the mechanisms proposed by Jiang et al. (2004), that is, a barotropic vorticity anomaly and a low-level moisture anomaly lead the BSISO convection (Figs. 7a, b, c). While the background mean vertical shear is critical in coupling free-atmospheric baroclinic and barotropic modes and in generating a barotropic vorticity anomaly ahead of the convection (Fig. 7b), anomalous moisture advection by LFBS wind and the advection of mean moisture by anomalous wind both contribute to the setup of an asymmetric (relative to the BSISO convection) moisture field (Fig. 7d).

|
| Figure 7 Meridional–vertical structures of northward propagating BSISO averaged over 70°–90°E in pentad 0: (a) vertical velocity (Pa s–1), (b) vorticity (10–6 s–1), (c) specific humidity (10–3 kg kg–1), and (d) meridional–vertical profile of the north–south component of the summer mean flow (m s–1) averaged between 70° and 90°E. The dotted area indicates that anomalous vertical velocity, vorticity, and specific humidity fields pass the 99% confidence test. |
Besides the aforementioned atmospheric dynamical processes, air–sea interaction also plays a role in the northward propagation. It has been shown that a warm (cold) SST anomaly (SSTA) often precedes a positive (negative) convection anomaly, implying the effect of SSTA on ISO convection (e.g., Lau and Sui, 1997; Vecchi and Harrison, 2002; Stephens et al., 2004; Li et al., 2008; Roxy and Tanimoto, 2012). Figure 8a shows the anomalous SST and wind patterns associated with BSISO convection over equatorial EIO. Note that a belt of warm SSTA occurs over the Arabian Sea–Bay of Bengal region north of the BSISO convection. Such a warm belt favors the northward propagation of the BSISO convection. The cause of the warming is attributed to enhanced shortwave radiation associated with anomalous downward motion and reduced surface latent heat flux due to anomalous easterlies that oppose the mean westerlies.

|
| Figure 8 Anomalous OLR (red for positive and green for negative, interval: 10 W m–2), SST (shaded; °C), and surface wind stress (arrow; 102 N m–2 s) fields regressed onto the intraseasonal OLR anomaly over EIO (blue box in Fig. 2). The dotted area indicates that the anomalous SST field passes the 99% confidence test. Only OLR and surface wind stress anomalies that exceed 99% confidence level are shown. |
Similarly, air–sea interaction also contributes to MJO propagation in boreal winter. Note that a positive SSTA appears to the east of the MJO convection (Fig. 8b). Again the warming results from both surface shortwave radiation and latent heat flux anomalies. To the east of the MJO convection, anomalous descending motion leads to an SST warming through increased downward shortwave radiation. Meanwhile, anomalous easterly tends to reduce the background mean westerly, leading to a weaker surface evaporation. Thus, the in-phase relationship between the shortwave radiation and latent heat flux anomalies leads to a strong SST warming tendency east of MJO convection. The warm SSTA may further destabilize the atmosphere through boundary layer moisture convergence (Hsu and Li, 2012). However, such an in-phase relationship does not occur in boreal summer over the same location (i.e., east of the BSISO convective center) where the mean flow is easterly. Therefore, it follows that the air–sea interaction may provide an additional mechanism in interpreting the summer–winter ISO difference.
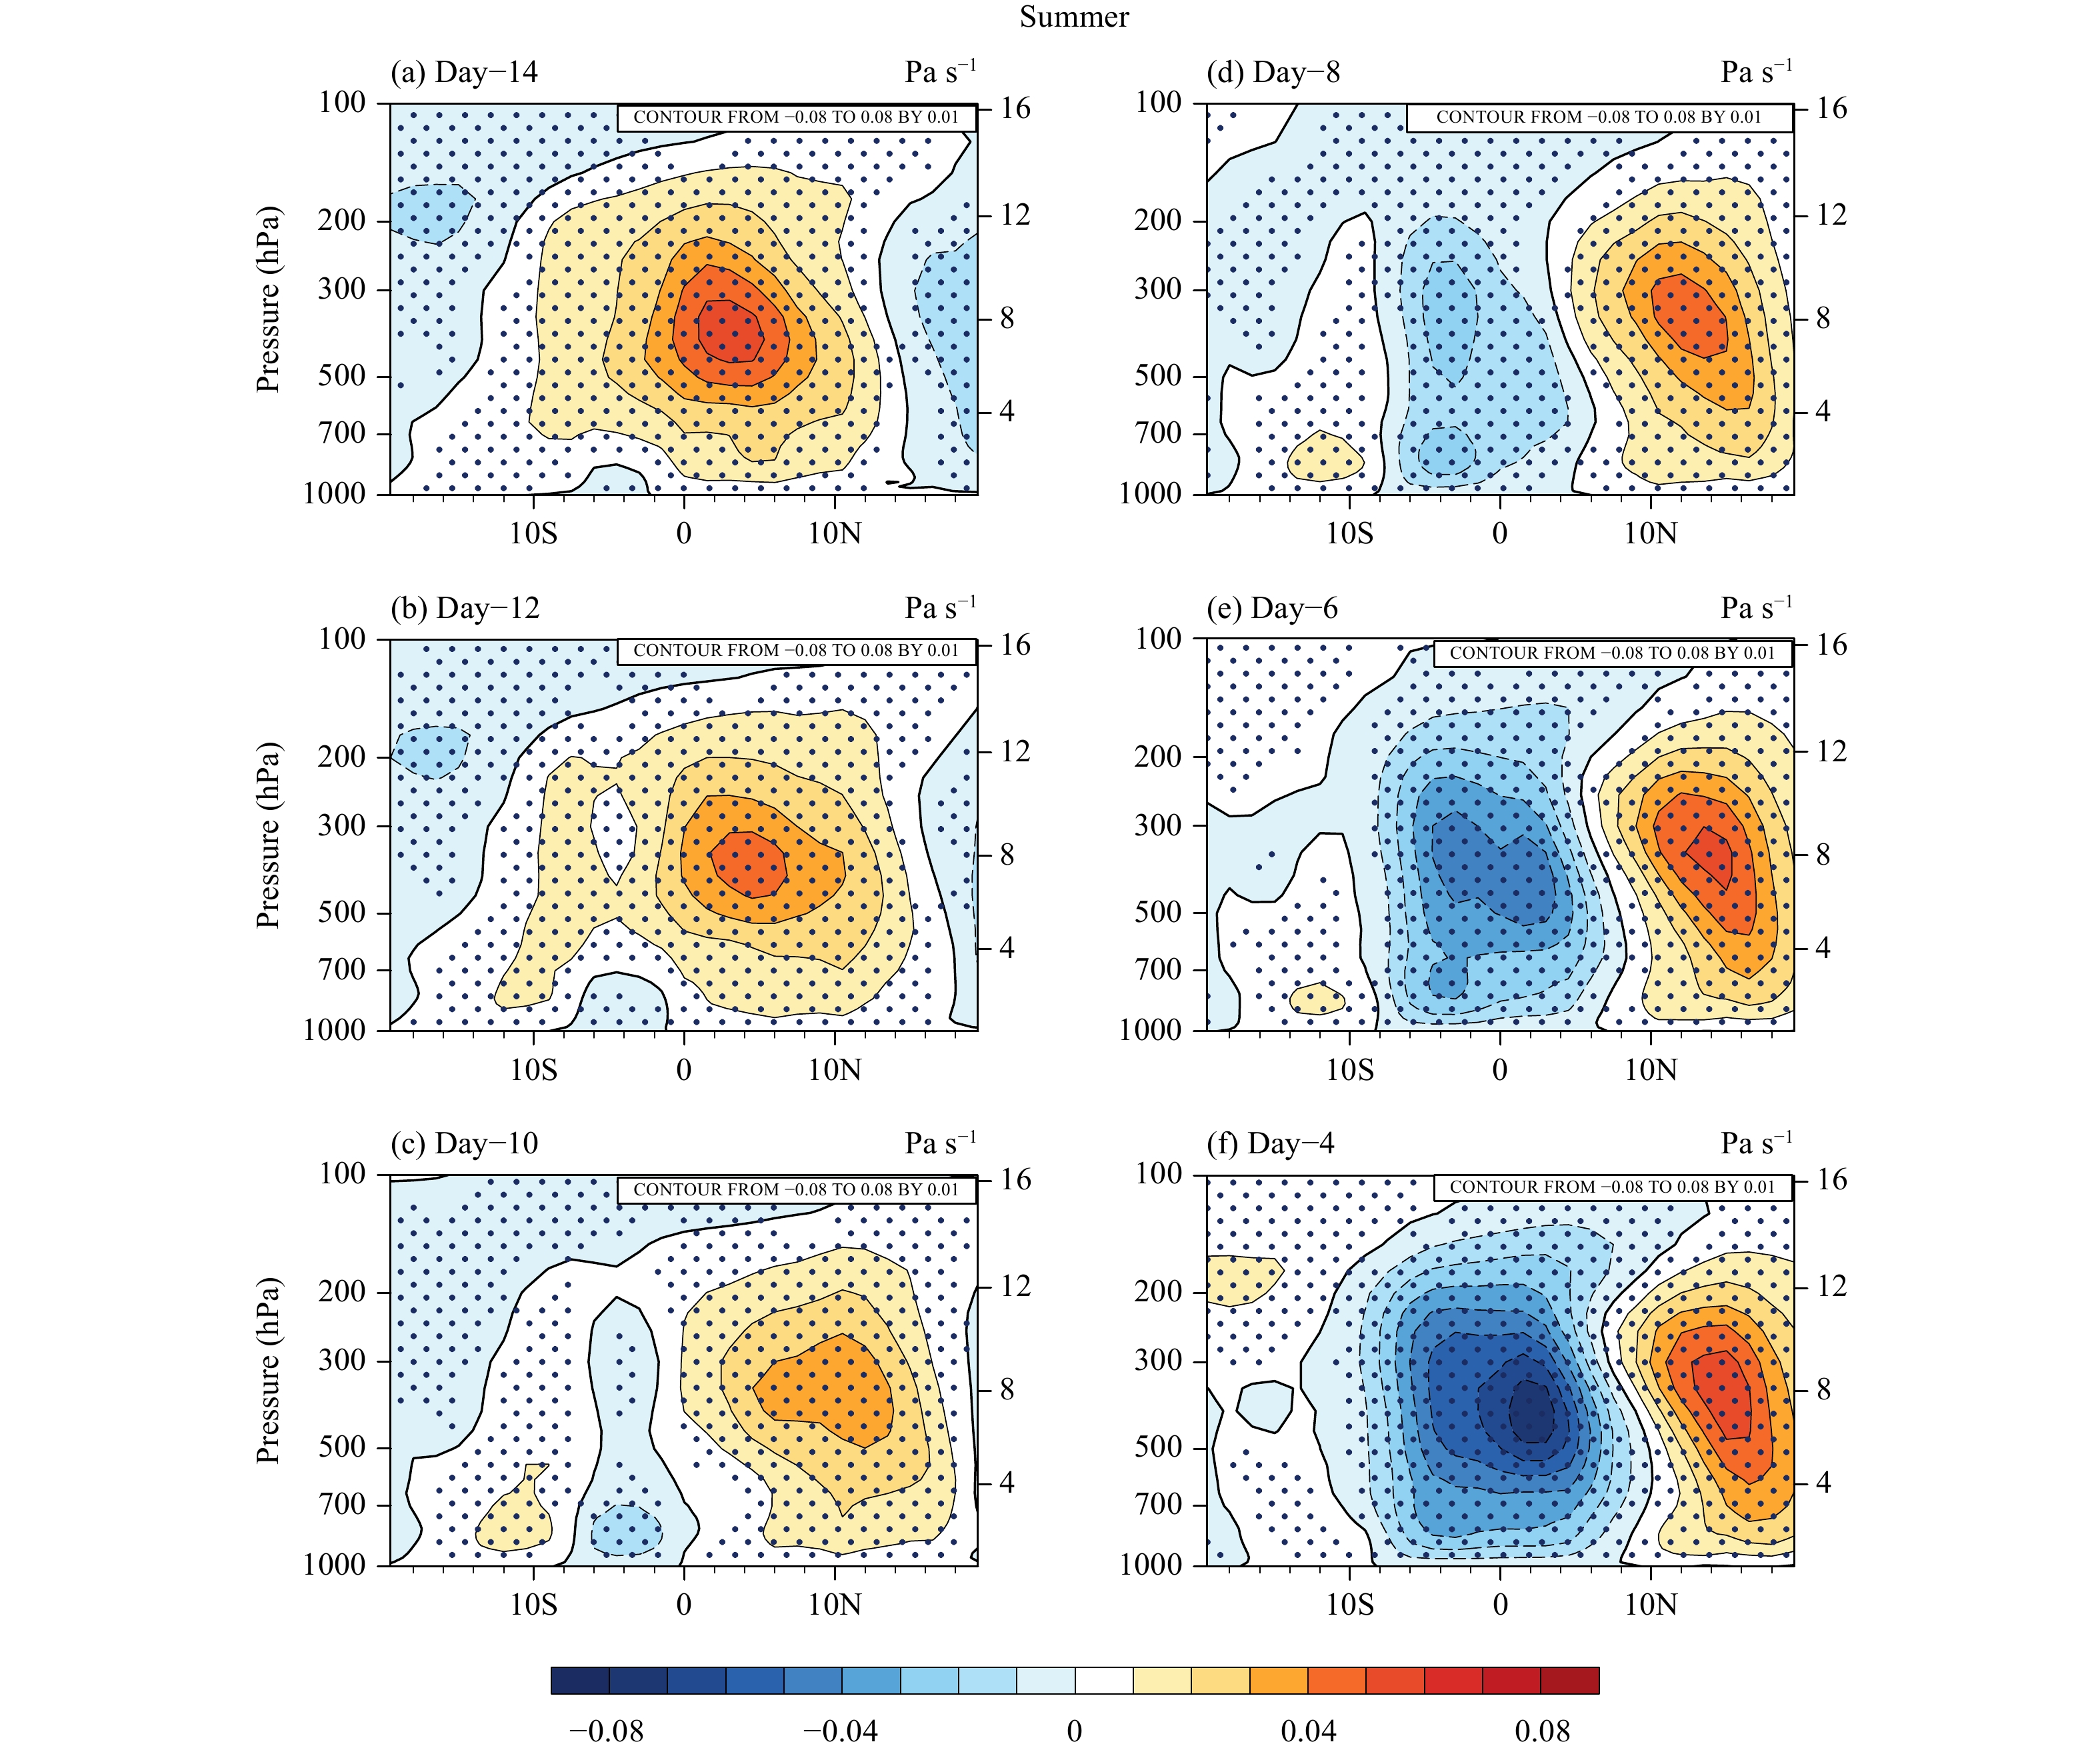
5 Initiation difference between boreal summer and winterThe temporal evolution patterns in Fig. 3 show that BSISO convection is initiated near the equator over central–eastern IO. To illustrate the convection initiation mechanism, we diagnose dynamic and thermodynamic precursor signals prior to the initiation. Figure 9 shows the meridional–vertical sections of anomalous vertical velocity averaged over 70°–90°E in boreal summer. It is seen that a subsidence anomaly covers the equatorial region on day −14. Then a weak ascending motion anomaly starts to develop in PBL over 10°S–0° on day −12. The anomalous ascending motion gradually develops upward, and on day −8, it has extended into the whole troposphere. It is on the same day, a box-averaged (10°S–10°N, 70°–90°E; the green box inFig. 3b) OLR anomaly changes its sign from a positive value to a negative value (Fig. 10a), signifying the initiation of convection over the equator. In the subsequent days, the ascending motion anomaly continues to grow (Figs. 9e–f) and begin to move northward.
|
| Figure 9 Meridional–vertical cross-sections of 20–90-day-filtered vertical velocity field (Pa s–1) averaged over 70°–90°E from days –14 to –4 in boreal summer. Day 0 represents the time when the ISO convective center appears over the equatorial EIO. The dotted area indicates that the anomalous vertical velocity field passes the 99% confidence test. |

|
| Figure 10 Evolutions of (a) regressed intraseasonal OLR anomaly and (b)–(d) vertical profiles of intraseasonal specific humidity, vertical velocity, and moist static energy (MSE) field averaged over 10°S–10°N, 70°–90°E (the green box in Fig. 3b). The dotted area indicates that the anomalous specific humidity, vertical velocity, and MSE fields pass the 99% confidence test. |
What causes the development of anomalous ascending motion in PBL prior to the convection initiation (Fig. 10c, also Figs. 9a–f)? Our diagnosis shows that a positive specific humidity anomaly occurs three days prior to the initiation date (i.e., day −8). The specific humidity anomaly is initially confined to atmospheric boundary layer and gradually extends into the middle and upper troposphere ( Fig. 10b). On day −8, the positive moisture anomaly has reached 500 hPa. A similar evolution happens in the moist static energy (MSE) anomaly field ( Fig. 10d). Physically it is argued that the low-level moistening is critical in setting up convectively unstable stratification and thus anomalous ascending motion.
To reveal physical processes that cause the moistening, a lower-tropospheric moisture budget diagnosis is carried out. Figure 11a shows the diagnosis result. It is found that the positive moisture tendency during the initiation period (from days −11 to −8) is caused primarily by horizontal advection. Specific horizontal advection processes that contribute to the low-tropospheric moistening are further diagnosed ( Fig. 11b). The largest term arises from the advection of the mean moisture by the ISO flow (

|
|
Figure 11 (a) Vertically integrated (1000–700 hPa) intraseasonal moisture budget terms averaged over 10°S–10°N, 70°–90°E and from days –11 to –8. (b) Individual components of the anomalous horizontal moisture advection, with term 1–9 representing
|
The horizontal patterns of the mean specific humidity field and the intraseasonal wind field are shown in Fig. 12a. Both the mean specific humidity and anomalous wind fields were derived based on the time average from days −11 to −8 and vertical integration from 1000 to 700 hPa. Note that maximum mean specific humidity appears to the north and east of the tropical IO domain. As a result, anomalous easterlies at the equator promote a wet advection over the key analysis region (green box in Fig. 12a). The anomalous easterlies at the equator is the part of circulation anomalies associated with anticyclonic Rossby gyres in response to suppressed convection over equatorial IO (Fig. 12b, also Fig. 3a).

|
| Figure 12 (a) Vertically integrated (1000–700 hPa) intraseasonal wind anomaly (m s–1) and LFBS specific humidity (shaded; 10–3 kg kg–1) fields averaged from days –11 to –8. The green box denotes the initiation region for BSISO. (b) As in (a), but for the intraseasonal OLR anomaly (shaded; W m–2). The red dotted area indicates that the anomalous OLR passes the 99% confidence test. Only wind anomalies that exceed 99% confidence level are shown. |
The diagnosis of BSISO initiation processes reveals that it is the suppressed phase of BSISO that generates a PBL moistening and sets up a transition to the active phase of BSISO near the equator. The anomalous easterlies associated with the suppressed phase induce a positive moisture advection, leading to the increase of the PBL moisture. The enhanced moisture anomaly favors the setup of convectively unstable stratification and the onset of the BSISO convection at the equator. Once the convection moves away from the equator, an opposite phase starts to develop in situ. Therefore, the processes above provide a new scenario for BSISO initiation, which is different from the temperature advection theory proposed by Jiang and Li (2005) and from the boreal winter MJO initiation mechanisms proposed by Zhao et al. (2013).
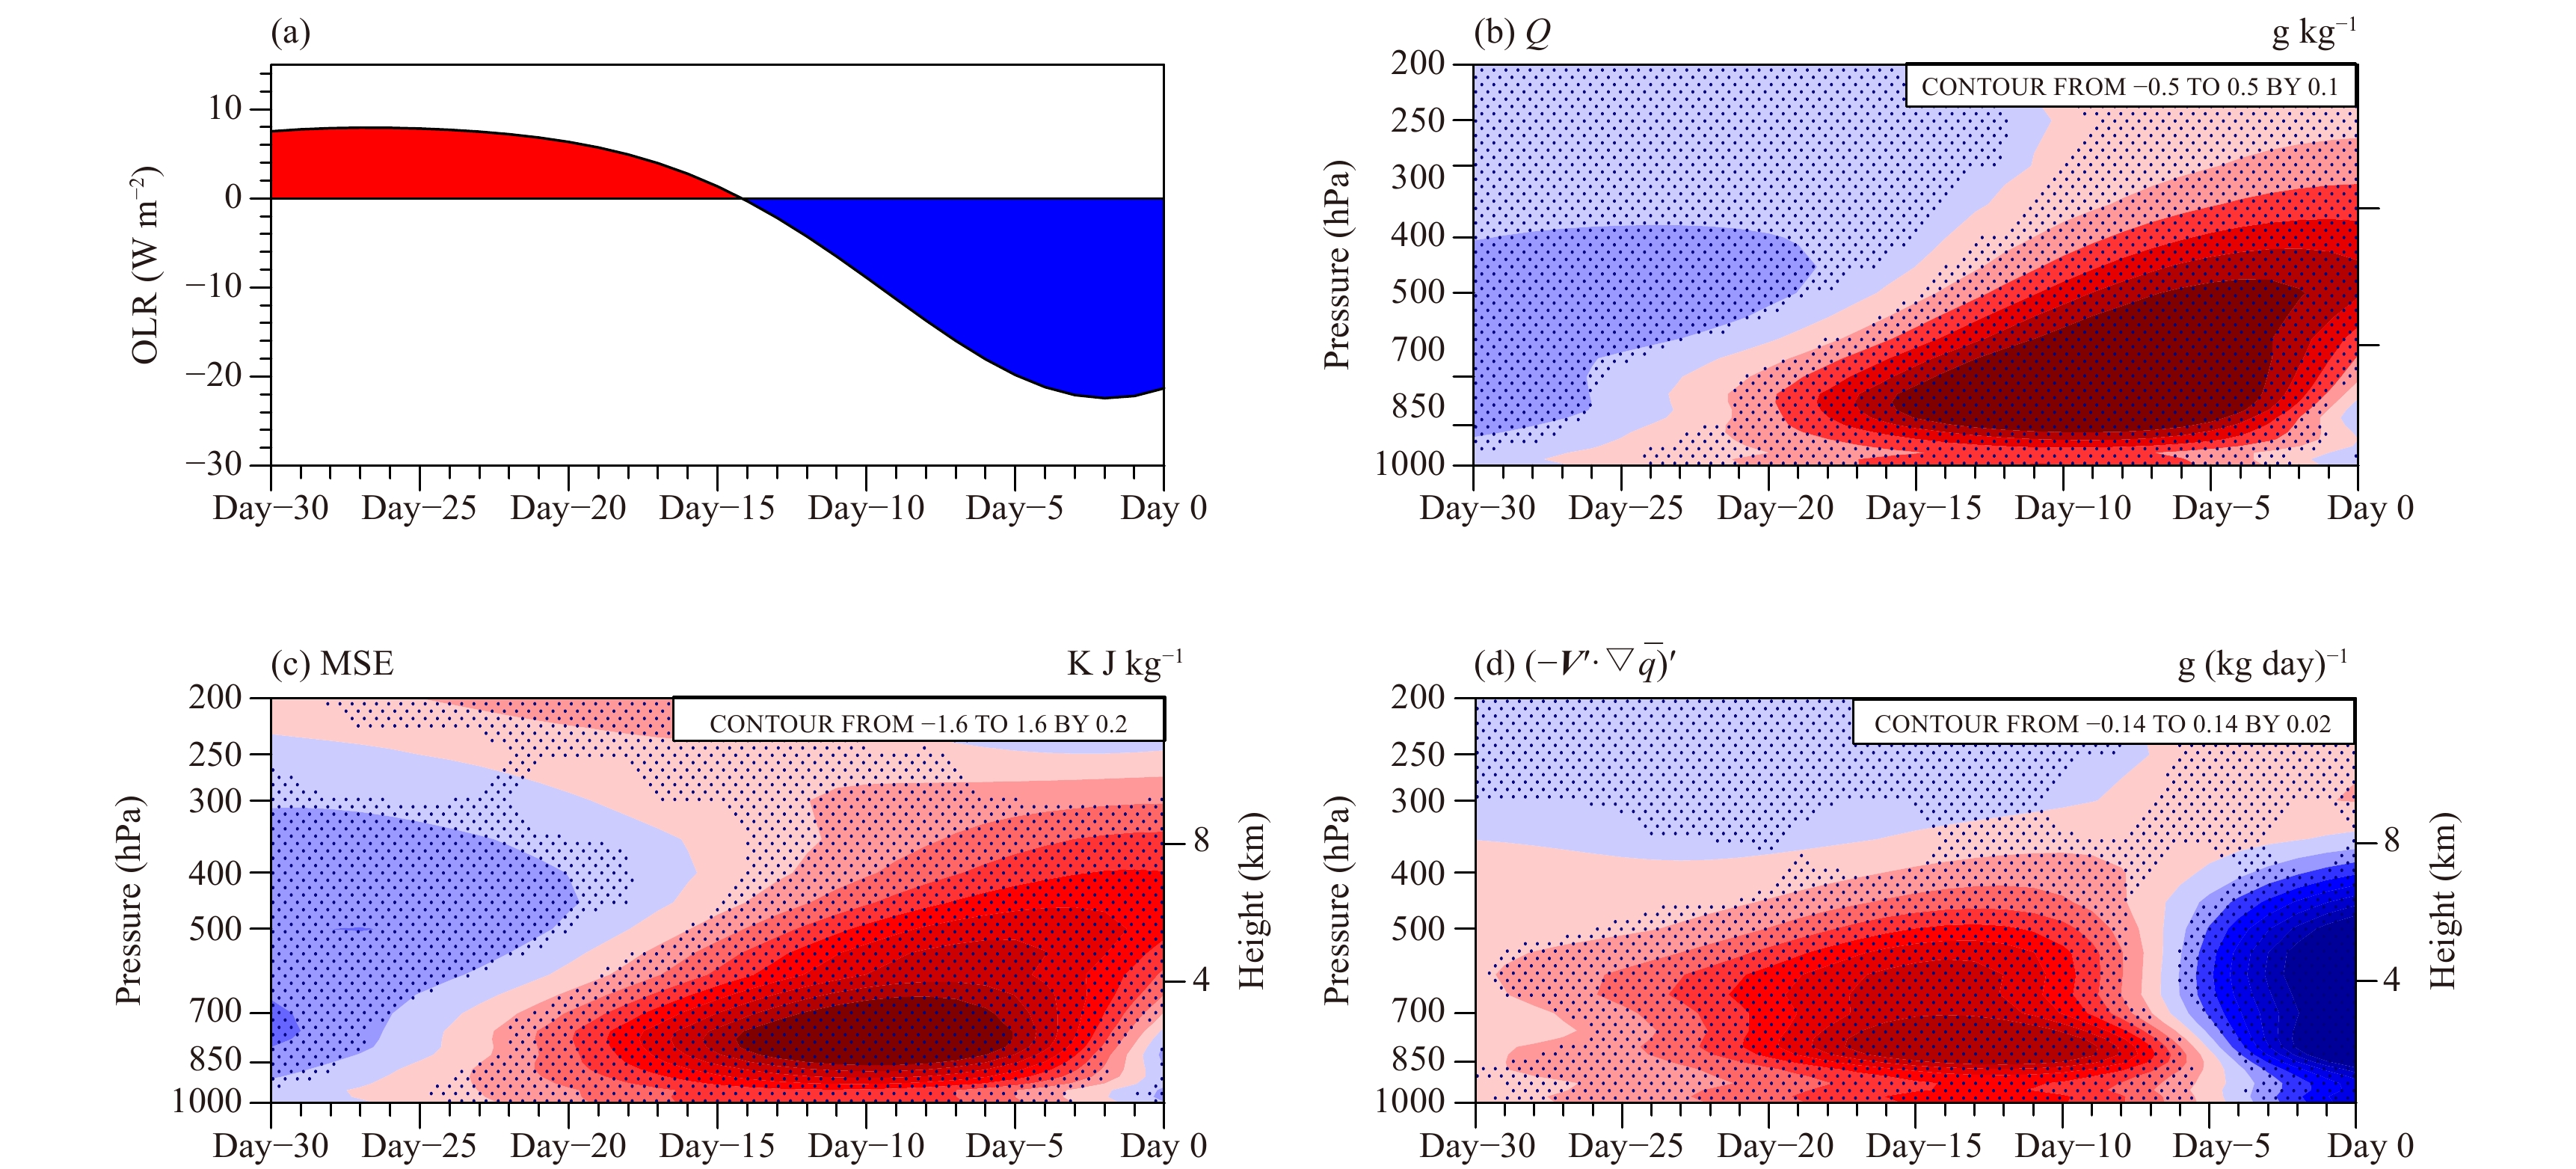
Different from BSISO, the initiation of MJO convection happens over WIO (the green box in Fig. 3g). Zhao et al. (2013) showed that an important precursory signal for MJO initiation is PBL moistening caused by the advection of mean moisture by easterly anomalies associated with the preceding opposite-phase MJO. To reveal the precursor signals related to MJO initiation, we examine the time evolution of several key atmospheric variables averaged over the initiation region (15°S–5°N, 50°–70°E; the green box inFig. 3g). Note that the OLR anomaly transitions from a positive to a negative value on day −14 ( Fig. 13a). Thus, day −14 is regarded as the initiation date. It is interesting to note that a few days prior to the initiation date, a marked sign change of the specific humidity appears in the lower troposphere and the positive specific humidity anomaly gradually extends into the middle and upper troposphere ( Fig. 13b). A similar evolution happens in the moist static energy (MSE) anomaly field (Fig. 13c). Our diagnosis shows that a low-level positive advection of mean moisture by the intraseasonal flow (
|
| Figure 13 Evolutions of (a) regressed intraseasonal OLR anomaly and (b)–(d) vertical profiles of intraseasonal specific humidity, vertical velocity, and advection of the mean moisture by the intraseasonal flow field averaged over 15°S–5°N, 50°–70°E (the green box in Fig. 3g). The dotted area indicates that specific humidity, vertical velocity, and advection fields pass the 99% confidence test. |
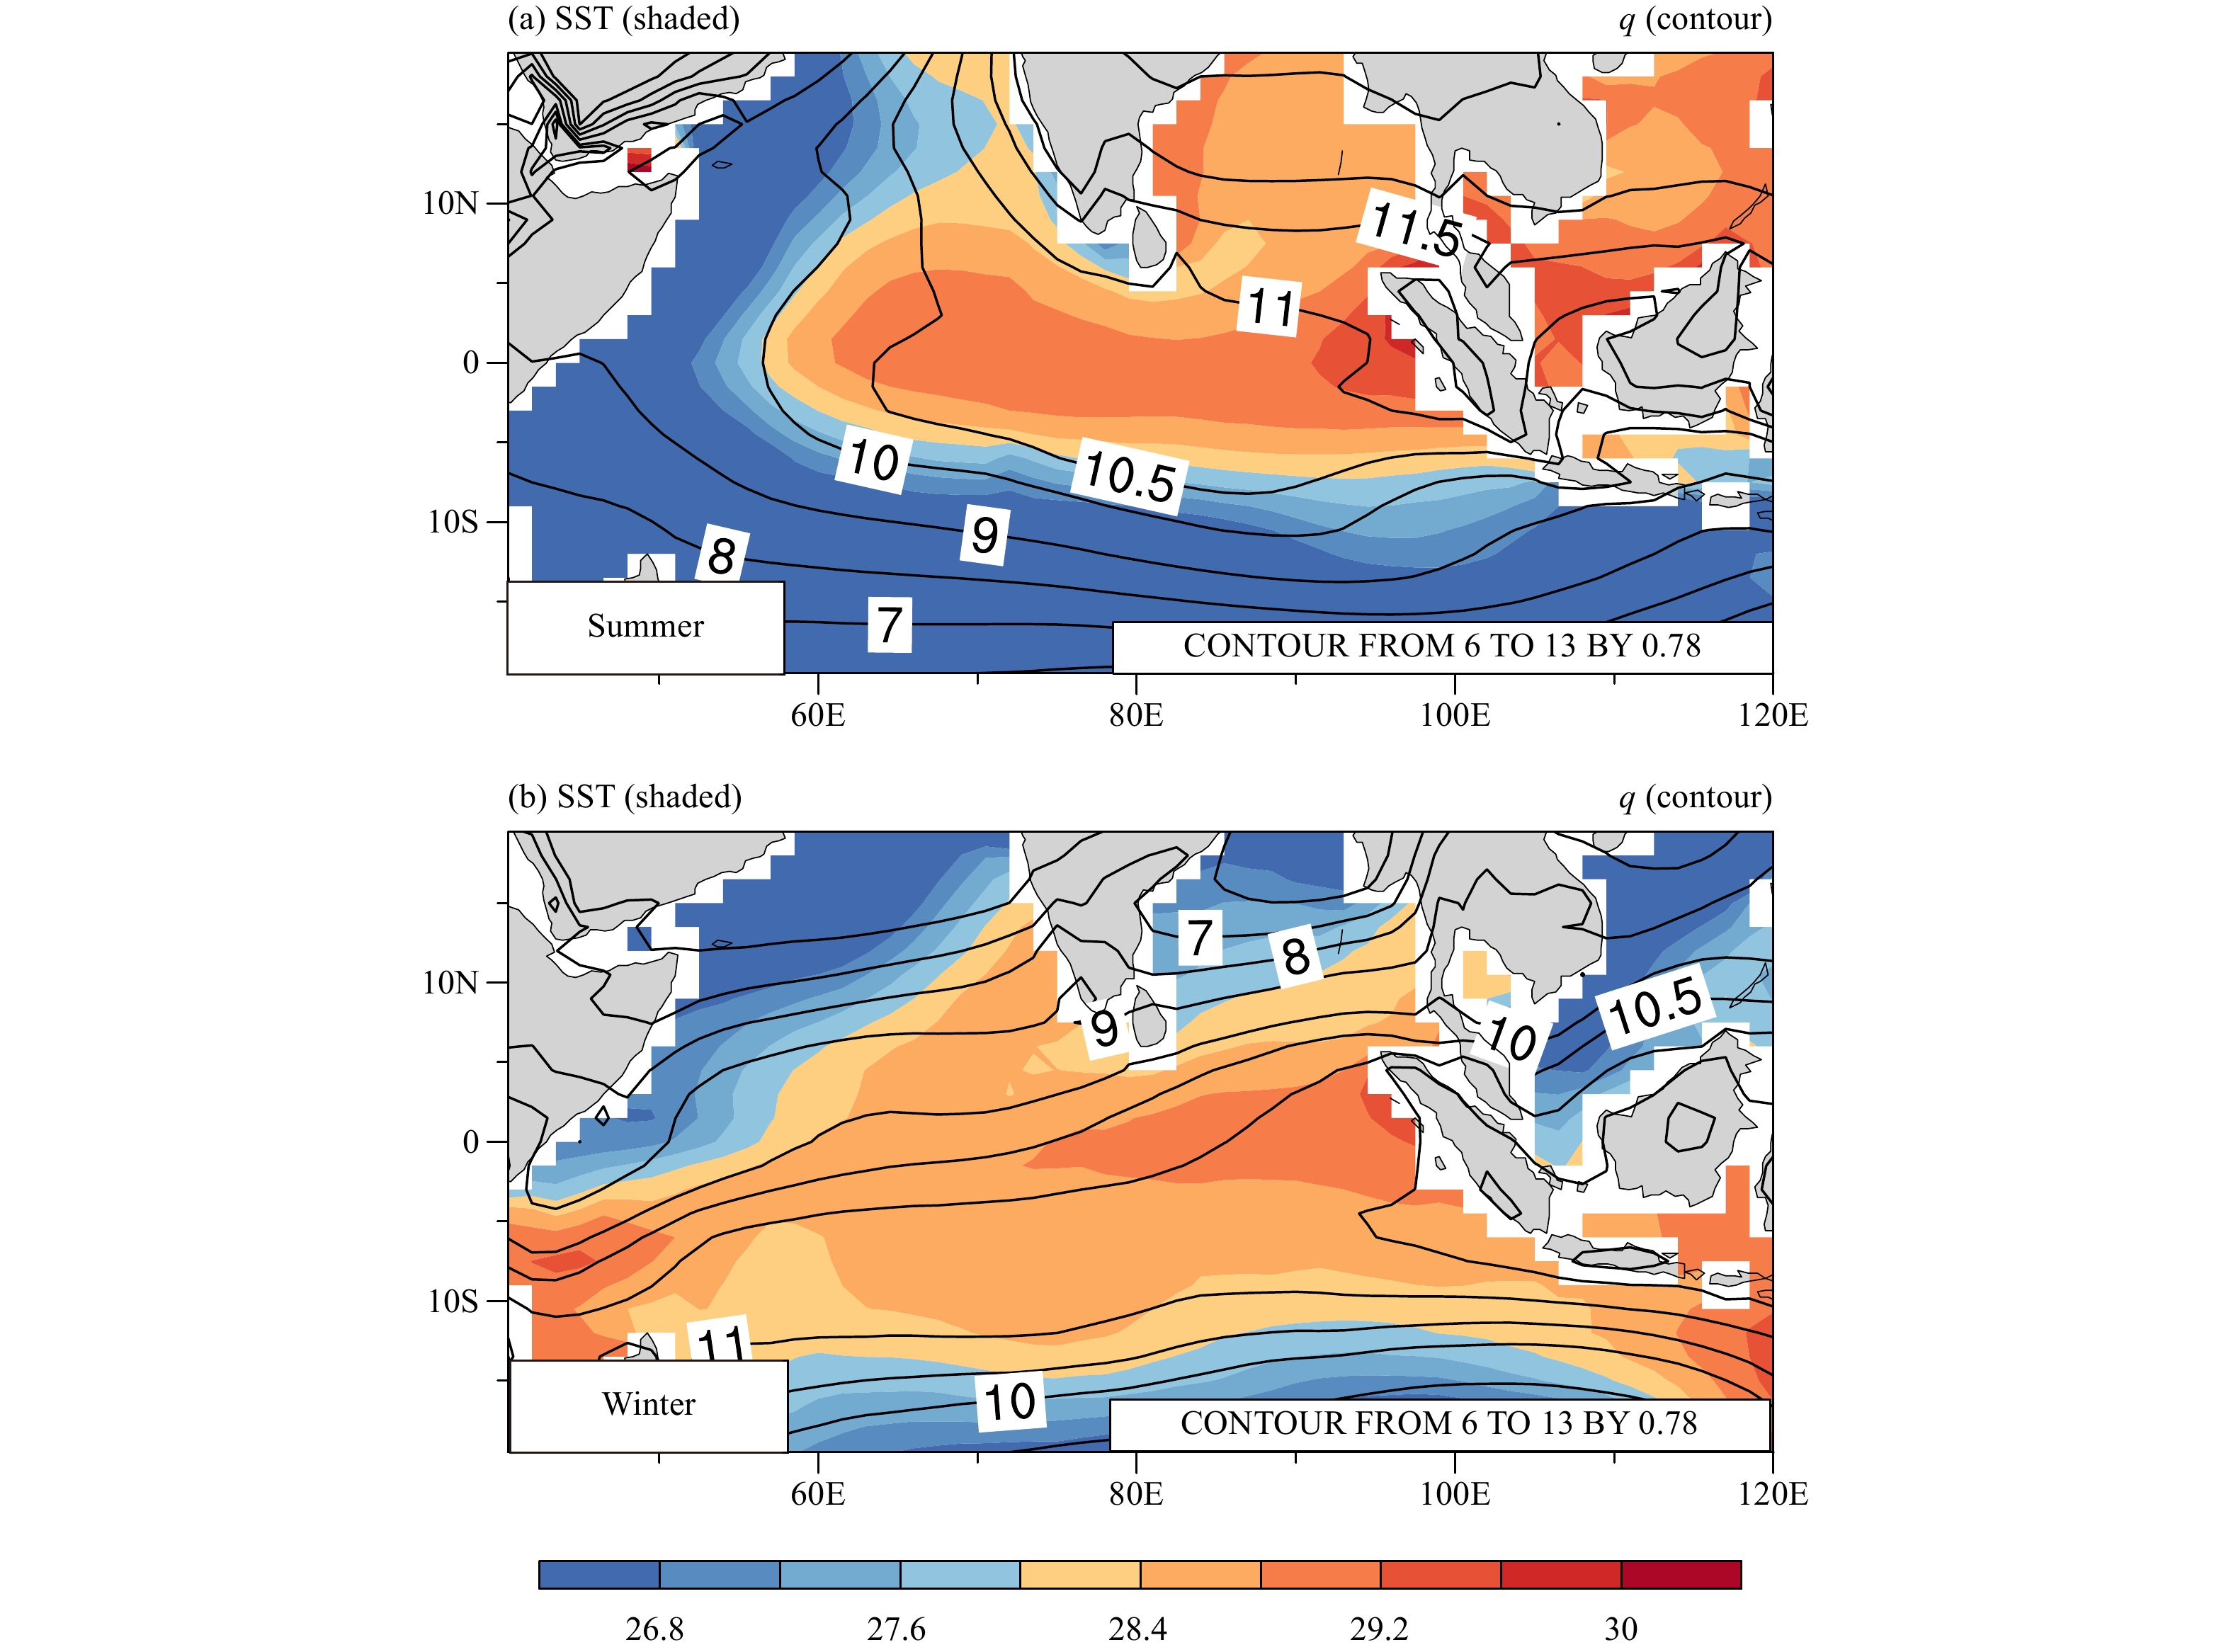
An interesting question is why the ISO convection is initiated over central-eastern IO in boreal summer but over WIO in boreal winter. We hypothesize that it is to a large extent determined by the distribution of summer and winter mean SST and moisture fields. Figures 14a and 14b illustrate seasonal mean SST and 1000–700-hPa integrated specific humidity fields. Note that in boreal winter warm SST and high water vapor content cover entire tropical IO, and are conducive to convective initiation and development. This is in a great contrast to boreal summer in which high SST and humidity are mainly confined in the central and eastern IO. Over WIO, mean SST and water vapor content are very low because of strong upwelling and evaporation induced by the Somali Jet. Such cold SST is not conducive to convection. Therefore, the difference of the background mean state plays an important role in regulating the ISO initiation location in boreal winter and summer.
|
| Figure 14 Climatological mean SST (shaded; °C and vertically integrated (1000–700 hPa) specific humidity (contour; 10–3 kg kg–1) fields in boreal (a) summer and (b) winter. |
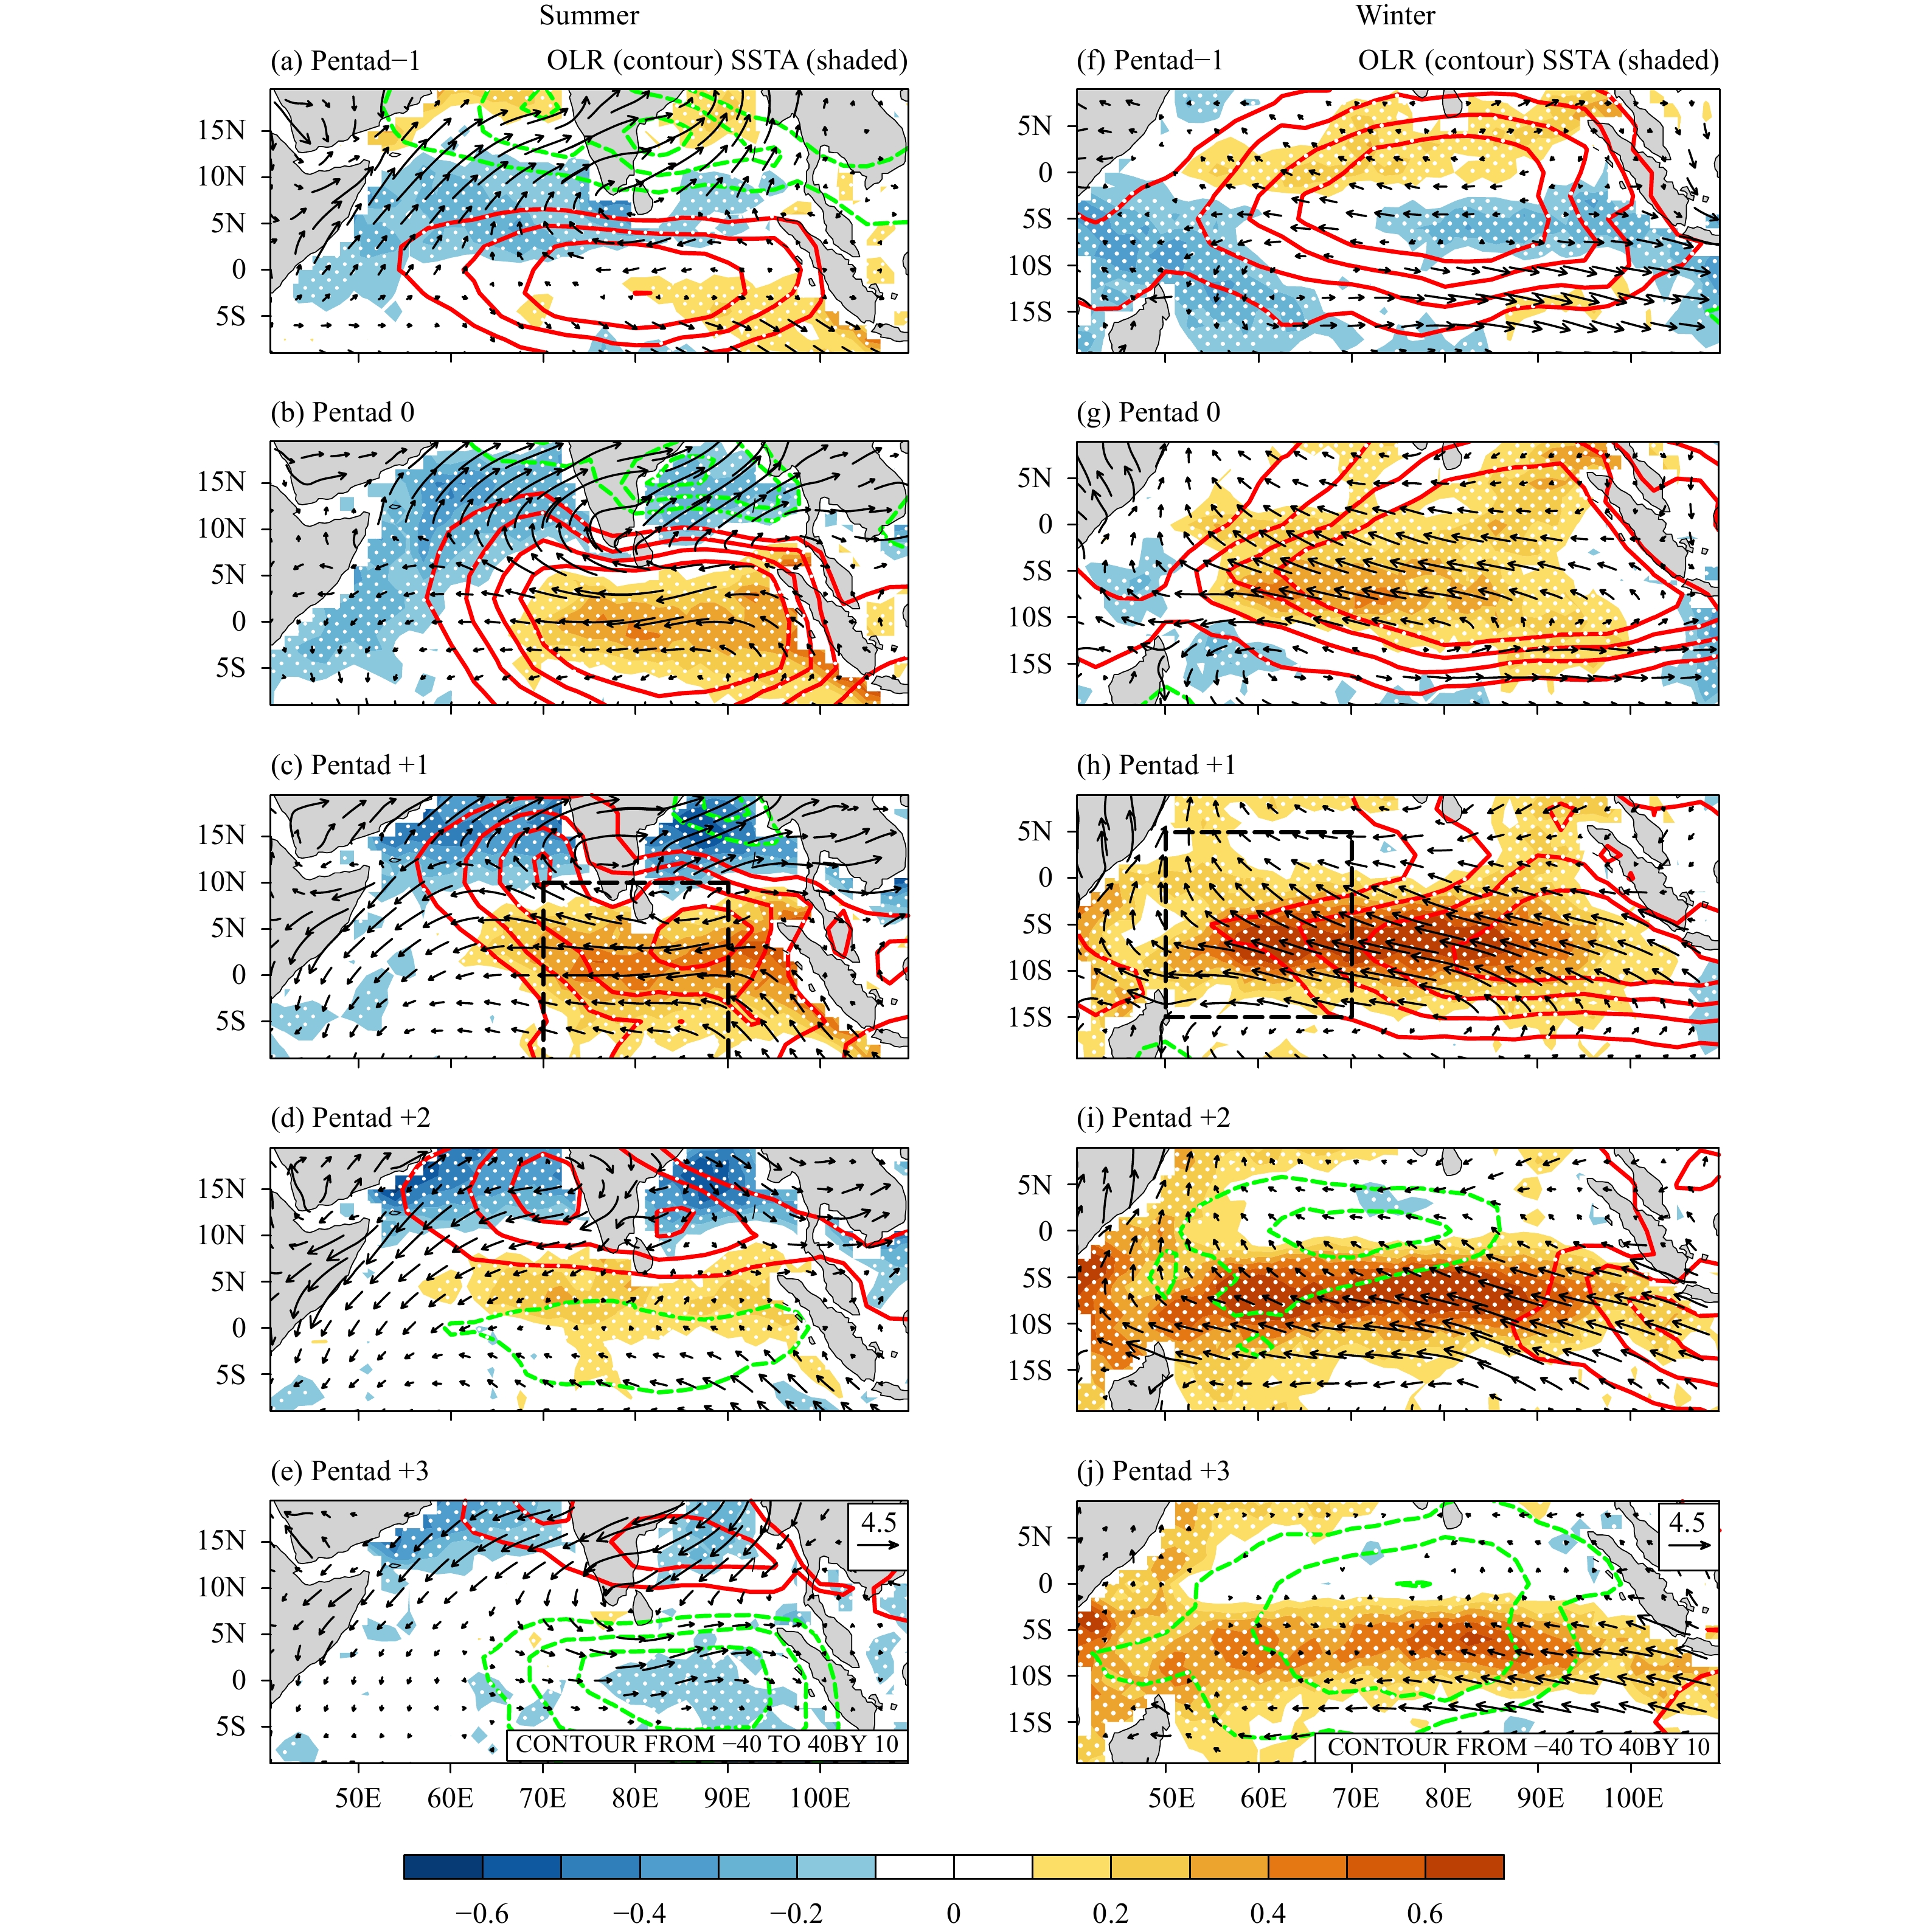
What is the role of intraseasonal SST variability in ISO convection initiation? The previous study by Li et al. (2008) showed that an intraseasonal SSTA induced by the preceding MJO had a delayed impact on the initiation of the subsequent opposite-phase MJO. To investigate such an SSTA effect, we examine the intraseasonal SST–convection relationship in both the summer and winter. Figure 15 shows regressed SSTA, wind stress, and OLR patterns in boreal summer (left panel) and winter (right panel). Although the intraseasonal SSTA patterns are quite different between the two seasons, a warm SSTA leads the development of anomalous convection in both the seasons (Figs. 15d, i). In both the seasons, the anomalous warming is caused by preceding suppressed ISO phase, in a way similar to Li et al. (2008). As the suppressed ISO moves away from the region through either eastward or northward propagation, the remaining warming is favorable for the initiation and development of a new convective ISO phase.
|
| Figure 15 Evolutions of regressed SST (shaded; °C), surface wind stress (arrow; 102 N m–2 s), and OLR (red for positive and green for negative, interval: 10 W m–2) anomaly fields from pentads –1 to +3 in boreal summer (left panel) and winter (right panel). Pentad 0 represents the time when suppressed ISO center is located over the equatorial EIO (70°–90°E). The black boxes show the same ISO initiation regions as in Fig. 3. The white dotted area indicates that the anomalous SST passes the 99% confidence test. Only OLR and surface wind stress anomalies that exceed 99% confidence level are shown. |
The amplitude of the intraseasonal SSTA, however, is much stronger in boreal winter than in boreal summer (Fig. 15). The cause of the amplitude difference may be attributed to various factors, including the difference of background mean wind and oceanic mixed layer depth (Fu et al., 2003; Li et al., 2008). The summer–winter difference may be further revealed from the lead–lag correlation between anomalous SST and convection in the two seasons over the key initiation regions (i.e., black boxes in Figs. 15c, h). It is seen from Fig. 16 that a warm SSTA leads to anomalous convection by 5–10 days in both the winter and summer seasons. The correlations exceed the 95% confidence level. This implies that air–sea interaction may play a role in the ISO initiation in both the summer and winter. However, the correlation is much stronger in northern winter, suggesting a summer–winter asymmetry in the effect of the ocean feedback.
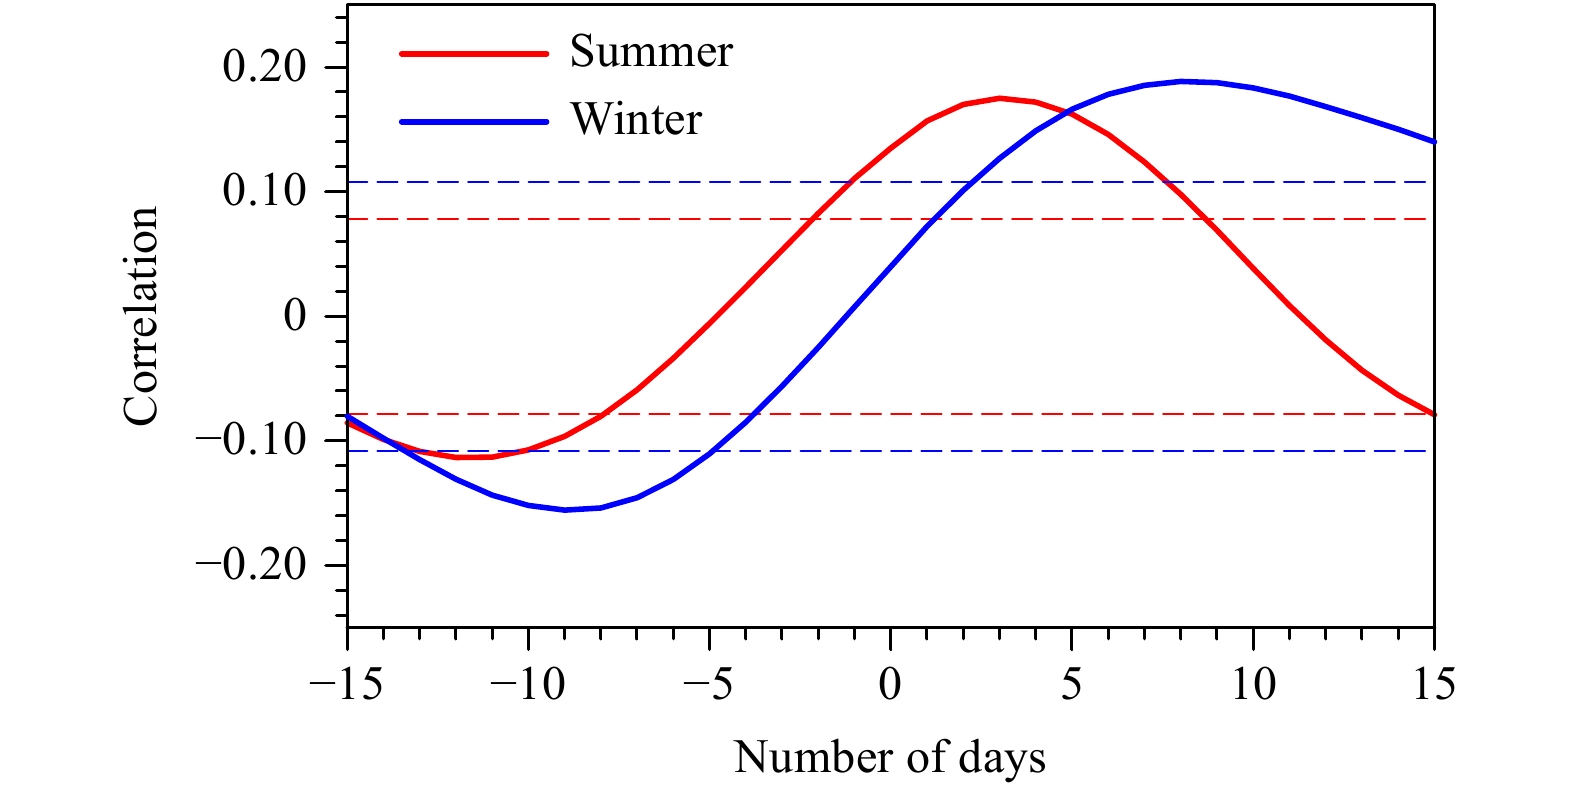
|
| Figure 16 Lead–lag correlations of intraseasonal OLR and SST anomalies averaged over the initiation regions in boreal summer (red) and winter (blue). A positive value in the horizontal axis denotes days by which positive SST anomaly leads negative OLR anomaly (i.e., convection). Blue (red) dashed line denotes that the lagged correlation exceeds 95% confidence level during boreal winter (summer). |
In this study, the distinctive propagation and initiation processes over the tropical IO were investigated based on the diagnosis of the observational data. While boreal summer ISO at the equatorial IO exhibits a stationary oscillatory feature, there is clear eastward propagation of the ISO in boreal winter. The standard deviation maps reveal that maximum ISO variability appears over tropical EIO in boreal summer, whereas it covers entire tropical IO in boreal winter, with maximum centers located slightly south of the equator. The temporal evolution maps of the ISO show distinctive summer–winter differences. In boreal winter, MJO convection is initiated over WIO, and after initiated, it propagates eastward along the climatological ITCZ. In boreal summer, the convection is initiated over central–eastern equatorial IO, and after initiated, the convection moves northward.
A key issue addressed in the current study is when the ISO convection appears over equatorial EIO, why the MJO moves eastward but the BSISO moves northward. A moisture budget analysis was conducted to address this issue. Our diagnosis shows that the difference lies on the low-tropospheric specific humidity tendency east of the ISO convection. A positive tendency appears during the MJO events while a negative tendency appears during the BSISO events. Because of the difference in the tendency, MJO has an eastward moving tendency while the BSISO does not.
A further diagnosis shows that the moisture tendency difference is primarily attributed to contributions by anomalous horizontal and vertical advection by the mean horizontal and vertical winds. Thus, the background mean flow difference plays an important role in promoting the distinctive ISO propagation characteristics between boreal summer and winter.
Besides, the atmospheric moistening process, air–sea interaction also plays a role in causing the distinctive propagation characteristics. It is seen that in boreal summer when the ISO convection is located over equatorial IO, there is a belt of positive SST anomalies north of the convection, which favors its northward propagation. In boreal winter, a warm SSTA is evident to the east of MJO convective center, which favors its eastward propagation.
The initiation process is also quite different between boreal summer and winter. Due to cold SST in WIO in boreal summer, convection initiation occurs in the central–eastern equatorial IO. An obvious increase of lower-tropospheric specific humidity happens prior to the convection initiation. The PBL moistening process eventually leads to convective instability and the onset of convection. A diagnosis of lower-tropospheric moisture budget shows that the moistening happens when the preceding suppressed phase ISO is located at the equator. Equatorial easterly anomalies associated with this suppressed phase promote a positive horizontal moisture advection anomaly and thus is responsible for the increase of PBL moisture. Therefore, the processes above provide a new scenario for BSISO initiation, which is different from the previous temperature advection theory proposed by Jiang and Li (2005) and from the boreal winter MJO initiation mechanisms proposed by Zhao et al. (2013).
In contrast to boreal summer, the convection initiation in boreal winter happens in the western Indian Ocean south of the equator. Both low-level moisture advection and warm SST anomaly caused by preceding suppressed-phase ISO contribute to the onset of MJO convection in the region. It is argued that the marked difference in ISO initiation location between the winter and summer is attributed to the difference in the background mean SST and associated moisture content. Because of coastal upwelling caused by the Somali Jet in boreal summer, WIO is very cold, which inhibits convection development. Therefore, the distinctive background mean states in boreal winter and summer play an important role in determining the location of the ISO initiation. In addition, the intraseasonal SST anomaly also plays a role in initiating ISO convection in boreal winter and summer.
The main results derived from this study are based on the diagnosis of ERA-Interim reanalysis products. A further observational and modeling study is needed to investigate specific processes through which the winter and summer mean states modulate the ISO propagation and initiation behaviors and to understand the role of multi-scale interactions over the MC and tropical IO and western Pacific in modulating ISO initiation, structure, intensity, and propagation.
| Chang, C. P., 1977: Viscous internal gravity waves and low-frequency oscillations in the tropics. J. Atmos. Sci., 34, 901–910. DOI:10.1175/1520-0469(1977)034<0901:VIGWAL>2.0.CO;2 |
| Chen, W. Y., 1982: Fluctuations in Northern Hemisphere 700 mb height field associated with the southern oscillation. Mon. Wea. Rev., 110, 808–823. DOI:10.1175/1520-0493(1982)110<0808:FINHMH>2.0.CO;2 |
| Davis, R. E., 1976: Predictability of sea surface temperature and sea level pressure anomalies over the North Pacific Ocean. J. Phys. Oceanogr., 6, 249–266. DOI:10.1175/1520-0485(1976)006<0249:POSSTA>2.0.CO;2 |
| Emanuel, K. A., 1987: An air–sea interaction model of intraseaso-nal oscillations in the tropics. J. Atmos. Sci., 44, 2324–2340. DOI:10.1175/1520-0469(1987)044<2324:AASIMO>2.0.CO;2 |
| Fu, X. H., B. Wang, T. Li, et al., 2003: Coupling between northward-propagating, intraseasonal oscillations and sea surface temperature in the Indian Ocean. J. Atmos. Sci., 60, 1733–1753. DOI:10.1175/1520-0469(2003)060<1733:CBNIOA>2.0.CO;2 |
| Fuchs, Ž., and D. J. Raymond, 2002: Large-scale modes of a nonrotating atmosphere with water vapor and cloud–radiation feedbacks. J. Atmos. Sci., 59, 1669–1679. DOI:10.1175/1520-0469(2002)059<1669:LSMOAN>2.0.CO;2 |
| Hartmann, D. L., and M. L. Michelsen, 1989: Intraseasonal periodicities in Indian rainfall. J. Atmos. Sci., 46, 2838–2862. DOI:10.1175/1520-0469(1989)046<2838:IPIIR>2.0.CO;2 |
| Hartmann, D. L., M. L. Michelsen, and S. A. Klein, 1992: Seaso-nal variations of tropical intraseasonal oscillations: A 20–25-day oscillation in the western Pacific. J. Atmos. Sci., 49, 1277–1289. DOI:10.1175/1520-0469(1992)049<1277:SVOTIO>2.0.CO;2 |
| Hsu, H.-H., and C.-H. Weng, 2001: Northwestward propagation of the intraseasonal oscillation in the western North Pacific during the boreal summer: Structure and mechanism. J. Climate, 14, 3834–3850. DOI:10.1175/1520-0442(2001)014<3834:NPOTIO>2.0.CO;2 |
| Hsu, H.-H., B. J. Hoskins, and F.-F. Jin, 1990: The 1985/86 intraseasonal oscillation and the role of the extratropics. J. Atmos. Sci., 47, 823–839. DOI:10.1175/1520-0469(1990)047<0823:TIOATR>2.0.CO;2 |
| Hsu, P.-C., and T. Li, 2012: Role of the boundary layer moisture asymmetry in causing the eastward propagation of the Madden–Julian oscillation. J. Climate, 25, 4914–4931. DOI:10.1175/JCLI-D-11-00310.1 |
| Jiang, X.-A., and T. Li, 2005: Reinitiation of the boreal summer intraseasonal oscillation in the tropical Indian Ocean. J. Climate, 18, 3777–3795. DOI:10.1175/JCLI3516.1 |
| Jiang, X. A., T. Li, and B. Wang, 2004: Structures and mechanisms of the northward propagating boreal summer intraseasonal oscillation. J. Climate, 17, 1022–1039. DOI:10.1175/1520-0442(2004)017<1022:SAMOTN>2.0.CO;2 |
| Jiang, X. A., D. E. Waliser, P. K. Xavier, et al, 2015: Vertical structure and physical processes of the Madden–Julian oscillation: Exploring key model physics in climate simulations. J. Geophys. Res. Atmos., 120, 4718–4748. DOI:10.1002/2014JD022375 |
| Kim, D., J.-S. Kug, and A. H. Sobel, 2014: Propagating versus nonpropagating Madden–Julian oscillation events. J. Climate, 27, 111–125. DOI:10.1175/JCLI-D-13-00084.1 |
| Krishnamurti, T. N., and D. Subrahmanyam, 1982: The 30–50 day mode at 850 mb during MONEX. J. Atmos. Sci., 39, 2088–2095. DOI:10.1175/1520-0469(1982)039<2088:TDMAMD>2.0.CO;2 |
| Lau, K.-M., and L. Peng, 1987: Origin of low-frequency (intraseasonal) oscillations in the tropical atmosphere. Part I: Basic theory. J. Atmos. Sci., 44, 950–972. DOI:10.1175/1520-0469(1987)044<0950:OOLFOI>2.0.CO;2 |
| Lau, K.-M., and C.-H. Sui, 1997: Mechanisms of short-term sea surface temperature regulation: Observations during TOGA COARE. J. Climate, 10, 465–472. DOI:10.1175/1520-0442(1997)010<0465:MOSTSS>2.0.CO;2 |
| Li, C. Y., Cho, H.-R., and J.-T. Wang, 2002: CISK Kelvin wave with evaporation–wind feedback and air–sea interaction—A further study of tropical intraseasonal oscillation mechanism. Adv. Atmos. Sci., 19, 379–390. DOI:10.1007/s00376-002-0073-1 |
| Li, T., 2014: Recent advance in understanding the dynamics of the Madden–Julian oscillation. J. Meteor. Res., 28, 1–33. DOI:10.1007/s13351-014-3087-6 |
| Li, T., and B. Wang, 2005: A review on the western North Pacific monsoon: Synoptic-to-interannual variabilities. Terr. Atmos. Oceanic Sci., 16, 285–314. DOI:10.3319/TAO.2005.16.2.285(A) |
| Li, T., and C. H. Zhou, 2009: Planetary scale selection of the Madden–Julian oscillation. J. Atmos. Sci., 66, 2429–2443. DOI:10.1175/2009JAS2968.1 |
| Li, T., and P.-C. Hsu, 2018: Fundamentals of Tropical Climate Dynamics. Springer, 61–106, doi: 10.1007/978-3-319-59597-9. |
| Li, T., F. Tam, X. H. Fu, et al., 2008: Causes of the intraseasonal SST variability in the tropical Indian Ocean. Atmos. Ocean. Sci. Lett., 1, 18–23. DOI:10.1080/16742834.2008.11446758 |
| Li, T., C. B. Zhao, P.-C. Hsu, et al., 2015: MJO initiation processes over the tropical Indian Ocean during DYNAMO/CINDY2011. J. Climate, 28, 2121–2135. DOI:10.1175/JCLI-D-14-00328.1 |
| Madden, R. A., 1986: Seasonal variations of the 40–50 day oscillation in the tropics. J. Atmos. Sci., 43, 3138–3158. DOI:10.1175/1520-0469(1986)043<3138:SVOTDO>2.0.CO;2 |
| Madden, R. A., and P. R. Julian, 1971: Detection of a 40–50 day oscillation in the zonal wind in the tropical Pacific. J. Atmos. Sci., 28, 702–708. DOI:10.1175/1520-0469(1971)028<0702:DOADOI>2.0.CO;2 |
| Madden, R. A., and P. R. Julian, 1972: Description of global-scale circulation cells in the tropics with a 40–50 day period. J. Atmos. Sci., 29, 1109–1123. DOI:10.1175/1520-0469(1972)029<1109:DOGSCC>2.0.CO;2 |
| Madden, R. A., and P. R. Julian, 1994: Observations of the 40–50-day tropical oscillation—A review. Mon. Wea. Rev., 122, 814–837. DOI:10.1175/1520-0493(1994)122<0814:OOTDTO>2.0.CO;2 |
| Maloney, E. D., 2009: The moist static energy budget of a composite tropical intraseasonal oscillation in a climate model. J. Climate, 22, 711–729. DOI:10.1175/2008JCLI2542.1 |
| Matthews, A. J., 2000: Propagation mechanisms for the Madden–Julian oscillation. Quart. J. Roy. Meteor. Soc., 126, 2637–2651. DOI:10.1002/qj.49712656902 |
| Matthews, A. J., 2008: Primary and successive events in the Madden–Julian oscillation. Quart. J. Roy. Meteor. Soc., 134, 439–453. DOI:10.1002/qj.224 |
| Mei, S. L., T. Li, and W. Chen, 2015: Three-type MJO initiation processes over the western equatorial Indian Ocean. Adv. Atmos. Sci., 32, 1208–1216. DOI:10.1007/s00376-015-4201-0 |
| Murakami, T., 1980: Empirical orthogonal function analysis of satellite-observed outgoing longwave radiation during summer. Mon. Wea. Rev., 108, 205–222. DOI:10.1175/1520-0493(1980)108<0205:EOFAOS>2.0.CO;2 |
| Murakami, T., and T. Nakazawa, 1985: Tropical 45 day oscillations during the 1979 Northern Hemisphere summer. J. Atmos. Sci., 42, 1107–1122. DOI:10.1175/1520-0469(1985)042<1107:TDODTN>2.0.CO;2 |
| Neelin, J. D., I. M. Held, and K. H. Cook, 1987: Evaporation–wind feedback and low-frequency variability in the tropical atmosphere. J. Atmos. Sci., 44, 2341–2348. DOI:10.1175/1520-0469(1987)044<2341:EWFALF>2.0.CO;2 |
| Roxy, M., and Y. Tanimoto, 2012: Influence of sea surface temperature on the intraseasonal variability of the South China Sea summer monsoon. Climate Dyn., 39, 1209–1218. DOI:10.1007/s00382-011-1118-x |
| Seo, K.-H., and K.-Y. Kim, 2003: Propagation and initiation mechanisms of the Madden–Julian oscillation. J. Geophys. Res. Atmos., 108, 4384. DOI:10.1029/2002JD002876 |
| Seo, K.-H., and E.-J. Song, 2012: Initiation of boreal summer intraseasonal oscillation: Dynamic contribution by potential vorticity. Mon. Wea. Rev., 140, 1748–1760. DOI:10.1175/MWR-D-11-00105.1 |
| Sobel, A., and E. Maloney, 2013: Moisture modes and the eastward propagation of the MJO. J. Atmos. Sci., 70(1), 187–192. DOI:10.1175/JAS-D-12-0189.1 |
| Sobel, A. H., J. Nilsson, and L. M. Polvani, 2001: The weak temperature gradient approximation and balanced tropical moisture waves. J. Atmos. Sci., 58, 3650–3665. DOI:10.1175/1520-0469(2001)058<3650:TWTGAA>2.0.CO;2 |
| Sperber, K. R., 2003: Propagation and the vertical structure of the Madden–Julian oscillation. Mon. Wea. Rev., 131, 3018–3037. DOI:10.1175/1520-0493(2003)131<3018:PATVSO>2.0.CO;2 |
| Sperber, K. R., J. M. Slingo, P. M. Inness, et al., 1997: On the maintenance and initiation of the intraseasonal oscillation in the NCEP/NCAR reanalysis and in the GLA and UKMO AMIP simulations. Climate Dyn., 13, 769–795. DOI:10.1007/s003820050197 |
| Stephens, G. L., P. J. Webster, R. H. Johnson, et al., 2004: Observational evidence for the mutual regulation of the tropical hydrological cycle and tropical sea surface temperatures. J. Climate, 17, 2213–2224. DOI:10.1175/1520-0442(2004)017<2213:OEFTMR>2.0.CO;2 |
| Vecchi, G. A., and D. E. Harrison, 2002: Monsoon breaks and subseasonal sea surface temperature variability in the Bay of Bengal. J. Climate, 15, 1485–1493. DOI:10.1175/1520-0442(2002)015<1485:MBASSS>2.0.CO;2 |
| Wang, B., and H. Rui, 1990: Synoptic climatology of transient tropical intraseasonal convection anomalies: 1975–1985. Meteor. Atmos. Phys., 44, 43–61. DOI:10.1007/BF01026810 |
| Wang, B., and T. M. Li, 1994: Convective interaction with boundary-layer dynamics in the development of a tropical intraseasonal system. J. Atmos. Sci., 51, 1386–1400. DOI:10.1175/1520-0469(1994)051<1386:CIWBLD>2.0.CO;2 |
| Wang, L., T. Li, E. Maloney, et al., 2017: Fundamental causes of propagating and nonpropagating MJOs in MJOTF/GASS models. J. Climate, 30, 3743–3769. DOI:10.1175/JCLI-D-16-0765.1 |
| Wu, M.-L. C., S. D. Schubert, M. J. Suarez, et al., 2006: Seasonality and meridional propagation of the MJO. J. Climate, 19, 1901–1921. DOI:10.1175/JCLI3680.1 |
| Yanai, M., S. Esbensen, and J.-H. Chu, 1973: Determination of bulk properties of tropical cloud clusters from large-scale heat and moisture budgets. J. Atmos. Sci., 30, 611–627. DOI:10.1175/1520-0469(1973)030<0611:DOBPOT>2.0.CO;2 |
| Yasunari, T., 1979: Cloudiness fluctuation associated with the Northern Hemisphere summer monsoon. J. Meteor. Soc. Japan, 57, 227–242. DOI:10.2151/jmsj1965.57.3_227 |
| Zhang, C. D., 2005: Madden–Julian oscillation. Rev. Geophys., 43, RG2003. DOI:10.1029/2004RG000158 |
| Zhao, C. B., T. Li, and T. J. Zhou, 2013: Precursor signals and processes associated with MJO initiation over the tropical Indian Ocean. J. Climate, 26, 291–307. DOI:10.1175/JCLI-D-12-00113.1 |
 2019, Vol. 33


