The Chinese Meteorological Society
Article Information
- YUE, Zhiguo, Xing YU, Guihua LIU, et al., 2019.
- Microphysical Properties of Convective Clouds in Summer over the Tibetan Plateau from SNPP/VIIRS Satellite Data . 2019.
- J. Meteor. Res., 33(3): 433-445
- http://dx.doi.org/10.1007/s13351-019-8608-x
Article History
- Received June 13, 2018
- in final form April 2, 2019
2. Office of Weather Modification of Shaanxi Province, Xi’an 710014
The Tibetan Plateau (hereafter TP) is the highest plateau in the world with an average elevation greater than 4000 m. It has important impacts on the East Asian atmospheric circulation, climate change, as well as formation and development of disastrous weather events in China (Xu et al., 2015; Xia et al., 2016; Wan et al., 2017). Due to the special thermal and dynamic forcing of the TP, convections and thunderstorms frequently occur in summer over the TP (Zhang et al., 2003). The cloud microphysical characteristics (such as cloud droplet size, cloud droplet number concentration, cloud water formation, etc.) are important for us to understand the clouds. Meanwhile, they are crucial parameters for weather and climate modeling prediction. Therefore, it is important to study the microphysics of cloud over the TP.
At present, there are two common ways to observe clouds: by remote sensing and by flying an instrumented cloud physics aircraft into the clouds. Ground-based cloud observational instruments include laser ceilometer, millimeter wave cloud radar, laser radar, infrared imager; among which the laser ceilometer and laser radar can measure the altitudes of cloud base and cloud top with higher resolution. The millimeter wave radar can detect the microphysical structure within the cloud due to its wavelength close to the size of cloud droplet (Zhang et al., 2016; Wu et al., 2017). Although spaceborne radar and lidar (CloudSat and CALIPSO) can detect vertical distributions of cloud and aerosols along the satellite orbit, their detection range is yet not so wide (Wang et al., 2011; Zhang et al., 2015; Liu and Chen, 2017; Wang et al., 2017). The microphysical quantities such as the number concentration (NCCN) of cloud condensation nuclei (CCN), cloud droplet size, cloud drop concentration are usually measured by an instrumented aircraft penetrating the cloud (Wang et al., 2013). These onboard and ground-based devices for cloud microphysical detection (Liu et al., 2015; Chang and Guo, 2016) are not only expensive, but also labor consuming as they require complicated maintenance and calibration. For this reason, they are seldom used in the TP where observational stations are sparsely distributed. The cloud base height is mainly observed by human vision, air ballooning, ceilometer, etc. The visual observation is subjective and discontinuous with poor data quality. The air ballooning observation is highly labor dependent. The ceilometer can yield accurate measurements, but it has not been widely applied yet.
Meteorological satellite data have the advantage of global coverage at multiple times with timely acquisition and much convenience, and have been used to retrieve various cloud microphysical properties. In the last 20 years, the retrieval methodology with satellite data in infrared channel has been widely employed to retrieve cloud parameters such as cloud particle effective radius (re), liquid water path, optical thickness, cloud top temperature (Ttop), cloud water phase, and so on.
Rosenfeld and Lensky (1998) proposed a method to infer the microstructure of convective cloud after investigating the relationship between temperature (T) and re (so called T–re profile) based on the NOAA/AVHRR (Advanced Very High Resolution Radiometer) data, and this was later used to analyze the properties of a rainstorm and conditions for seeding topographical cloud (Dai et al., 2010; Liu et al., 2011b). The method was also applied for the Moderate Resolution Imaging Spectroradiometer (MODIS) to detect severe convective storms (Rosenfeld et al., 2008) and glaciation temperatures of convective clouds (Rosenfeld et al., 2011), as well as for Fengyun (FY)-3A/VIRR (Visible and Infrared Radiometer) to analyze the properties of convective clouds (Liu et al., 2011a).
The Suomi National Polar-orbiting Partnership satellite (SNPP) was successful launched on 28 October 2011, which provided a new opportunity for retrieval of cloud microphysical properties. The Visible Infrared Imaging Radiometer Suite (VIIRS) onboard SNPP has the resolution of 375 m in the infrared channel, which is three times higher than MODIS. The SNPP/VIIRS demonstrated unique advantages in retrieval small-scale convective cloud at the initial and development stages (Hillger et al., 2013; Rosenfeld et al., 2014b). The central wavelengths of the five high-resolution (375 m) VIIRS channels are 0.64, 0.865, 1.615, 3.745, and 11.45 μm. Unfortunately, without the high-resolution 12-μm channel, it is impossible to calculate water vapor absorption by the split-window (the brightness temperature difference between 11- and 12-μm channels) that is required to retrieve cloud particle effective radius (re) of the high-resolution 3.745-μm channel. Rosenfeld et al. (2014b) developed a method for retrieving the high-resolution re from VIIRS, which makes it possible to obtain temperature (Zhu et al., 2014) and updraft (Zheng et al., 2015) at the convective cloud base. This technique is also a breakthrough in retrieving microphysical properties of clouds on 1-km resolution, including the retrieval of NCCN at the convective cloud base (Rosenfeld et al., 2016). The VIIRS data have also been applied to study the glaciation of aerosols in convective clouds (Zhu et al., 2015b).
Zhu et al. (2014) developed a new method to retrieve the base temperature (Tb) of convective clouds in the boundary layer by using the T–re profile of VIIRS. It was found that the standard deviation of the retrieved Tb is only 1.1°C compared with observations of ceilometer and soundings in two years at the southern Great Plains of the United States. Zheng et al. (2015) developed a method to retrieve the updraft of the cloud base (Wb) based on Tb retrieved from VIIRS, the cloud base height above the ground (Hb), and surface temperature. The standard deviation of retrieved Wb is 0.41 m s–1, as validated by the ground-based lidar observation. Zheng and Rosenfeld (2015) further developed a method to calculate Wb by formulating a linear relationship between Wb and Hb, which can be universally applied to the boundary layer convective cloud. The mean absolute error of the calculated Wb is 20% by validation with the observations from the ground and shipborne equipment. Rosenfeld et al. (2014a) retrieved the maximum supersaturation (Smax) and the number concentration of adiabatic cloud droplet (Nd,a) at convective cloud base, based on the T–re profile from high-resolution VIIRS data. The bias of retrieved NCCN from VIIRS is 20%–30%, as verified by ground-based and shipborne CCN counter (Rosenfeld et al., 2016). However, in-situ observations show that in the troposphere, thermal processes that deviate from being adiabatic commonly occur in convective clouds (Brenguier et al., 2011; Min et al., 2012), which may give rise to uncertainties in NCCN and Nd,a retrievals (Merk et al., 2016; Miller et al., 2016).
On the basis of the previous studies (Rosenfeld and Lensky, 1998; Rosenfeld et al. 2014a, b; Zhu et al., 2014, 2015a; Zheng and Rosenfeld, 2015), the Automatic Mapping of Convective Clouds (AMCC) software package has been developed (Yue et al., 2019) and implemented in this study. The microphysical properties of convective clouds are derived by using AMCC via the VIIRS data from June to August of 2013–17 whenSNPP overpassed the TP. The values are gridded and domain averaged to obtain the microphysical properties on the whole. These results can partly make up for the scarce of instrumented cloud observation and further deepen our understanding on microphysical properties of convective clouds in summer over the TP.
2 Data and retrieval method 2.1 DataThe VIIRS data of each granule scanning the TP for 5 minutes around 0700 UTC are provided by the NOAA’s Comprehensive Large Array-data Stewardship System (CLASS) at www.bou.class.noaa.gov/saa/products/. The temperature, pressure, humidity, and potential height of Final Operational Global Analysis (FNL) data from the NCEP are used as auxiliary data.
2.2 Retrieval methodThe AMCC software package (Yue et al., 2019) includes an improved cloud mask algorithm and has the capability of automatic detection of convective clouds. It consists of major modules of cloud mask, re retrieval, Tb retrieval, convective cloud detection, T–re analysis, NCCN retrieval, and quality control. The methodologies of AMCC are briefly introduced as follows.
It is well known that VIIRS receives visible light and infrared radiation from cloud particles near the cloud top. In order to obtain information inside the cloud, T and re at tops of convective cloud clusters of various altitudes in a certain spatial area are used to represent T and re of different heights within the single cloud, and to infer the microphysical properties of the convective cloud in this area. This is essentially a transform of space and time, assuming that the convective clouds of different states at the same time are similar to a convective cloud at different development stages. The basis of the above hypothe-sis is that the atmospheric environmental variables such as temperature, humidity, pressure, NCCN, and vertical motion are similar within a certain spatial region. Under the similar Hb, Tb, water vapor, NCCN, and dynamic conditions, the cloud particles formed by different air parcels that follow the adiabatic ascending are similar in size at the same height. Because the developing convective cloud can be constrained by adiabatic process, T and re at each cloud top within the cloud cluster can be used to approximate T and re at different heights within the single large convective cloud. Of course, the region of interest (ROI) for analysis cannot be too large or too small. If ROI is too large, a convective cloud of different pro-perties may be included, which is against the adiabatic constraint. If ROI is too small, the number of re pixels would be too small to reflect the general condition of the convective cloud in this region (Rosenfeld and Lensky, 1998; Dai et al., 2010). The testing results show that 96 × 96 pixels of 375-m VIIRS (36 km × 36 km at nadir) can be an appropriate ROI for analyzing the microphysical properties of the convective cloud. By following the same thought above, target regions of similar size are examined one by one for the entire VIIRS data. This approach has been validated against a series of observations by aircrafts penetrating clouds (Rosenfeld and Lensky, 1998; Rosenfeld and Woodley, 2000; Andreae et al., 2004; Prabha et al., 2011; Braga et al., 2017).
Since the upward radiation from the ground will pass through thin cloud and distort retrievals, the cloud mask scheme will remove thin clouds and keep thick clouds as the study targets so that the radiation from the ground cannot pass through. The cloud mask scheme is based on the look-up table of minimum reflectance at 0.6-μm high-resolution channel (ρ0.6h) of thick cloud, whose cloud optical depth is greater than 10. By the radiative transfer model, ρ0.6h of a thick cloud on land or ocean (with different reflectivities) are calculated under various solar zenith angle (Zsol), satellite zenith angle (Zsat), and relative azimuth of the solar and satellite (Arel); and then the look-up table of the minimum ρ0.6h of thick cloud is established [please see Section 3c(4) in Yue et al., 2019]. This scheme is a significant improvement to our previous one, in which the pixel of thick cloud is simply determined if its ρ0.6h is larger than 0.4, consequently leading to excessively eliminated pixels on the cloud boundary and underestimated Tb. The new scheme is more physically rational than the previous one owing to consideration of solar and satellite geometry.
A multiple-layer cloud under the thin cloud may be identified as thick cloud by the cloud mask scheme. These pixels must be excluded by the dynamic threshold defined by brightness temperature difference between 11- and 12-μm channels (Rosenfeld et al., 2014b), because their brightness temperature atop comes from the multiple-layer cloud and the thin cloud. For pixels of the thick cloud, their reflectance at 3.745-μm high-resolution channel (ρ3.7h) can be calculated from their corresponding brightness temperature, and re can then be obtained from the established look-up table based on ρ3.7h, Zsol, Zsat, and Arel (Nakajima and King, 1990; Rosenfeld and Lensky, 1998; Dai et al., 2010; Rosenfeld et al., 2014b).
As we know, for convective clouds, the cloud droplets are nucleated near the cloud base, and grow by the processes of condensation and collision with ascending airflow. Therefore, the temperature is highest and re is smallest at the cloud base. Moreover, re increases with decreasing temperature for a developing convective cloud. This relation can be used to identify convective clouds from non-convective clouds in a 96 × 96 pixel region (Lensky and Rosenfeld, 1997; Yue et al., 2019). The T–re profile and glaciation temperature (Tg) of convective cloud are obtained by T–re analysis (Rosenfeld and Lensky, 1998; Dai et al., 2010; Zhu et al., 2015b). After that, the warmest temperature is taken as Tb of T–re profile (Zhu et al., 2014), and Hb above the ground is obtained by linear interpolation using Tb and the vertical profile of FNL temperature and geopotential height. The precipitation initiation depth (D14), a reflection of the cloud’s ability to initiate precipitation, is calculated to be the difference between cloud base and the height when re reaches 14 μm (suggesting raindrop formation in warm cloud) (Rosenfeld and Lensky, 1998; Freud et al., 2008; Zhu et al., 2015a). The cloud-top temperature (Ttop) and altitude (Htop) can be obtained from the coldest temperature and its height in the T–re profile. The cloud depth (Dcld) is Htop minus Hb and surface height.
To avoid the effect of cloud droplet collision, the T–re profile near the cloud base with re smaller than 20 μm, which mostly likely observes the adiabatic ascending and nucleation, is selected to retrieve the Nd,a (Rosenfeld et al., 2014a) by the following expression:
| $ {N_{{\rm{d}}, {\rm{a}}}} = {\rm{LW}}{{\rm{C}}_{\rm{a}}}/{\rm{M}}{{\rm{r}}_{{\rm{v}}, {\rm{a}}}}, $ | (1) |
where LWCa is the cloud adiabatic liquid water content calculated by an adiabatic elevated parcel from cloud base to isotherm T; Mrv,a = (4/3)ρπrv3 is the mass of a adiabatic cloud drop, ρ is the water density, and rv is mean volume radius. It is known that re is equal to 1.08rv based on observations of Brenguier et al. (2011) and Freud et al. (2011). Considering the air mixing at cloud base (Freud et al., 2011), we take NCCN = Nd,a/1.3. In addition, the maximum supersaturation at cloud base is computed by the following algorithm:
| $ {S_{\rm max }} = CW_{\rm{b}}^{3/4}N_{{\rm{d}}, {\rm{a}}}^{ - 1/2}, $ | (2) |
where C is the coefficient related to temperature and pressure of the cloud base (Pinsky et al., 2012), Wb is the updraft in unit of m s–1, and equals 0.0009 × Hb (Hb is in unit of m) (Zheng and Rosenfeld, 2015).
The grid resolution of AMCC for convective clouds is about 36 km × 36 km (0.33° × 0.33°) at nadir. The output macro- and microphysical variables for convective clouds at each grid include Tb, Hb, Wb, Smax, NCCN, D14, Ttop, Htop, Dcld, and Tg. The retrieval accuracy is relatively low at the granule edge having larger Zsat, and greatly affected by cloud shadow especially when the cloud is against the sun and Zsat is large. To ensure accuracy, only those retrieved variables whose Zsat is between –20° and 50° are used in the following analyses.
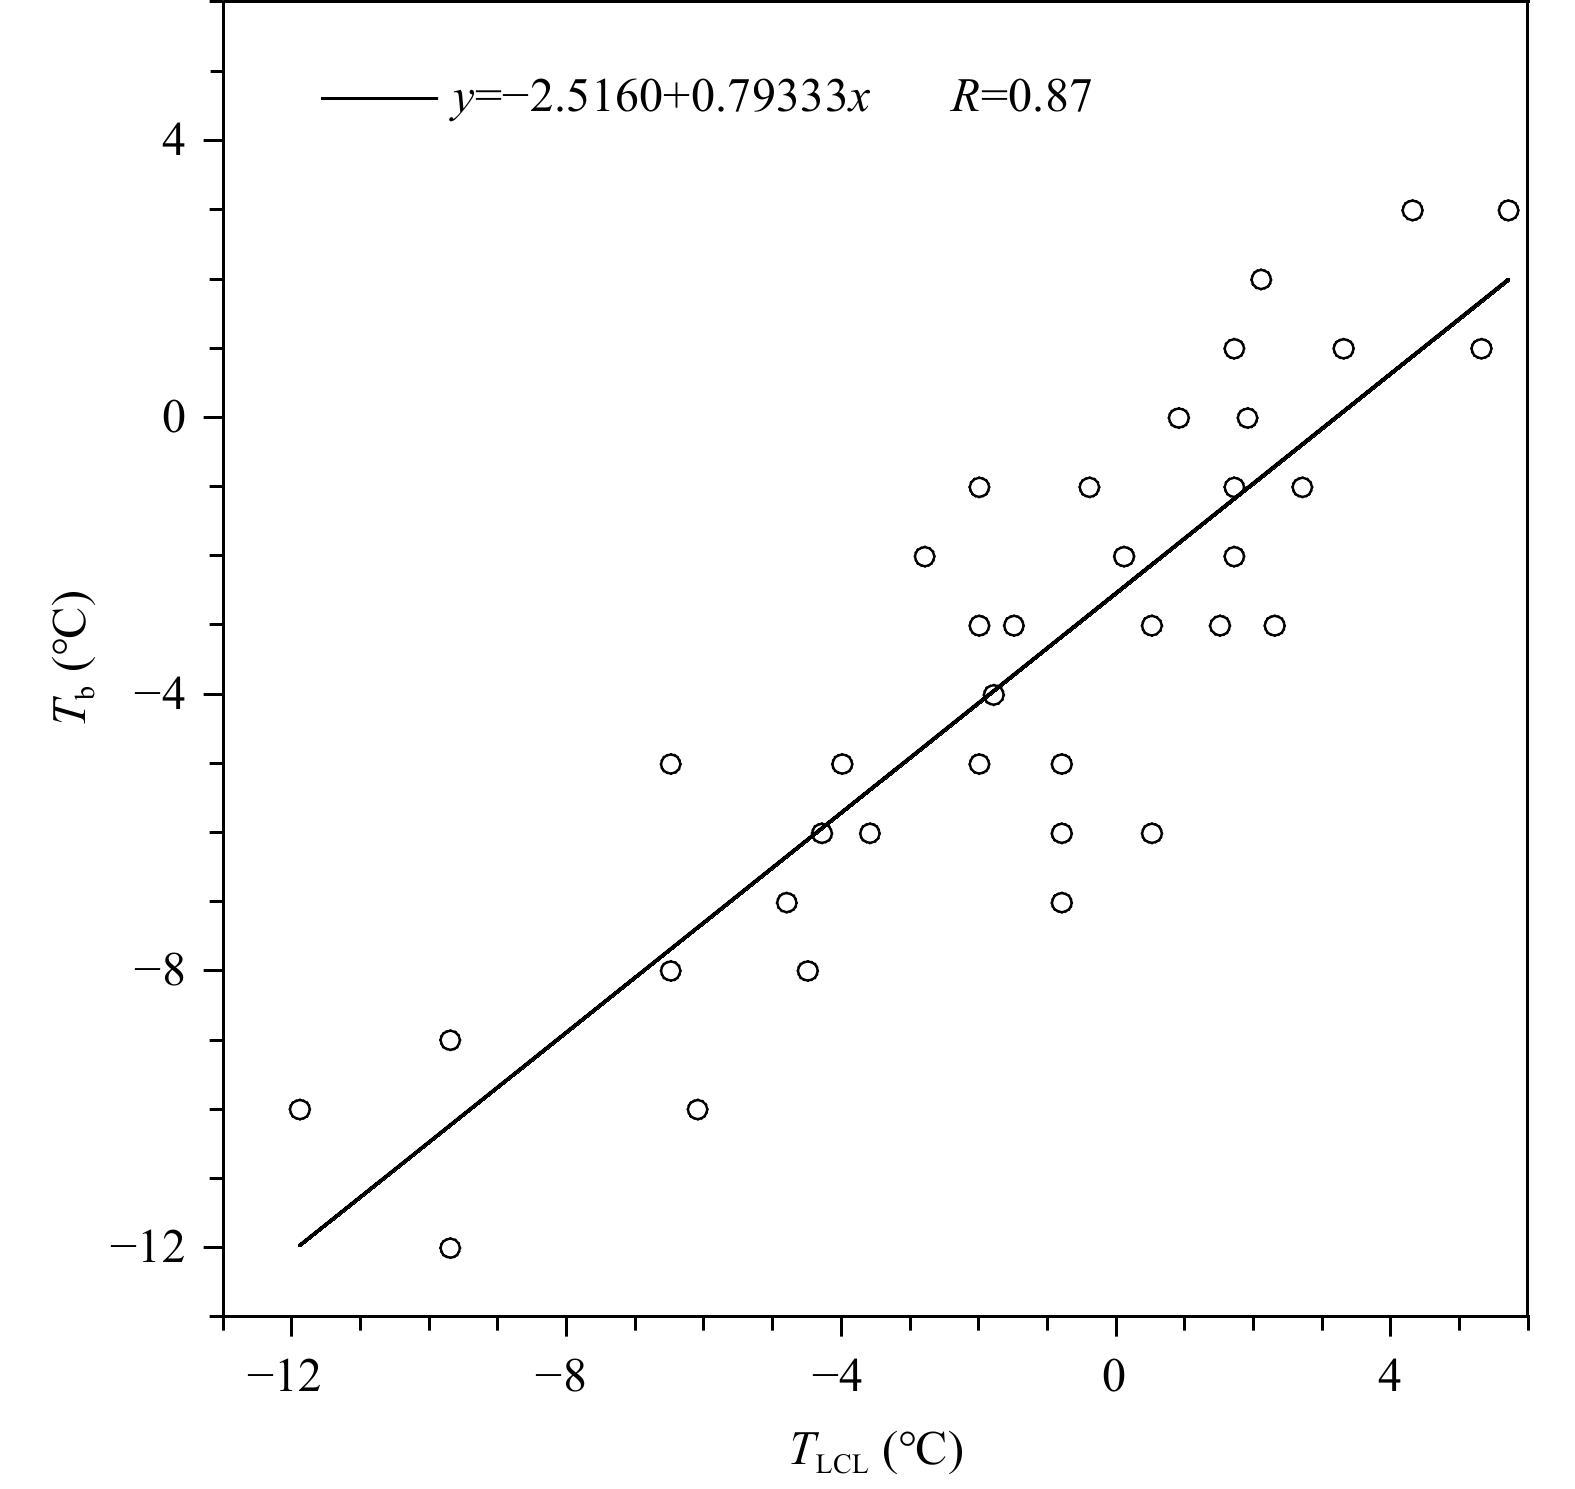
3 Results 3.1 Validation of cloud base temperatureThe retrieval of Tb is critical because the accuracy of retrieved Tb directly influences the accuracy of Wb, Smax, and NCCN. The lifting condensation level (LCL) calculated from sounding is usually used as the height of cloud base. The Third Tibetan Plateau Atmospheric Science Experiment (TIPEX-III) launched additional sounding on 0600 UTC during the summers of 2013–16 in the TP, which supplied data to validate the accuracy of retrieved Tb. The sounding data at Naqu meteorological station (31.48°N, 92.06°E), are used to calculate temperature at the LCL (TLCL). The Tb values are retrieved by satellite data from SNPP/VIIRS that overpassed the sounding site around the sounding time. Comparison between Tb and TLCL (Fig. 1) shows that Tb and TLCL are consistent (with a correlation coefficient of 0.87 and standard deviation of 3.0°C for 37 samples matching well in time). This suggests that Tb from VIIRS is reliable over the TP.
|
| Figure 1 Comparison between the temperature of lifting condensation level (TLCL) at Naqu meteorological station and the cloud base temperature (Tb) from VIIRS. |
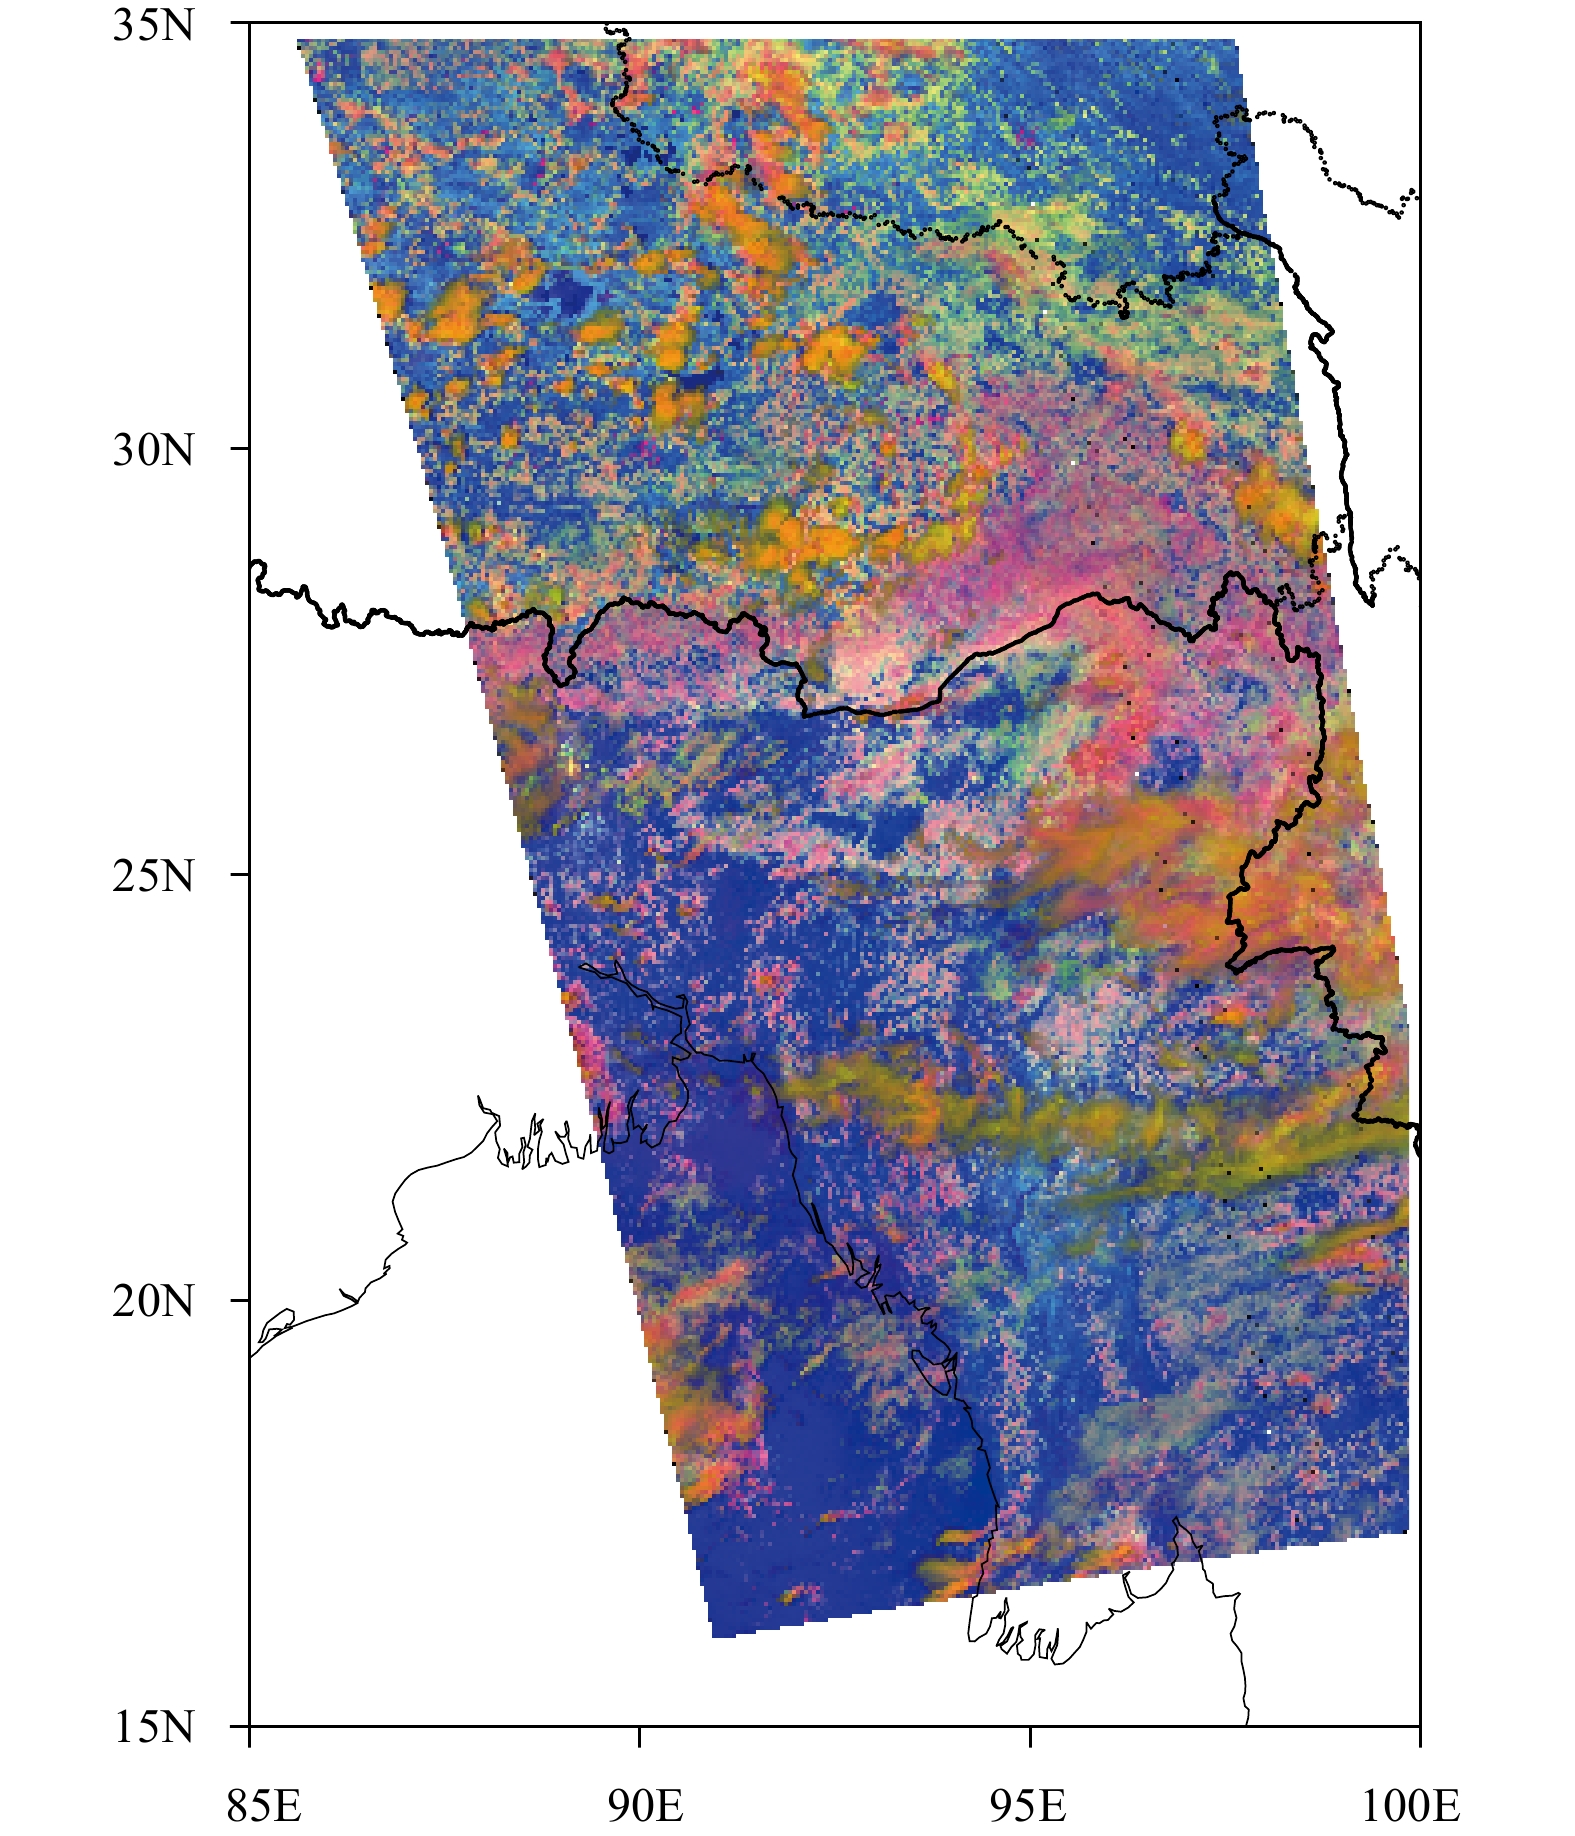
The red–green–blue microphysical composite image (Rosenfeld and Lensky, 1998) of SNPP/VIIRS at 0702 UTC 19 June 2016 (with satellite zenith angle between –20° and 50°) is presented in Fig. 2, showing abundance of convective cloud clusters over the TP, eastern India, and most areas of Burma.
|
| Figure 2 VIIRS RGB composite image of 0.6-μm reflectance (red), 2.2-μm reflectance (green), and 11-μm brightness temperature (blue) on medium resolution at 0702 UTC 19 June 2016. The satellite zenith angle is between –20° and 50°. The meaning of RGB composite is after Rosenfeld and Lensky (1998). |
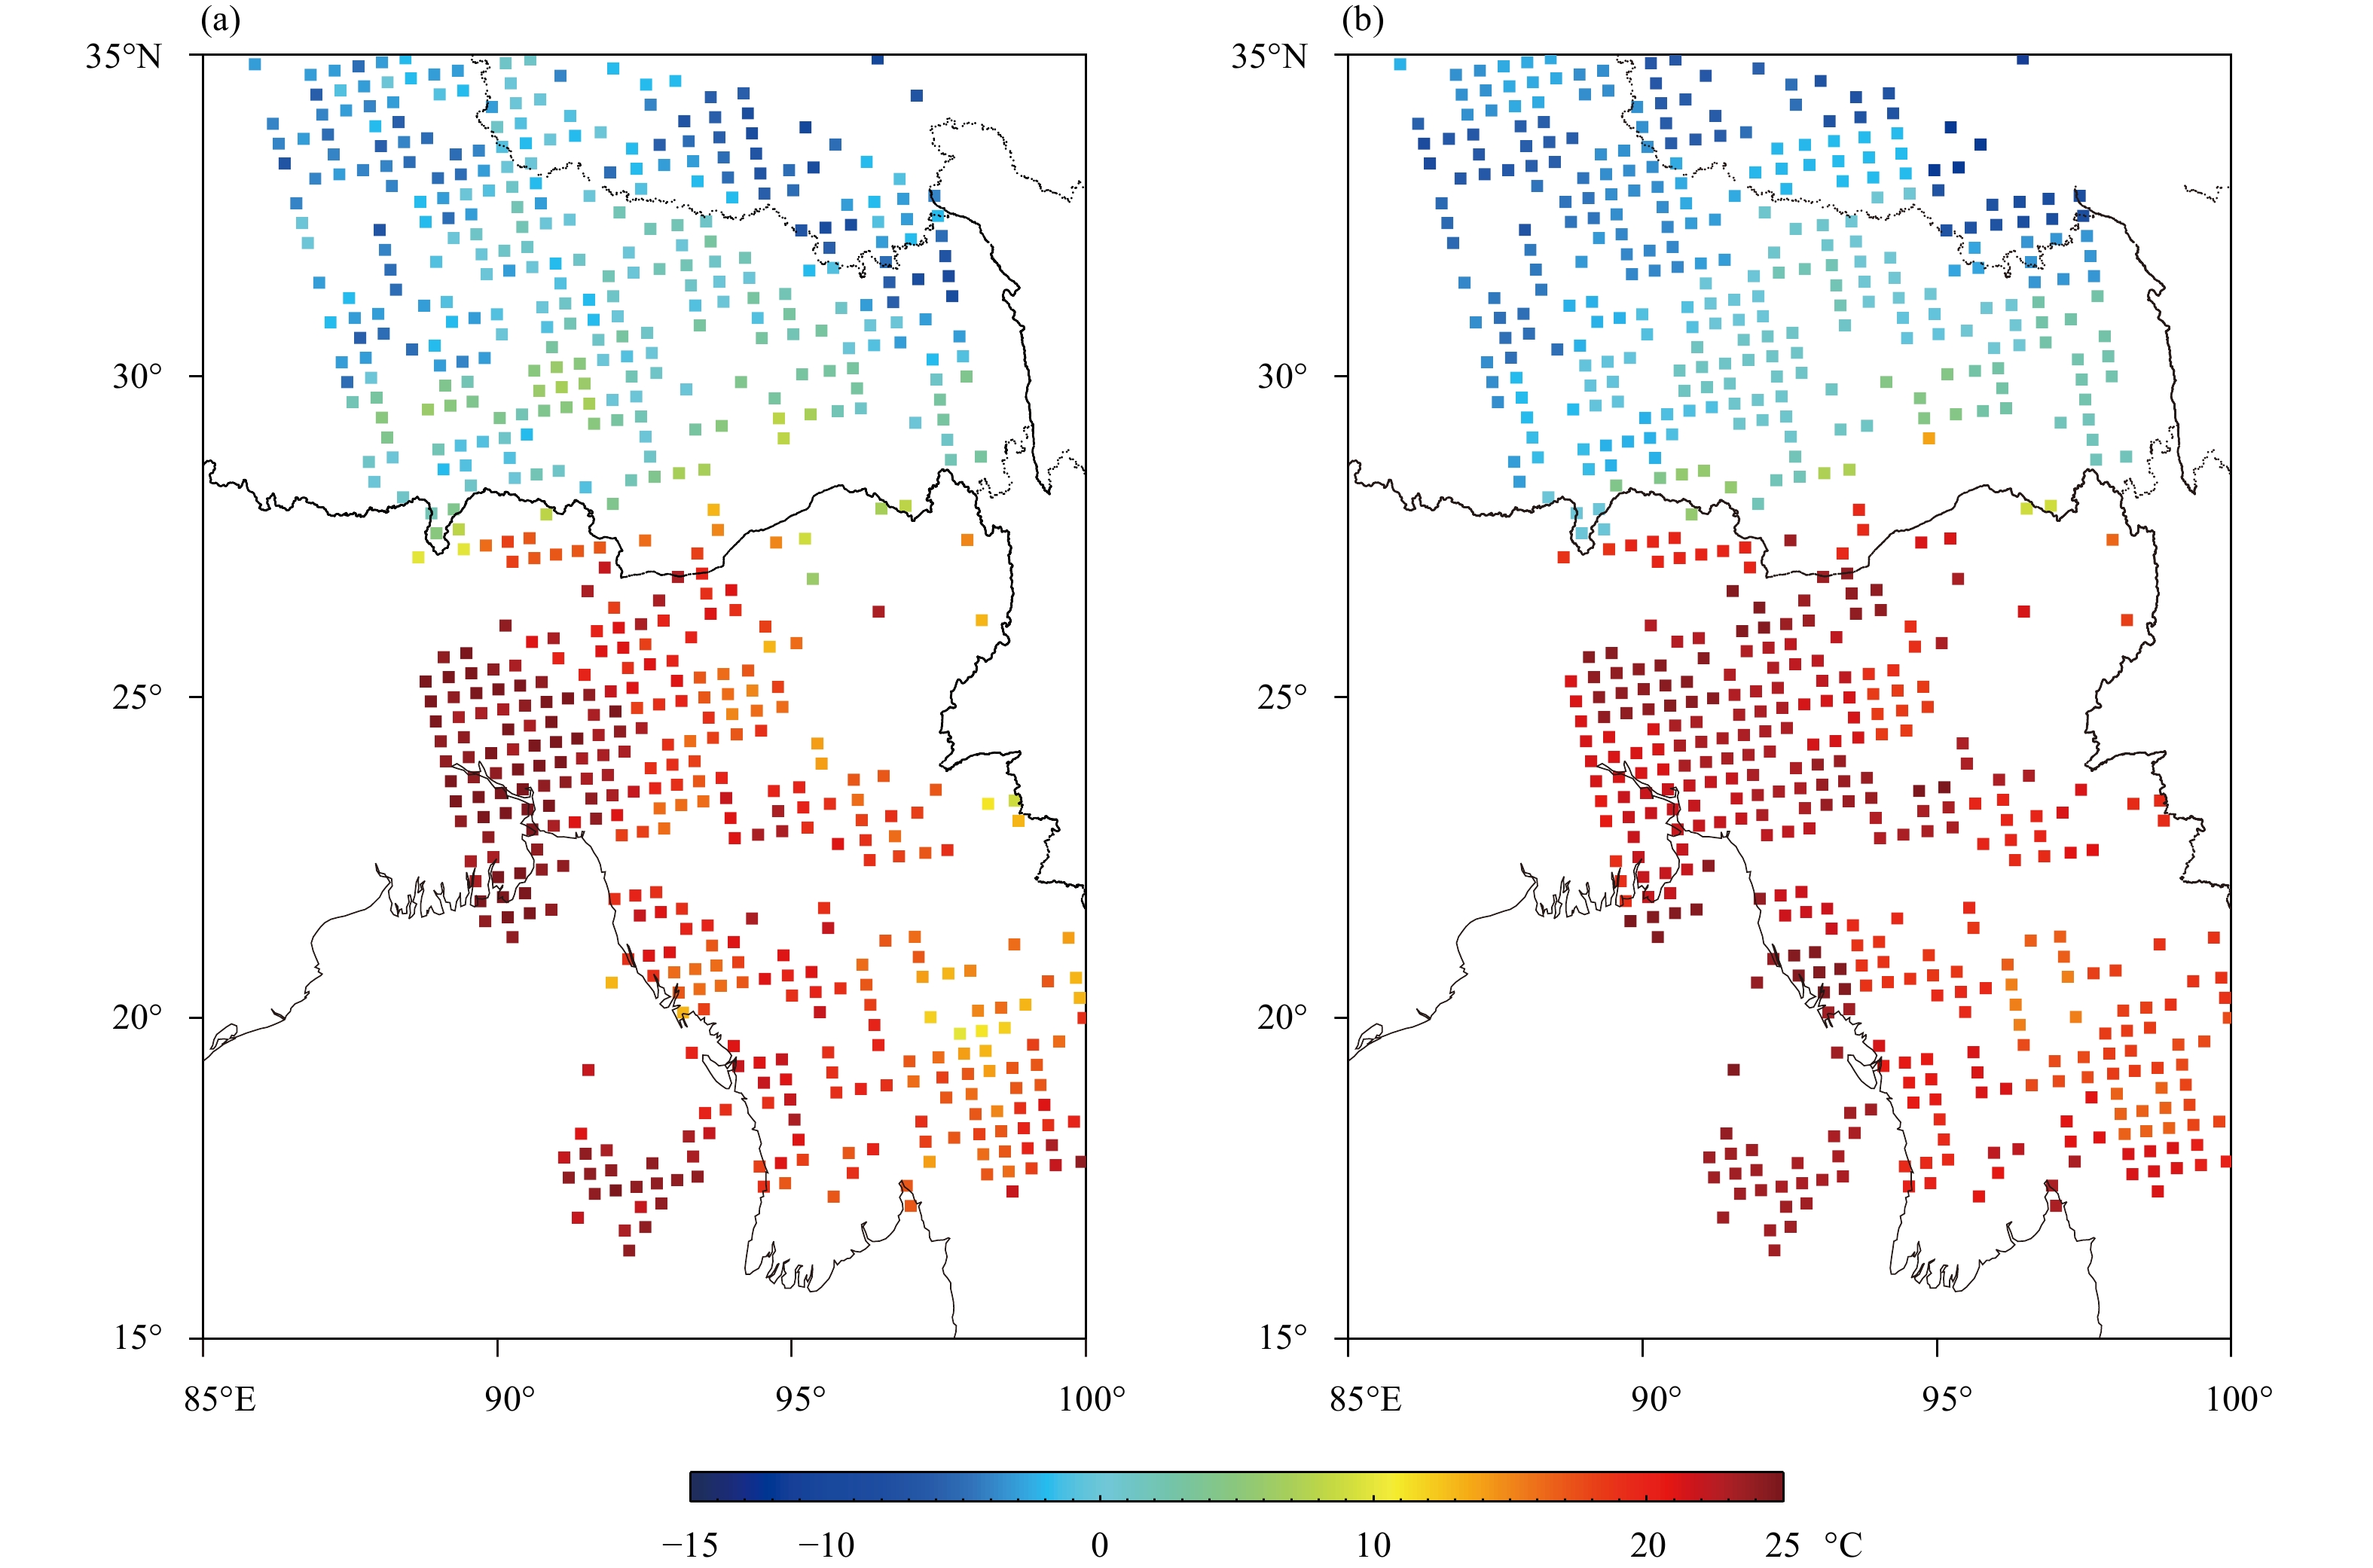
Comparison of retrieved Tb from VIIR (Fig. 3a) and TLCL calculated from FNL 2-m temperature (Fig. 3b) shows that the retrieved Tb is stable and reliable over the ocean, land, and large topography. As shown in Fig. 3a, the convective clouds over India, Bhutan, Bangladesh, Burma, and Thailand are clouds of warm base whose Tb varies from 10 to 25°C. Over the TP, the convective clouds have cold base with Tb of approximately –10°C over southern Qinghai and –5°C over the central Tibet. The value of Tb is relatively high and is about 5°C over Lhasa to Shigatse. Based on the intensive sounding observations at Lhasa and Naqu at 0600 UTC 19 June 2016, TLCL values at the two sites are 5.3 and 2.1°C, while Tb values from VIIRS at 0702 UTC at these two sites are 5.0 and 2.0°C, suggesting that Tb retrieved from satellite is consistent with TLCL derived from sounding data.
|
| Figure 3 Distributions of (a) retrieved cloud base temperature (Tb) from VIIRS at 0702 UTC 19 June 2016 and (b) the temperature of lifting condensation level (TLCL) calculated by FNL 2-m temperature over the surface. Both Tb and TLCL are marked by the colored squares in unit of °C. |
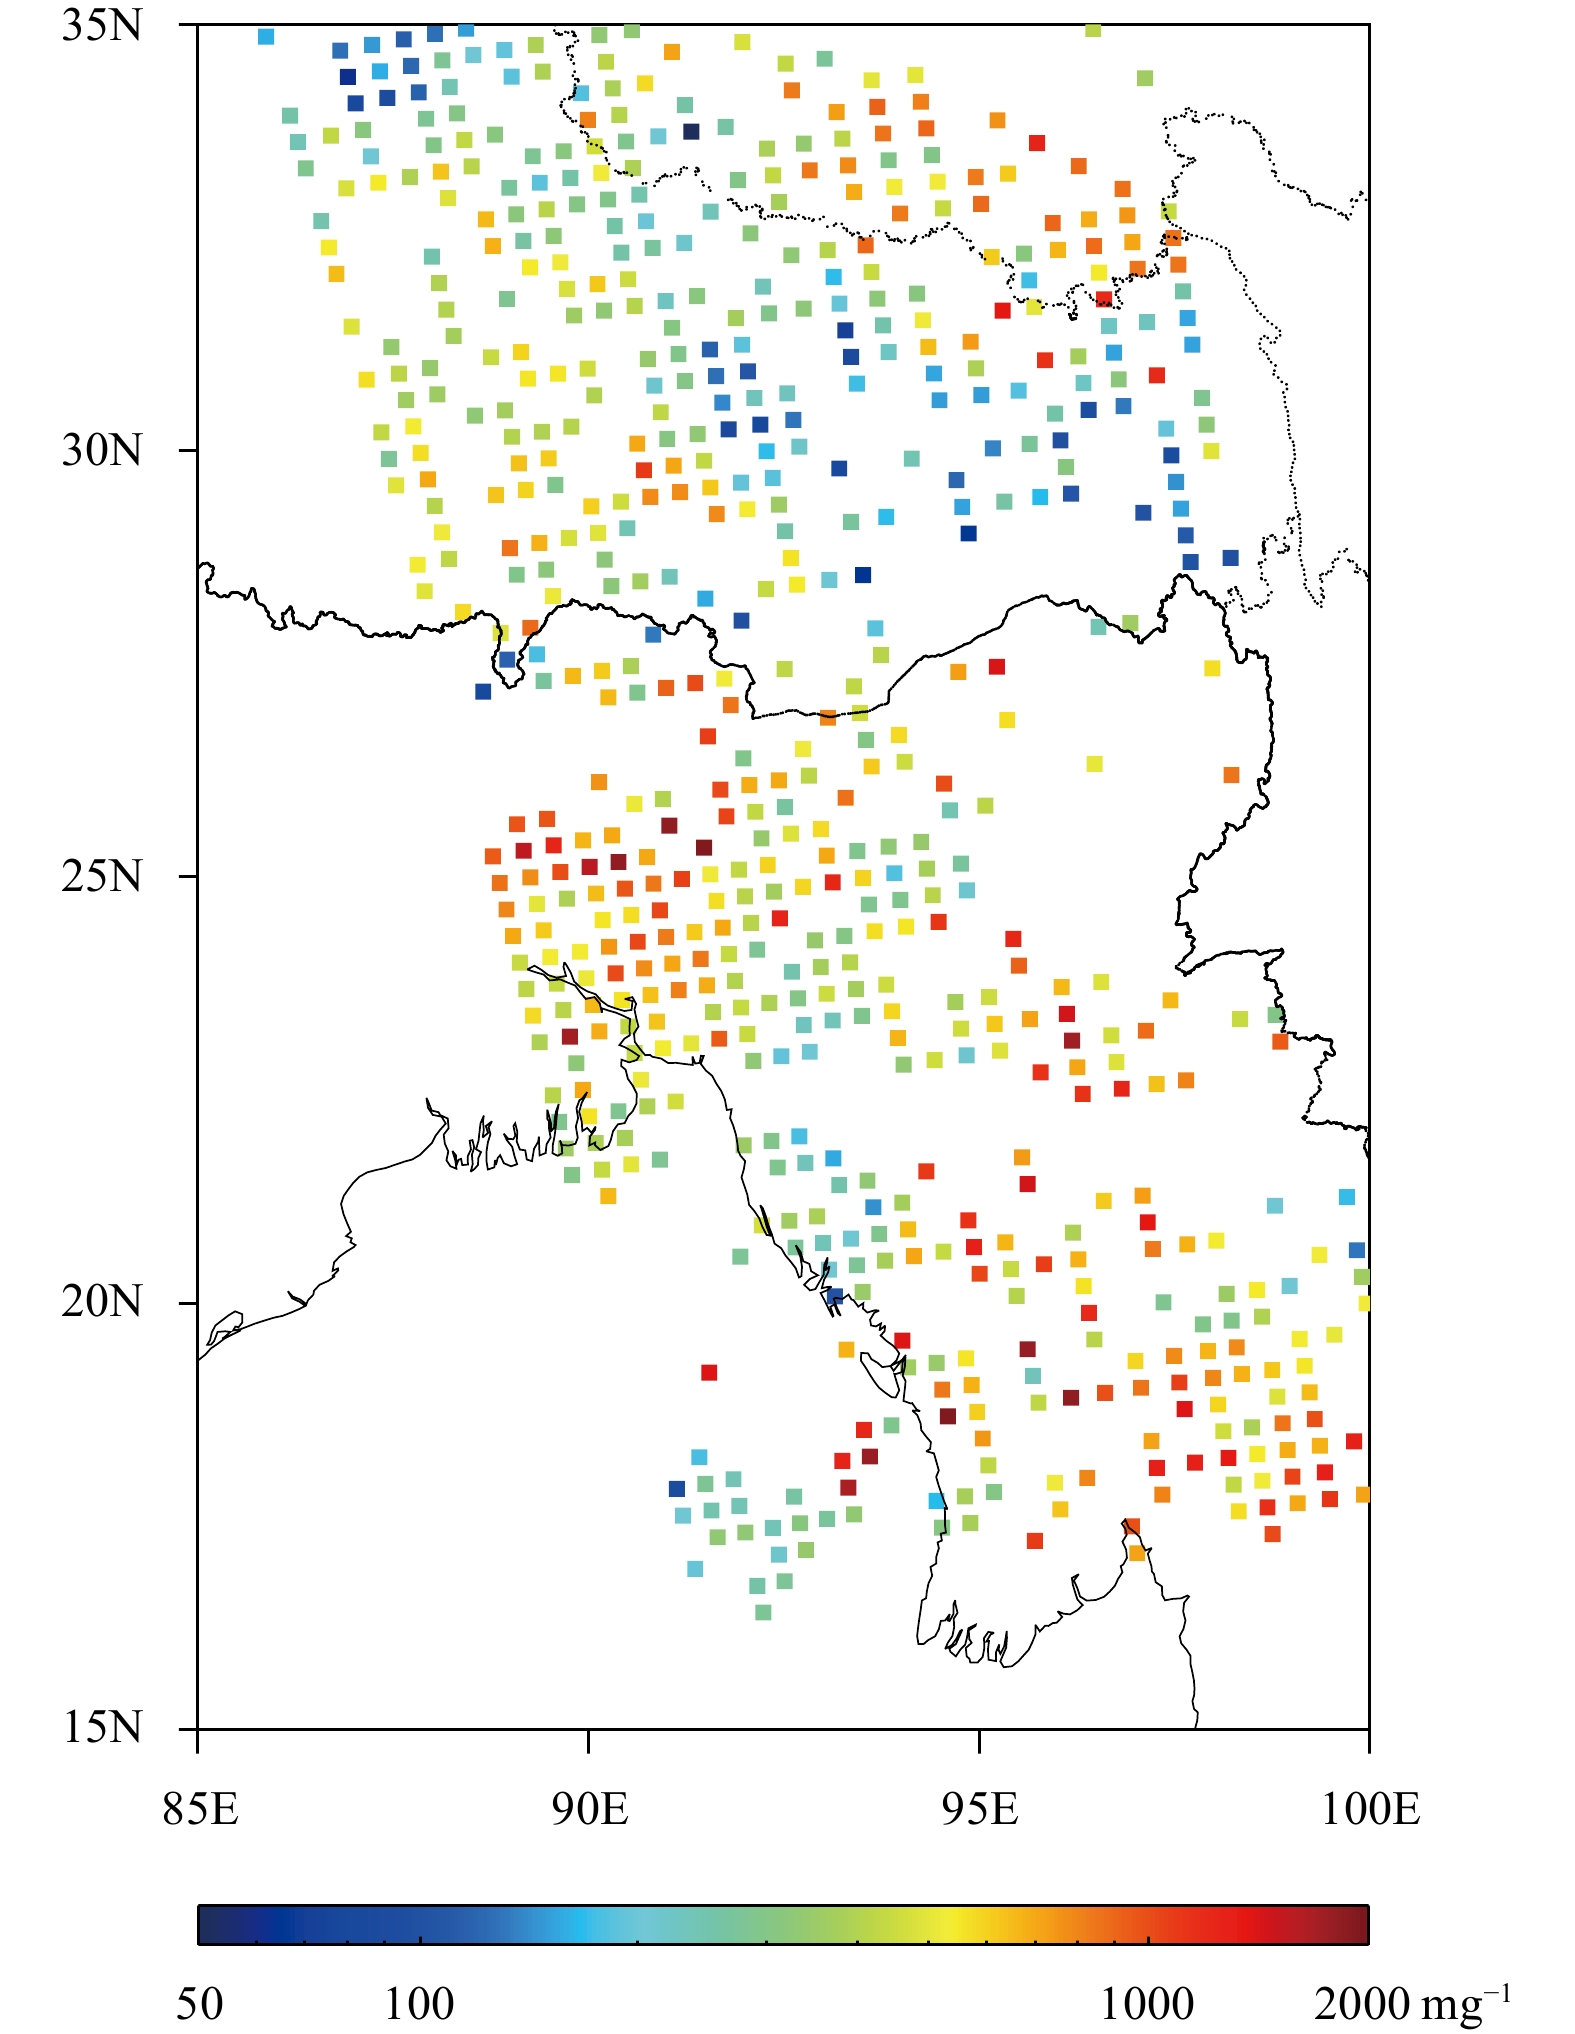
Figure 4 shows the distribution of NCCN. It is the highest in central Burma, exceeding 2000 mg–1 in some parts. High NCCN of about 1000 mg–1 is also found over Bangladesh and the Brahmaputra River basin, India. The NCCN is about 500 mg–1 over Bhutan and the western TP, and is very low in the eastern TP (50–200 mg–1), equivalent to the in-situ observed NCCN of 10–110 mg–1 in He-nan County and Maqu region at the upstream of the Yellow River (Huang et al., 2002). One of the important reasons for this low NCCN is that less human activity and less pollution occur in these areas. The NCCN is about 1000 mg–1 near Lhasa, which reflects the connection of high NCCN to dense population and urban industry. High NCCN of 800–1100 mg–1 appears in southern part of Qinghai, which is attributed to the influence of frequent sand dust there. Although no direct in-situ observation of NCCN on 19 June 2016 over the TP is available, the distribution of VIIRS retrieved NCCN agrees well with peo-ple’s up-to-date knowledge, indicating that AMCC has the capability to retrieve microphysical properties of convective cloud over the TP.
|
| Figure 4 Distribution of cloud condensation nuclei concentration (NCCN; mg–1) retrieved from VIIRS at 0702 UTC 19 June 2016. Others are the same as in Fig. 3 |
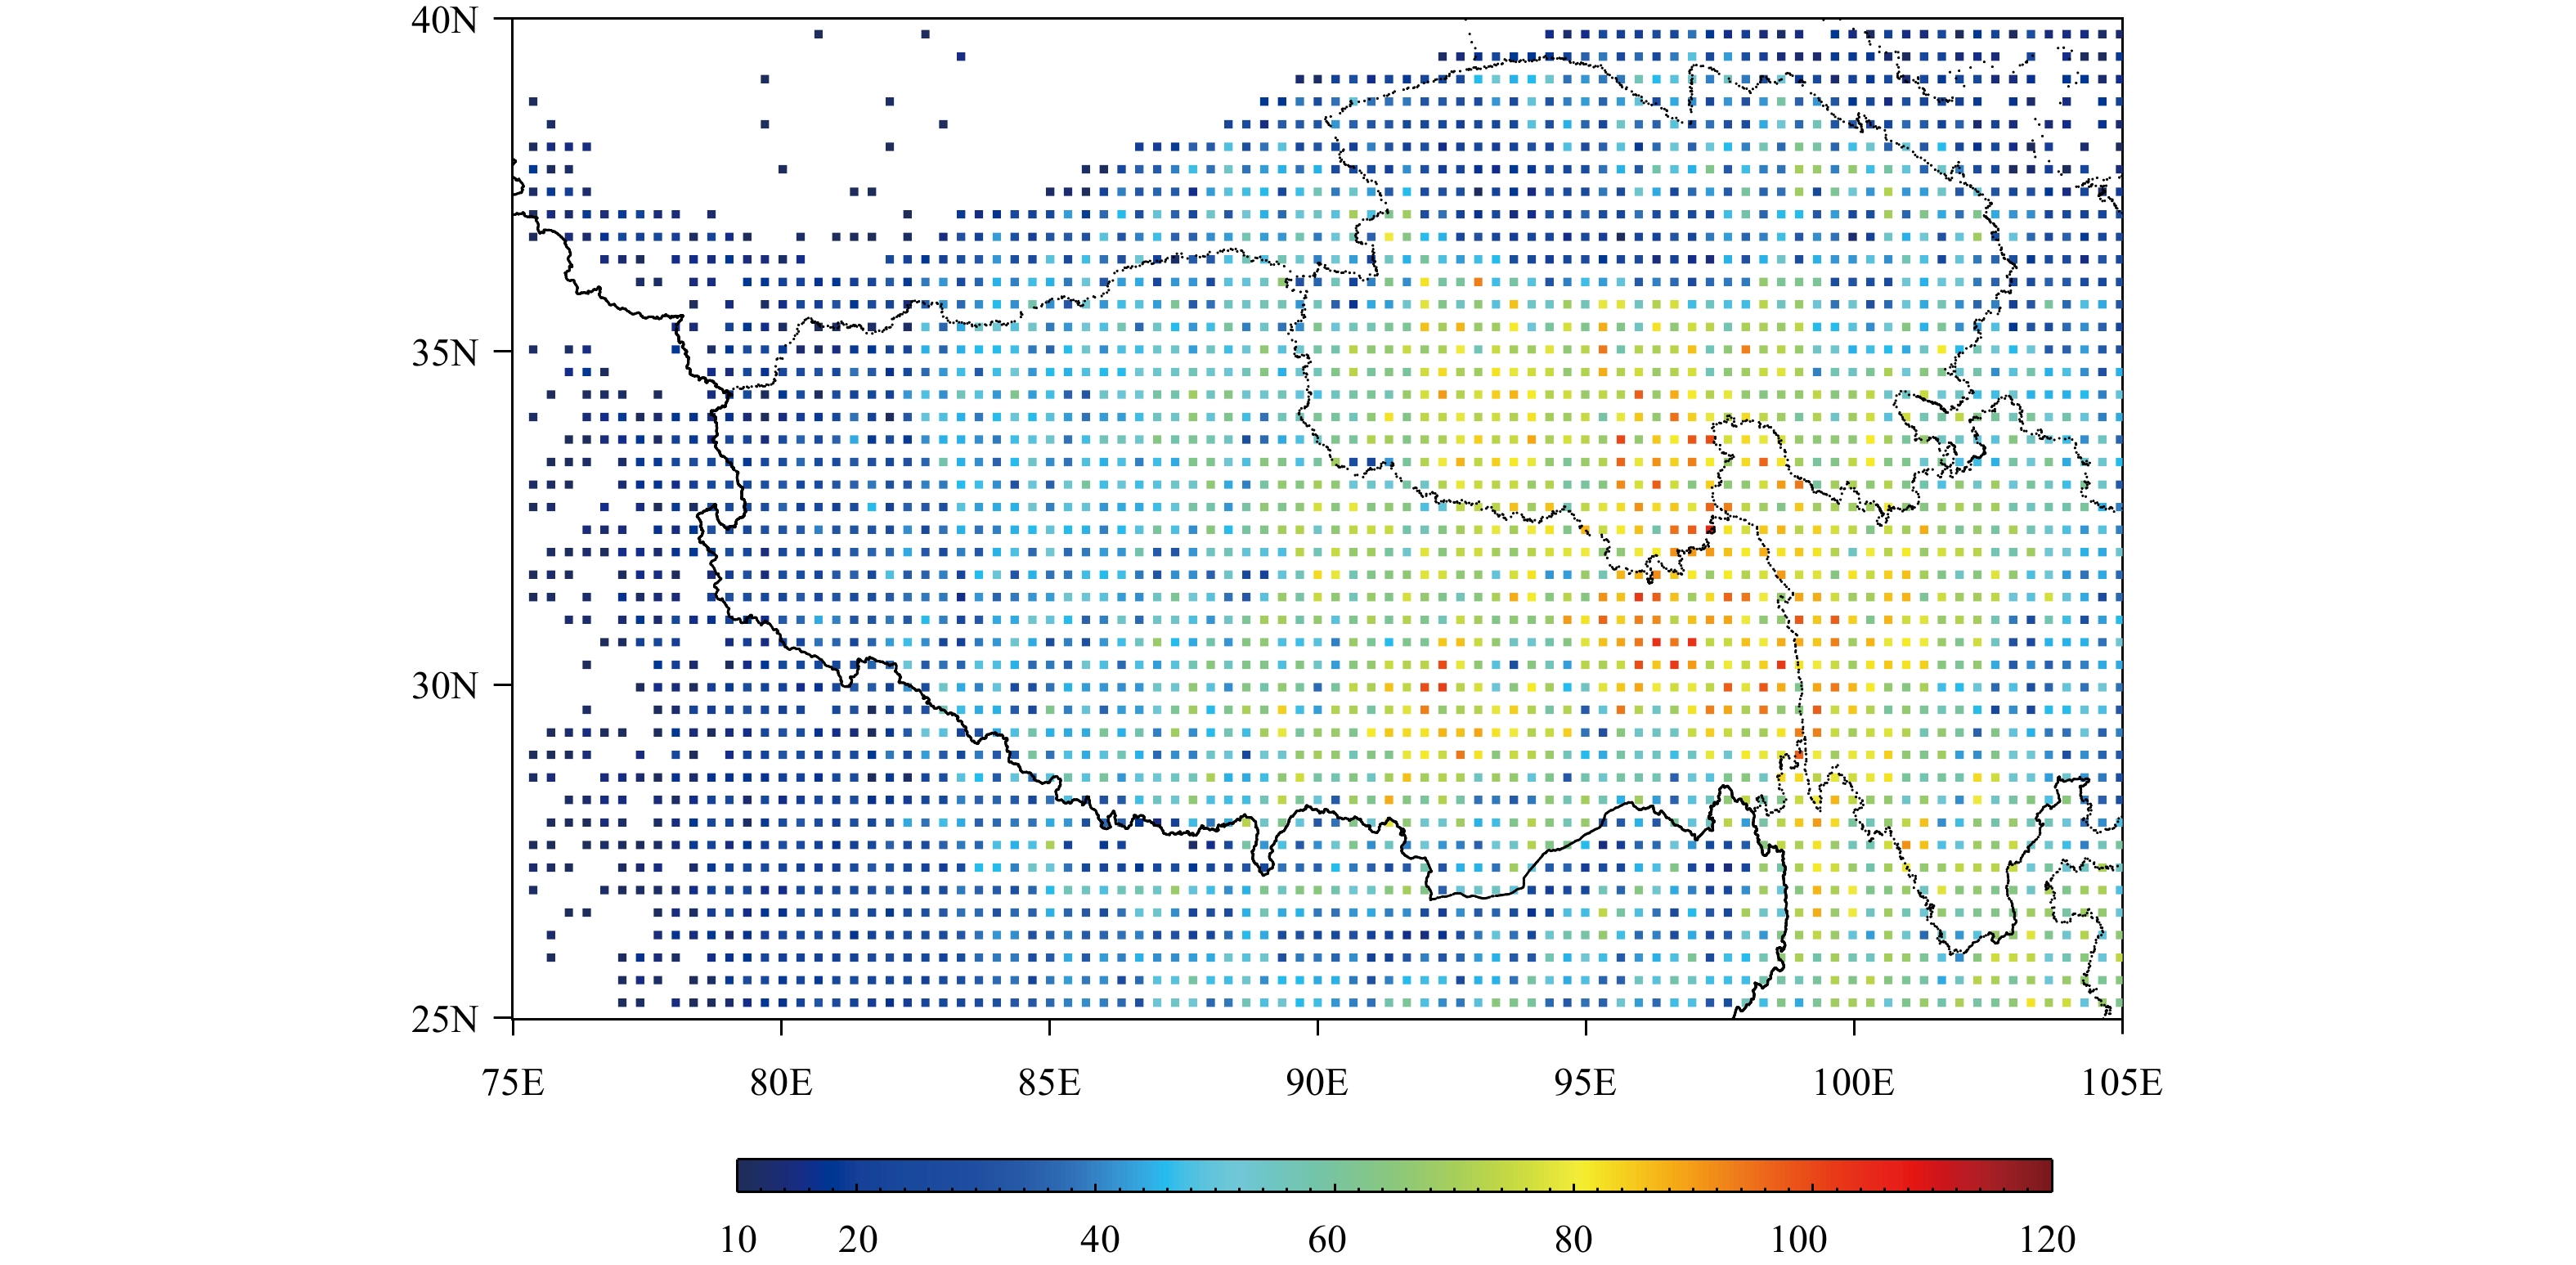
In order to be representative, all 569 granules of SNPP/VIIRS satellite that overpassed the TP in summer of 2013–17 are selected. For each granule, retrieval is carried out by AMCC for each ROI where only convective clouds are detected (Yue et al., 2019). The sample number is the total number of executable retrievals within each grid of 0.33° × 0.33°, and it must be ≥ 10 when deriving a grid value for a retrieved variable. The distribution of the sample number over all the grids is presented in Fig. 5. For most grids, the sample number is larger than 20 in the western TP and 80 (even 100) in the eastern TP. This suggests that convection is active in the eastern TP and relatively weak in the northern and western TP, which agrees with many previous studies (Zhang et al., 2015; Chang and Guo, 2016; Fu et al., 2016).
|
| Figure 5 Distribution of sample number at 0.33° × 0.33° grids. The colored solid squares represent the sample number |
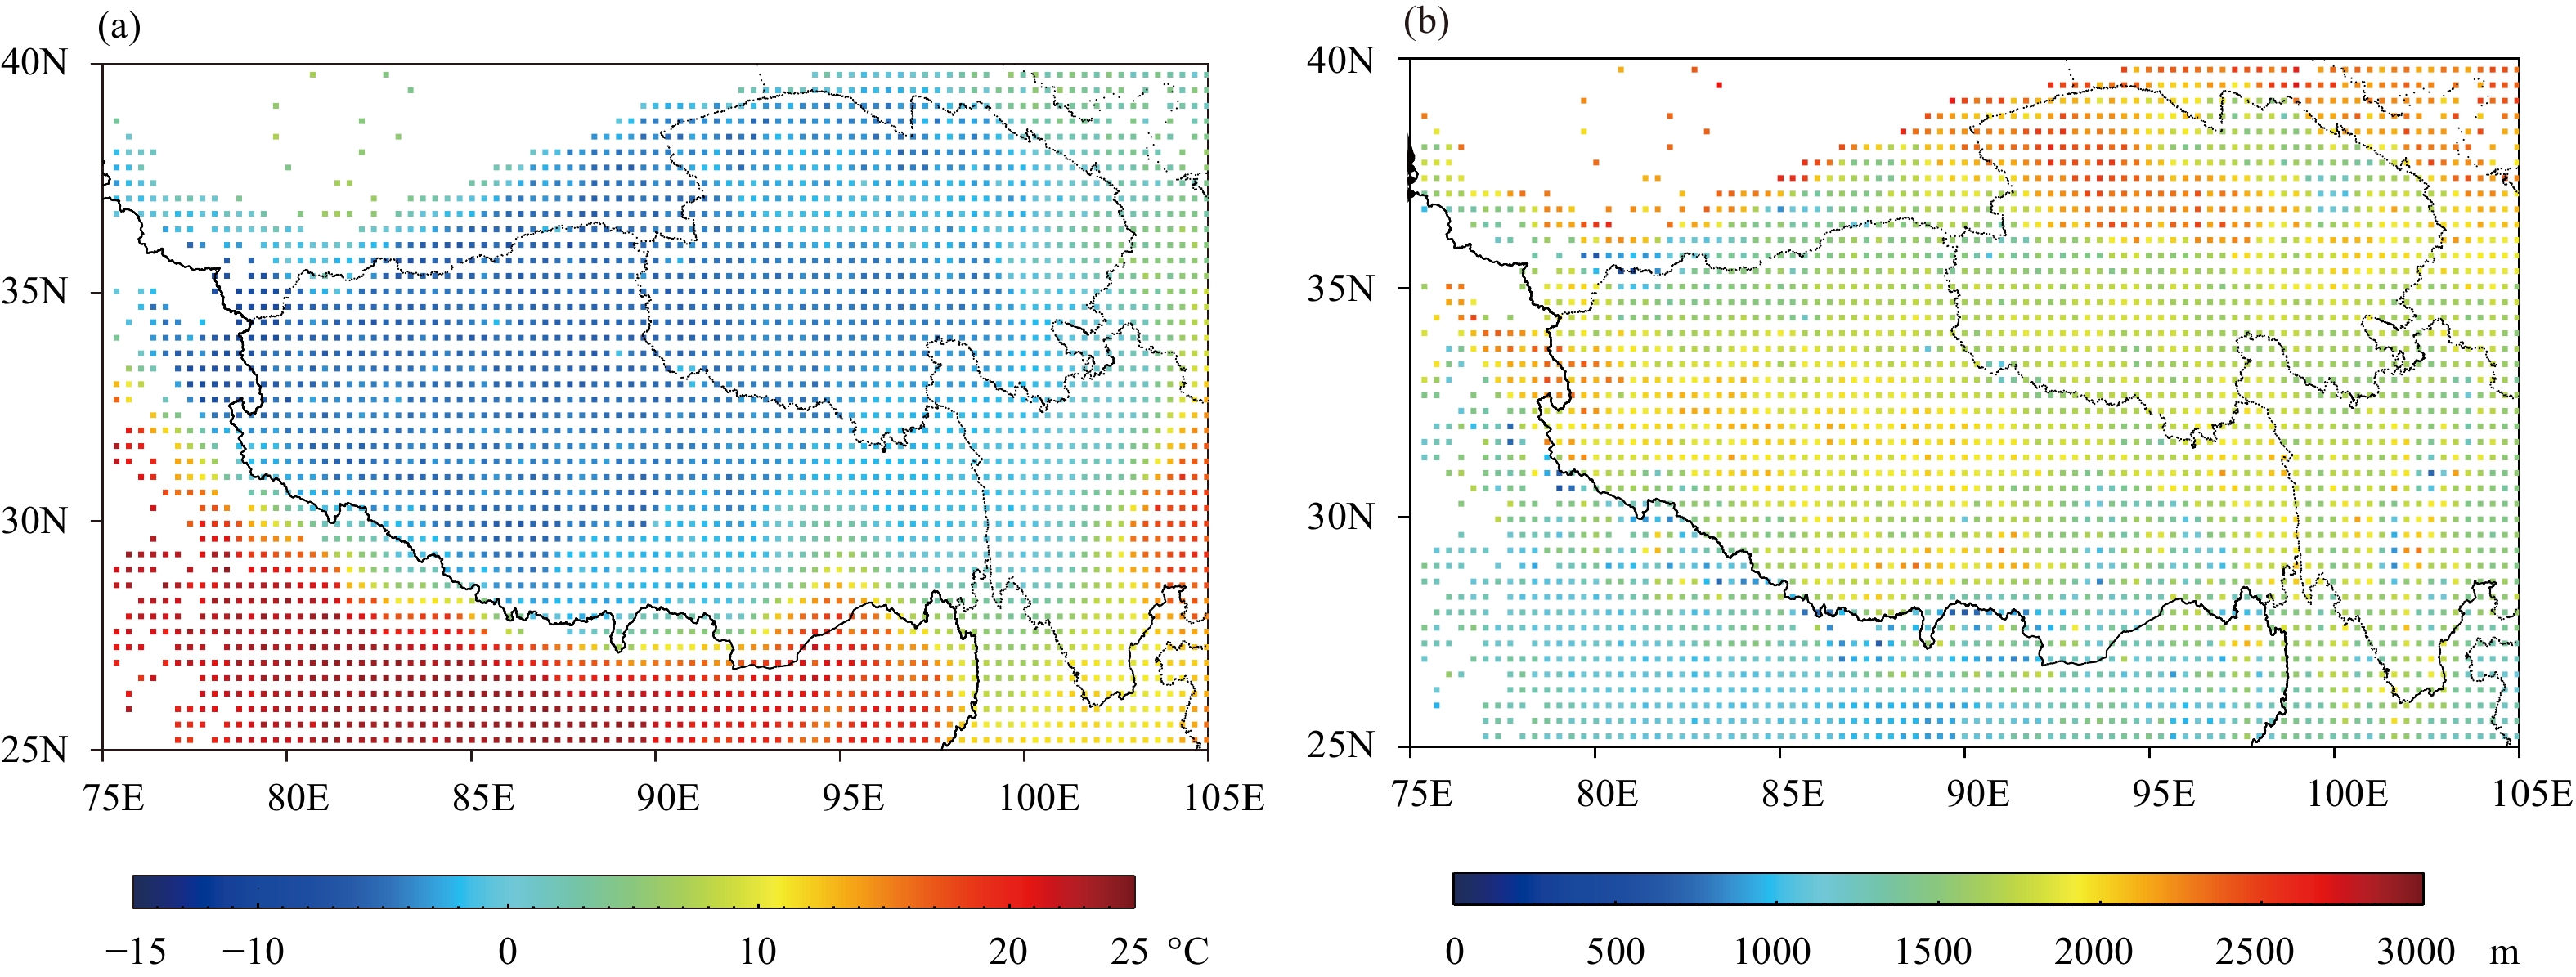
The distributions of mean Tb and Hb retrieved from VIIRS are displayed in Fig. 6. Over the TP, Tb is about –5°C with a standard deviation (STD) of 4°C ( Fig. 6a). It is about –2°C in Qaidam basin and 0°C at the edge of the TP with an STD of 4°C. In India, Nepal, and Bangladesh, Tb is about 20–25°C with an STD of 2°C. In western Sichuan basin, Tb is 18°C with an STD of 6°C. As shown in Fig. 6b, Hb is high: about 1800–2200 m over the central and southern TP, 1100 m over the Yarlung Zangbo Grand Canyon, and around 1500 m over the Sichuan basin. The highest (lowest) Hb is 2500 m (700 m) over the Qaidam basin (over Nepal and Bhutan). The above results are consistent with the observations in the TP (Xu and Chen, 2006), where mean Hb over the TP is higher than 1500 m and is hundreds of meters higher than Hb over plains and basins to its east in summer. Also, the results agree with those of previous studies that the cloud base height is about 6–7 km above sea level over 29.5°–35°N, 90°–100°E based on theCloudSat data (Zhang et al., 2015), and the average Hb by ceilometer is 2.38 km over the Naqu area (Chang and Guo, 2016).
|
| Figure 6 Distributions of (a) average cloud base temperature (Tb; °C) and (b) cloud base height above the ground (Hb; m) on 0.33° × 0.33° grids |
In summer over the TP, Tb is about –5°C, corresponding to cloud base at about 6000 m (550 hPa) above sea level, and the water vapor mixing ratio is about 4.6 g kg –1. On the contrast, in the Sichuan basin Tb is 18°C corresponding to 2000 m (850 hPa) above sea level and the water vapor mixing ratio is 15 g kg–1. Apparently, the water vapor content over the TP is only 1/3 that over the plains/basins to its east. Because the clouds over the TP are located at higher levels, with their main part above the level of 0°C, they are dominated by cold cloud microphysical process. Compared to convective clouds of warm base, the condensation hydrometers are fewer in convective clouds of cold base, and consequently less latent heat is released with smaller convective available potential energy (CAPE), and total precipitation and intensity are also rather small, which is consistent with the conclusion of Fu et al. (2016) that the mean convective precipitation intensity is about 1.6 mm h–1.
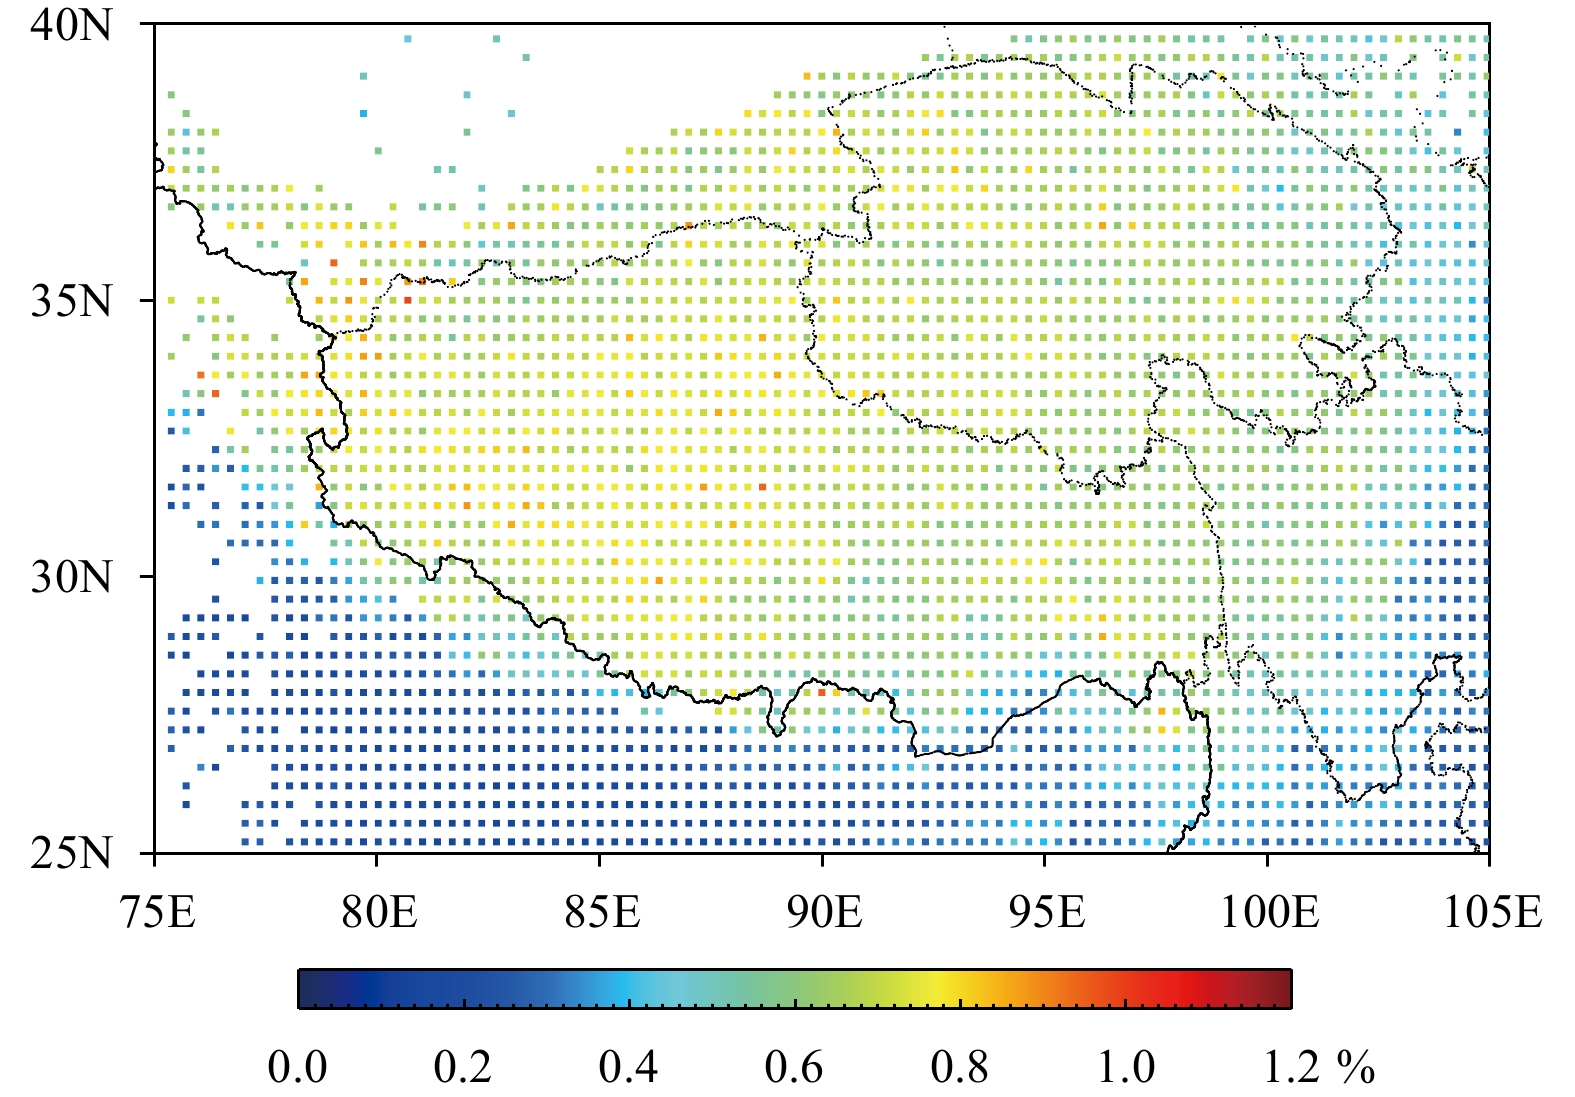
3.3.3 Number concentration of CCN (Overall, due to less anthropogenic influence, the mean NCCN at the cloud base over the TP is 200–400 mg–1 with an STD of about 200 mg–1 (Fig. 7) and the mean Smax is about 0.7% (Fig. 8). Around Lhasa, NCCN is about 500 mg–1 with an STD of 260 mg–1 and Smax is about 0.6%. Over the Yarlung Zangbo River basin and southern Tibet, NCCN is smaller, 100–200 mg–1, with an STD of 100–200 mg–1, and Smax is about 0.8%. Over the Qaidam basin, NCCN is greater, 500–800 mg–1, with STD of 200–800 mg–1, which is possibly related to regional dust and dust transport. From south to north along India–Nepal–TP,NCCN gradually decreases from 1000 to 200 mg–1 with the increasing terrain elevation.

|
| Figure 7 Distribution of average cloud condensation nuclei concentration (NCCN; mg–1) at cloud base |
|
| Figure 8 Distribution of average maximum supersaturation (Smax; %) at cloud base |
Overall, Smax is obviously higher over the TP than over the surrounding plains/basins (Fig. 8). It is 0.8% in the central and western TP, and slightly lower (0.6%) in the eastern and northern TP. However, Smax is very small (about 0.3%) in western Sichuan basin. The condensation growing of warm cloud droplets can be expressed as
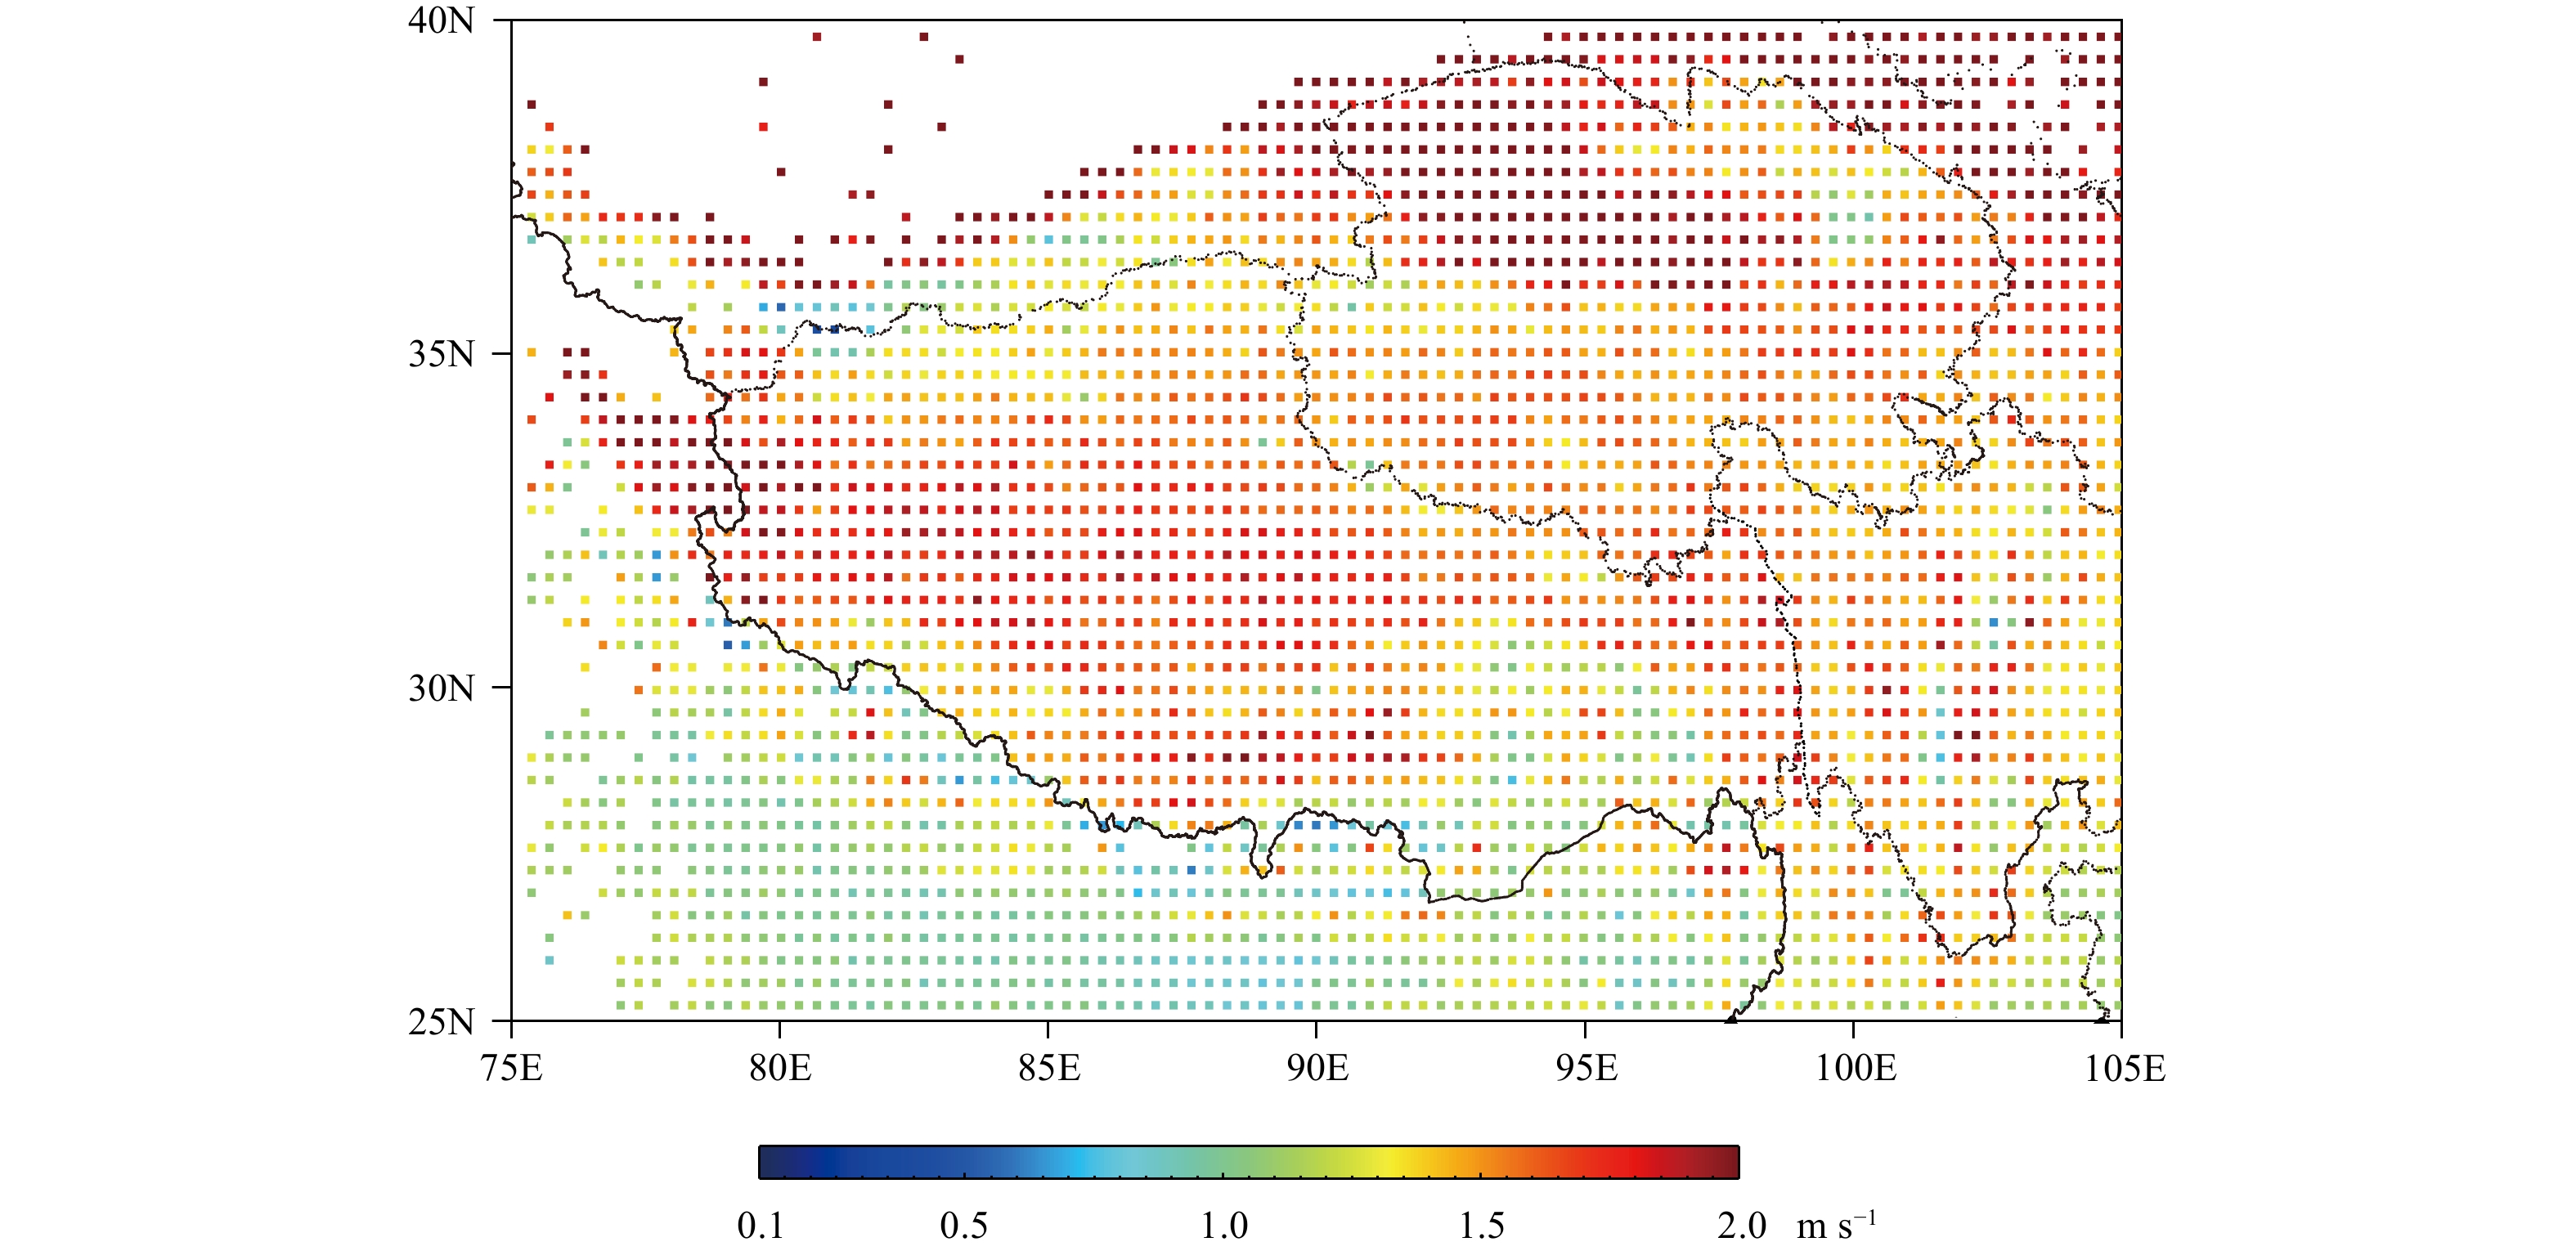
The average updraft at cloud base (Wb) is equal to or larger than 1.5 m s–1 over most of the TP (Fig. 9) and is about 1 m s–1 over the Yarlung Zangbo River basin and southern Tibet, slightly smaller than the other areas of the TP. Wb is relatively larger (2–2.3 m s–1) over the Qaidam basin of Qinghai. Wb is about 1 m s–1over India (the south side of the plateau), obviously lower than that over the TP. The large Wb over the TP is possibly attributed to the release of latent heat from deposition process at the beginning of cloud formation. Because of the cold cloud base and low environmental temperature, latent heat of condensation is small but latent heat of deposition is greater at the beginning of cloud formation (Wang et al., 2002). Xu and Chen (2006) observed an abnormally ascending hot bubble with updraft of 1 m s–1 by use of a Sodar over the TP. Fu et al. (2016) found that in the TP, there are larger portions of precipitation from “warm” cloud tops whose height of radar echo exceeds 6 km, despite of the environmental temperature being lower than 0°C. It is speculated that updraft is strong in shallow convective clouds over the TP, and brings environmental liquid particles and warm air mass to the high level, forming a warm region in the environment of lower than 0°C. The distribution of Wb shown in Fig. 9 partly confirms this hypothesis.
|
| Figure 9 Distribution of average updraft at cloud base (Wb; m s–1) |
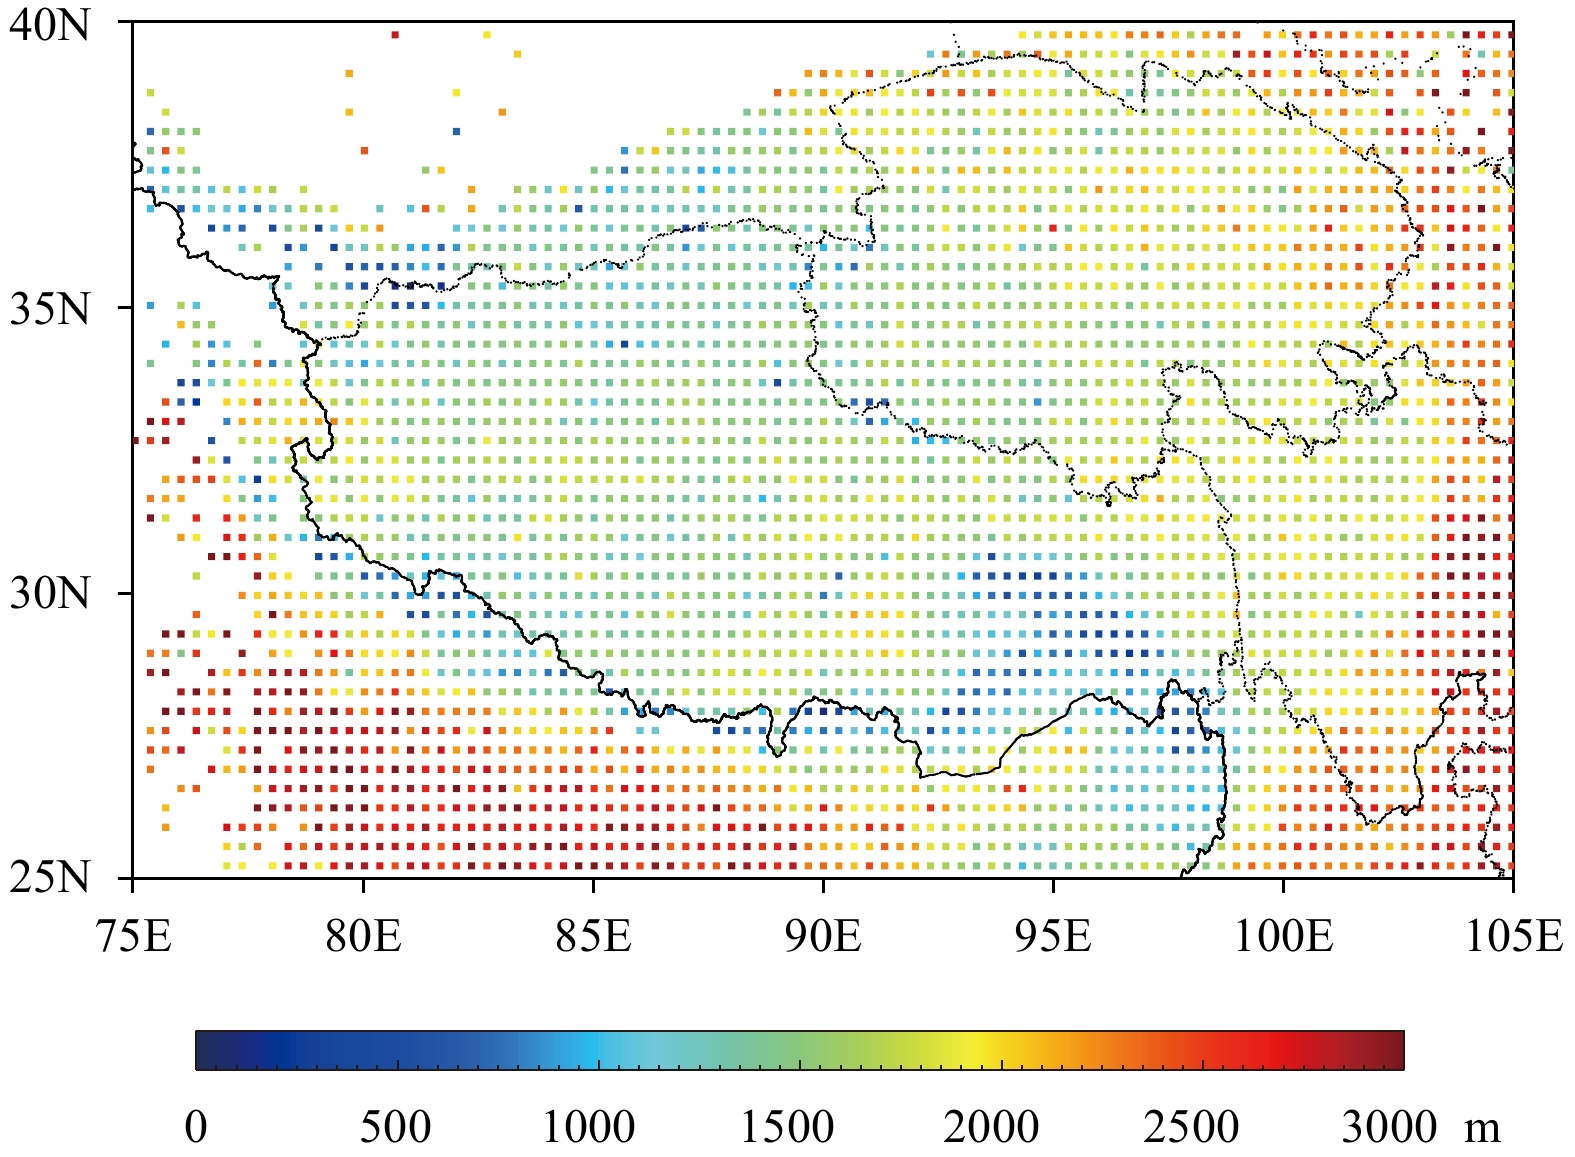
The distribution of precipitation initiation depth (D14) indicates that D14 is about 1500–2000 m over the TP (Fig. 10). It is not easier to form precipitation if D14 is higher than 4000–5000 m (Zhu et al., 2015a) on the plains. D14 is about 500–1000 m over the Yarlung Zangbo River basin and southern Tibet, which is obviously lower than in other areas and equivalent to that over the ocean, indicating that precipitation can easily form in this region. D14 is 1500–2000 m over the Qaidam basin of Qinghai Province. In India, northern Yunnan Province, and Sichuan basin, D14 is higher than 2000 m and distinctly higher than that over the TP. Higher D14 corresponds to greater NCCN (Fig. 7), which reflects the influence of air pollution on cloud and precipitation, and it is more difficult to form precipitation for greater D14.
|
| Figure 10 Distribution of average precipitation initiation depth (D14; m). |
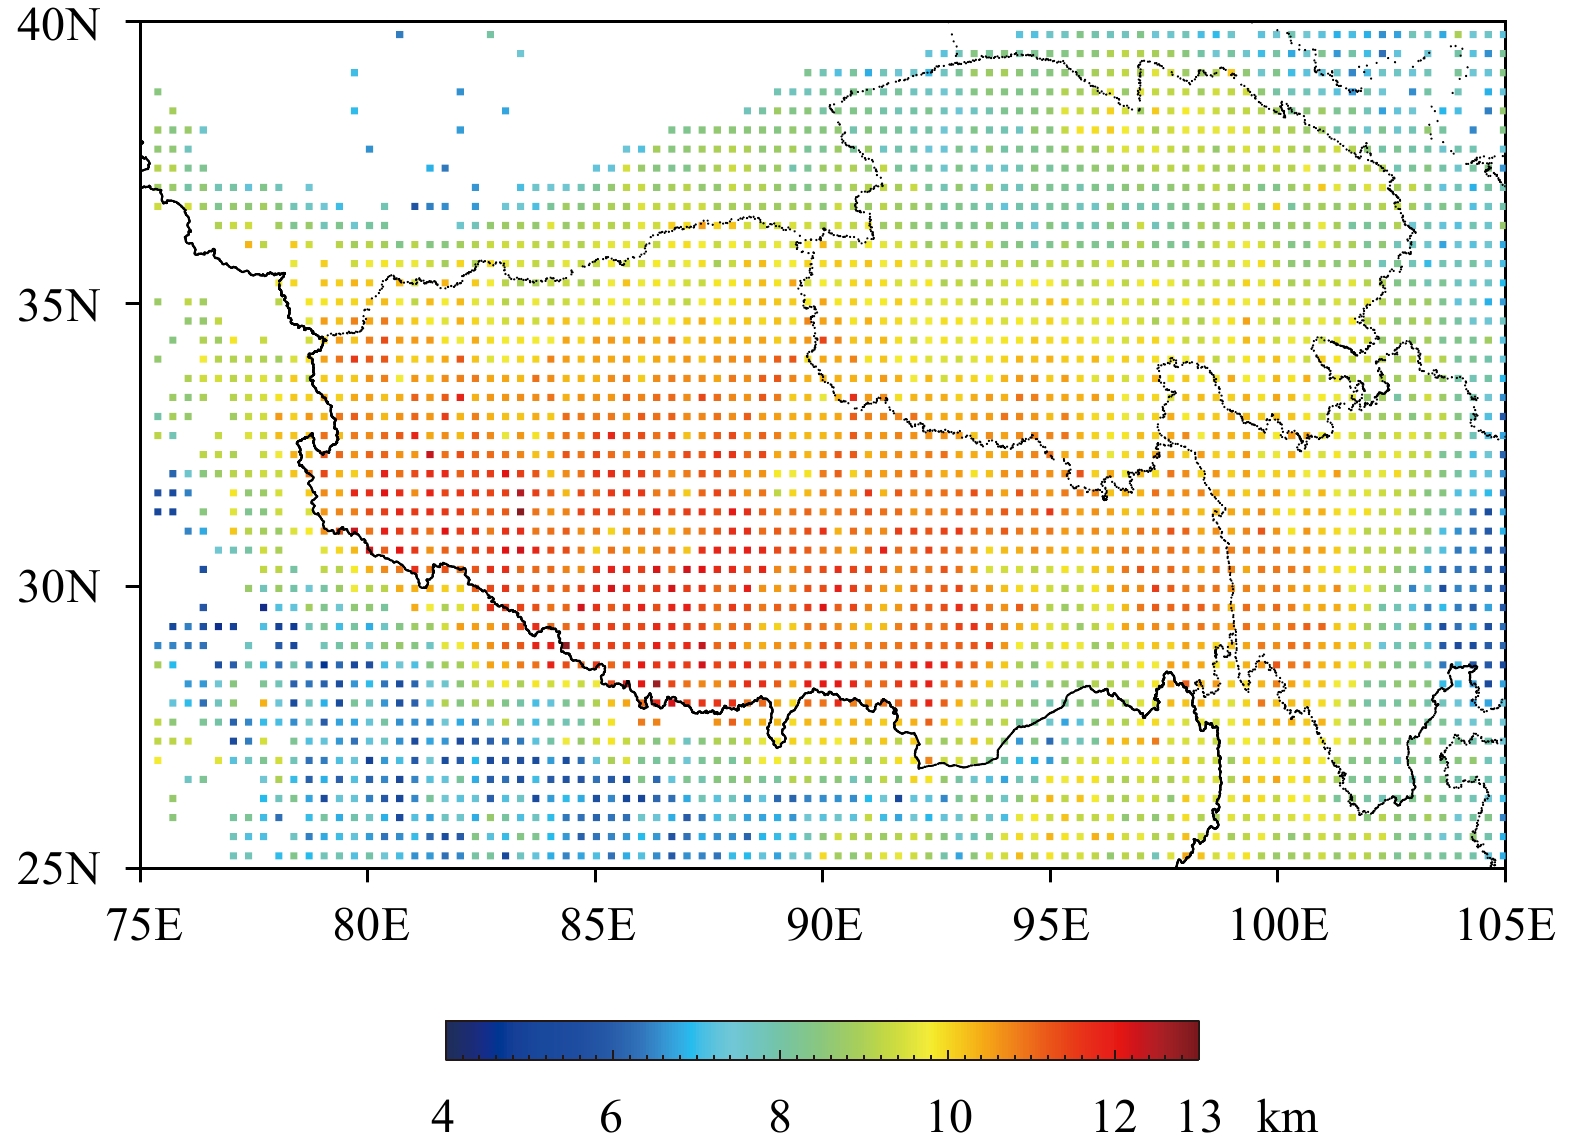
The distribution of mean cloud top altitude (Htop) in Fig. 11 shows that Htop is between 10 and 13 km over the TP. It is 10 km over the Yarlung Zangbo River basin and southern Tibet, slightly lower than that over other areas in the TP. Htop is about 8 km over the Qaidam basin and 6–8 km over India. The 5-yr mean Htop of all retrieval cases is 10.58 km over the site of Naqu. The observed average Htop are respectively 11.41 and 11.62 km by the C-band continuous wave radar and the Ka-band millimeter-wave cloud radar at Naqu in July and August 2014. For the same radar observation period, the Htop calculated by the FY-2E satellite TBB data is only 9.18 km (Chang and Guo, 2016), while the average Htop of 26 cases from VIIRS at Naqu is 11.8 km. Apparently, the Htop of VIIRS is closer to radar observations.
|
| Figure 11 Distribution of average cloud top altitude (Htop; km) |
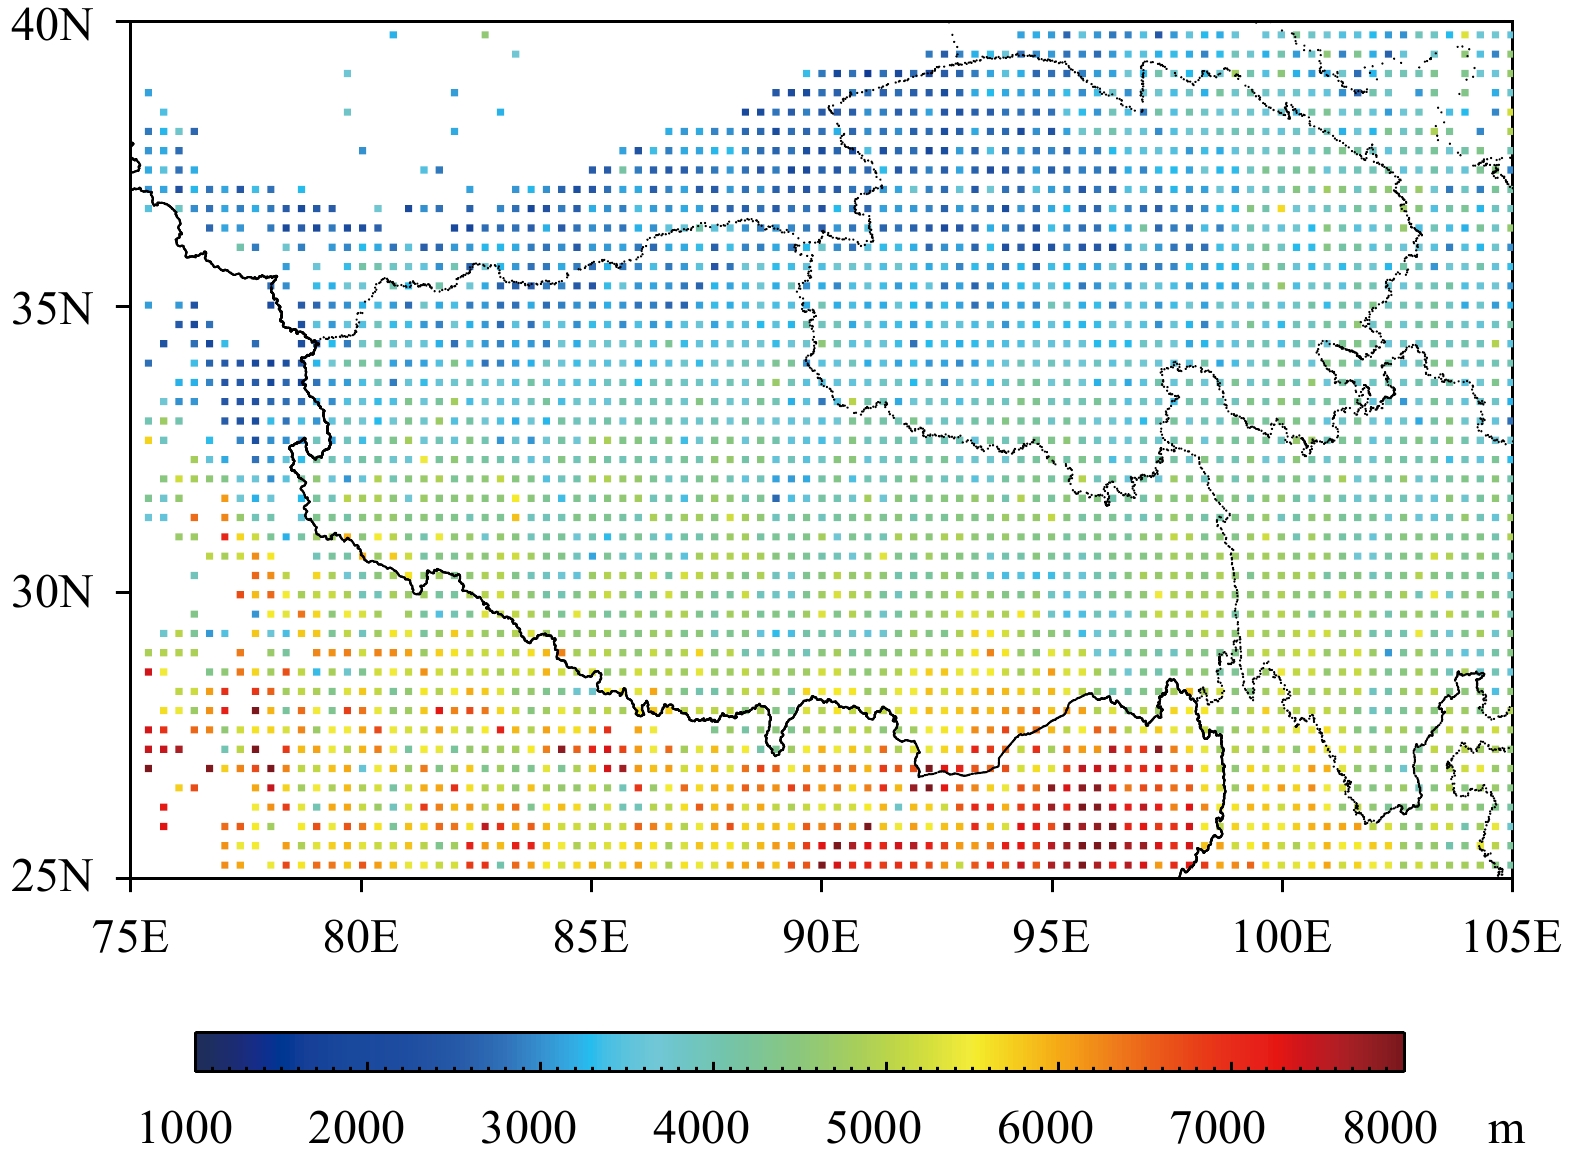
The convective cloud depth (Dcld) gradually decreases from 5000 m in the southern TP to 2500 m in the northern TP (Fig. 12), indicating that convective clouds deve-lop vigorously in the southern TP and weakly in the northern TP. The probability for heavy precipitation and disastrous weather is low due to limited cloud depth and small cloud water content in convective clouds over the TP. On the other hand, the lower precipitation initiation depth makes it easy to form precipitation. Thereby, rainfalls over the TP occur frequently with small amount and intensity, and most of them are showery. Chang and Guo (2016) proposed that the rainfall over the TP was mainly showery precipitation with duration less than one hour, which is much shorter than that over the central and eastern plains of China in the same period. Such kinds of precipitation over the TP are associated with the unique characteristics of cloud base, cloud depth, and precipitation initiation depth.
|
| Figure 12 Average depth between cloud base and cloud top (Dcld; m) |
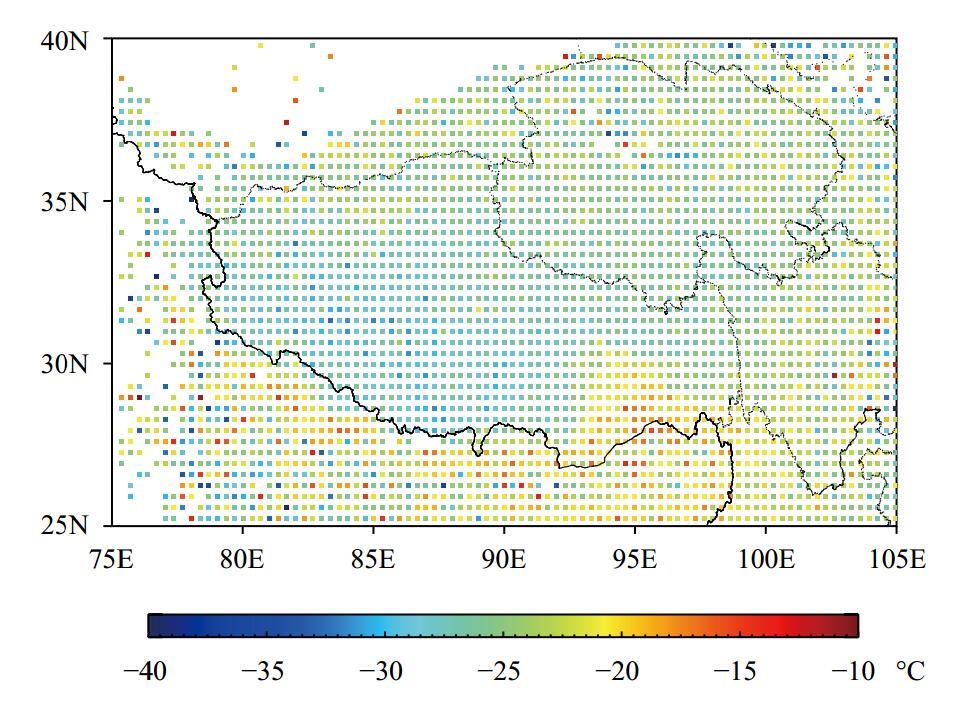
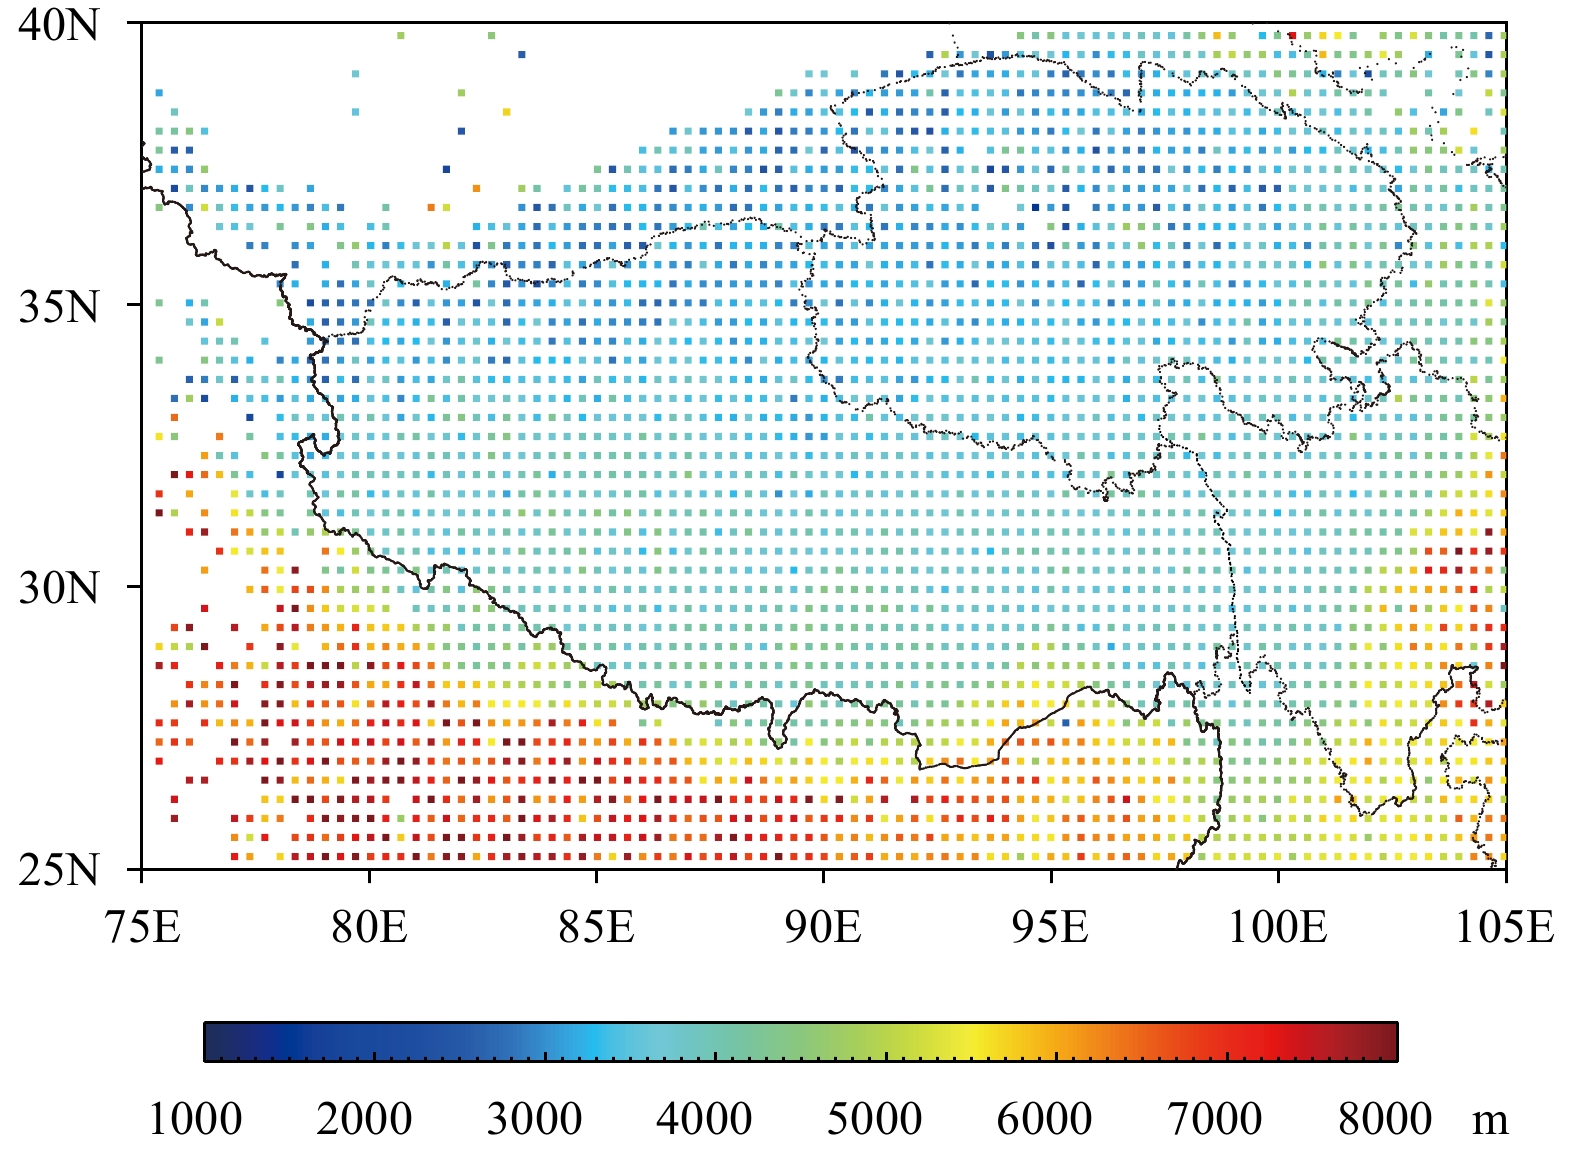
Glaciation temperature (Tg) is the temperature at which almost all cloud particles are glaciated (Rosenfeld and Lensky, 1998; Rosenfeld et al., 2011; Zhu et al., 2015b), and glaciation depth (DTg) refers to the depth between Tb and Tg. Tg is lower than –30°C in central and southern TP, and around –25°C in northern TP and Qinghai Province ( Fig. 13). The latter is possibly due to the ice crystal effect of dust aerosols. The distribution of DTg (Fig. 14) is basically consistent with that of Dcld (Fig. 12). DTg is about 4000 and 2000 m in the southern and northern TP and is larger than 6000 m surrounding the TP, which indicate that convective clouds over the TP are more prone to be glaciated than those over the surrounding areas. Since Tb of TP is about –5°C and ice particles are dominant in convective clouds, as precipitation occurs, the precipitation particles are still in solid state when they fall out of the cloud base. These particles do not completely melt until they reach the ground, and have no time to break. This is the reason why precipitation of TP is characterized by large raindrop size and small number drop concentration. Chen et al. (2013) showed that the raindrop spectral width over the TP is greater than that on the plain area of the same latitude. Chang and Guo (2016) proposed that large raindrops and ice particles frequently occurred over the TP, and the characteristics obtained from VIIRS may explain the physical mechanism behind the above phenomena.
|
| Figure 13 Average glaciation temperature (Tg; °C) |
|
| Figure 14 Average depth between cloud base temperature and glaciation temperature (DTg; m) |
The microphysical properties of convective clouds over the TP in five summers of 2013–17 are retrieved from the high-resolutionSNPP/VIIRS satellite data by using the Automatic Mapping of Convective Clouds (AMCC) Software Package. The following observatio-nal facts and conclusions are concluded.
(1) The cloud base temperatures retrieved from VIIRS are compared with temperatures of the lifting condensation level (LCL) at Naqu meteorological station. They are linearly correlated with correlation coefficient of 0.87 and an STD of 3.0°C, which indicates that AMCC is capable of retrieving Tb and the results are reliable.
(2) The macro- and microphysical properties of convective clouds over the TP are revealed. First, Tb is about –5°C, Hb is 1800–2200 m, and liquid water content is small in the TP clouds. Second, NCCN is 200–400 mg–1 with Smax of 0.7%. With small NCCN and large Smax, the condensation growth of cloud droplet is fast over the TP. Third, D14 is lower, about 1500–2000 and 500–1000 m in the Yarlung Zangbo River basin and southern Tibet, respectively, and the clouds in these areas are prone to precipitating easily. Fourth, Htop is 10–13 km, while Dcld is rather small decreasing from 5000 m in the south to 2500 m in the north. Fifth, Tg is –30°C in the central and southern TP and –25°C in the northern TP, which, in combination with the Tb below 0°C, leads to the domination of ice process in the clouds.
(3) The cloud microphysical properties over the TP determine that the TP precipitation is of high frequency in occurrence, short duration, and small amount, but with large raindrops. In addition, the limited cloud depth and small liquid water content in the cloud make a low probability for heavy precipitation and disastrous weather.
In this paper, the microphysical properties of convective clouds over the TP are investigated based on the macro- and microphysical variables retrieved from the SNPP/VIIRS satellite data. These retrievals not only effectively supplement the insufficient observations over the TP, but also take advantage of multi-channel satellite observations. For this reason, this study is worth of many follow-ups. It is noted that there still exist some deficiencies in the retrievals by the AMCC in the present. First, Hb of satellite retrieval is not evaluated based on ceilometers; instead, TLCL calculated from soundings is approximated as the cloud base height and used for evaluation. According to the parcel theory, the lifting condensation level can be approximated as the cloud base when the convective clouds are formed by sufficient mixing and ascending from the ground. Comparison of Tb from VIIRS and TLCL at Naqu well reflects the above theory. Second, some cloud parameters such as NCCN, D14, and Tg have not been evaluated by airborne or ground-based observations. Third, quality control of the AMCC is still imperfect. In the future, we shall streng-then the field observation, verify the retrieval results with more airborne and/or ground-based observations, and improve the retrieval algorithms and retrieval accuracy step by step, so as to make better use of the advantages of satellite detection.
Acknowledgment. We acknowledge usage of the NOAA CLASS VIIRS L1B data, the NCEP FNL analy-sis data, and the intensive observational data from the TIPEX-III organized by the China Meteorological Administration.
| Andreae, M. O., D. Rosenfeld, P. Artaxo, et al., 2004: Smoking rain clouds over the Amazon. Science, 303, 1337–1342. DOI:10.1126/science.1092779 |
| Braga, R. C., D. Rosenfeld, R. Weigel, et al., 2017: Further evidence for CCN aerosol concentrations determining the height of warm rain and ice initiation in convective clouds over the Amazon basin. Atmos. Chem. Phys., 17, 14433–14456. DOI:10.5194/acp-17-14433-2017 |
| Brenguier, J. L., F. Burnet, and O. Geoffroy, 2011: Cloud optical thickness and liquid water path—does thek coefficient vary with droplet concentration? . Atmos. Chem. Phys., 11, 9771–9786. DOI:10.5194/acp-11-9771-2011 |
| Chang, Y., and X. L. Guo, 2016: Characteristics of convective cloud and precipitation during summer time at Naqu over Tibetan Plateau. Chinese Sci. Bull., 61, 1706–1720. DOI:10.1360/N972015-01292 |
| Chen, B. J., J. Yang, and J. P. Pu, 2013: Statistical characteristics of raindrop size distribution in the Meiyu season observed in eastern China. J. Meteor. Soc. Japan, 91, 215–227. DOI:10.2151/jmsj.2013-208 |
| Dai, J., X. Yu, G. H. Liu, et al., 2010: Analyses of satellite retrieved microphysical properties of a rainstorm in the northern part of Shaanxi. Acta Meteor. Sinica, 68, 387–397. DOI:10.11676/qxxb2010.038 |
| Freud, E., D. Rosenfeld, and J. R. Kulkarni, 2011: Resolving both entrainment-mixing and number of activated CCN in deep convective clouds. Atmos. Chem. Phys., 11, 12,887–12,900. DOI:10.5194/acp-11-12887-2011 |
| Freud, E., J. StrÖM, D. Rosenfeld, et al., 2008: Anthropogenic aerosol effects on convective cloud microphysical properties in southern Sweden. Tellus. B, 60, 286–297. DOI:10.1111/j.1600-0889.2007.00337.x |
| Fu, Y. F., X. Pan, G. S. Liu, et al., 2016: Characteristics of precipitation based on cloud brightness temperatures and storm tops in summer over the Tibetan Plateau. Chinese J. Atmos. Sci., 40, 102–120. DOI:10.3878/j.issn.1006-9895.1507.15165 |
| Hillger, D., T. Kopp, T. Lee, et al., 2013: First-light imagery from Suomi NPP VIIRS. Bull. Amer. Meteor. Soc., 94, 1019–1029. DOI:10.1175/bams-d-12-00097.1 |
| Huang, G., S. R. Li, Deligeer, et al., 2002: Observational analysis of content of condensation nuclei in the atmosphere in the upper reaches of Yellow River. Meteor. Mon., 28, 45–49. |
| Lensky, I. M., and D. Rosenfeld, 1997: Estimation of precipitation area and rain intensity based on the microphysical properties retrieved from NOAA AVHRR data. J. Appl. Meteorol., 36, 234–242. DOI:10.1175/1520-0450(1997)036<0234:EOPAAR>2.0.CO;2 |
| Liu, G. H., X. Yu, C. X. Shi, et al., 2011a: Comparisons of microphysical property of cloud retrieved from FY-3A/VIRR and TERRA/MODIS . Plateau Meteor, 30, 461–470. |
| Liu, G. H., X. Yu, J. Dai, et al., 2011b: A case study of the conditions for topographic cloud seeding based on the retrieval of satellite measurements. Acta Meteor. Sinica, 69, 363–369. DOI:10.11676/qxxb2011.031 |
| Liu, J. J., and B. D. Chen, 2017: Cloud occurrence frequency and structure over the Qinghai–Tibetan Plateau from CloudSat observation. Plateau Meteor., 36, 632–642. |
| Liu, L. P., J. F. Zheng, Z. Ruan, et al., 2015: Comprehensive radar observations of clouds and precipitation over the Tibetan Plateau and preliminary analysis of cloud properties. J. Meteor. Res., 29, 546–561. DOI:10.1007/s13351-015-4208-6 |
| Merk, D., H. Deneke, B. Pospichal, et al., 2016: Investigation of the adiabatic assumption for estimating cloud micro- and macrophysical properties from satellite and ground observations. Atmos. Chem. Phys., 16, 933–952. DOI:10.5194/acp-16-933-2016 |
| Miller, D. J., Z. B. Zhang, A. S. Ackerman, et al., 2016: The impact of cloud vertical profile on liquid water path retrieval based on the bispectral method: A theoretical study based on large-eddy simulations of shallow marine boundary layer clouds. J. Geophys. Res. Atmos., 121, 4122–4141. DOI:10.1002/2015JD024322 |
| Min, Q., E. Joseph, Y. Lin, et al., 2012: Comparison of MODIS cloud microphysical properties with in-situ measurements over the Southeast Pacific. Atmos. Chem. Phys., 12, 11261–11273. DOI:10.5194/acp-12-11261-2012 |
| Nakajima, T., and M. D. King, 1990: Determination of the optical thickness and effective particle radius of clouds from reflected solar radiation measurements. Part I: Theory. J. Atmos. Sci., 47, 1878–1893. DOI:10.1175/1520-0469(1990)047<1878:Dotota>2.0.Co;2 |
| Pinsky, M., A. Khain, I. Mazin, et al., 2012: Analytical estimation of droplet concentration at cloud base. J. Geophys. Res. Atmos., 117, D18211. DOI:10.1029/2012JD017753 |
| Prabha, T. V., A. Khain, R. S. Maheshkumar, et al., 2011: Microphysics of premonsoon and monsoon clouds as seen from in situ measurements during the cloud aerosol interaction and precipitation enhancement experiment (CAIPEEX). J. Atmos. Sci., 68, 1882–1901. DOI:10.1175/2011jas3707.1 |
| Rosenfeld, D., and I. M. Lensky, 1998: Satellite-based insights into precipitation formation processes in continental and maritime convective clouds. Bull. Amer. Meteor. Soc., 79, 2457–2476. DOI:10.1175/1520-0477(1998)079<2457:sbiipf>2.0.co;2 |
| Rosenfeld, D., and W. L. Woodley, 2000: Deep convective clouds with sustained supercooled liquid water down to –37.5°C. Nature, 405, 440–442. DOI:10.1038/35013030 |
| Rosenfeld, D., W. L. Woodley, A. Lerner, et al., 2008: Satellite detection of severe convective storms by their retrieved vertical profiles of cloud particle effective radius and thermodynamic phase. J. Geophys. Res. Atmos., 113, D04208. DOI:10.1029/2007JD008600 |
| Rosenfeld, D., X. Yu, G. H. Liu, et al., 2011: Glaciation temperatures of convective clouds ingesting desert dust, air pollution and smoke from forest fires. Geophys. Res. Lett., 38, L21804. DOI:10.1029/2011gl049423 |
| Rosenfeld, D., B. Fischman, Y. T. Zheng, et al., 2014a: Combined satellite and radar retrievals of drop concentration and CCN at convective cloud base. Geophys. Res. Lett., 41, 3259–3265. DOI:10.1002/2014gl059453 |
| Rosenfeld, D., G. H. Liu, X. Yu, et al., 2014b: High resolution (375 m) cloud microstructure as seen from the NPP/VIIRS satellite imager. Atmos. Chem. Phys., 14, 2479–2496. DOI:10.5194/acp-14-2479-2014 |
| Rosenfeld, D., Y. T. Zheng, E. Hashimshoni, et al., 2016: Satellite retrieval of cloud condensation nuclei concentrations by using clouds as CCN chambers. Proc. Natl. Acad. Sci. USA, 113, 5828–5834. DOI:10.1073/pnas.1514044113 |
| Wallace, J. M., and P. V. Hobbs, 2006: Chapter 6: Cloud Microphysics. Atmospheric Science: An Introductory Survey (Second Edition), J. M. Wallace, and P. V. Hobbs, Eds., Academic Press, San Diego, 209–269, 483 pp, doi: 10.1016/B978-0-12-732951-2.50011-9. |
| Wan, B. C., Z. Q. Gao, F. Chen, et al., 2017: Impact of Tibetan Plateau surface heating on persistent extreme precipitation events in southeastern China. Mon. Wea. Rev., 145, 3485–3505. DOI:10.1175/mwr-d-17-0061.1 |
| Wang, B. J., Y. X. Huang, D. Wei, et al., 2017: Structure analysis of heavy precipitation over the eastern slope of the Tibetan Plateau based on TRMM data. Acta Meteor. Sinica, 75, 966–980. DOI:10.11676/qxxb2017.062 |
| Wang, H., H. Lei, Deligeer, et al., 2002: A numerical simulation of characteristics of convective cloud at the upper reaches of the Yellow River. Climatic Environ. Res., 7, 397–408. |
| Wang, H., Y. L. Luo, and R. H. Zhang, 2011: Analyzing seasonal variation of clouds over the Asian monsoon regions and the Tibetan Plateau region using CloudSat/CALIPSO data. Chinese J. Atmos. Sci., 35, 1117–1131. DOI:10.3878/j.issn.1006-9895.2011.06.11 |
| Wang, L. J., Y. Yin, Z. Y. Yao, et al., 2013: Microphysical responses to catalysis during a stratocumulus aircraft seeding experiment over the Sanjiangyuan region of China. J. Meteor. Res., 27, 849–867. DOI:10.1007/s13351-013-0609-6 |
| Wu, C., L. P. Liu, and X. C. Zhai, 2017: The comparison of cloud base observations with Ka-band solid-state transmitter-based millimeter wave cloud radar and ceilometer in summer over Tibetan Plateau. Chinese J. Atmos. Sci., 41, 659–672. DOI:10.3878/j.issn.1006-9895.1701.16170 |
| Xia, X., R. C. Ren, G. X. Wu, et al., 2016: An analysis on the spatiotemporal variations and dynamic effects of the tropopause and the related stratosphere–troposhpere coupling surrounding the Tibetan Plateau area. Acta Meteor. Sinica, 74, 525–541. DOI:10.11676/qxxb2016.036 |
| Xu, X. D., and L. X. Chen, 2006: Advances of the study from Tibetan Plateau experiment on atmospheric sciences. J. Appl. Meteor. Sci., 17, 756–772. |
| Xu, X. D., T. L. Zhao, X. H. Shi, et al., 2015: A study of the role of the Tibetan Plateau’s thermal forcing in modulating rainband and moisture transport in eastern China. Acta Meteor. Sinica, 73, 20–35. DOI:10.11676/qxxb2014.051 |
| Yue, Z. G., D. Rosenfeld, G. H. Liu, et al., 2019: Automated mapping of convective clouds (AMCC) thermodynamical, microphysical and CCN properties from SNPP/VIIRS satellite data . J. Appl. Meteor. Climatol.,, 58, 887–902. DOI:10.1175/jamc-d-18-0144.1 |
| Zhang, H. F., S. G. Guo, Y. J. Zhang, et al., 2003: Distribution characteristics of severe convective thunderstorm clouds over Qinghai–Xizang Plateau. Plateau Meteor., 22, 558–564. |
| Zhang, Q., X. Q. Song, J. T. Liu, et al., 2016: Observation of cloud base height with ceilometer in Tibetan Planteau during summer. J. Optoelectronics Laser, 27, 406–412. DOI:10.16136/j.joel.2016.04.0753 |
| Zhang, X., K. Q. Duan, and P. H. Shi, 2015: Cloud vertical profiles from CloudSat data over the eastern Tibetan Plateau during summer. Chinese J. Atmos. Sci., 39, 1073–1080. DOI:10.3878/j.issn.1006-9895.1502.14196 |
| Zheng, Y. T., and D. Rosenfeld, 2015: Linear relation between convective cloud base height and updrafts and application to satellite retrievals. Geophys. Res. Lett., 42, 6485–6491. DOI:10.1002/2015gl064809 |
| Zheng, Y. T., D. Rosenfeld, and Z. Q. Li, 2015: Satellite inference of thermals and cloud-base updraft speeds based on retrieved surface and cloud-base temperatures. J. Atmos. Sci., 72, 2411–2428. DOI:10.1175/jas-d-14-0283.1 |
| Zhu, Y. N., D. Rosenfeld, X. Yu, et al., 2014: Satellite retrieval of convective cloud base temperature based on the NPP/VIIRS Imager. Geophys. Res. Lett., 41, 1308–1313. DOI:10.1002/2013gl058970 |
| Zhu, Y. N., D. Rosenfeld, X. Yu, et al., 2015a: Separating aerosol microphysical effects and satellite measurement artifacts of the relationships between warm rain onset height and aerosol optical depth. J. Geophys. Res. Atmos., 120, 7726–7736. DOI:10.1002/2015jd023547 |
| Zhu, Y. N., X. Yu, X. H. Xu, et al., 2015b: Glaciation and ice multiplication of convective clouds and their dependence on aerosol investigated by satellites. Plateau Meteor., 34, 1758–1764. |
 2019, Vol. 33


