The Chinese Meteorological Society
Article Information
- DING, Shouguo, and Fuzhong WENG, 2019.
- Influences of Physical Processes and Parameters on Simulations of TOA Radiance at UV Wavelengths: Implications for Satellite UV Instrument Validation. 2019.
- J. Meteor. Res., 33(2): 264-275
- http://dx.doi.org/10.1007/s13351-019-8137-7
Article History
- Received August 25, 2018
- in final form February 10, 2019
2. Laboratory of Environmental Model and Data Optima, Laurel, MD 20707, USA
Ultraviolet (UV) radiation from the sun plays a very important role in life on earth and greatly influences the environment and climate (van der Leun and de Gruijl, 1993; Cockell and Blaustein, 2013). Its wavelength covers 100–400 nm—a part of the solar spectrum. The UV spectrum is divided into three bands: UVA from 315 to 400 nm; UVB from 280 to 315 nm; and UVC from 100 to 280 nm (ICNIRP, 2004). The UVC is the most deadly solar rays as it has a high frequency radiation and emits at the highest energy levels. Fortunately, it is completely absorbed by ozone, oxygen, and water vapor in the upper atmosphere before reaching the earth’s surface. The UVB can affect the surface of the skin and is a primary cause of sunburn. It is also associated with the beneficial production of vitamin D. The UVB can be strongly absorbed by ozone and a small part can reach the surface. The UVA band is partially absorbed by ozone and can penetrate deeply into the skin and heavily contribute to premature aging.
During the last four decades, UV radiation has been observed from various satellite instruments for the purposes of deriving the total column ozone and the ozone profile (McPeters et al., 1994). Early UV radiation measurements were made by the Backscatter Ultraviolet (BUV) sensor on board the Nimbus 4, which was launched in 1970 (Heath et al., 1975). The Total Ozone Mapping Spectrometer (TOMS) provided the longest UV observations from 1978 to 1993. The TOMS instrument also flew on the Russian Meteor 3, on the Japanese ADEOS, and on the NASA’s Earth Probe satellite. Most recently, hyper-spectral sensors including those for UV were developed for satellite measurement, including the Global Ozone Monitoring Experiment (GOME, 1995–2003) (Burrows et al., 1999) on ERS-2, the SCanning Imaging Absorption spectroMeter for Atmospheric CHartographY (SCIAMACHY, 2002–12) (Bovensmann et al., 1999) on ENVISAT, the Ozone Monitoring Instrument (OMI, 2004–present) (Levelt et al., 2006) on Aura, GOME-2 (Callies et al., 2000; Munro et al., 2006) on METOP-A and METOP-B, and the Ozone Mapping and Profiler Suite (OMPS) on board the Suomi National Polarorbiting Partnership (SNPP) and NOAA-20 operatio-nal satellite.
To derive surface and atmospheric constituents such as ozone and other trace gases, aerosols, and clouds from satellite hyper-spectral UV measurements, an appropriate radiative transfer model is often needed for physical retrieval algorithms. Also, radiative transfer simulations are often used to verify the on-orbit performance of UV instruments. It is important to establish a rigorous procedure for UV radiative transfer simulations. In the UV and visible region, most of the satellite instruments (e.g., GOME and OMPS) measure the intensity of light. To compare with satellite observations, the forward model only needs to simulate the backscattered sunlight. Therefore, when the incident light is unpolarized, a scalar radiative transfer model is used and the polarization is neglected (Rozanov et al., 1997; Landgraf et al., 2001; Spurr et al., 2001). Other early efforts in using scalar radiative transfer model included study of the impact of ozone and cloud on UV radiation (Tsay and Stamnes, 1992), and comparison of measured UV spectra with model simulations (Zeng et al., 1994). The use of the scalar approximation of radiative transfer can greatly simplify the calculations, and the corresponding computation cost is much less expensive than the vector approach. However, although the incident sunlight is unpolarized, light reflected from the earth’s atmosphere is polarized due to scattering by air molecules and aerosols/clouds. Several previous studies have investigated the errors due to the sca-lar approximation. Chandrasekhar (1960) pointed out that the error of a radiative transfer model that neglects polarization can be much larger in the case of Rayleigh scattering. Adams and Kattawar (1970) showed that the relative errors of the scalar approximation can be up to 11.7% for Rayleigh scattering atmospheres. Mishchenko et al. (1994) systematically investigated the errors caused by the neglect of polarization in computation of the intensity of light reflected by Rayleigh atmosphere and offered a theoretical explanation of the large differences between vector and scalar approximation in the case of Rayleigh scatting. Hasekamp et al. (2002) also pointed out that satellite measurements are sensitive to the state of polarization of the observed light in UV and suggested that vector radiative transfer model be employed for ozone profile retrieval. Several radiative transfer models designed for the ultraviolet spectrum are available, including the TOMRAD initially developed for TOMS (Eck et al., 1995), Santa Barbara Discrete Ordinate Atmospheric Radiative Transfer (SBDART; Ricchiazzi et al., 1998) model, GOMETRAN for GOME (Rozanov et al., 1997), SCIATRAN for SCHIAMACHY (Rozanov et al., 2014), and the Library for Radiative Transfer (libRadtran; Emde et al., 2016). TOMRAD is a vector radiative transfer model and can only be used to calculate the Rayleigh scattering and gases absorption in the ultraviolet region for clear sky. But it cannot treat multiple scattering by cloud and aerosol. SBDART is a software tool that computes scalar radiation field in plane-parallel in clear and cloudy conditions within the earth’s atmosphere and at the surface in the ultraviolet, visible, and infrared radiation fields. It cannot be applied to the calculation of polarization of light. For the most recent versions of SCIATRAN and libRadtran, both include polarization and are capability of solving the vector radiative transfer equation in the atmosphere.
The objective of this study is to investigate the effects of different factors, including scalar approximation of radiative transfer model, gaseous absorption, Rayleigh scattering, surface reflectance, and a band center wave-length shift of sensor, on the radiative transfer simulation of hyper-spectral ultraviolet satellite observation. All the forward simulations are based on a state-of-the-art vector radiative transfer model, the Unified Linearized Vector Radiative Transfer Model (UNL-VRTM) (Wang et al., 2014). To pursuit the objective above, a benchmark calculation for Rayleigh scattering atmosphere is carried out and compared with other existing research to validate the UNL-VRTM model. To investigate the sources of bias between the model simulations and OMPS measurements, the ozone profiles from well collocated Microwave Limb Sounder (MLS) sensor flying on Aura are used as inputs to the radiative transfer mo-del. The comparisons between model simulation and OMPS measurement are performed for aerosol-free clear sky. This study will eventually benefit the evaluation of the on-orbit calibration accuracy of OMPS data via forward radiative transfer simulations.
2 Description of UNL-VRTM and its benchmark 2.1 The UNL-VRTMThe UNL-VRTM is a comprehensive software package for the simulation of atmospheric remote sensing observations and for the inversion of gas, aerosol, cloud, and/or surface properties from these observations. The forward radiative transfer model integrates five modules for the calculation of aerosol single scattering, gas absorption, and radiative transfer. These five modules include a vector linearized discrete ordinate radiative transfer (VLIDORT) model (Spurr, 2006), a linearized Mie (LMIE) and Tmatrix (LTMATRIX) scattering code (Spurr et al., 2012), a surface bidirectional reflectance distribution function (BRDF) module, and a module for line-by-line calculation. Among them, VLIDORT is linearized vector radiative transfer solver and is a pure scattering model, which could be used for multiple scattering in a stratified multi-layer atmosphere. The basic optical property inputs are the layer extinction optical depths, bulk single scattering reflectance, and scattering matrix expansion coefficients, as well as the surface reflectance. The outputs include not only the Stokes vector (I, Q, U, V), but also their sensitivities (Jacobians) with respect to physical and optical parameters of aerosol and/or cloud. Further details about the UNL-VRTM model are provided in Wang et al. (2014).
2.2 Rayleigh scattering benchmark results for UNL-VRTMAlthough Rayleigh scattering is the simplest optical behavior of gaseous molecules, it is an important process affecting the transmission of sunlight through the atmosphere. This is especially true in the ultraviolet region, since the amount of light scattered at shorter wavelengths is much greater than that at longer wavelengths. In most standard textbooks, Rayleigh scattering is assumed to be isotropic. However, in real atmosphere, most molecules exhibit some anisotropy. The anisotropy lowers the degree of polarization at all scattering angles (Hansen and Travis, 1974). The depolarization ratio is defined as the ratio of the horizontally polarized intensity to the verti-cal polarized intensity at scattering angle Θ = 90°. The studies of Coulson (1988) and Wang et al. (2014) show that the anisotropy in Rayleigh scattering reduces the peak degree of linear polarization (DOLP) by 5% at the wavelength of 0.7 μm, and an increase of surface reflectance from 0 to 0.25 can decrease the peak DOLP by 10%. In the UNL-VRTM, the Rayleigh scattering opti-cal depth and depolarization ratio are calculated accurately from a set of equations using all the latest values of the physical constants recommended by Bodhaine et al. (1999). The wavelength-dependent Rayleigh cross section is computed as a function of concentration of N2, O2, H2O, and CO2. The phase matrix of Rayleigh scattering used in the UNL-VRTM solver follows Hansen and Travis’s theory (1974).
To validate the calculation of the Stokes parameters for Rayleigh scattering in the UNL-VRTM, we carry out a comparison with the results from Kokhanovsky et al. (2010). In their simulations, a Rayleigh scattering atmosphere without gaseous absorption is assumed. The opti-cal thickness is 0.3262. The cosine of the solar zenith angle, μ0 = 0.5, and relative azimuth angles are 0°, 90°, and 180°. Six view zenith angles, 0°, 20°, 40°, 60°, 80°, and 89° are selected. The surface reflectance is black. Figure 1 shows the comparisons of three normalized Stokes parameters In, Qn, and Un calculated from the UNL-VRTM and those benchmark results. Note that in keeping up with Kokhanovsky et al. (2010), the normalized Stokes parameters, In, Qn, and Un, are defined as

|
| Figure 1 Benchmark calculations of the three Stokes parameters I, Q, and U for radiative transfer in a Rayleigh scattering atmosphere, from UNL-VRTM (x-axis) in comparsion with those from Kokhanovsky et al. (2010) (y-axis). |
Quantitatively, the maximum relative differences of the Stokes-vector I, Q, and U components between UNL-VRTM outputs and their counterparts found in Kokhanovsky et al. (2010) are about 0.16%, 0.15%, and 0.13%, respectively. Since the backscattering of sunlight by natural surfaces and atmosphere scattering gives rise to a very weak elliptic polarization (Coulson, 1988), V is negligibly small compared to the other three parameters. Another set of Rayleigh scattering benchmark results from Coulson et al. (1960) were re-calculated by Wang et al. (2014) using UNL-VRTM and the same work have also been carried out by Spurr (2006) in VLIDORT model.
3 Physical process and parameters influencing simulations of TOA radiance at UV wavelengths 3.1 Scalar approximationIt is known that the complete information about the state of polarization of light at the certain wavelength can be described as a four-component Stokes vector, I = [I, Q, U, V], (Chandrasekhar, 1960). The Stokes component, I, represents the total intensity, Q and U the linear polarization, and V the circular polarization of the light beam. Except a limited number of Polarization Measuring De-vices (PMDs) on GOME, SCIAMACHY, and GOME-2, which provide broadband polarization information for the purpose of polarization correction (Hasekamp et al., 2002), most of the satellite-based high-spectral-resolution UV remote sensors such as GOME and OMPS only measure the first Stokes component.
To display the errors induced by neglecting the polarization in the UV radiance caculation under clear-sky conditions, we calculate the TOA normalized radiance by using both the vector model and scalar model of the UNL-VRTM for two different solar/viewing geometries. The midlatitude summer atmospheric profile is assumed. Figure 2 compares the TOA normalized radiances calculated from vector model and scalar model. In this case, the scalar approximation of radiative transfer model in UV region can overestimate the TOA normalized radiance by up to 3% at the scattering angle of Θ = 120° (so-lar zenith angle, viewing zenith angle, and relative azimuth angle are 30°, 30°, and 0°, respectively); and, by more than 8.4% at the scattering angle of Θ = 90° (solar zenith angle, viewing zenith angle, and relative azimuth angle are 60°, 30°, and 0°, respectively). The reason is that the maximum value of degrees of linear polarization of Rayleigh scattering is at the scattering angles near 90° (Wang et al., 2014). The polarization at the scattering angle near 90° is much stronger than at any other scattering angles. Just as Mishchenko et al. (1994) pointed out, the errors of scalar approximation in the case of Rayleigh scattering are especially significant when the scattering angle is equal or close to 90°. The results clearly manifest the importance of using a vector radiative transfer model for the radiance calculation in UV region.

|
| Figure 2 (a) Comparison of TOA normalized radiances calculated from the vector model and scalar approximation and (b) their relative differences. The calculations are for solar zenith angles (SZA) 30° and 60°. The satellite viewing angle is assumed to be 30° and the relative azimuth angle is 0°. See details in the text. |
To avoid very complicated calculations of electronic transitions, numerous measurements of the absorption cross-sections of gases in the UV and visible regions have been performed in laboratory experiments. Normally, the measurement temperatures are selected to be those most useful in atmospheric applications and those values at –70, –55, –45, –30, 0, and +25°C are selected in the work of Bass and Paur (1985). In order to extend the use of these data, a set of quadratic coefficients for the following equation can be applied to calculate the ozone absorption coefficient α at an arbitrary temperature t, in Centigrade, at each wavelength,
| $\alpha = {C_0} + {C_1}t + {C_2}{t^2},$ | (1) |
where t is the temperature in Centigrade, C0 is the ozone absorption coefficient at 0°C, C1 is the linear temperature correction coefficient, and C2 is quadratic temperature correction coefficient. The quadratic coefficients are calculated from all the available spectra.
In UNL-VRTM, the ozone absorption cross-section data with a spectral resolution of 0.01 nm are from the Smithsonian Astrophysical Observatory (SAO), and the absorption cross-sections of other gases and spectrosco-pic line parameters are from the HITRAN2012 database (Orphal and Chance, 2003; Rothman et al., 2013; Wang et al., 2014). It can be seen clearly from Fig. 3 that the ozone cross-sections in 300–380-nm region (Huggins bands) consist of a lot of individual extending peaks and show a strong temperature dependence.

|
| Figure 3 The ozone cross-section in the 300–380-nm region. |
The main absorber of UV radiation in the atmosphere is ozone. Other trace gases such as NO2, SO2, and O2 also make contributions to the UV absorption. Figure 4 shows the absorption optical depths of different gases in UV region. The calculation is carried out by using UNL-VRTM for the midlatitude summer atmospheric profile (McClatchey et al., 1972). It is shown that the ozone absorption optical depth is dominant for wavelengths less than 340 nm, and the absorption of NO2 and O2 become much stronger than that of ozone for wavelengths larger than 340 nm, although the value of total optical depth is small.

|
| Figure 4 The absorption optical depth of different gases in UV region. The calculation is for the midlatitude summer atmospheric profile. |
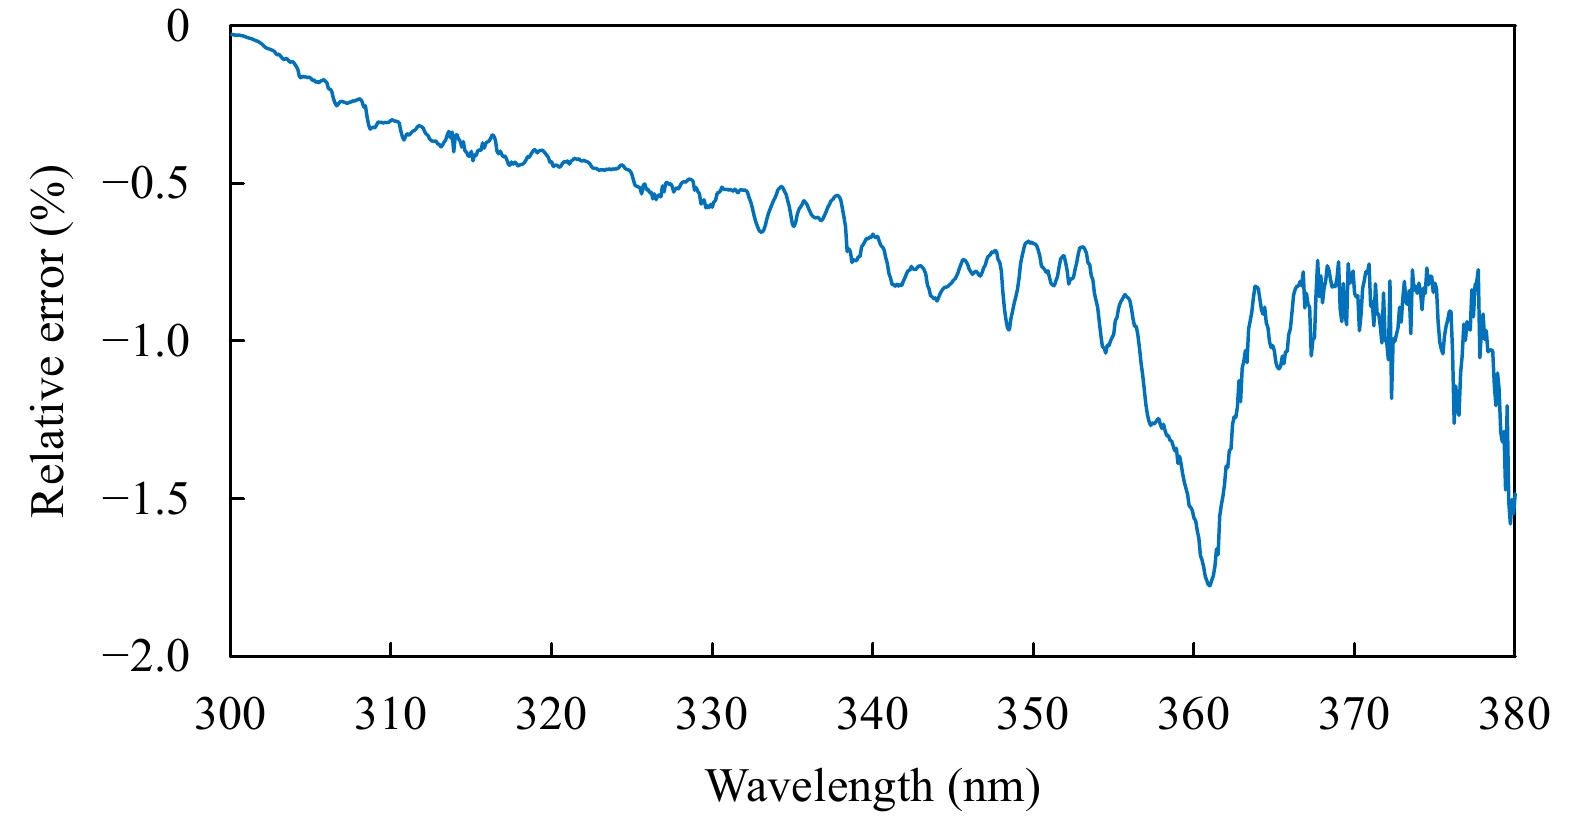
If only ozone is considered in the simulation of radiative transfer model (e.g., TOMRAD), the total absorption optical depth can be underestimated. To evaluate the bias introduced by ignoring the effects of other absorption gases, two tests are carried out by using UNL-VRTM. In the first test, only ozone is considered and in the second one, ozone and other absorption gases, such as NO2, SO2, O2, HCHO, and so on as labeled in Fig. 4 are all considered. Figure 5 shows the relative difference of TOA reflected radiance calculated for both tests. It is clear to see that the simulated TOA reflected radiance is overestimated, especially for wavelengths larger than 340 nm if only ozone is considered in the simulation of the radiative transfer model.
|
| Figure 5 The relative difference of TOA normalized radiance between two tests. One test is only ozone considered and the other is ozone and other trace gases considered together, in UNL-VRTM. |
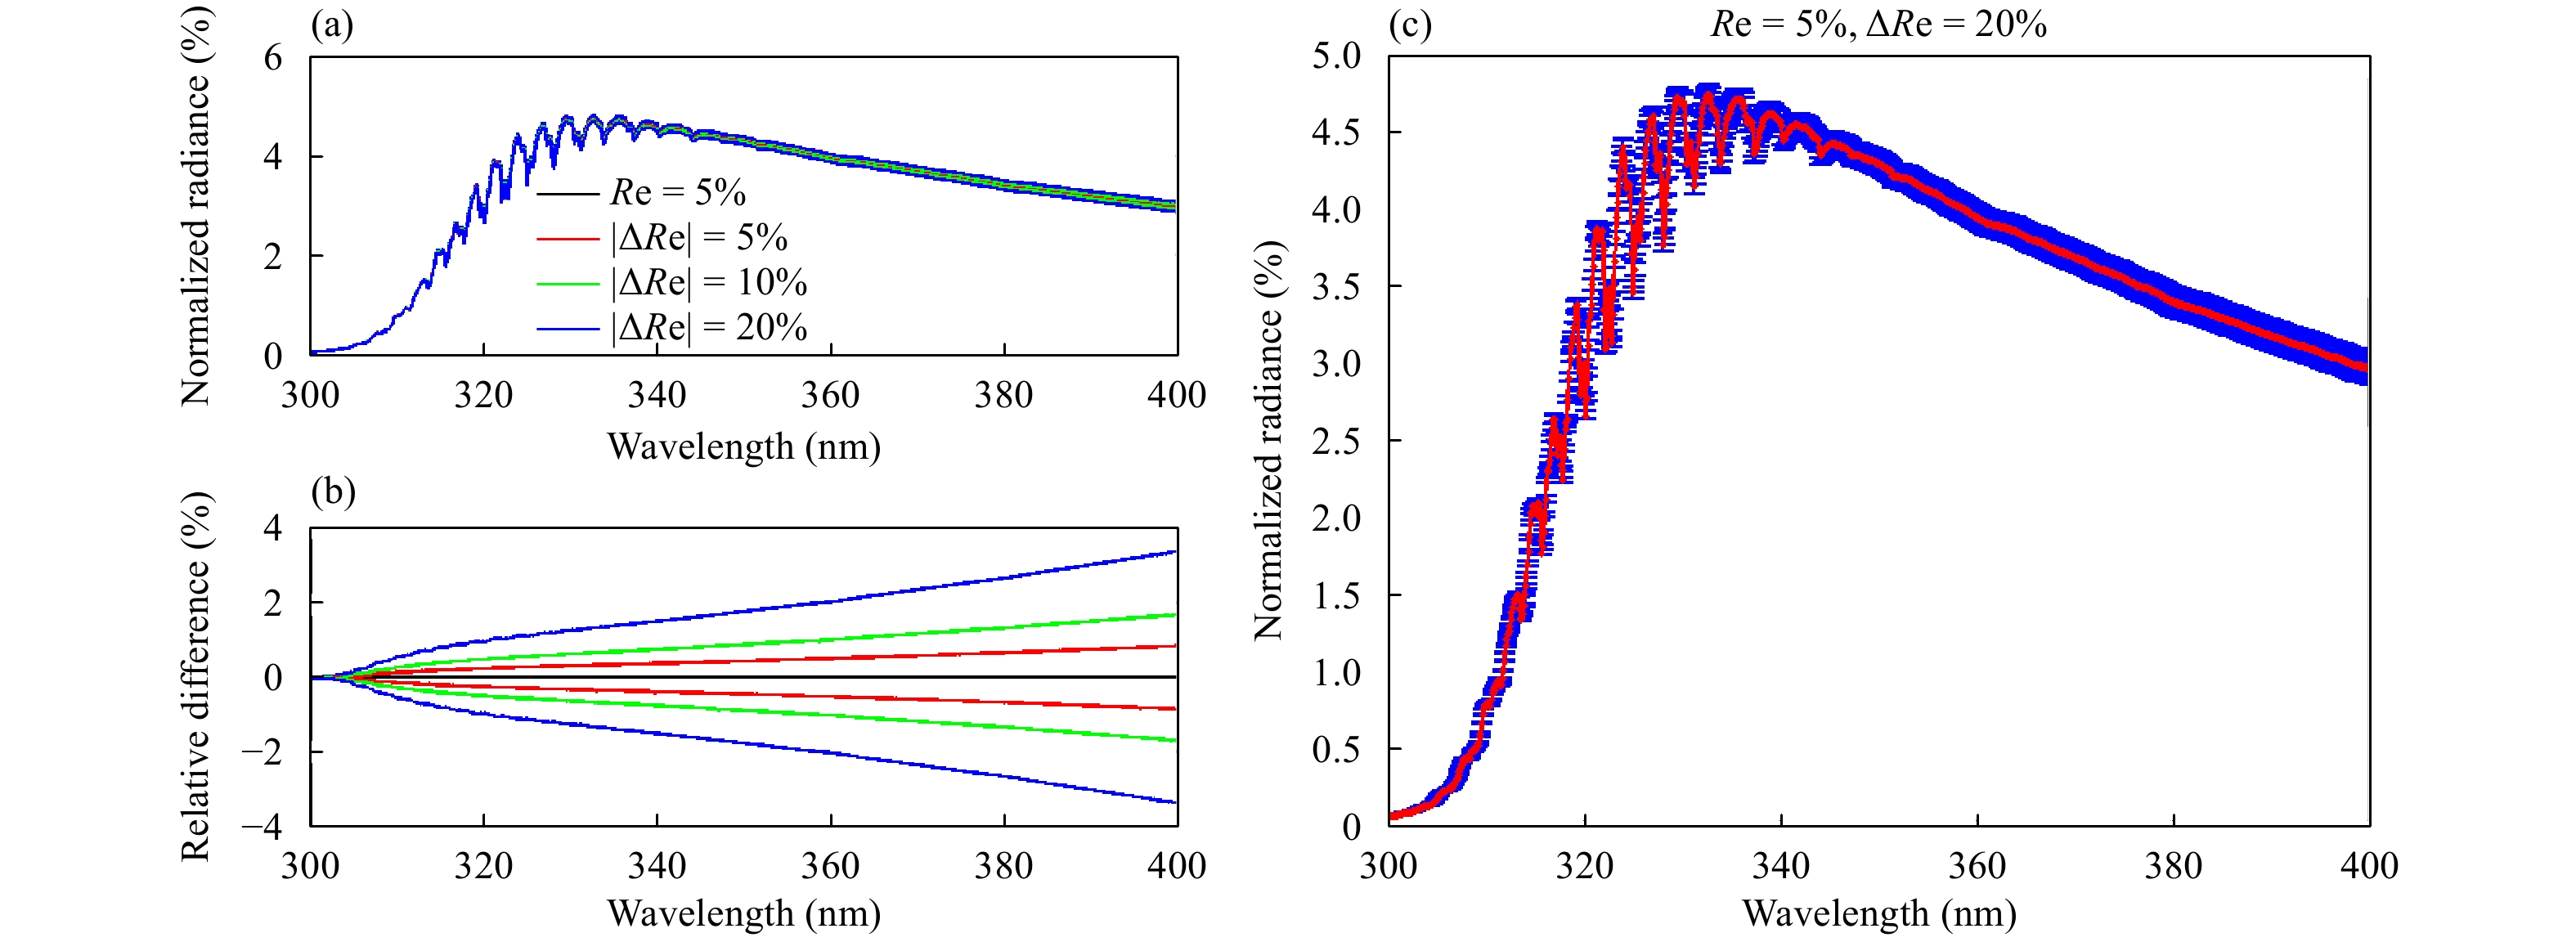
The most widely used approximation assumes that the surface is an Lambertian type, which reflects light isotropically. Such an assumption greatly reduces the amount of computer time. Coulson et al. (1960) pointed out that both the intensity and polarization fields of skylight are sensitive to the reflectance of the Lambertian surface, solar zenith angle, and direction in which the skylight is observed. To investigate the effects of surface reflectance on reflected radiance, we carry out a simulation for the surface reflectance fixed at 0.05 for all wavelengths in UV region, and then we carry out additional simulations by assuming different perturbations, 5%, 10%, and 20%, to the surface reflectance. Figure 6 shows the effects of surface reflectance uncertainties on TOA normalized radiances. The comparison is shown on the left panel. The right panel is the error bar for reflectance variation of 20%. Given a 5% uncertainty associated with surface reflectance, the TOA normalized radiances are not very sensitive (with relative difference less than 2%) to the surface reflectance for wavelengths less than about 330 nm, because less light can reach the surface due to the strong absorption by ozone at these wavelengths (Figs. 6a, c). The change of surface reflectance does not significantly influence the reflected radiance. However, for wavelength larger than 330 nm, the TOA reflected radiances are much sensitive (with relative difference larger than 2%) to the change of surface reflectance (Figs. 6b, c), because the light can reach the surface. In addition, we can see that the errors increase with increasing of wavelengths (Figs. 6a–c). In the simulation, the surface reflectance value at 331 nm is used for all wavelengths by following the TOMRAD simulation (Seftor et al., 2014). However, these results clearly illustrate that the assumption of a fixed surface reflectance within UV region may cause significant errors, especially for wavelength larger than 330 nm.
|
| Figure 6 (a) Effects of surface reflectance (Re) uncertainties (5%, 10%, and 20%) on TOA normalized radiances and (b) the relative differences. (c) Error distribution with wavelength of TOA normalized radiances for a Re perturbation of 20%. |
The problem of wavelength inaccuracy is far from being trivial. For example, a very small wavelength shift (WS) in Raman spectrum may cause an unidentified different spectrum during an experiment. The result of such a situation is that the instrument needs to be re-calibrated and the entire experiment is repeated. Although the accuracy requirements of the remote sensor on satellite are not so high, the accurate wavelength calibration is extremely important and indispensable. This is particularly true when we validate the satellite measurements via a forward model. The calibrated wavelength should be used as inputs to the radiative transfer model and the spectral resolution of the instrument must be taken into account in calculation of the radiative transfer model. Unfortunately, there are only few laboratory measurements at very high resolution (0.01 nm or better) and with very accurate wavelength calibration (0.01 nm or better) according to Orphal and Chance (2003).
To figure out the influence of wavelength shifts on the simulated TOA reflected radiance for different spectral resolutions (observed by satellite instruments with different full width at half maximum, FWHM), we carry out two simulation tests with different FWHM values of 0.2 and 0.4 nm, respectively, in the 300–380-nm region. As shown inFig. 7, changes in the ozone spectrum for different WSs are very sensitive to the spectral resolution. In the 300–380-nm region, the changes in the ozone spectrum for different WSs are resolution dependent. At a lower resolution, a WS of 0.05 nm introduces radiance changes of up to 9% and even a shift of only 0.01 nm still introduces radiance changes of up to 1.5%.

|
| Figure 7 Effects of wavelength shifts (WS) on the simulated radiance for FWHM (full width at half maximum) values of (a) 0.2 and (b) 0.4 nm. |
OMPS is one of five instruments carried on board the Suomi National Polar-orbiting Partnership satellite (SNPP), which was launched on 28 October 2011. It is a new generation of space-based backscattered ultraviolet radiation sensor suite, which provides daily measurements of global three dimensional distribution of atmospheric ozone and other constituents. OMPS calibrated Sensor Data Records (SDR) from its nadir mapper (NM) and nadir profiler (NP) contain 36 macro-pixels and 196 spectral channels from 300 to 380 nm.
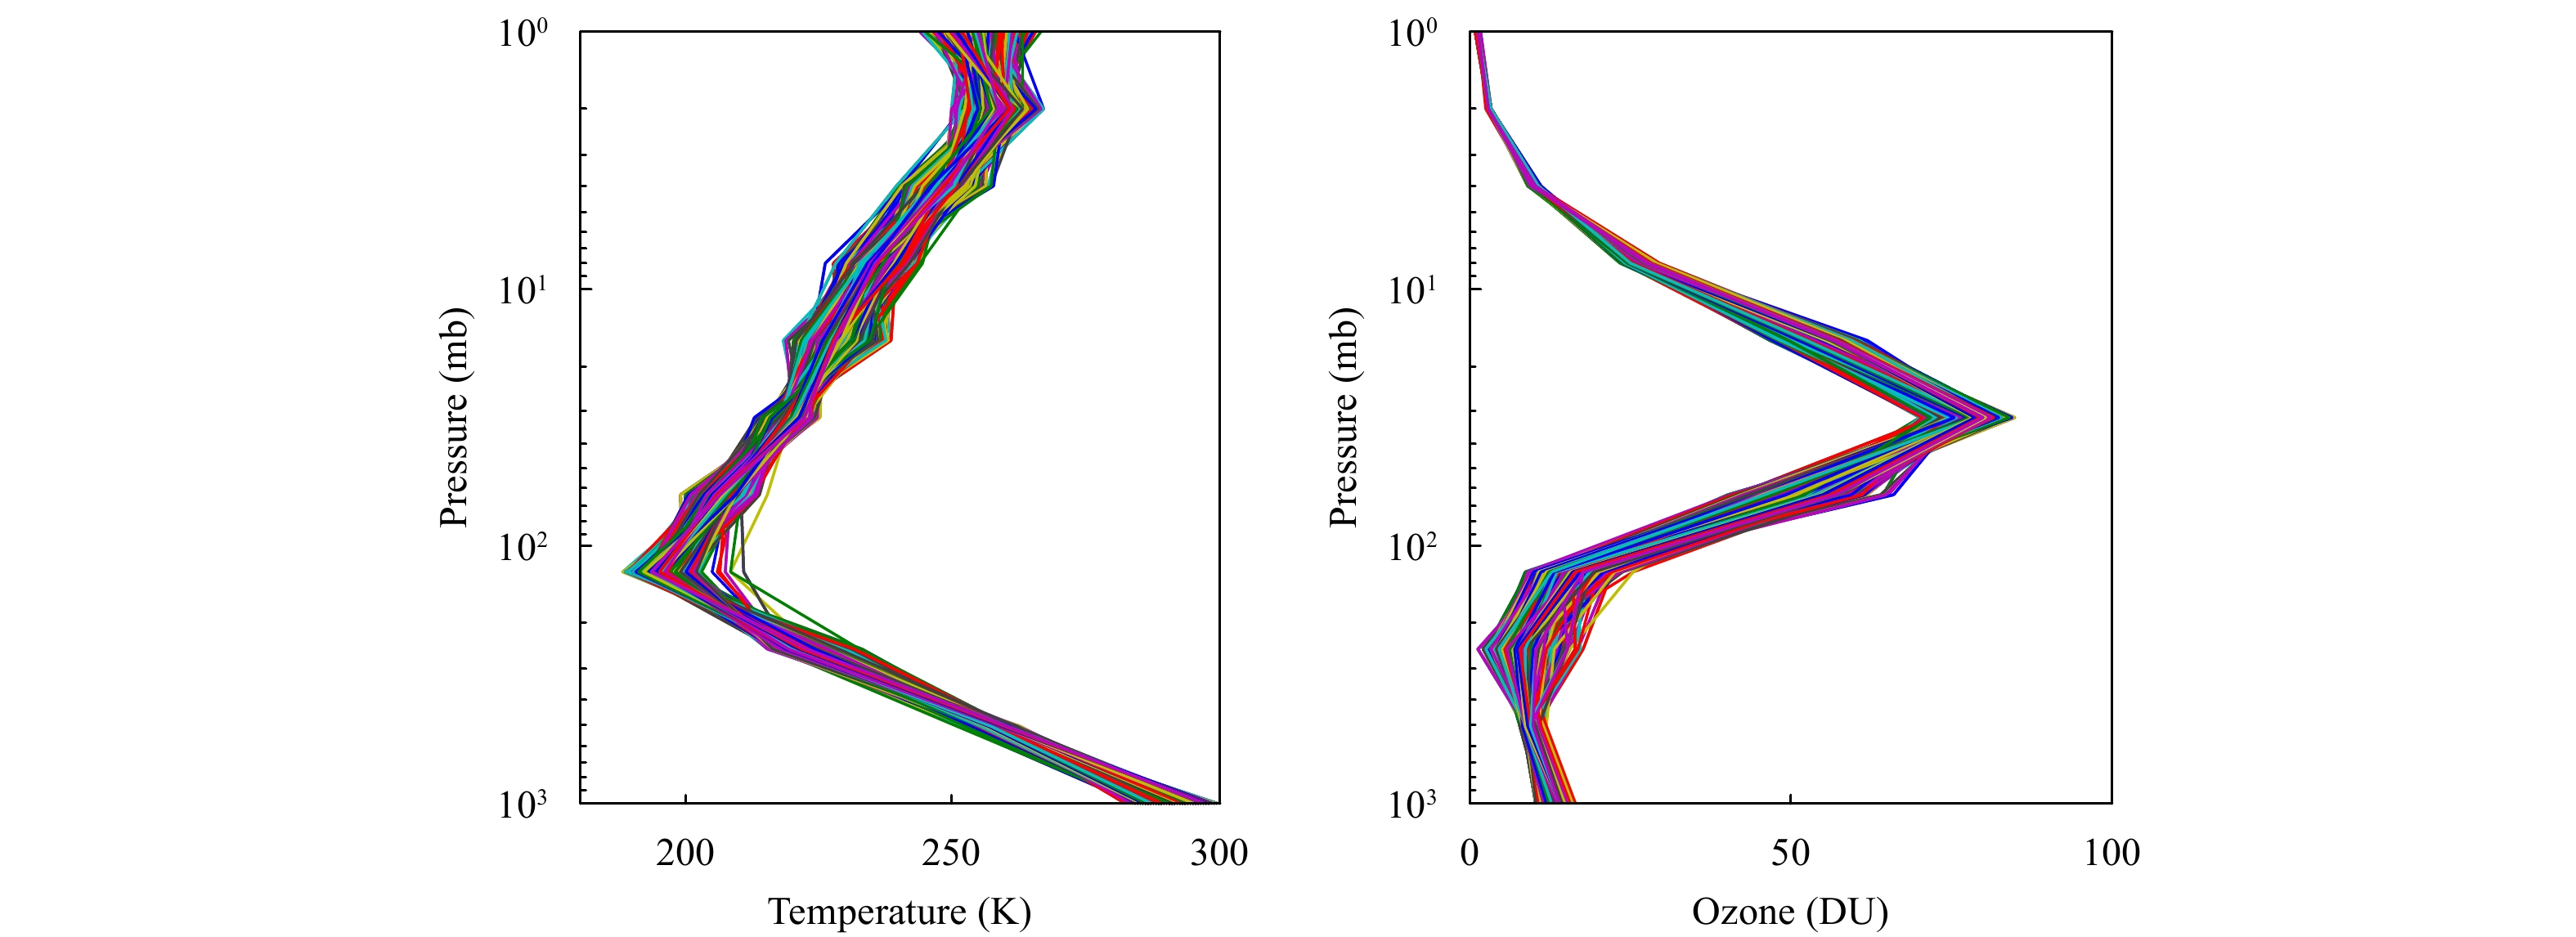
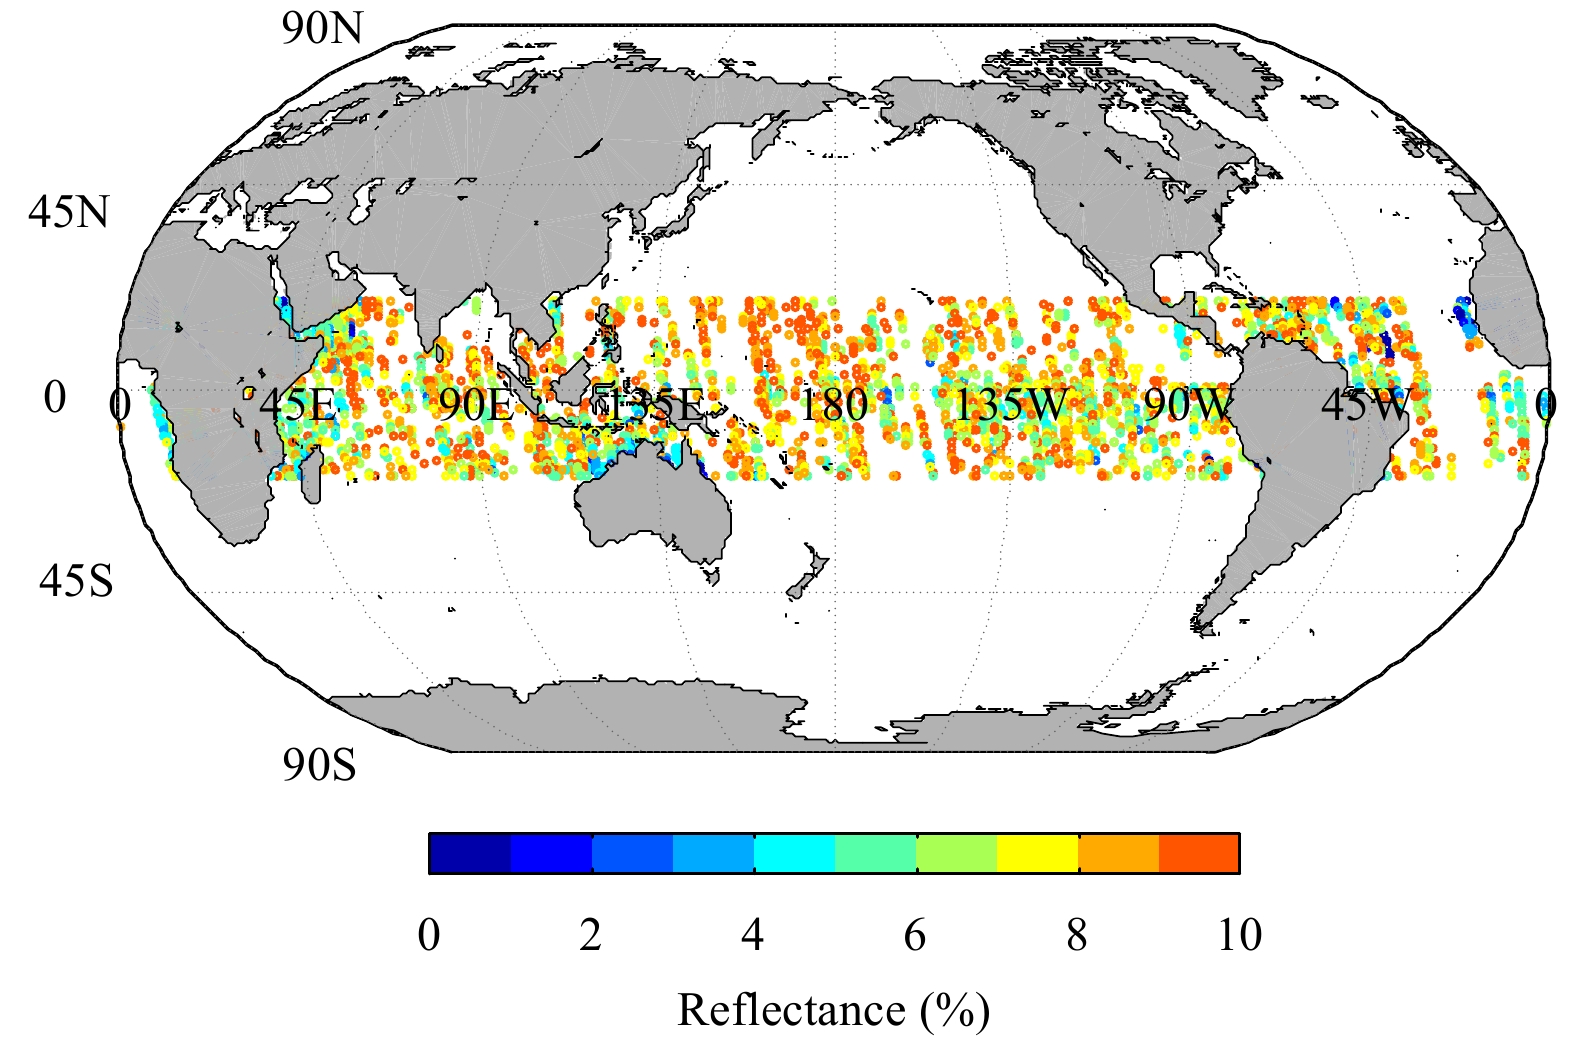
The OMPS calibrated SDR bias is now assessed through comparisons of normalized radiances (NR) between simulations and observations. NR is defined as radiance divided by solar flux. In radiative transfer simulation, the profiles of ozone come from the retrievals of Microwave Limb Sounder (MLS) sensor flying on Aura. OMPS measurements are collocated with MLS between the latitudes of 20 degrees north and south (Seftor et al., 2014). For clear-sky condition, the reflectivity of selected OMPS data is less than 0.1 to remove cloud effects and the aerosol index of selected OMPS data is less than 1.0 to minimize absorbing aerosol effects. Figure 8 shows the co-located OMPS/MLS temperature and ozone profiles. Figure 9 shows the distribution of surface reflectance at 331 nm. The NRs calculated from RTM representing the anticipated OMPS measurements are then compared with those of OMPS actually measured.
|
| Figure 8 Co-located OMPS/MLS (a) temperature and (b) ozone profiles. |
|
| Figure 9 Distribution of the surface reflectance at 331 nm. |
Due to the complexity of surface property, in early times, only a very few studies have been performed to measure the spectral reflectance for different surfaces in UV region (Coulson and Reynolds, 1971; Doda and Green, 1980). Recently, several surface reflectivity climatologies in UV determined from earth observations by TOMS (Herman and Celarier, 1997), GOME (Koelemeijer et al., 2003), OMI (Kleipool et al., 2008), GOME-2, and ACIAMACHY (Tilstra et al., 2017), have been constructed. The results of measurement over ocean by Doda and Green (1980) show that there is a general trend of increasing surface reflectance with increasing wave-length. Moreover, based on the limited number of data in the ASTER spectral library (Baldridge et al., 2009), there is also an increasing trend for surface reflectance in UV and VIS regions for many natural land surfaces such as grass, conifers, deciduous trees, and snow/frost surface. In this study, since only the reflectance at 331 nm is available and used for all wavelengths in our radiative transfer calculation, the assumption may overestimate the surface reflectance for wavelengths smaller than 331 nm and underestimate it for wavelengths larger than 331 nm.
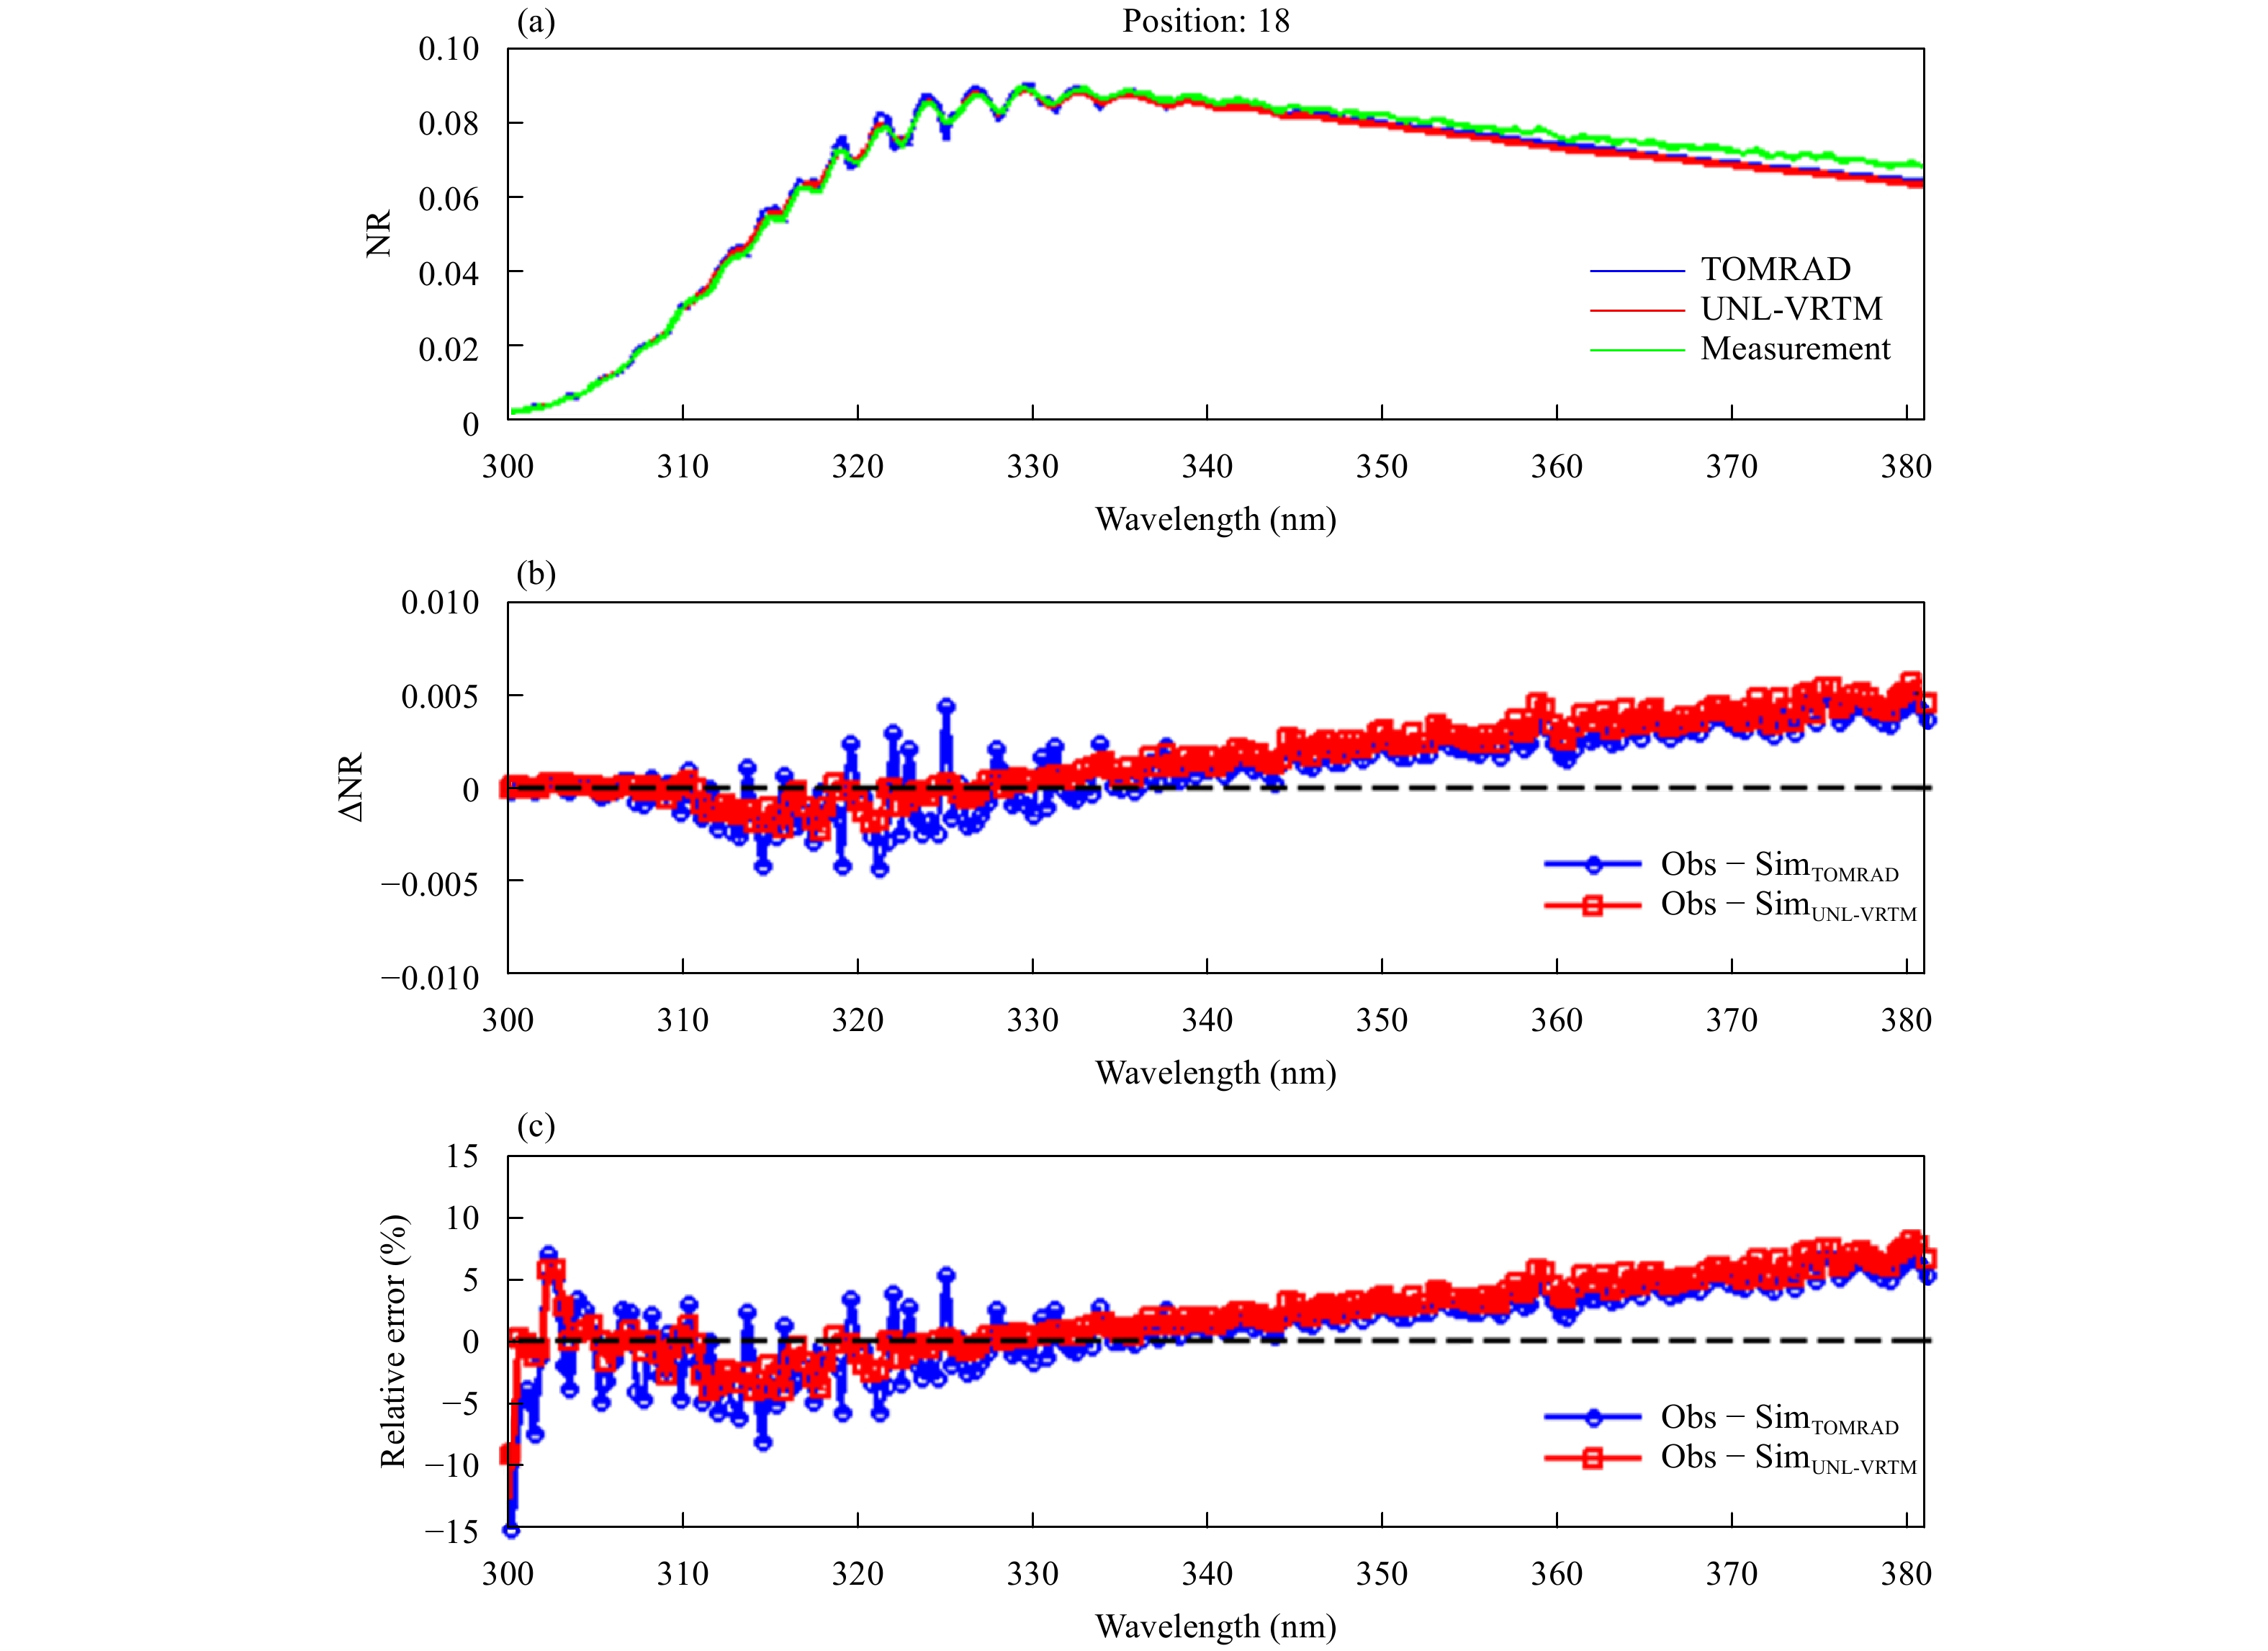
Figures 10 and 11 compare the averaged NRs between model simulations (red) and measurements (green) at wing (cross tracking #1) and center (cross tracking #18) positions, respectively. In contrast, the simulations from TOMRAD are also presented (blue). For all the simulations, the surface reflectance for all wavelengths is fixed to be the value at 331 nm. In both figures, the relative differences increase as the wavelength increases for wavelengths larger than 331 nm. By comparing the simulations between UNL-VRTM and TOMRAD, it is clearly shown that by use of UNL-VRTM, the large deviations from TOMRAD model can be reduced, especially at wavelengths from 310 to 340 nm, since the treatments of gas absorption and Rayleigh scatting in both RT models are different. In TOMRAD, there is only one gas, ozone, considered in the simulation; while in UNL-VRTM, ozone and other absorption gases, such as NO2, SO2, O2, and HCHO, are all included. In addition, in TOMRAD, a lookup table is used, while in UNL-VRTM, a set of equations using all the latest values of the physical constants recommended by Bodhaine et al. (1999) are used, as mentioned in the previous section. It should be noticed that the large relative errors in the 300–310-nm region for both models in Figs. 10, 11 can be ignored. Seftor et al. (2014) pointed out that measurements in the 300–310-nm region are affected by the dichroic element of instrument. Measurements in this region should not be used.

|
| Figure 10 (a) Comparison of averaged normalized radiances (NRs) between model simulations (TOMRAD in blue and UNL-VRTM in red) and measurements (Obs, in green) for all profiles at wing position (cross tracking #1), and (b) the biases and (c) relative errors. |
|
| Figure 11 As in Fig. 10, but at near center position (cross tracking #18). |
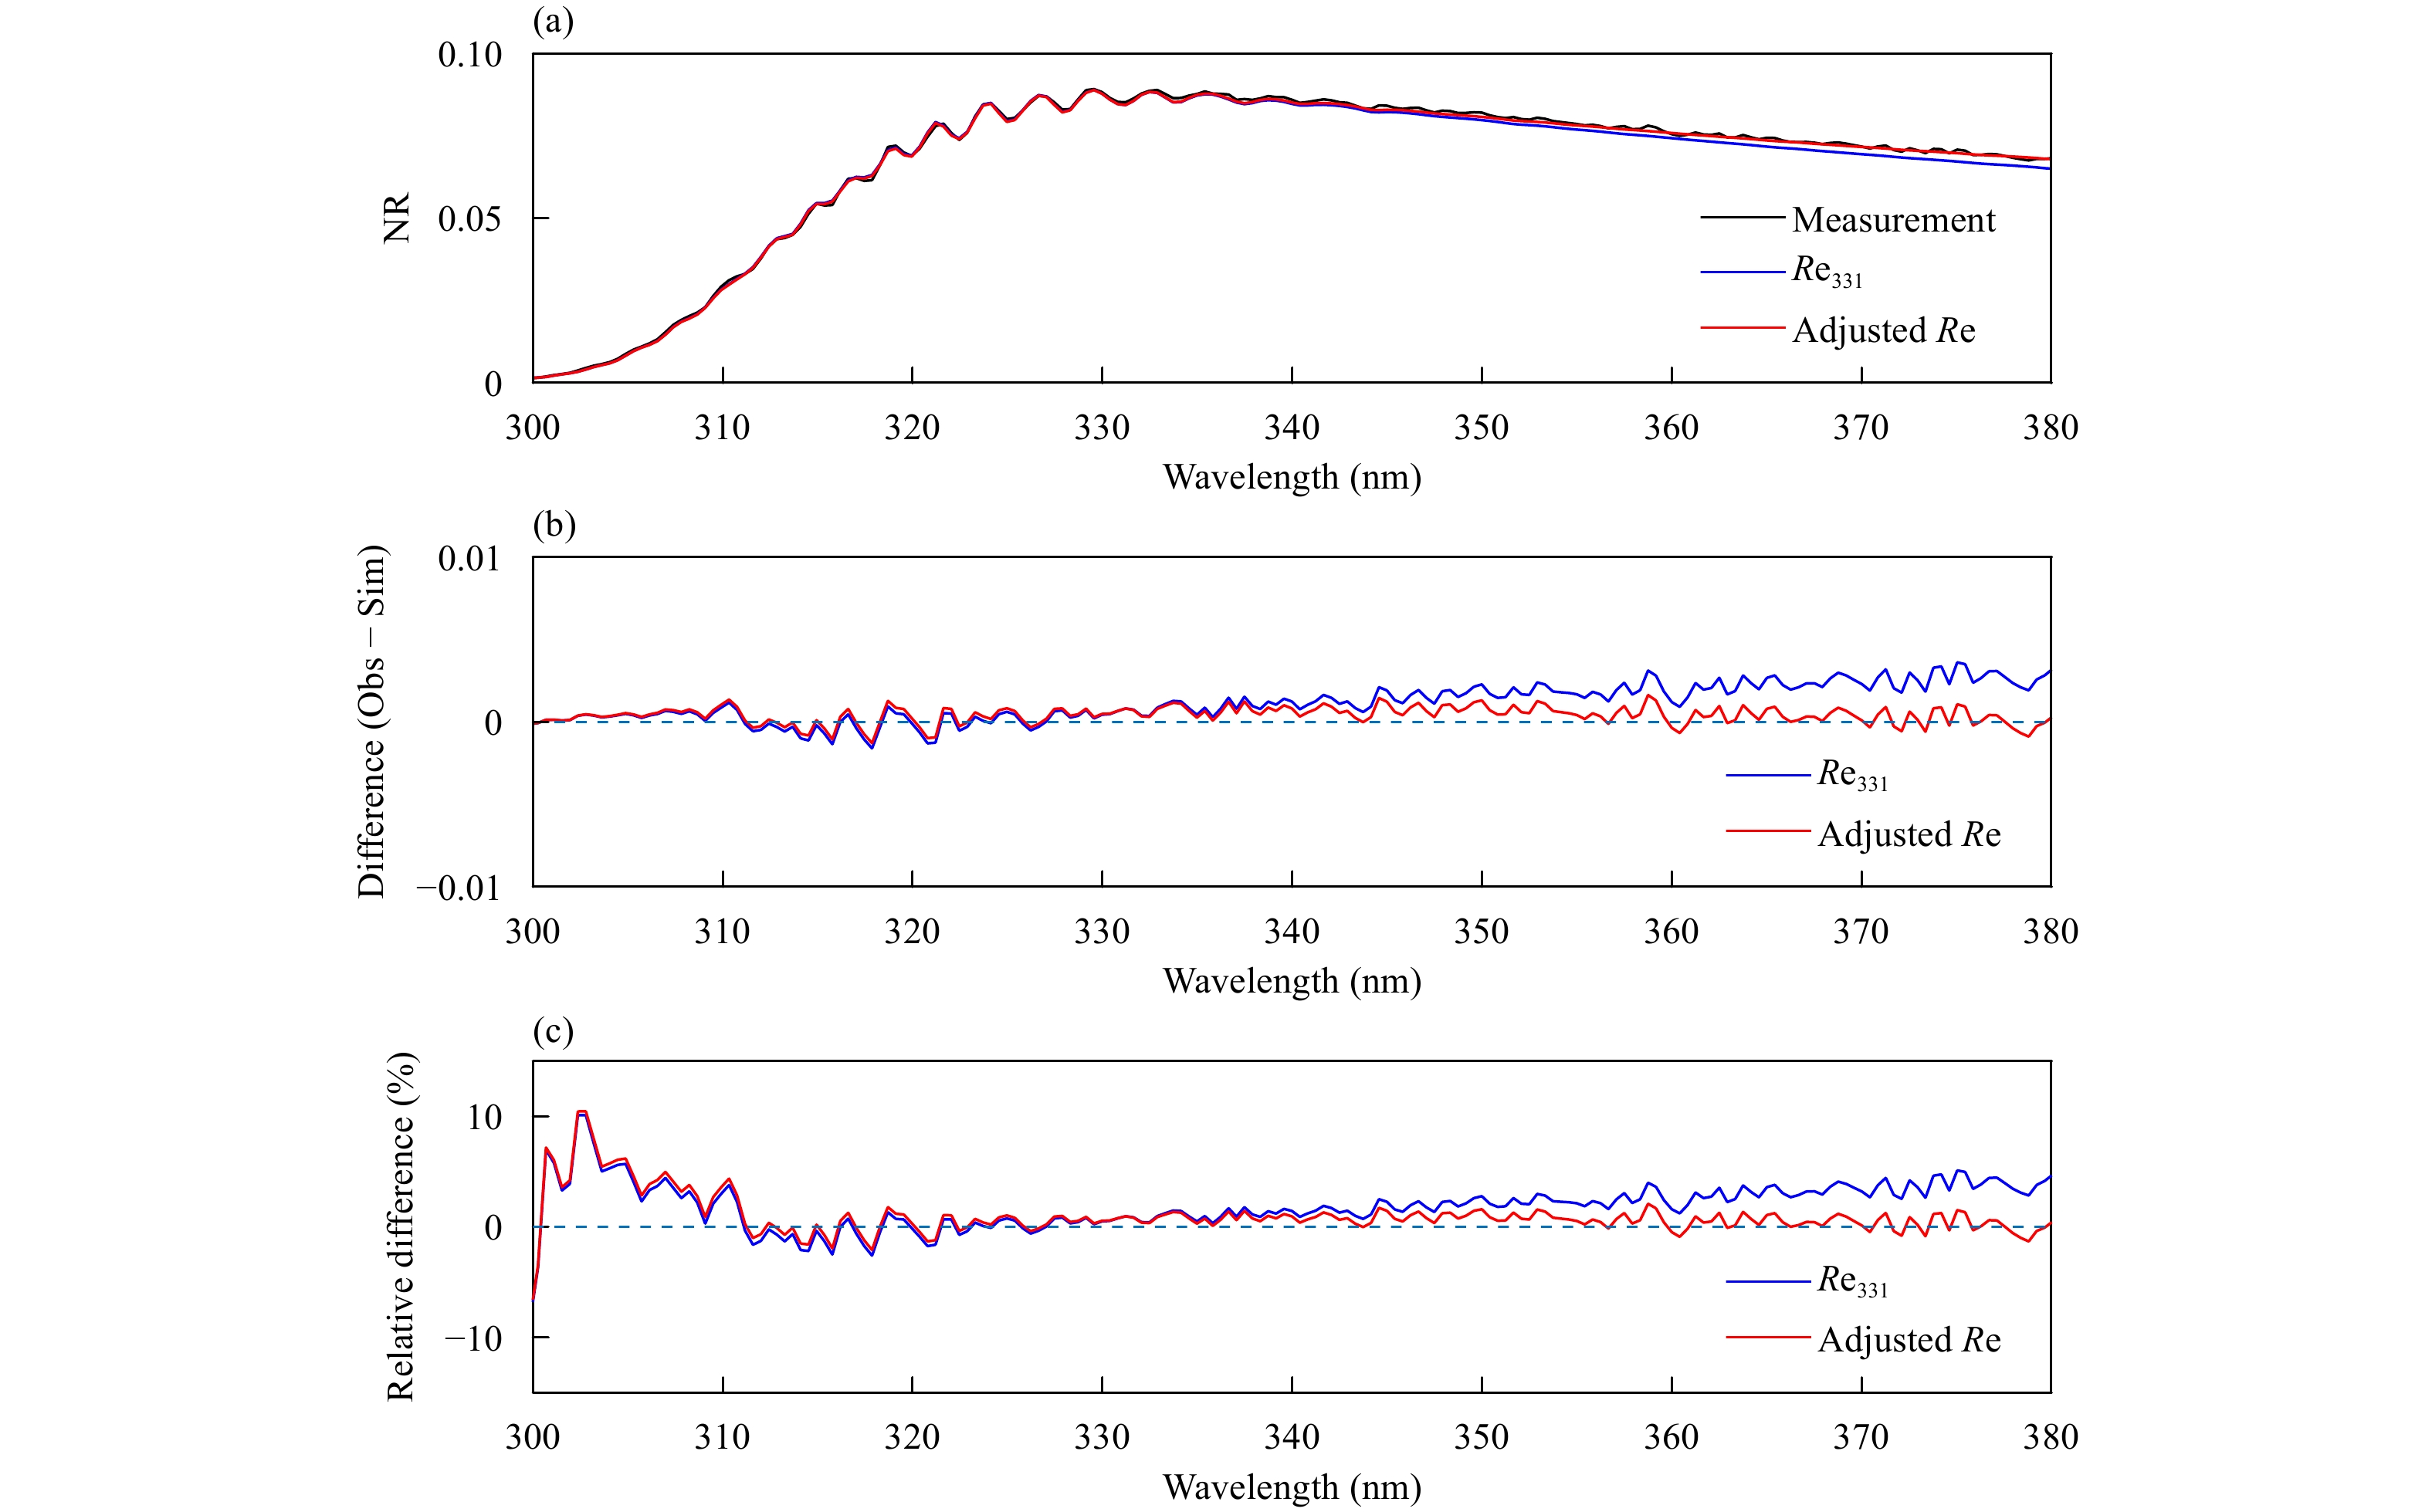
Figure 12 shows a comparison of model simulations and OMPS measurements for a single profile at cross tracking position 1. Two simulations are carried out. In the first simulation, the surface reflectance at 331 nm is used for all wavelengths (see the blue curve). As can be seen, there is a positive slope for the difference between OMPS measurement and RTM simulation. For wavelengths greater than 331 nm, NRs of OMPS measurement are larger than those of simulation and the differences increase as the wavelength increases. In the second simulation, we adjust the surface reflectance slightly based on the value at 331 nm and assume that the surface reflectance increases linearly with a positive slope of 0.0003 when wavelength increases. The solid red curve shows the result by using the adjusted surface reflectance. We can see that the result of the second simulation is much better than the first one, especially for wavelengths larger than 331 nm. In this case, the relative differences are less than 3% for all wavelengths except for those less than 310 nm (as mentioned above, the OMPS measurements in this region may be affected by the dichroic element of instrument). Therefore, using a constant surface reflectance for all OMPS wavelengths may cause significant errors to the simulated NRs. This assumption overestimates the surface reflectance for wavelengths smaller than 331 nm and underestimates those for wavelengths larger than 331 nm. From the previous discussion, the NAs are not sensitive to the surface reflectance for wavelengths less than about 331 nm because less light can reach the surface due to strong absorption by ozone at these wavelengths. On the other hand, for wavelength larger than 331 nm, as light can reach the surface, the TOA reflected radiances are sensitive to the surface reflectance. By using adjusted surface reflectance, the relative errors between simulation and measurement decrease obviously, especially for wave-lengths larger than 331 nm.
|
| Figure 12 (a) Comparison of NR between OMPS measurements and the simulations using fixed and adjusted surface reflectance, (b) their differences, and (c) relative differences. |
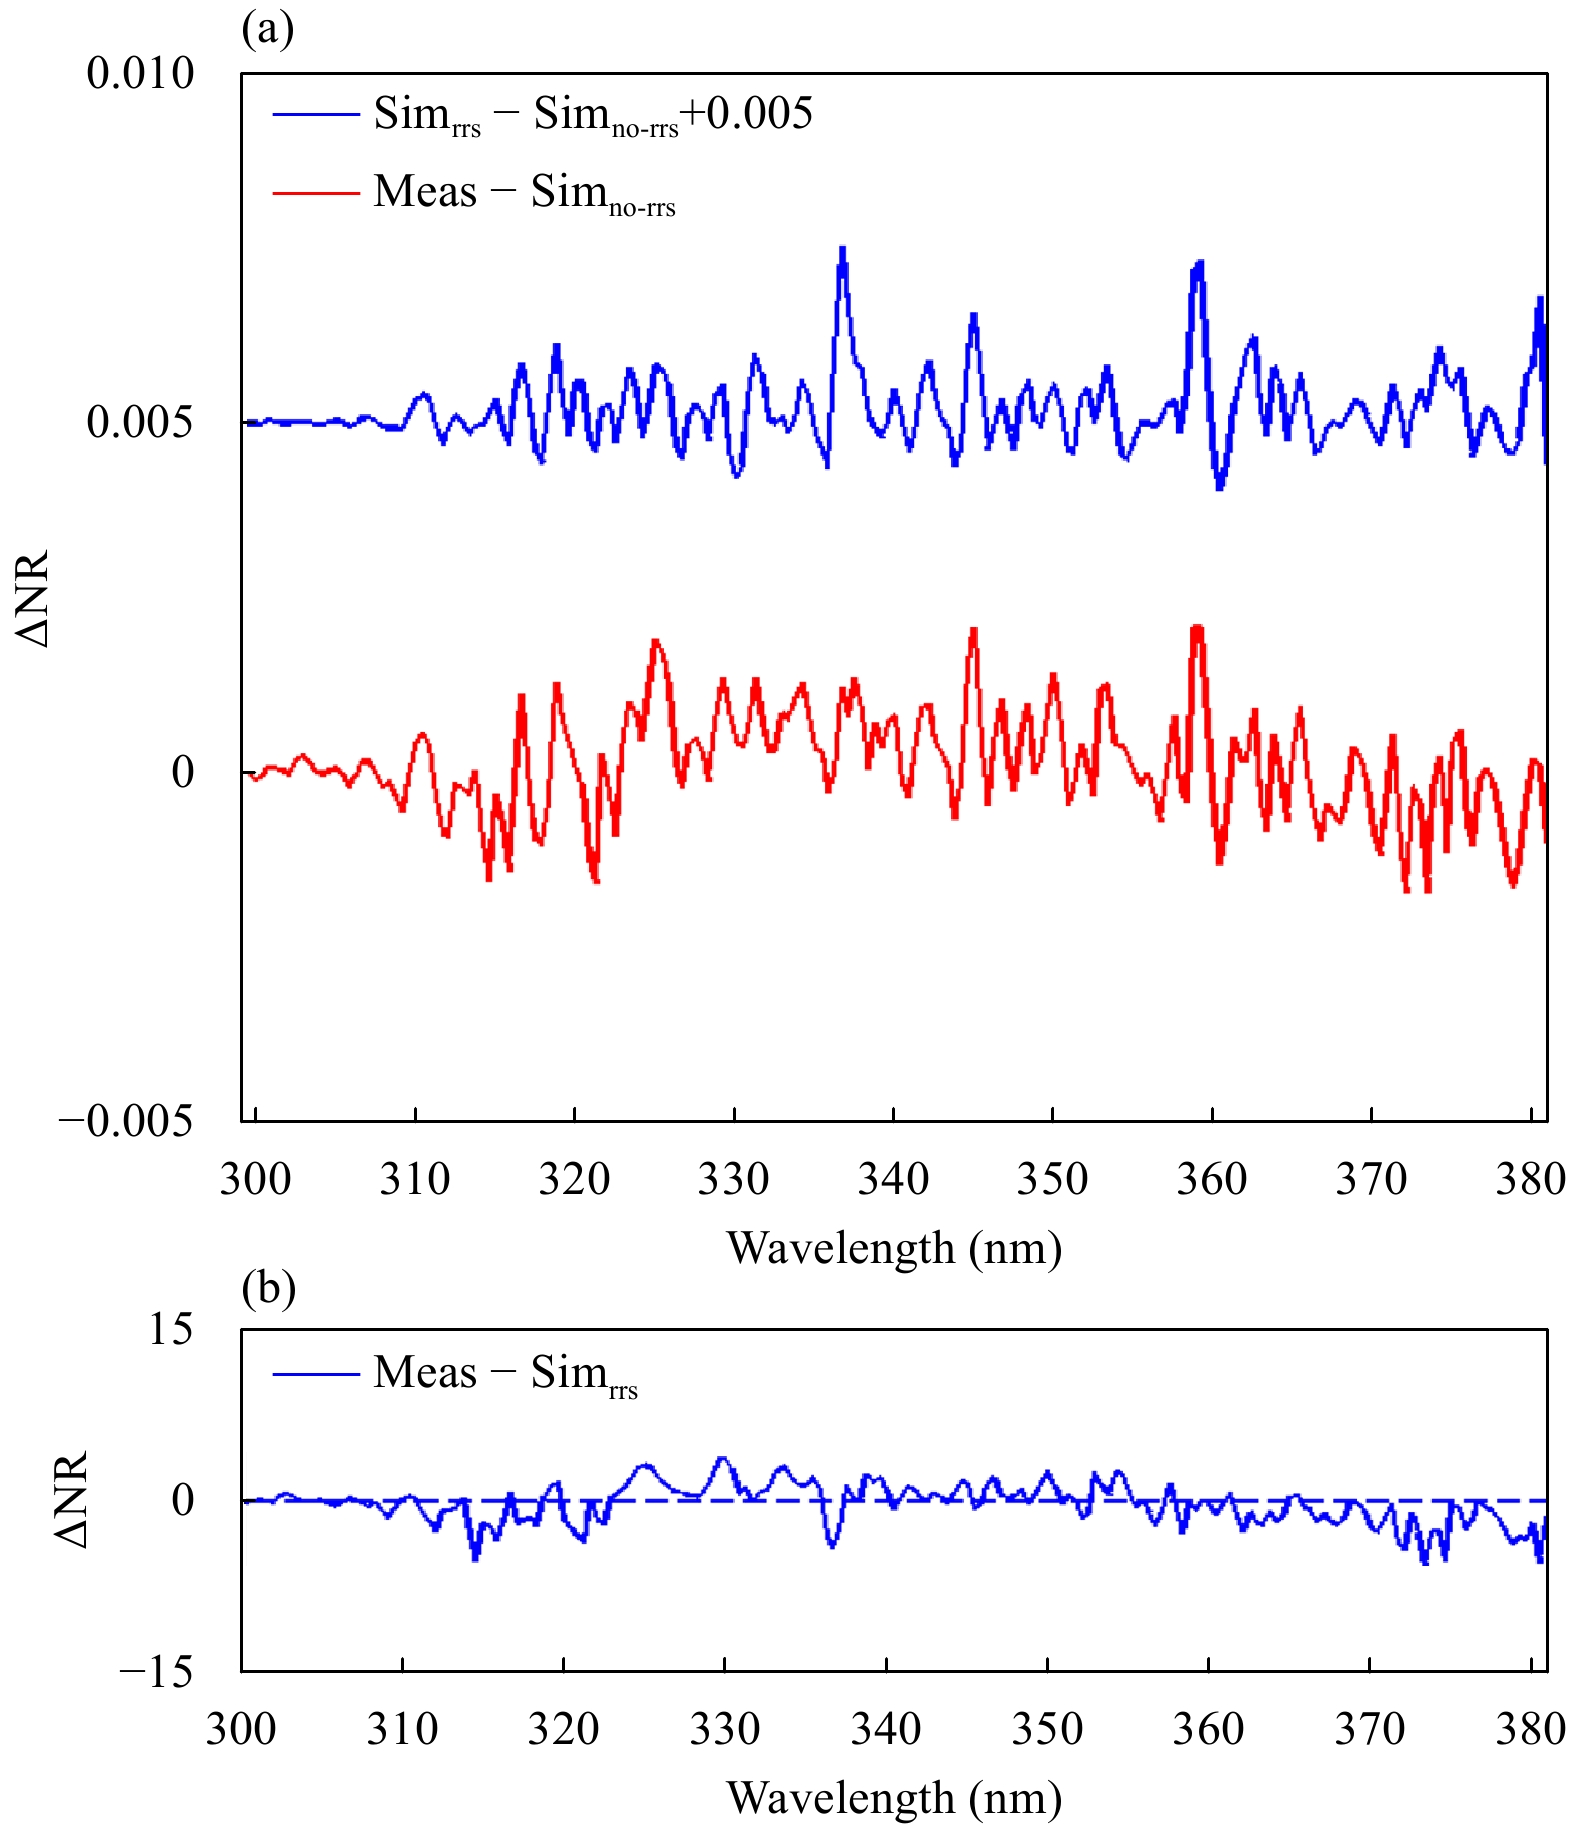
Using the SCIATRAN model, we have also investigated the effects of rotational Raman scattering (RRS) on simulated OMPS radiances. As shown in Fig. 13a, the blue curve shows the difference between simulations with and without considering RRS, indicating the effects of RRS; while the red curve is the difference between measurements and simulations from UNL-VRTM. It can be seen that peaks and valleys of the two curves match pretty well at most of the wavelengths. If the effect of RRS is included, the difference between measurement and simulation is more uniform across the wavelength domain in Fig. 13b.
|
| Figure 13 The effect of rotational Raman scattering (RRS). In (a), the blue curve indicates difference between the simultaions with (Simrrs) and without (Simno-rrs) considering RRS, and the red curve indicates difference between measurement and Simno-rrs. In (b), the curve shows the difference between measurement and Simrrs. |
In this paper, we first investigated the effects of different factors such as scalar approximation, absorption gases, surface reflectance, Rayleigh scattering, and wavelength shifts on TOA normalized radiance in UV region by using the UNL-VRTM. The sensitivity tests show that scalar approximation of radiative transfer calculation considering only ozone and/or the assumption of a fixed constant surface reflectance within UV region may cause significant errors in the calculation of TOA normalized radiance. The simulation results show that the maximum errors could be larger than 8%, 1.8%, and 5%, respectively, at some wavelengths. Then, the OMPS calibrated SDR were evaluated through comparisons of NAs from the simulation of the radiative transfer model by using the well co-located Microwave Limb Sounder (MLS) Ozone profiles as inputs. The comparisons were carried out for both individual and averaged profiles at different cross tracking positions. The results show that by using UNL-VRTM, a vector RTM with consideration of all possible absorption gases and an accurate calculation of Rayleigh scattering optical depth, the large variations between measurements and simulations from TOMRAD can be significantly reduced at the wave-lengths of 310–340 nm. In addition, taking into account the effects of RRS by using SCIATRAN, the difference between measurements and simulations can be further reduced at most of the wavelengths larger than 310 nm. On the whole, the differences can be less than 3% for the entire wavelengths.
| Adams, C. N., and G. W. Kattawar, 1970: Solutions of the equations of radiative transfer by an invariant imbedding approach. J. Quant. Spectrosc. Radiat. Transfer, 10, 341–356. DOI:10.1016/0022-4073(70)90101-9 |
| Baldridge, A. M., S. J. Hook, C. I. Grove, et al., 2009: The ASTER spectral library version 2.0. Remote Sens. Environ., 113, 711–715. DOI:10.1016/j.rse.2008.11.007 |
| Bass, A. M., and R. J. Paur, 1985: The ultraviolet cross-sections of ozone: I. The measurements. Atmospheric Ozone, C. S. Zerefos, and A. Ghazi, Eds., Springer, Dordrecht, 606–610, doi: 10.1007/978-94-009-5313-0_120. |
| Bodhaine, B. A., N. B. Wood, E. G. Dutton, et al., 1999: On Rayleigh optical depth calculations. J. Atmos. Oceanic Technol., 16, 1854–1861. DOI:10.1175/1520-0426(1999)016<1854:ORODC>2.0.CO;2 |
| Bovensmann H., J. P. Burrows, M. Buchwitz, 1999: SCIAMACHY—Mission objectives and measurement modes. J. Atmos. Sci., 56, 127–150. DOI:10.1175/1520-0469(1999)056<0127:SMOAMM>2.0.CO;2 |
| Burrows, J. P., M. Weber, M. Buchwitz, et al., 1999: The Global Ozone Monitoring Experiment (GOME): Mission concept and first scientific results. J. Atmos. Sci., 56, 151–175. DOI:10.1175/1520-0469(1999)056<0151:TGOMEG>2.0.CO;2 |
| Callies, J., E. Corpaccioli, M. Eisinger, et al., 2000: GOME-2-Metop’s second-generation sensor for operational ozone monitoring. ESA Bulletin, 102, 28–36. |
| Chandrasekhar, S., 1960: Radiative Transfer. Dover Publishing, Inc., New York, 415 pp. |
| Cockell, C. S., and A. R. Blaustein, 2013: Ecosystems, Evolution, and Ultraviolet Radiation. Springer, New York, 222 pp. |
| Coulson, K. L., and D. W. Reynolds, 1971: The spectral reflectance of natural surfaces. J. Appl. Meteor., 10, 1285–1295. DOI:10.1175/1520-0450(1971)010<1285:TSRONS>2.0.CO;2 |
| Coulson, K. L., 1988: Polarization and Intensity of Light in the Atmosphere. A. Deepak Publishing, Hampton VA, 596 pp. |
| Coulson, K. L., J. V. Dave, and Z. Sekera, 1960: Tables Related to Radiation Emerging from a Planetary Atmosphere with Rayleigh Scattering. University of California Press, Berkeley, 548 pp. |
| Doda, D. D., and A. E. S. Green, 1980: Surface reflectance measurements in the UV from an airborne platform. Part 1. Appl. Opt., 19, 2140–2145. DOI:10.1364/AO.19.002140 |
| Eck, T. F., P. K. Bhartia, and J. B. Kerr, 1995: Satellite estimation of spectral UVB irradiance using TOMS derived total ozone and UV reflectivity. Geophys. Res. Lett., 22, 611–614. DOI:10.1029/95GL00111 |
| Emde, C., R. Buras-Schnell, A. Kylling, et al., 2016: The libRadtran software package for radiative transfer calculations (version 2.0.1). Geosci. Model Dev., 9, 1647–1672. DOI:10.5194/gmd-9-1647-2016 |
| Evans, K. F., and G. L. Stephens, 1991: A new polarized atmospheric radiative transfer model. J. Quant. Spectrosc. Radiat. Transfer, 46, 413–423. DOI:10.1016/0022-4073(91)90043-P |
| Garcia, R. D. M., and C. E. Siewert, 1989: The FN method for radiative transfer models that include polarization effects. J. Quant. Spectrosc. Radiat. Transfer, 41, 117–145. DOI:10.1016/0022-4073(89)90133-7 |
| Hansen, J. E., and L. D. Travis, 1974: Light scattering in planetary atmospheres. Space Sci. Rev., 16, 527–610. DOI:10.1007/BF00168069 |
| Hasekamp, O. P., J. Landgraf, and R. van Oss, 2002: The need of polarization modeling for ozone profile retrieval from backscattered sunlight. J. Geophys. Res. Atmos., 107, 4692. DOI:10.1029/2002JD002387 |
| Heath, D. F., A. J. Krueger, H. A. Roeder, et al., 1975: The solar backscatter ultraviolet and total ozone mapping spectrometer (SBUV/TOMS) for Nimbus G. Opt. Eng., 14, 144323. DOI:10.1117/12.7971839 |
| Herman, J. R., and E. A. Celarier, 1997: Earth surface reflectivity climatology at 340–380 nm from TOMS data. J. Geophys. Res. Atmos., 102, 28003–28011. DOI:10.1029/97JD02074 |
| International Commission on Non-Ionizing Radiation Protection (ICNIRP), 2004: Medical magnetic resonance (MR) procedures: Protection of patients. Health Phys., 87, 197–216. DOI:10.1097/HP.0b013e3181aff9eb |
| Kleipool, Q. L., M. R. Dobber, J. F. de Haan, et al., 2008: Earth surface reflectance climatology from 3 years of OMI data. J. Geophys. Res. Atmos., 113, D18308. DOI:10.1029/2008JD010290 |
| Koelemeijer, R. B. A., J. F. de Haan, and P. Stammes, 2003: A database of spectral surface reflectivity in the range 335–772 nm derived from 5.5 years of GOME observations. J. Geophys. Res. Atmos., 108, 4070. DOI:10.1029/2002JD002429 |
| Kokhanovsky, A. A., J. L. Deuzé, D. J. Diner, et al., 2010: The inter-comparison of major satellite aerosol retrieval algori-thms using simulated intensity and polarization characteristics of reflected light. Atmos. Meas. Tech., 3, 909–932. DOI:10.5194/amt-3-909-2010 |
| Landgraf, J., O. P. Hasekamp, M. A. Box, et al., 2001: A linearized radiative transfer model for ozone profile retrieval using the analytical forward-adjoint perturbation theory approach. J. Geophys. Res. Atmos., 106, 27291–27305. DOI:10.1029/2001JD000636 |
| Levelt, P. F., G. H. J. van den Oord, M. R. Dobber, et al., 2006: The ozone monitoring instrument. IEEE Trans. Geosci. Remote Sens., 44, 1093–1101. DOI:10.1109/TGRS.2006.872333 |
| McClatchey, R. A., R. W. Fenn, J. E. A. Selby, et al., 1972: Opti-cal Properties of the Atmosphere. 3rd Ed., Air Force Cambridge Research Laboratory, Bedford, MA, 110 pp. |
| McPeters, R. D., T. Miles, L. E. Flynn, et al., 1994: Comparison of SBUV and SAGE II ozone profiles: Implications for ozone trends. J. Geophys. Res. Atmos., 99, 20513–20524. DOI:10.1029/94JD02008 |
| Mishchenko, M. I., A. A. Lacis, and L. D. Travis, 1994: Errors induced by the neglect of polarization in radiance calculations for Rayleigh-scattering atmospheres. J. Quant. Spectrosc. Radiat. Transfer, 51, 491–510. DOI:10.1016/0022-4073(94)90149-X |
| Munro, R., M. Eisinger, C. Anderson, et al., 2006: GOME-2 on MetOp. Proceedings of 2006 EUMETSAT Meteorological Satellite Conference, Helsinki, Finland, 1–25. |
| Orphal, J., and K. Chance, 2003: Ultraviolet and visible absorption cross-sections for HITRAN. J. Quant. Spectrosc. Radiat. Transfer, 82, 491–504. DOI:10.1016/S0022-4073(03)00173-0 |
| Ricchiazzi, P., S. R. Yang, C. Gautier, et al., 1998: SBDART: A research and teaching software tool for plane-parallel radiative transfer in the earth’s atmosphere. Bull. Amer. Meteor. Soc., 79, 2101–2114. DOI:10.1175/1520-0477(1998)079<2101:SARATS>2.0.CO;2 |
| Rothman, L. S., I. E. Gordon, Y. Babikov, et al., 2013: The HITRAN2012 molecular spectroscopic database. J. Quant. Spectrosc. Radiat. Transfer, 130, 4–50. DOI:10.1016/j.jqsrt.2013.07.002 |
| Rozanov, V. V., D. Diebel, R. J. D. Spurr, et al., 1997: GOMETRAN: A radiative transfer model for the satellite project GOME, the plane-parallel version. J. Geophys. Res. Atmos., 102, 16683–16695. DOI:10.1029/96JD01535 |
| Rozanov, V. V., A. V. Rozanov, A. A. Kokhanovsky, 2014: Radiative transfer through terrestrial atmosphere and ocean: Software package SCIATRAN. J. Quant. Spectrosc. Radiat. Transfer, 133, 13–71. |
| Seftor, C. J., G. Jaross, M. Kowitt, et al., 2014: Postlaunch performance of the Suomi National Polar-orbiting Partnership Ozone Mapping and Profiler Suite (OMPS) nadir sensors. J. Geophys. Res. Atmos., 119, 4413–4428. DOI:10.1002/2013JD020472 |
| Spurr, R., J. Wang, J. Zeng, et al., 2012: Linearized T-matrix and Mie scattering computations. J. Quant. Spectrosc. Radiat. Transfer, 113, 425–439. DOI:10.1016/j.jqsrt.2011.11.014 |
| Spurr, R. J. D., 2006: VLIDORT: A linearized pseudo-spherical vector discrete ordinate radiative transfer code for forward model and retrieval studies in multilayer multiple scattering media. J. Quant. Spectrosc. Radiat. Transfer, 102, 316–342. DOI:10.1016/j.jqsrt.2006.05.005 |
| Spurr, R. J. D., Kurosu T. P., and K. V. Chance, 2001: A linearized discrete ordinate radiative transfer model for atmosphe-ric remote-sensing retrieval. J. Quant. Spectrosc. Radiat. Transfer, 68, 689–735. DOI:10.1016/S0022-4073(00)00055-8 |
| Tilstra, L. G., O. N. E. Tuinder, P. Wang, et al., 2017: Surface reflectivity climatologies from UV to NIR determined from Earth observations by GOME-2 and SCIAMACHY. J. Geophys. Res. Atmos., 122, 4084–4111. DOI:10.1002/2016JD025940 |
| Tsay, S. C., and K. Stamnes, 1992: Ultraviolet radiation in the Arctic: The impact of potential ozone depletions and cloud effects. J. Geophys. Res. Atmos., 97, 7829–7840. DOI:10.1029/91JD02915 |
| van der Leun, J. C., and F. R. de Gruijl, 1993: Influences of ozone depletion on human and animal health. UV-B Radiation and Ozone Depletion: Effects on Humans, Animals, Plants, Microorganisms, and Materials, M. Tevini, Ed., Lewis Publishers, Ann Arbor MI, 95–123. |
| Wang, J., X. G. Xu, S. G. Ding, et al., 2014: A numerical testbed for remote sensing of aerosols, and its demonstration for evaluating retrieval synergy from a geostationary satellite constellation of GEO-CAPE and GOES-R. J. Quant. Spectrosc. Radiat. Transfer, 146, 510–528. DOI:10.1016/j.jqsrt.2014.03.020 |
| Zeng, J., R. McKenzie, K. Stamnes, et al., 1994: Measured UV spectra compared with discrete ordinate method simulations. J. Geophys. Res. Atmos., 99, 23019–23030. DOI:10.1029/94JD02145 |
 2019, Vol. 33


