The Chinese Meteorological Society
Article Information
- HU, Hao, Fuzhong WENG, Yang HAN, et al., 2019.
- Remote Sensing of Tropical Cyclone Thermal Structure from Satellite Microwave Sounding Instruments: Impacts of Background Profiles on Retrievals. 2019.
- J. Meteor. Res., 33(1): 89-103
- http://dx.doi.org/10.1007/s13351-019-8094-1
Article History
- Received June 14, 2018
- in final form October 16, 2018
2. State Key Laboratory of Severe Weather, Chinese Academy of Meteorological Sciences, China Meteorological Administration, Beijing 100081
The warm core structure, which means that the temperature within the eye region of a tropical cyclone (TC) is warmer than the environment, is one of the most distinguishing characteristics of TCs. This thermal structure could be attributed to the subsidence of large scale circulation near the eye region and is essential to the TC formation and intensification. Aircraft measurements flying at different levels of Hurricanes Cleo (1958) and Hilda (1964) showed that the maximum perturbation temperature occurred near 250–300 hPa (La Seur and Hawkins, 1963; Hawkins and Rubsam, 1968). But soon after, another lower warm core near 600–650 hPa was found in Hurricane Inez (1966) (Hawkins and Imbembo, 1976). Stern and Nolan (2012) proposed that this low-level warm core (maximized at 4–8 km in their experiments) should be the major one, compared with the upper-level warm core (maximized at 13–14 km in their experiments) in their idealized simulation. However,Chen et al. (2011) and Chen and Zhang (2013) pointed out that the formation of the upper-level warm core helped to trigger rapid intensification of Hurricane Wilma (2005). But Stern and Zhang (2016) thought that the hydrostatic balance does not require such a relationship between the height of the warm core and either intensity or intensity change. They argued that the choice of the environment reference profile could affect the height of warm core. Thus, the relationship of TC vertical thermal structure and TC intensity is still a controversy.
The satellite microwave observations could be an important way to identify the vertical thermal structure of TCs. Generally, there are two ways to retrieve the thermal structure from satellite microwave observations: the statistical algorithm and the one-dimensional variation algorithm (1DVAR). Knaff et al. (2004) used the Advanced Microwave Sounding Unit-A (AMSU-A) temperature soundings to understand the warm core structure as well as the balanced tangential wind with a statistical technique (Knaff et al., 2000). They used 23 pressure levels between 920 and 50 hPa and found a warm core at around 12-km height composited from 186 cases. However, their result was questioned by Stern and Nolan (2012) due to its insufficient resolution as well as the unexpected low-level negative temperature perturbation associated with the scattering effects. Starting from 28 October 2011, the Advanced Technology Microwave Sounder (ATMS) was launched onboard Suomi National Polar-orbiting Partnership (NPP) satellite. The instrument has 22 channels containing both temperature and humidity soundings, and the spatial resolution for temperature sounding channels of ATMS (32 km at nadir) is higher than that of AMSU-A (48 km at nadir) (Weng et al., 2013). Using ATMS observations and an AMSU-A retrieval algorithm developed by Zhu et al. (2002), Zhu and Weng (2013) retrieved the warm core structure of 10 cases, finding that the ATMS derived warm core has a close relationship with TCs intensity. More recently, Tian and Zou (2016) and Lin and Weng (2018) improved this algorithm by modifying the regression coefficients. They both obtained a reasonable warm core structure, but the scattering effects were still evident since all of their cases had an unexpected cold anomaly in the low-level thermal structure, especially for those cases with strong intensity.
Though many studies have used a variational approach to assimilate satellite microwave observations (e.g., Liu and Weng, 2005; Geer et al., 2008; Boukabara et al., 2011), few studies have tried to understand how the TC thermal structure retrieved from microwave sounders is affected by background profiles. More recently, Han and Weng (2018) (hereinafter HW18) designed a Microwave Retrieval Testbed (MRT) and retrieved reasonable warm core structures for hurricanes using ATMS observations. Using the US standard atmospheric profiles as both the background and the first guess profiles, and the Community Radiative Transfer Model (CRTM) as the forward operator, HW18 evaluated the thermal structure as well as the channel impacts on the retrieved structures. Their results showed a reasonable warm core structure when using observations from ATMS channels 4–15. This could be attributed to the fact that the strong scattering from the high frequency water vapor sounding channels is avoided in the forward model. However, avoiding those high frequency channels may lose water vapor profile information at the same time and a low-level cold pool is still present for some cases (see HW18), which is similar with the retrieved results from the regression-based algorithms.
There are two clearly distinguishable types of precipitation: stratiform precipitation falling from nimbostratus clouds and convective precipitation falling from active cumulus and cumulonimbus clouds. The structure of these two precipitation types differs substantially in air motion, radar-echo structure, and microphysical process (Houze, 2014). These differences may result in differences in temperature and humidity profiles. Recently, Wang and Fu (2017) found that the temperature anomaly in convective precipitation is cooler in the low troposphere and warmer in the middle troposphere. According to the 1DVAR algorithm, the background and first guess profiles could both affect the retrieval results. Since the high frequency channels in ATMS is more sensitive to precipitation, the use of cloud-based background and first guess profiles could improve the retrieval results through their constraints.
This study focusses on the impact of cloud-based background profiles on the retrieved TCs’ thermal structure. The remainder of the paper is organized as follows. Section 2 describes profile datasets and their grouping methodology. The MRT is also introduced and the cloud-based profiles are derived. Section 3 shows the impact of background profiles on the retrieved TC thermal structure. Section 4 illustrates the multi-case experiments and the product assessments using Global Positioning System (GPS) dropsonde profiles. The final section summarizes the major conclusions of this study.
2 Data and methodology 2.1 Microwave Remote Sensing Testbed (MRT)The MRT was described in HW18. It uses CRTM as its forward operator, including a radiance preprocessing and one-dimension variational (1DVAR) system. It has a good overall performance in retrieving the atmospheric temperature and moisture profiles under all-weather applications. In hurricane atmosphere, it can also reliably retrieve the warm core near 200 hPa for the mature storms (see HW18 for more details). The 1DVAR iteration is expressed as follows:
| $\Delta {{ X}_{n + 1}} = \left[ {{ BX}_n^{\rm T}{{\left({{{ K}_n}{ BK}_n^{\rm T} + { E}} \right)}^{ - 1}}} \right]\left[ {{{ Y}^m} - { Y}\left({{{ X}_n}} \right) + {{ K}_n}\Delta {{ X}_n}} \right], $ |
where Xn is the retrieved state vectors at iteration index n; Y(Xn) is the forward operator using Xn as the input; Ym is the observed radiance (or brightness temperature); B is the background error covariance matrix; Kn is the Joco-bian of Y(Xn) with respect to Xn under the assumption that Y(Xn) is locally linear around Xn; E is the error covariance of the forward operator and/or instrument noise; ΔXn and ΔXn+1 represent the departure from background vectors at iteration index n and n + 1, respectively. In this study, the background covariance was inherited from the Microwave Integrated Retrieval System (MIRS), which is generated by using the ECMWF 60-layer sample analysis dataset for clear sky conditions and the Penn State/NCAR Mesoscale Model 5 hydrometeor dataset for clouds over oceans (Boukabara et al., 2011). When retrieving ATMS observations, the instrument error covariance was computed based on the noise equivalent differential temperature (NeDT) dynamically monitored on-orbit. The forward operator noise was also inherited from MIRS (Boukabara et al., 2011).
The MRT flowchart is shown in Fig. 1. In this study, the first guess and the background profile are forced to be the same, leading ΔX0 to 0 at the first iteration. The convergent condition is a chi-square test that is described as follows:

|
| Figure 1 The flowchart of MRT 1DVAR iteration algorithm. |
| ${\chi ^2} = {\left[ {{{ Y}^m} - { Y}\left({{{ X}_n}} \right)} \right]^{\rm T}}{{ E}^{ - 1}}\left[ {{{ Y}^m} - { Y}\left({{{ X}_n}} \right)} \right] \leqslant 1.0.$ |
Also, the convergent condition is set to a criterion when the iteration time is larger than a certain value. In this study, the maximum iteration time is set respectively to 7, 15, and 20 for clear sky, stratiform, and convective precipitation areas. Some other quality control procedures are considered in MRT in order to avoid the extremely high or low retrieved results with some pre-defined bound values based on standard profiles (NOAA-88) and ECMWF interim reanalysis (ERA-Interim) dataset. Only retrieved profiles with temperature, skin temperature, relative humidity, and emissivity within the respective interval of (140 K, 350 K), (180 K, 350 K), (0, 100%), and (0, 1) are accepted as the final outcomes.
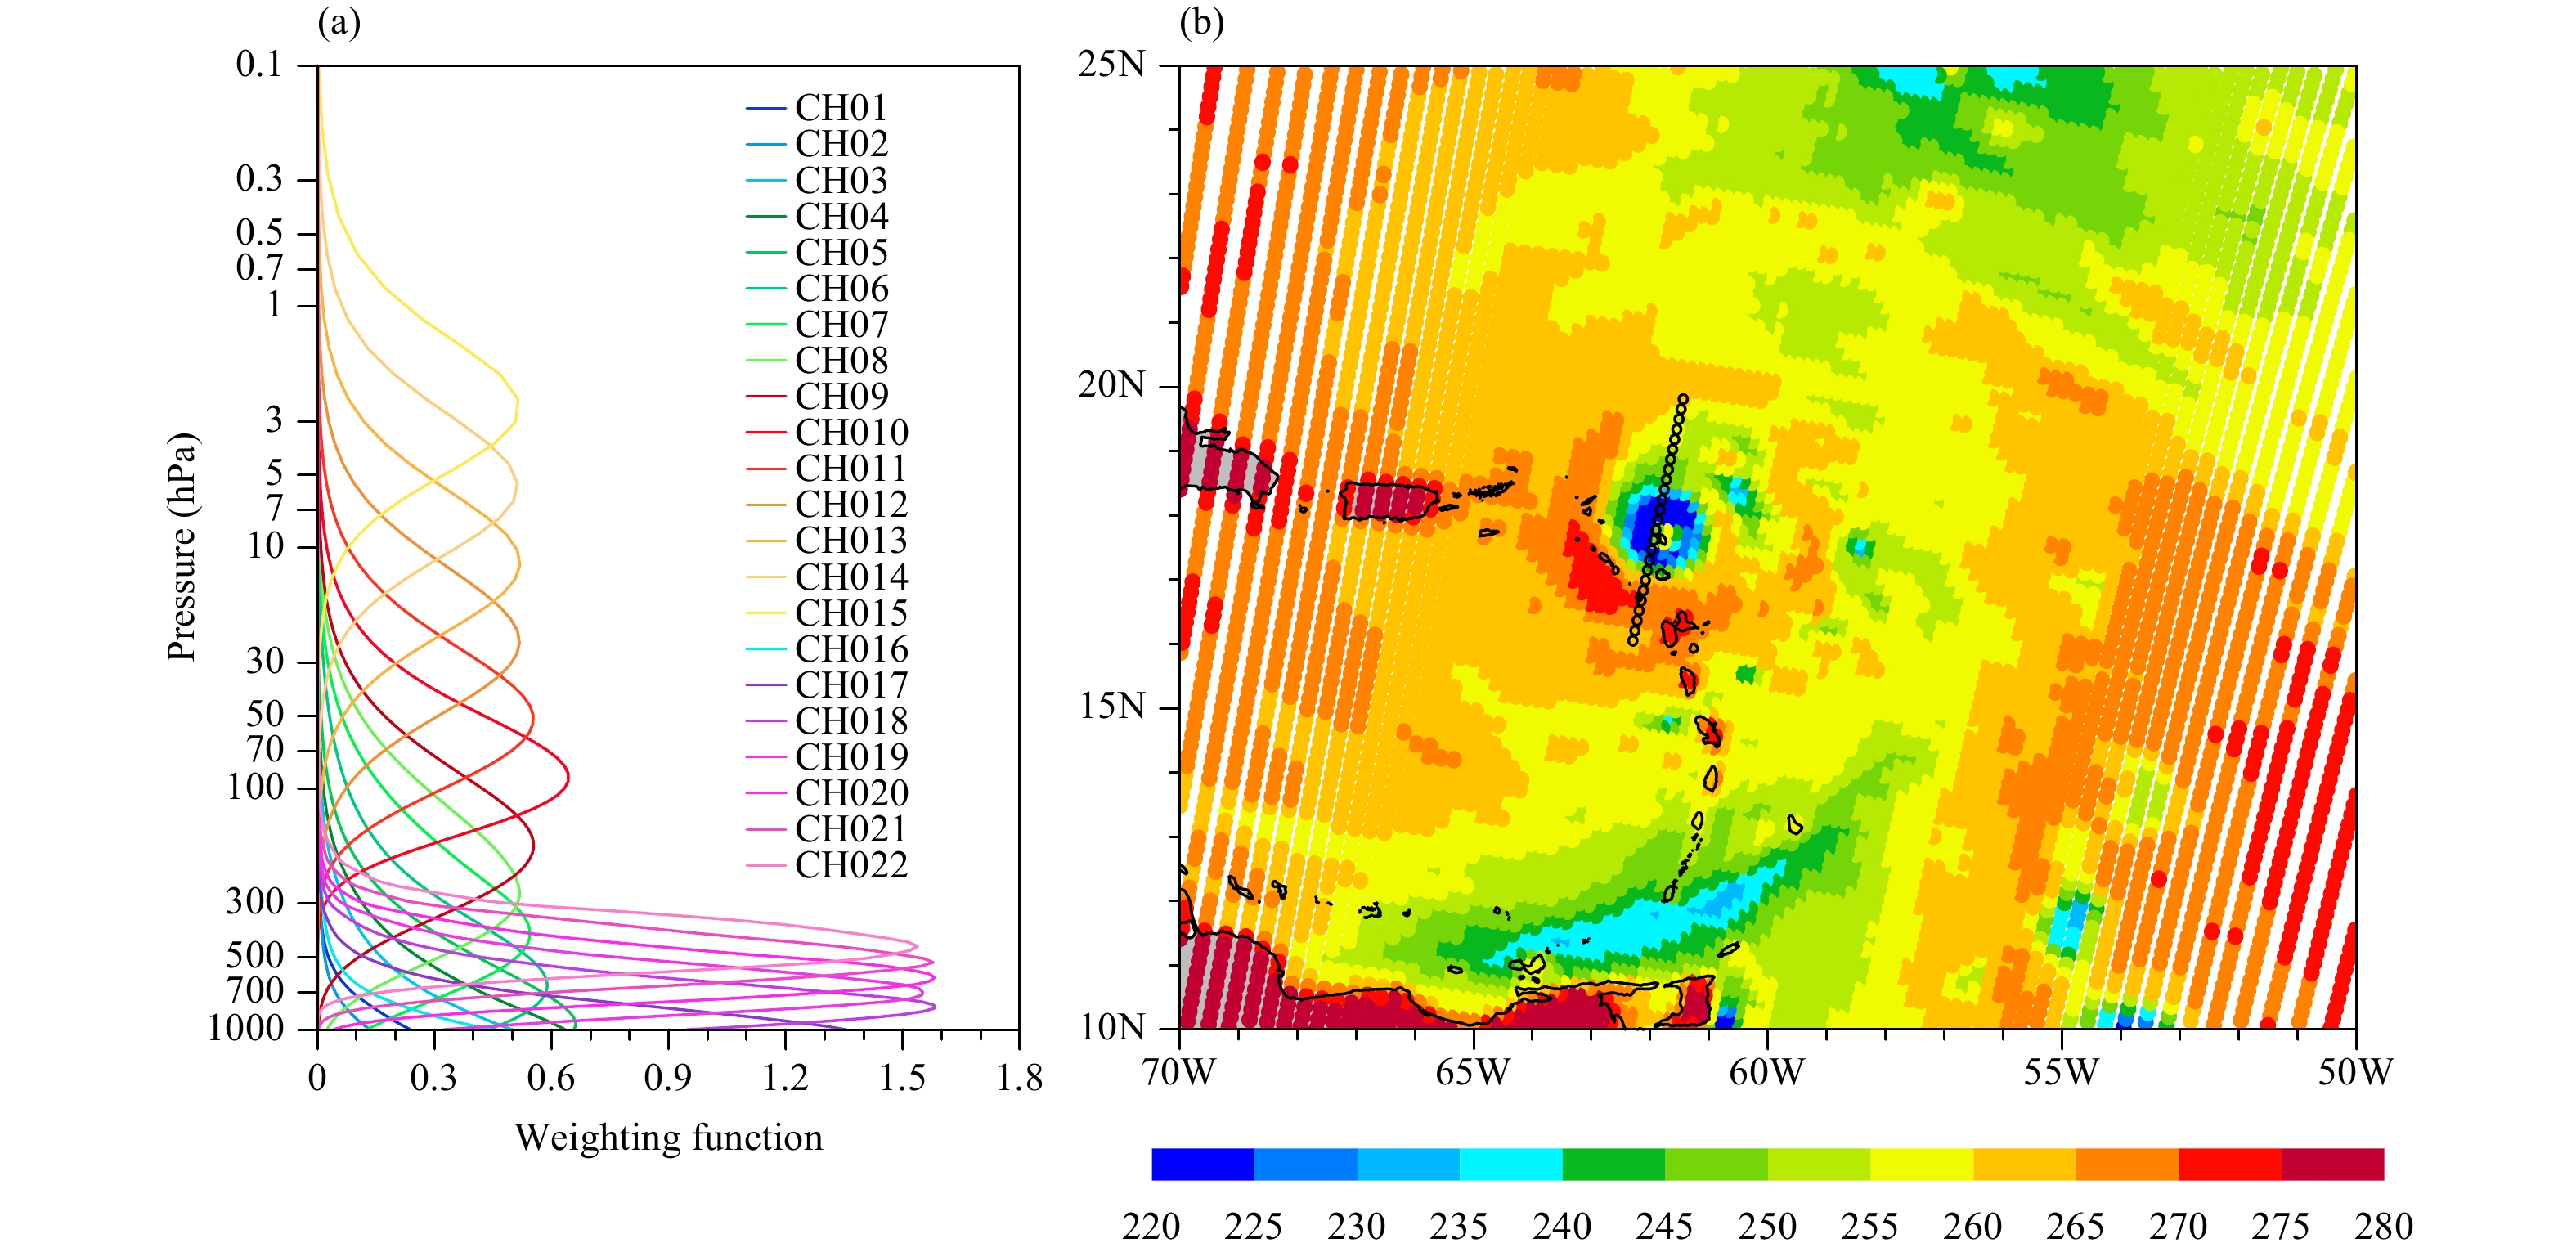
Currently, the MRT is tested with ATMS observations. ATMS contains 22 sounding channels at frequencies ranging from 23 to 183 GHz, including 5 window channels (channels 1–3, 16, 17), 12 oxygen absorption band channels (channels 3–15), and 5 water vapor absorption band channels (channels 18–22). The weighting functions of these 22 channels, calculated by using CRTM with the US standard atmospheric profile, are shown in Fig. 4a. The beam width of K/Ka bands (channels 1–2), V and W bands (channels 3–16), and G bands (channels 17–22) are 5.2°, 2.2°, and 1.1°, respectively, corresponding to 75-, 32-, and 16-km horizontal resolutions at nadir, respectively (JPSS ATMS SDR Science Team, 2013).
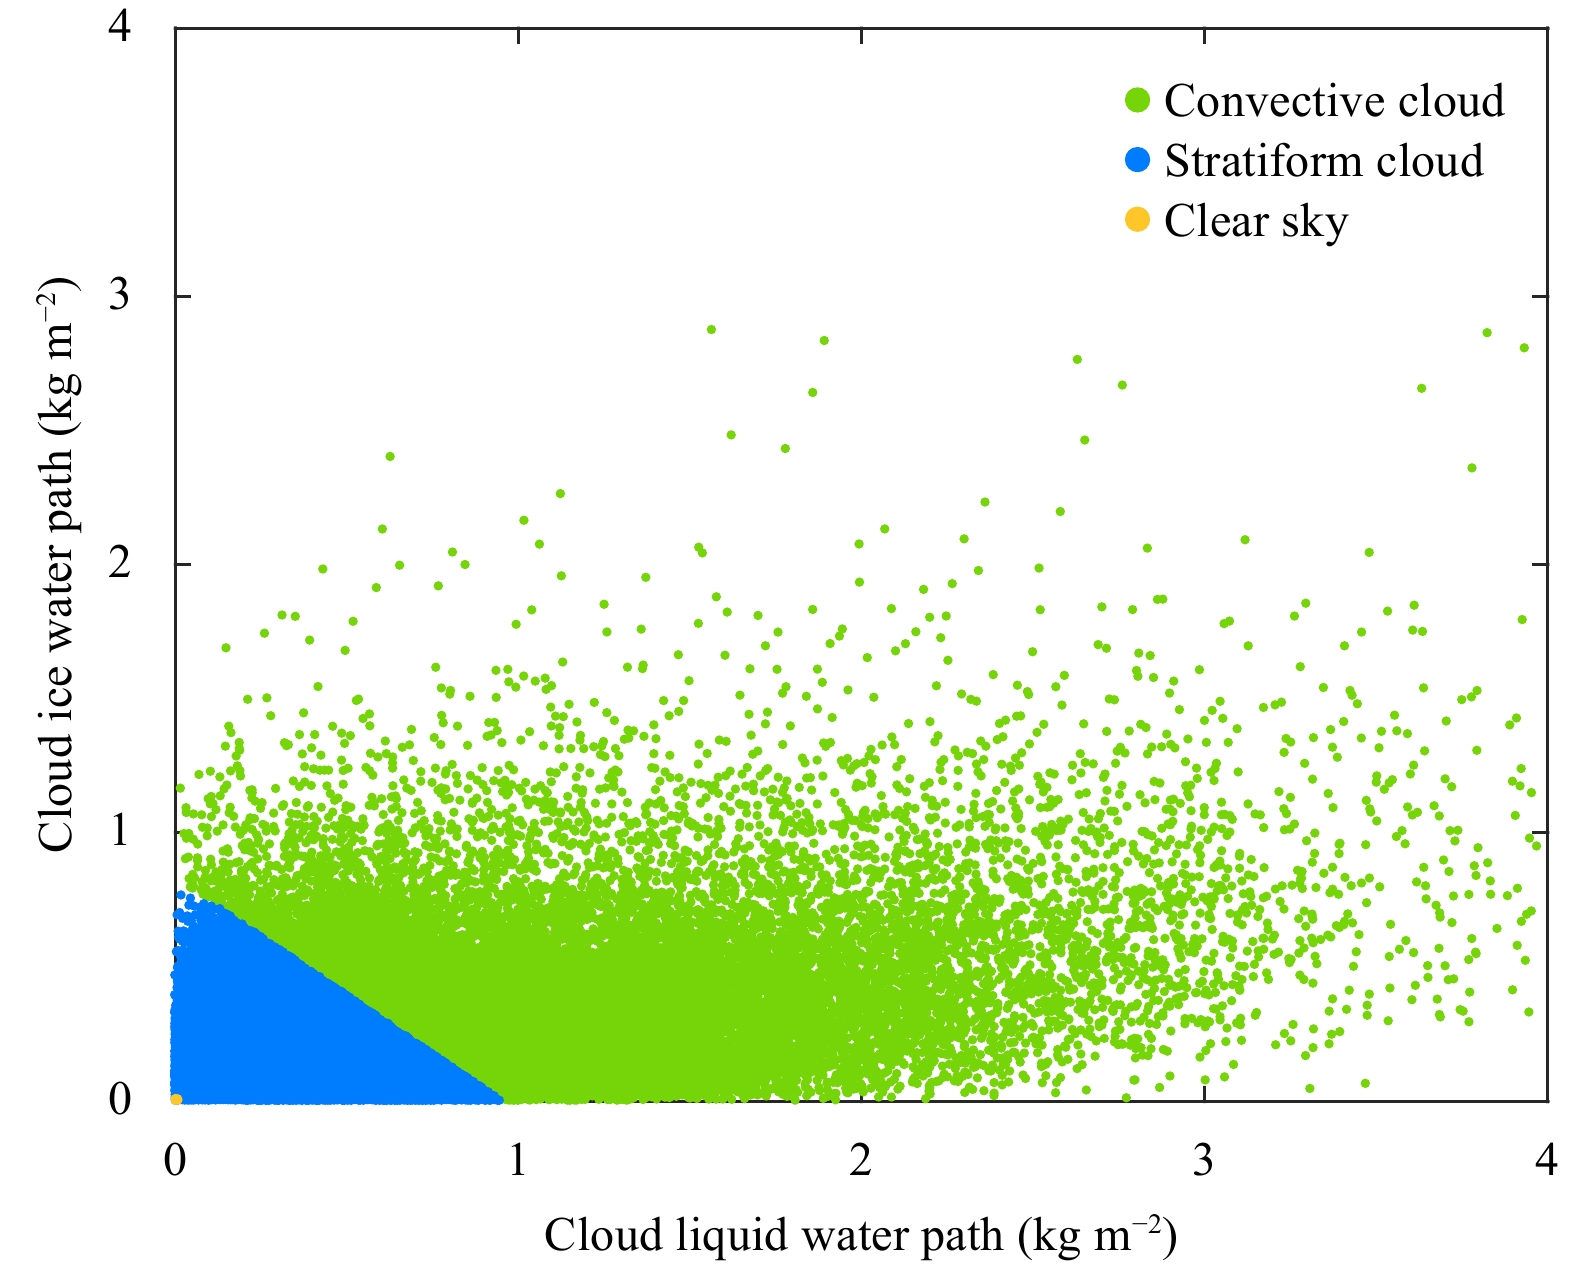
2.2 Cloud-based background profilesThe 6-h ERA-Interim dataset is utilized to calculate the background profiles, including a horizontal resolution of 0.75° longitude × 0.75° latitude at 60 model levels from 1979 to present year. Only temperature and speci-fic humidity profiles are classified according to cloud type as they differ a lot among different precipitation types. Cloud liquid water path (CLWP) and cloud ice water path (CIWP) are considered as the factors to categorize stratiform and convective precipitation.
The best-track data (known as Atlantic HURDAT2) of North Atlantic TCs from 1979 to 2016 are obtained from the National Hurricane Center (available online at http://www.nhc.noaa.gov/data/#hurdat). The HURDAT2 consists of 6-hourly TC center latitude and longitude, maximum 1-minute mean sustained surface wind speed (Vmax), storm central surface level pressure (SLP), and so on. All extratropical transition stages (cases with latitude larger than 40°N) and records after landfall are eliminated. Those records with the intensity weaker than category (Cat.) 1 of the Saffir–Simpson Hurricane Wind Scale (Vmax less than 64 kt, i.e., 33 m s–1) are also removed. Finally, a total of 3452 TC records are included in calculation of the background profiles.
The K-means clustering algorithm is an iterative, data-partitioning algorithm that partitions vectors (in this study CLWP and CIWP) into K clusters (in this study K equals to 2: stratiform and convective precipitation) such that the within-cluster sum of distance is minimized (Lloyd, 1982). In this study, the initial cluster centers are chosen randomly based on the range of vectors. The distance between all vectors to each centroid is calculated and each vector is assigned to the cluster with the closest centroid. After that, new centroid locations will be found based on those clusters. Repeating the above two steps will finally generate K-clusters. As the iteration time is set to 100, K-clustering results become stable.
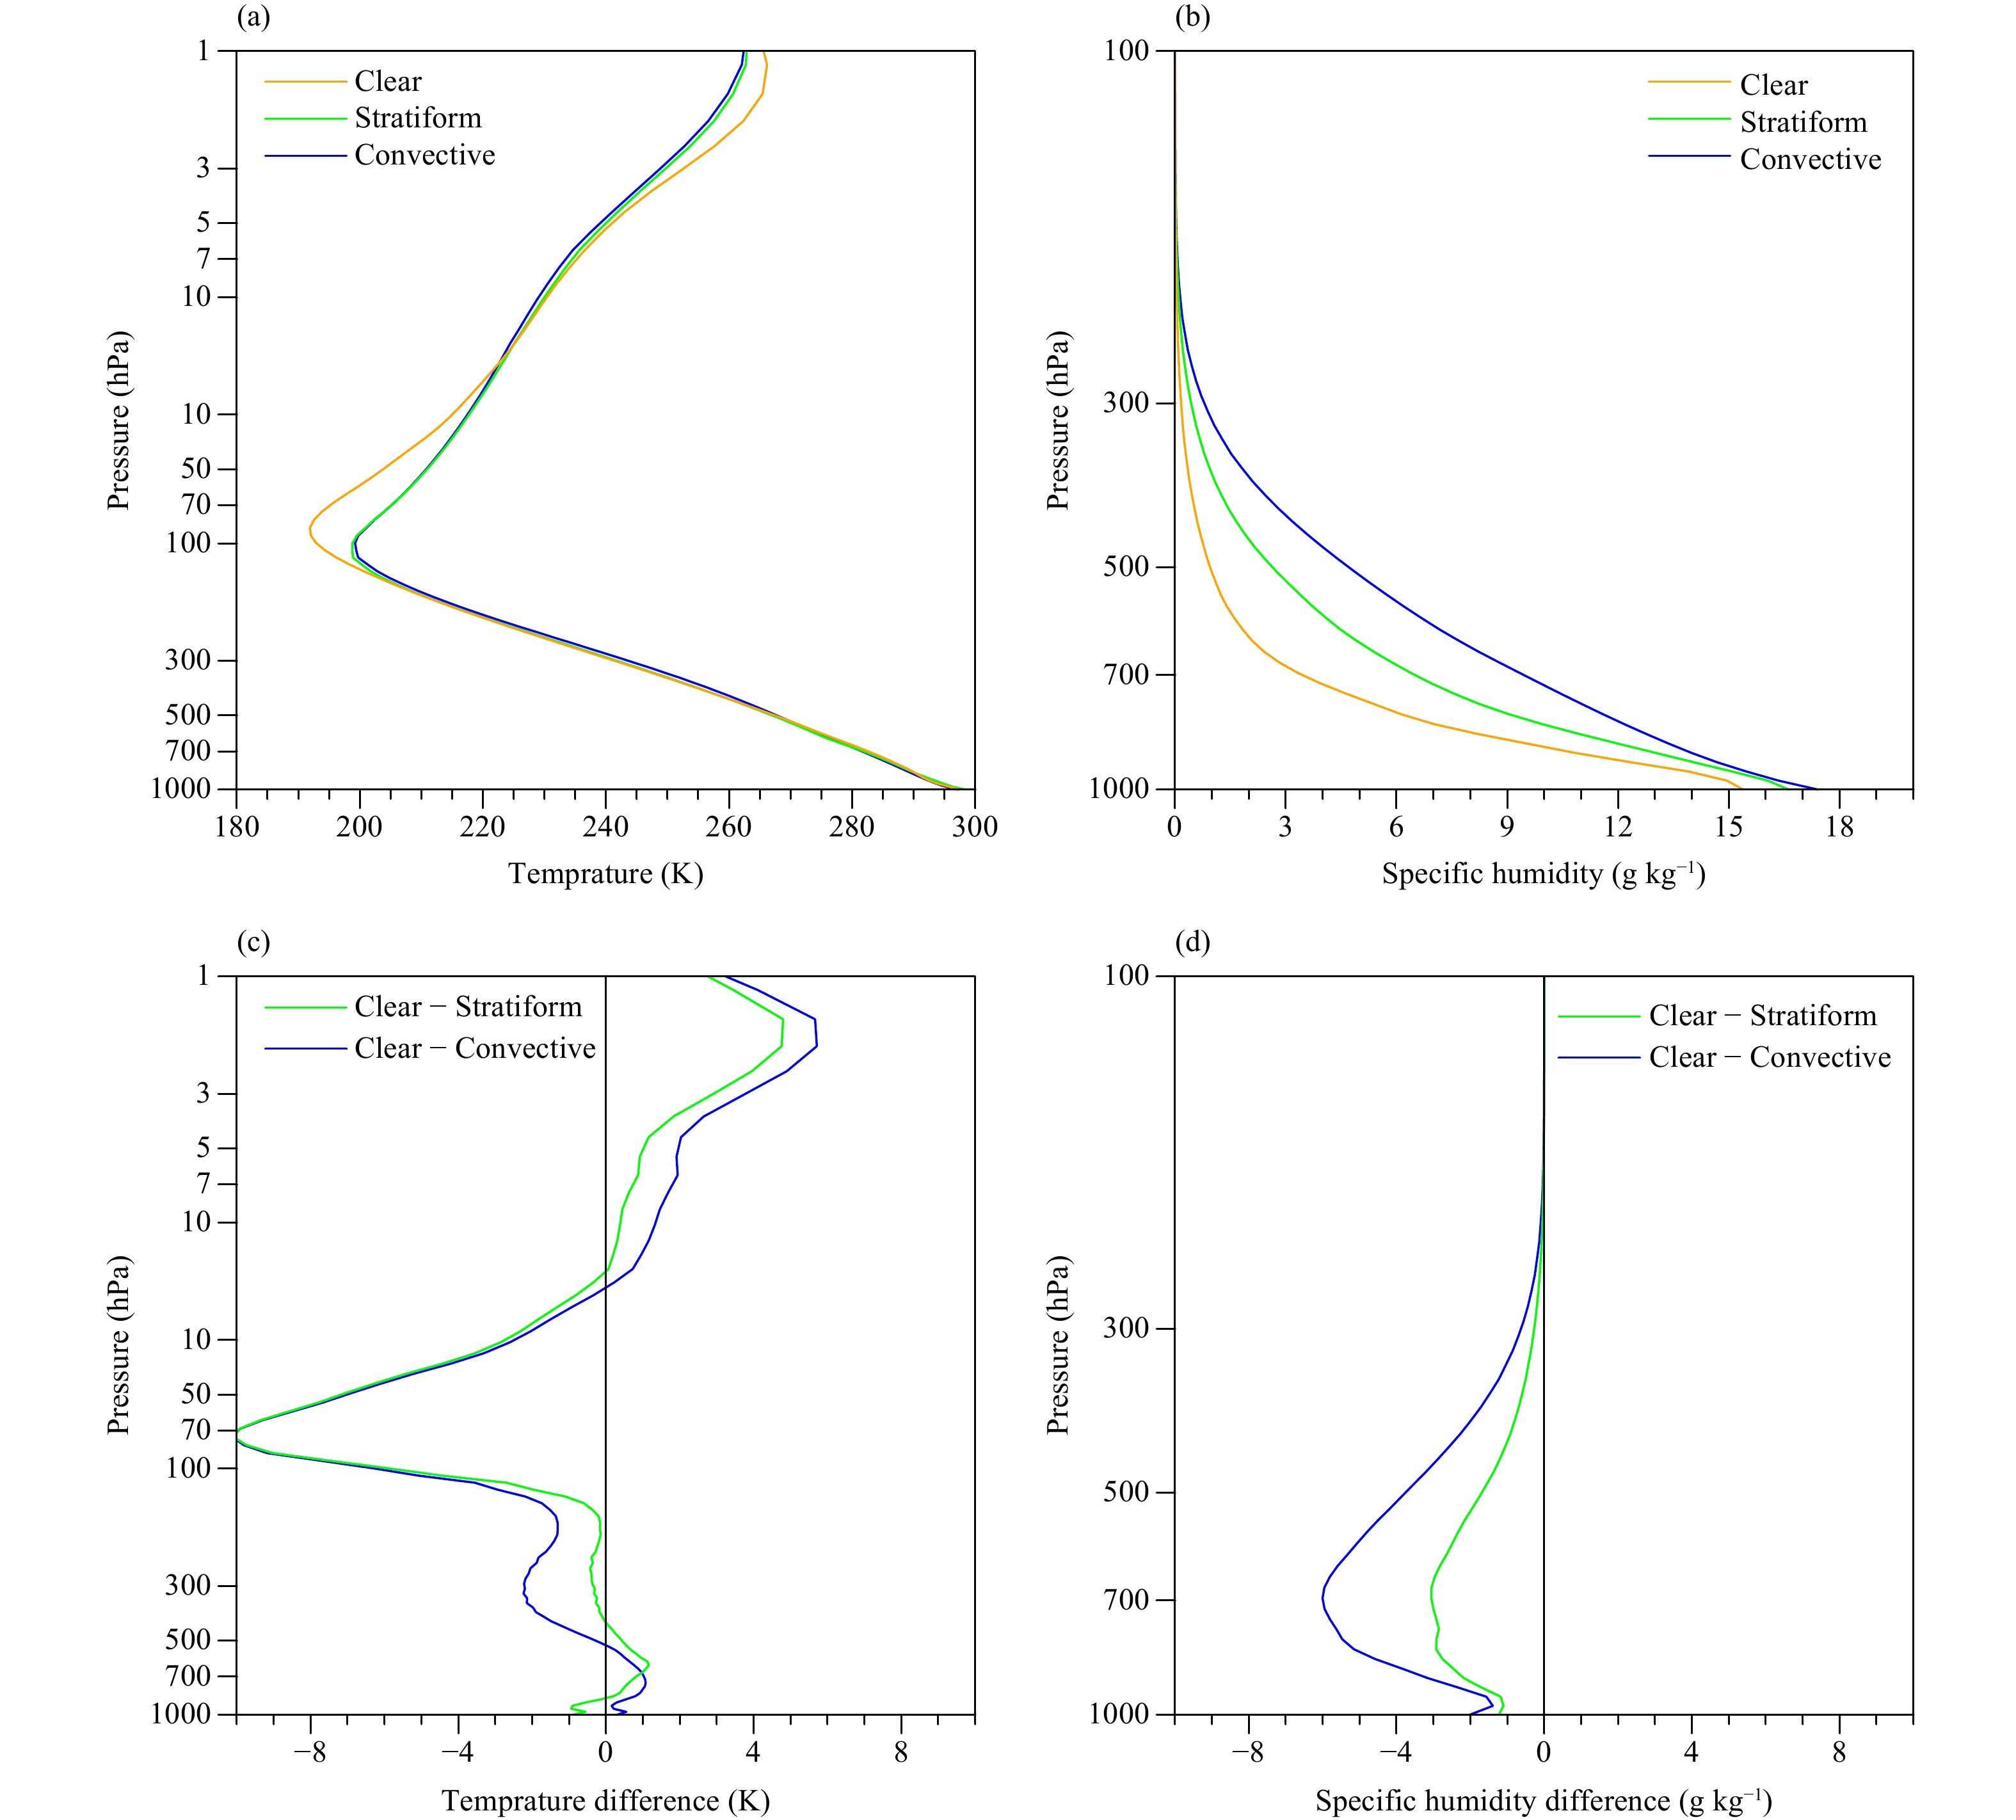
In ERA-Interim dataset from 1979 to 2016, we select the profiles within 500 km from hurricane centers. The profiles also include CLWP and CIWP and are used as the vectors in K-means clustering algorithm. Note that the profiles with both CLWP and CIWP smaller than 0.01 kg m–2 are considered as clear sky conditions and are excluded in the clustering process. Figure 2 shows the K-means clustering result of CLWP and CIWP, with blue, green, and orange points indicating the convective precipitation (34,172 vectors), stratiform precipitation (513,825 vectors), and clear sky condition (20,619 vectors), respectively. The mean profiles of stratiform (convective) precipitation clusters are used as the stratiform (convective) cloud background profiles, and the US standard profiles are used as the clear sky background profiles. These profiles are shown in Figs. 3a, b. The deviation between the convective (stratiform) profile and the clear sky profile (clear sky minus convective/stratiform) are shown in Figs. 3c, d. Generally, the temperature profiles have a larger difference in the upper atmosphere, as much as 9 K, occurring near the tropopause. The tropopause levels between ERA-Interim derived profile and US standard profile are substantially different. Meanwhile, the temperature in the low (middle) troposphere tends to be colder (warmer) under convective precipitation, which is consistent with Wang and Fu (2017). This could be attributed to the fact that there are more downdrafts in the low troposphere and more latent heat release in the middle troposphere under convective precipitation. The humidity profiles have larger difference in the troposphere, with the largest difference of around 5 g kg–1 occurring near 700 hPa.
|
| Figure 2 The categorization of profiles using K-means algorithm based on cloud liquid water path (CLWP) and cloud ice water path (CIWP). The orange, green, and blue scatters represent clear sky, stratiform precipitation, and convective precipitation, respectively. |
|
| Figure 3 Mean profiles of (a) air temperature and (b) specific humidity for hurricanes, with the orange, green, and blue curves representing clear sky, stratiform cloud, and convective cloud condition, respectively. Panels (c, d) show the temperature and specific humidity difference, respectively. The green (blue) curve in (c, d) indicates the difference between clear sky and stratiform (convective) cloud condition. |
Three experiments are designed and shown in Table 1 to illustrate the impacts of background profiles on the satellite sounding products. The control experiment, named as EXP_CTRL, uses the climatological standard tropical profiles as the background profiles. The EXP_GFS uses the Global Forecast System (GFS) 6-h forecast field (0.5° horizontal resolution, downloaded from ftp://nomads.ncdc.noaa.gov/GFS/Grid4/) linearly interpolated to ATMS field of views (FOVs) as the background profiles. The EXP_Cloud uses the cloud-based profiles in MRT as described in Section 2. All ATMS channels are utilized in these three experiments. In order to see the influence of these background profiles, both the background covariance matrix and the error covariance matrix remain similar among these experiments. Note that as the instrument error covariance was generated based on the NeDT values dynamically monitored on-orbit, it might be different among these experiments.
| Name | Background profiles |
| EXP_CTRL | Climatological standard tropical profiles |
| EXP_GFS | GFS 6-h forecast profiles |
| EXP_ Cloud | Cloud-based profiles |
The CLWP and a scatter index (SI) estimated from ATMS brightness temperature are used to identify the precipitation conditions. The algorithms for estimating the CLWP (Grody et al., 2001) and SI (Bennartz et al., 2002) are shown as follows:
| $\left\{ {\begin{aligned} & {\rm{CLWP}} = \cos {\rm{\theta }}\left[{\alpha _0} - \left({{\alpha _1} - {\alpha _2}{\rm{cos\, \theta }}} \right)\cos {\rm{\theta }} + {\alpha _3}\ln \left({285 - {\rm{T{b_1}}}} \right)\right. \\ & \quad\quad\quad\left. \,\,\,\,\,-\,\, {\alpha _4}\ln \left({285 - {\rm{T{b_2}}}} \right)\right]\\ & {{\rm{SI}} ={\rm{T{b_{16}}}} - {\rm{T{b_{17}}}} - \left({ 0.248\theta - 46.94 } \right)} \end{aligned}} \right., $ |
where θ represents the zenith angle; Tbch represents the brightness temperature at channel number ch; parameters αi (i = 0, 1, 2, 3, 4) are the regression coefficients for CLWP with values set to 8.240, 2.622, 1.846, 0.754, and 2.265, respectively. Note that the terms in brackets in the formula of SI approximates the difference between channels 16 and 17 under clear sky conditions, based on a global average (Bennartz et al., 2002). Though the above algorithms are tested for other microwave instruments such as AMSU/Microwave Humidity Sounder, these two estimations are also used in ATMS previously (Bormann et al., 2013; Zou et al., 2013). In this study, the convective precipitation is identified by CLWP when CLWP is greater than 1 kg m–2 or SI is greater than 20 K. The ATMS FOVs having CLWP less than 0.01 kg m–2 are considered as clear sky conditions; and the rest FOVs are treated as the stratiform precipitation. The background profiles in EXP_Cloud, as well as the iteration time mentioned in Section 2, are chosen based on these parameters and thresholds.
Hurricane Irma was one of the most catastrophic TCs in the 2017 Atlantic hurricane season, with its intensity sustained at Cat. 5 for 72 h. In this section, the ATMS observations around 0530 UTC 6 September 2017 are used to test the cloud-based background profiles, at which time the storm intensity was around 42 m s–1 (82 kt). Figure 4b shows the observed brightness temperature at channel 16. Due to Irma’s high intensity, a clear eye wall, in which the brightness temperature is significantly lower than its surroundings (lower than 225 K), and a distinct spiral rain band structure, are identified. The black line with small black circles indicates a cross-section along which the thermal structure of Irma is analyzed as follows.
|
| Figure 4 (a) The vertical distribution of weighting functions for different ATMS channels. (b) Observed brightness temperature of Hurricane Irma around 0530 UTC 6 September 2017. |
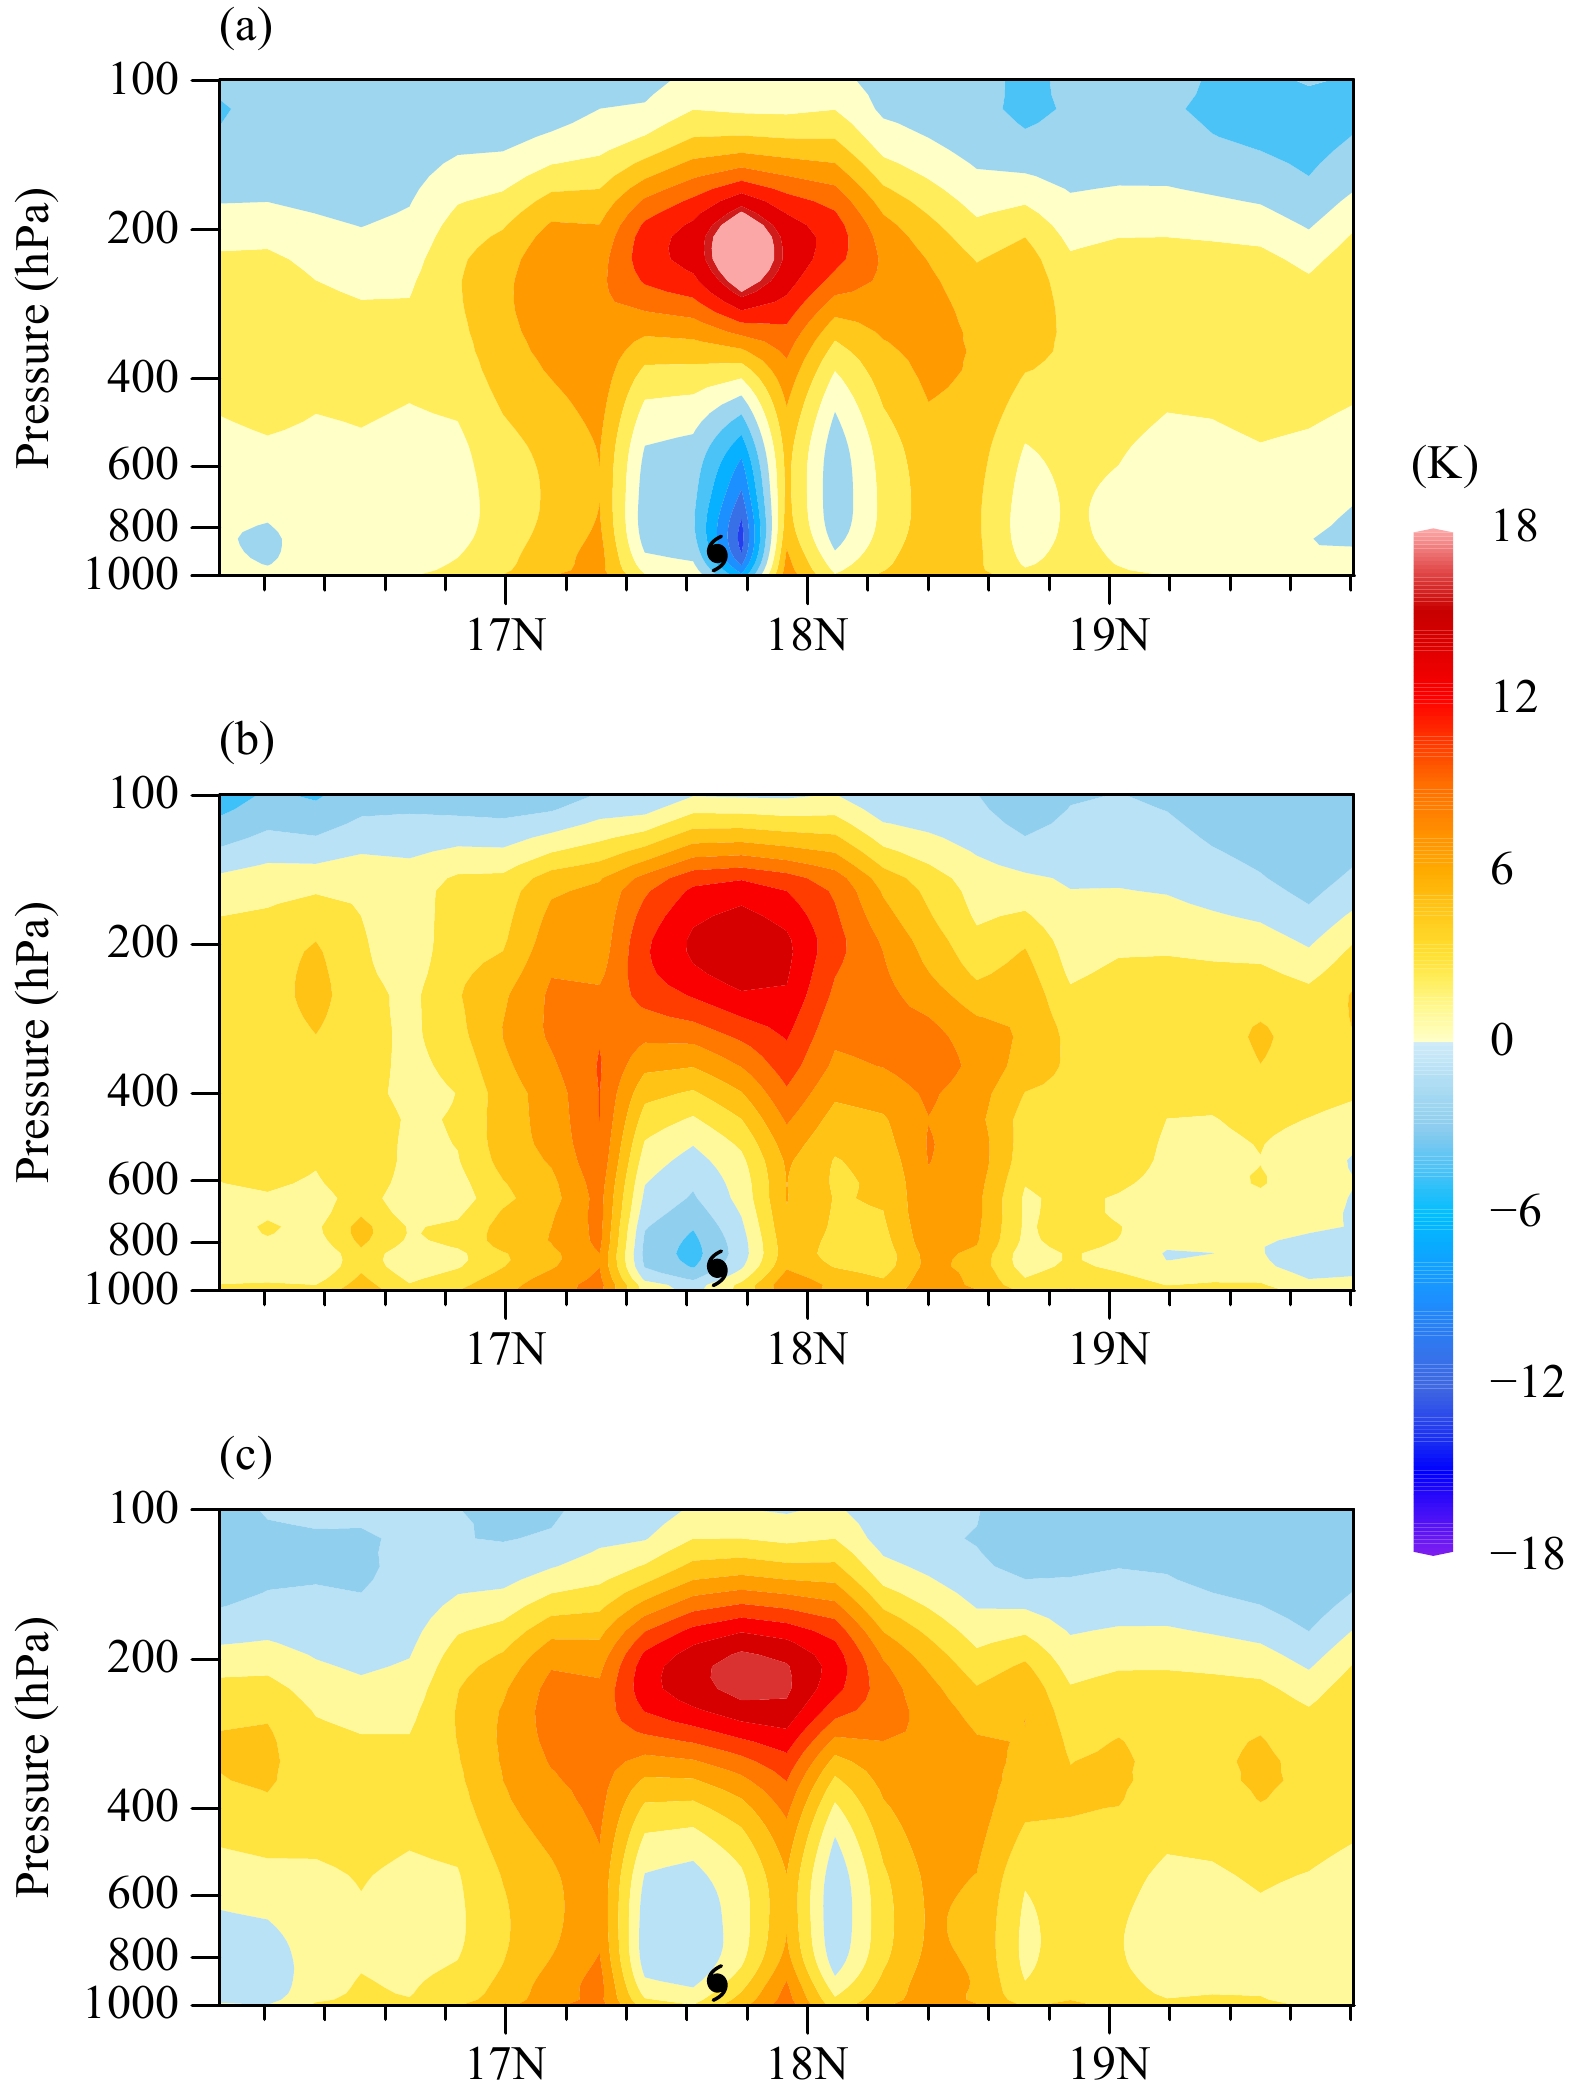
Figure 5 displays the warm core structure of Hurricane Irma based on EXP_CTRL, EXP_GFS, and EXP_Cloud. The temperature anomaly is calculated between the air temperature and the average temperature within 2000 km from the storm center. The warm core structure could be found in all these experiments, with a maximum temperature anomaly greater than 15 K occurring around 200 hPa. Similar to that in HW18 and other previous retrieval results (Tian and Zou, 2016; Lin and Weng, 2018), an unexpected low-level cold pool structure around the storm center could be found in EXP_CTRL, with the temperature anomaly lower than –12 K. This cold pool could be partially caused by scattering of heavy precipitation (Lin and Weng, 2018). The thermal structure will become more reasonable when only using ATMS channels 4–15 according toHW18.
|
| Figure 5 Height–latitude cross-sections of the retrieved warm core structure of Hurricane Irma around 0600 UTC 6 September 2017 from (a) EXP_CTRL, (b) EXP_GFS, and (c) EXP_Cloud. |
The scattering effect could be reduced in both EXP_GFS and EXP_Cloud. With the background field replaced by the GFS 6-h forecast field, the cold pool intensity becomes smaller, about –6 K (Fig. 5b). It is further reduced when using the cloud-based background profiles. The lowest temperature anomaly is less than –2 K (Fig. 5c). Also, the thermal structure in EXP_Cloud is more reasonable than the results in HW18 and this series of studies, which only used the ATMS channels 4–15. The observations of all ATMS channels could be used in retrievals when the cloud-based profiles are used as 1DVAR background.
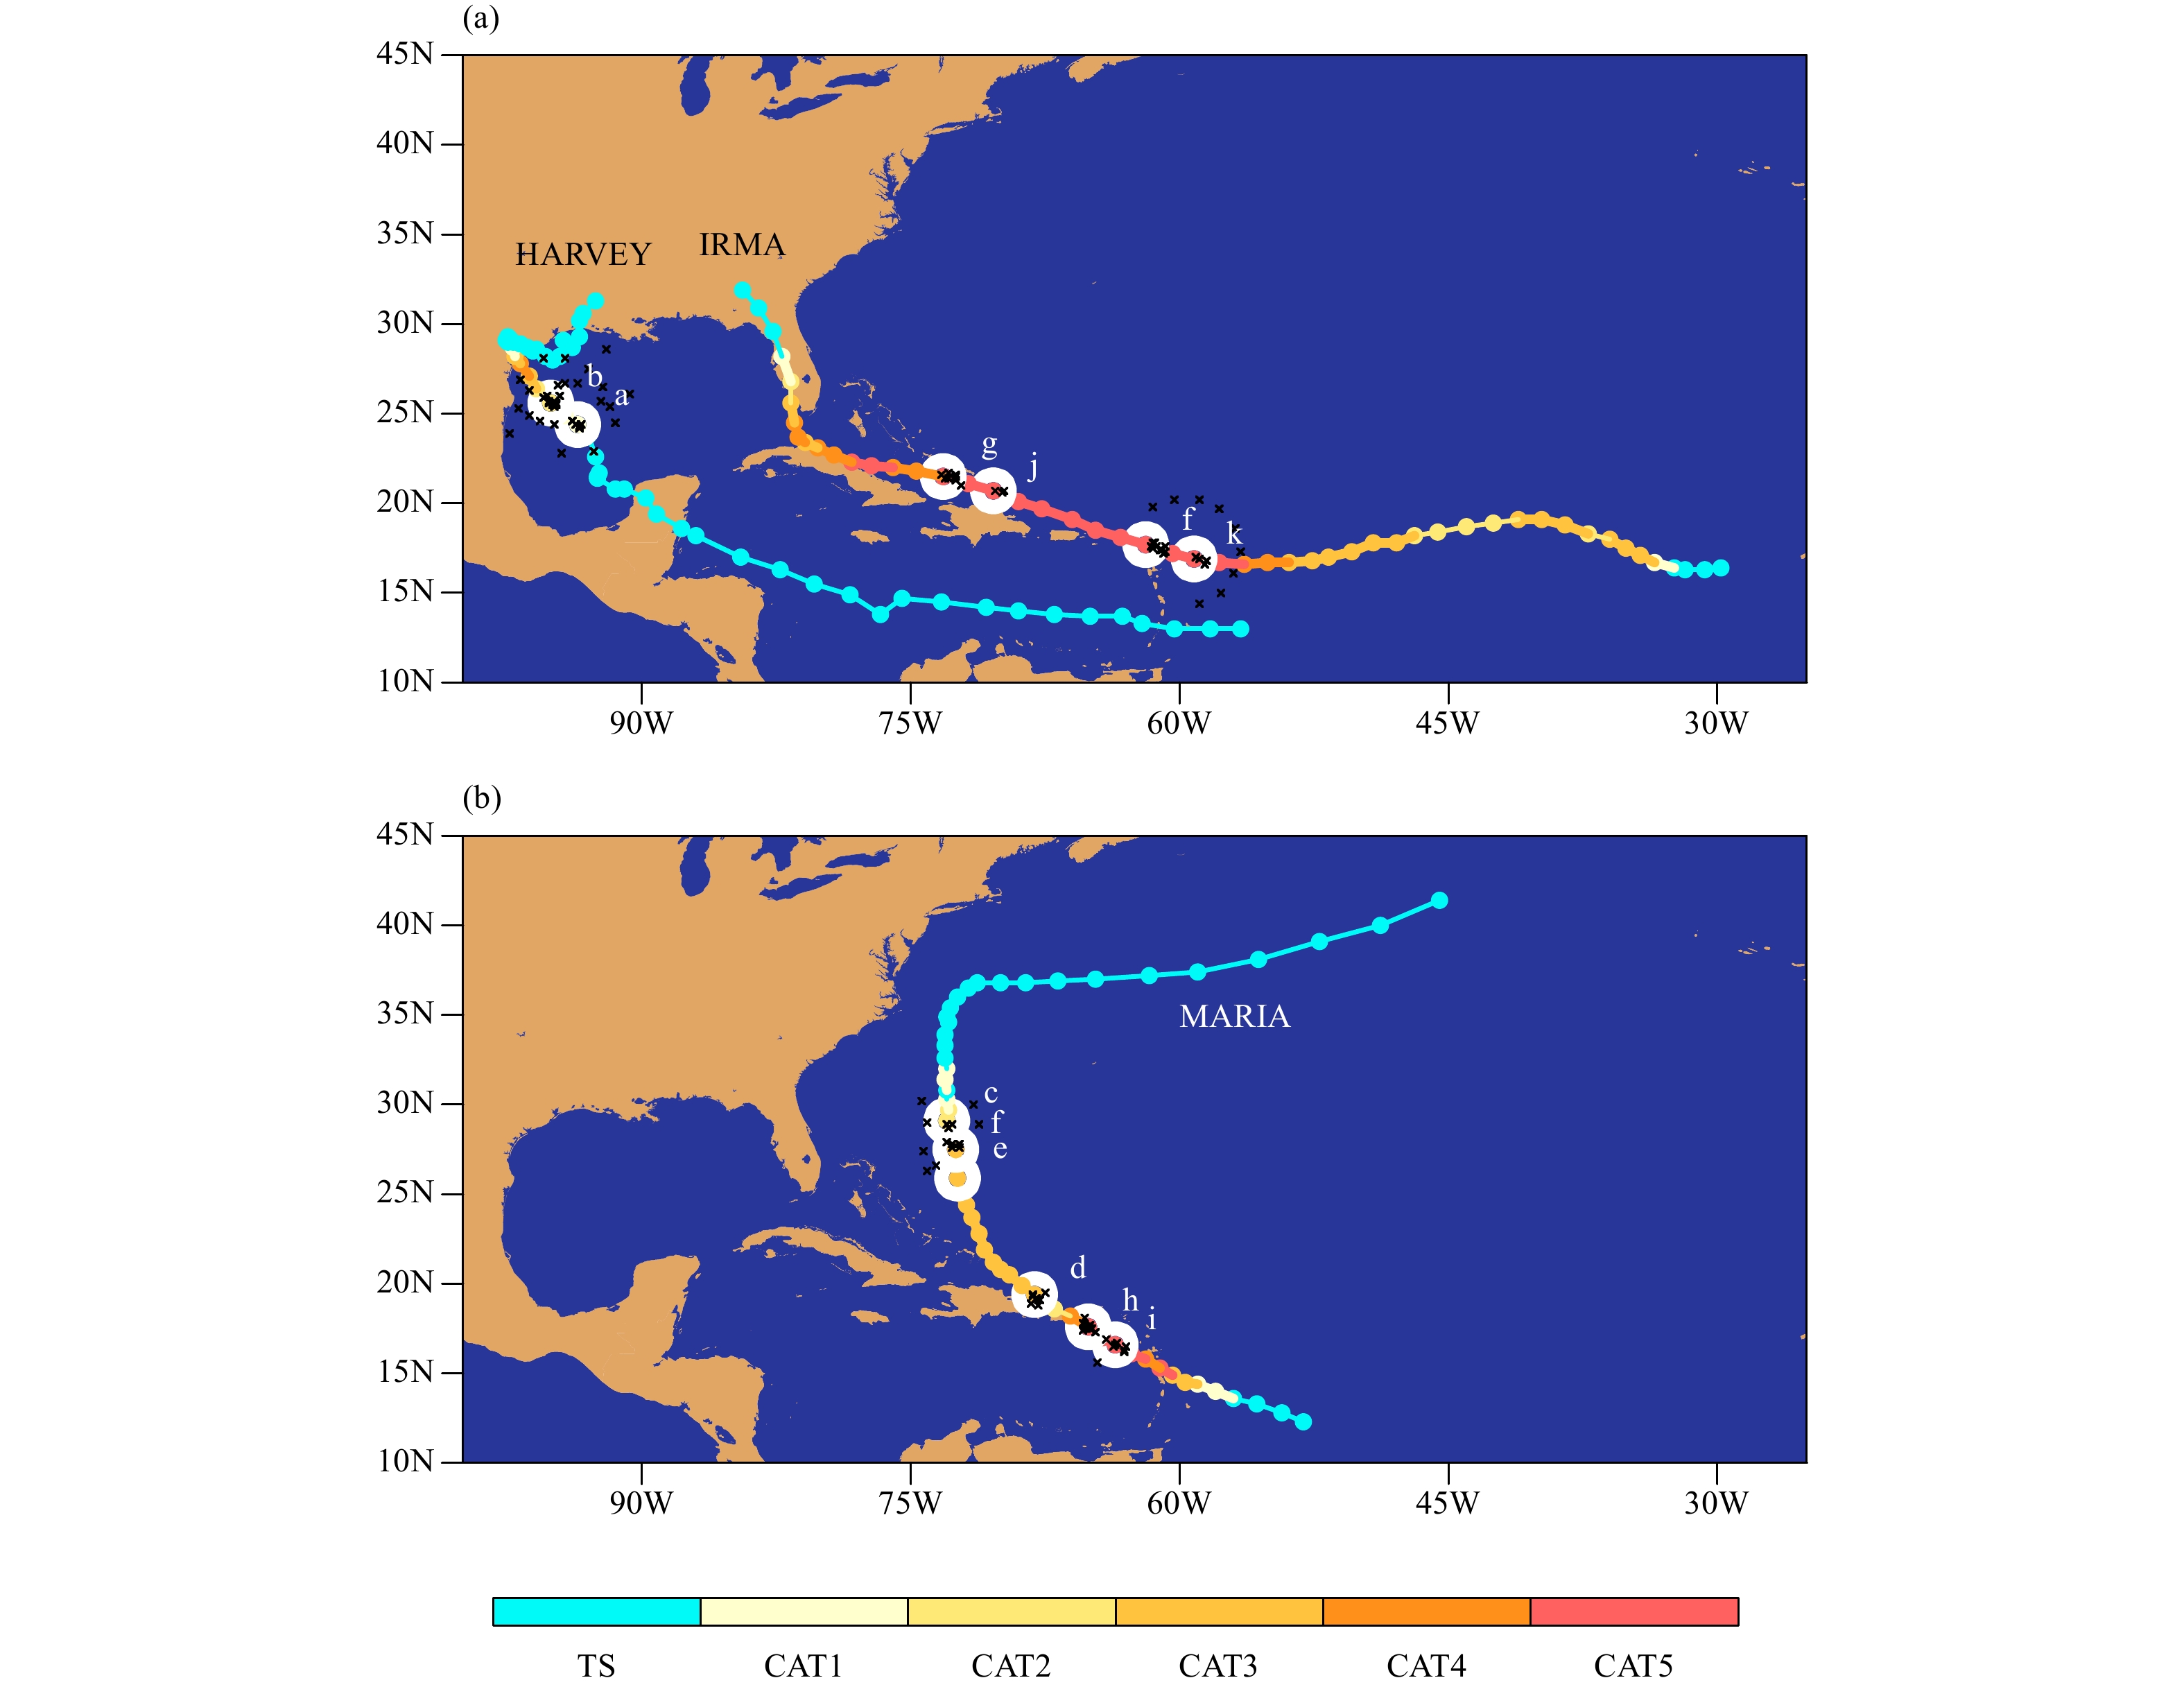
4 Multi-case experimentsIn order to test the performance of cloud-based background profiles, three TCs (Hurricanes Harvey, Irma, and Maria) during the 2017 hurricane season are chosen as examples in the multi-case experiments. The cloud-based background profiles, GFS forecast field background profiles, and the standard tropical background profiles are considered. Note that only those TCs stronger than Cat. 1 with its center observed by ATMS over ocean are selected. Finally, 12 TC records are picked up in this study, with 6 Cat. 5 records, 3 Cat. 3 records, 2 Cat. 2 records, and 1 Cat. 1 record. The distribution of these TC records is shown in Fig. 6, with white circles indicating TC locations and the color indicating TC intensity.
|
| Figure 6 Tracks of Hurricanes (a) Harvey and Irma, and (b) Maria in 2017. The white circles represent the records considered in the multi-case experiments, with the right-side characters (a–l) representing the indexes of the panels in Figs. 7–12. The cross symbols indicate locations of the GPS dropsondes used in the assessment. |
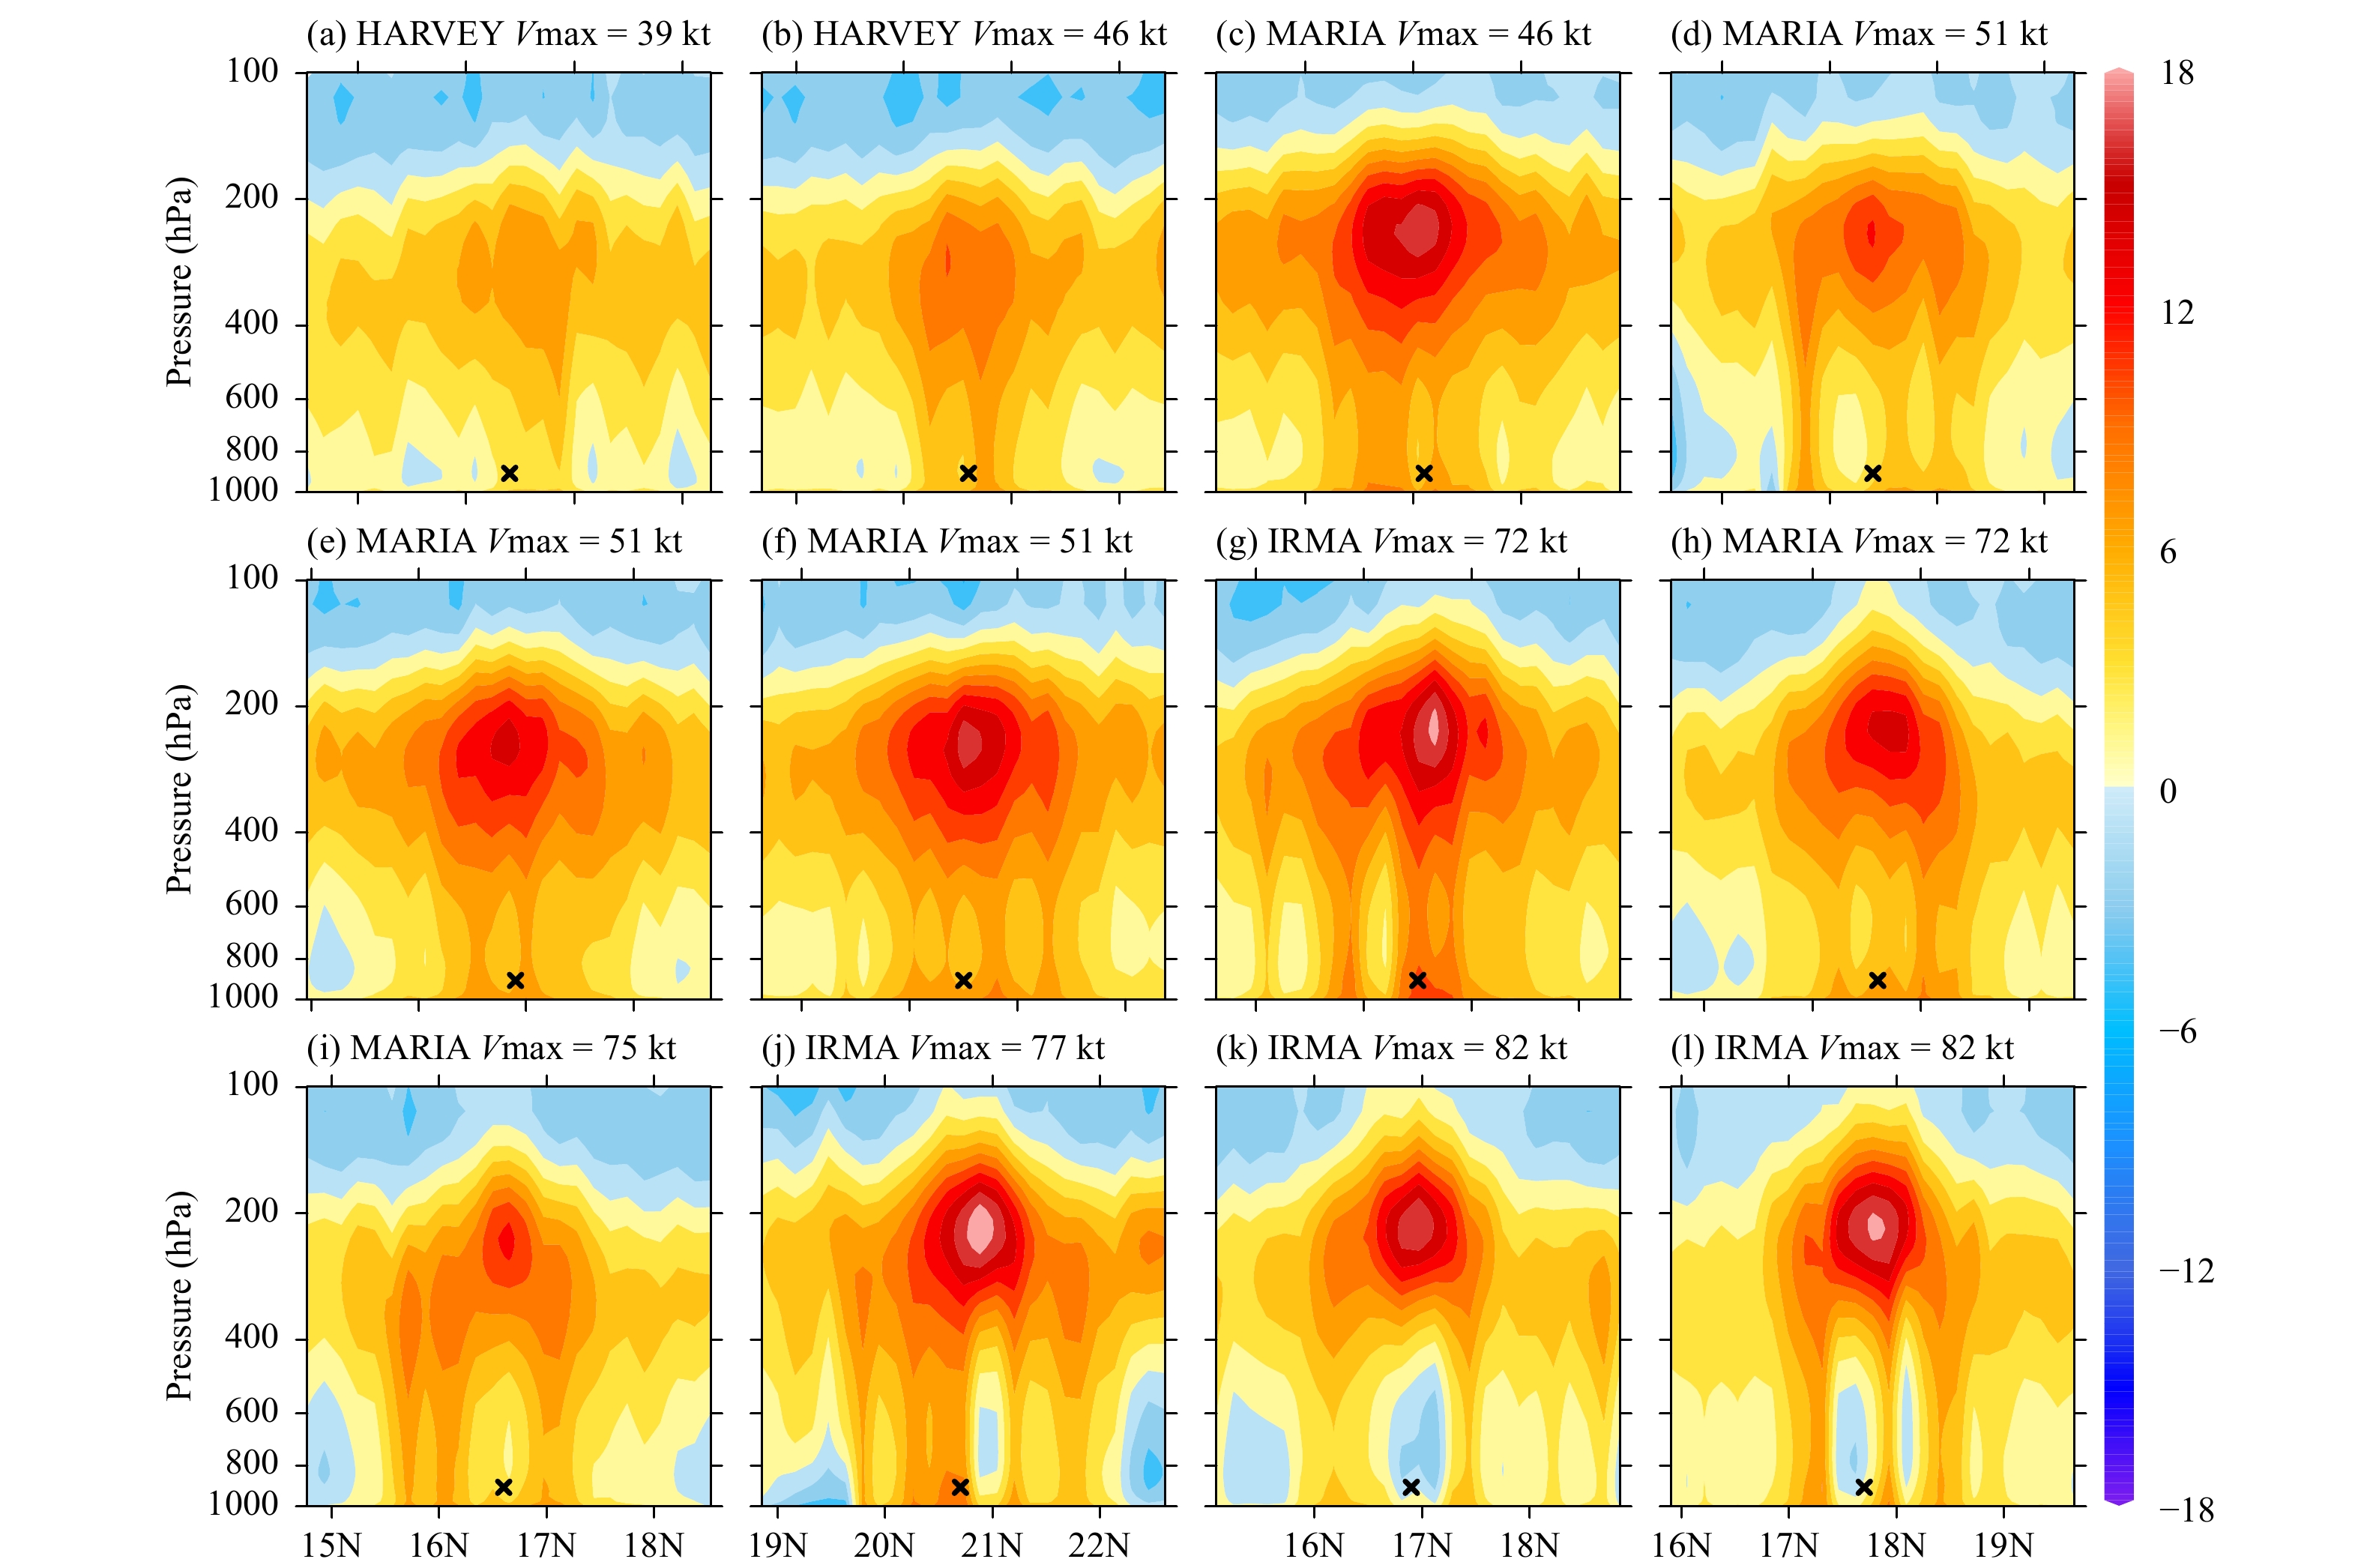
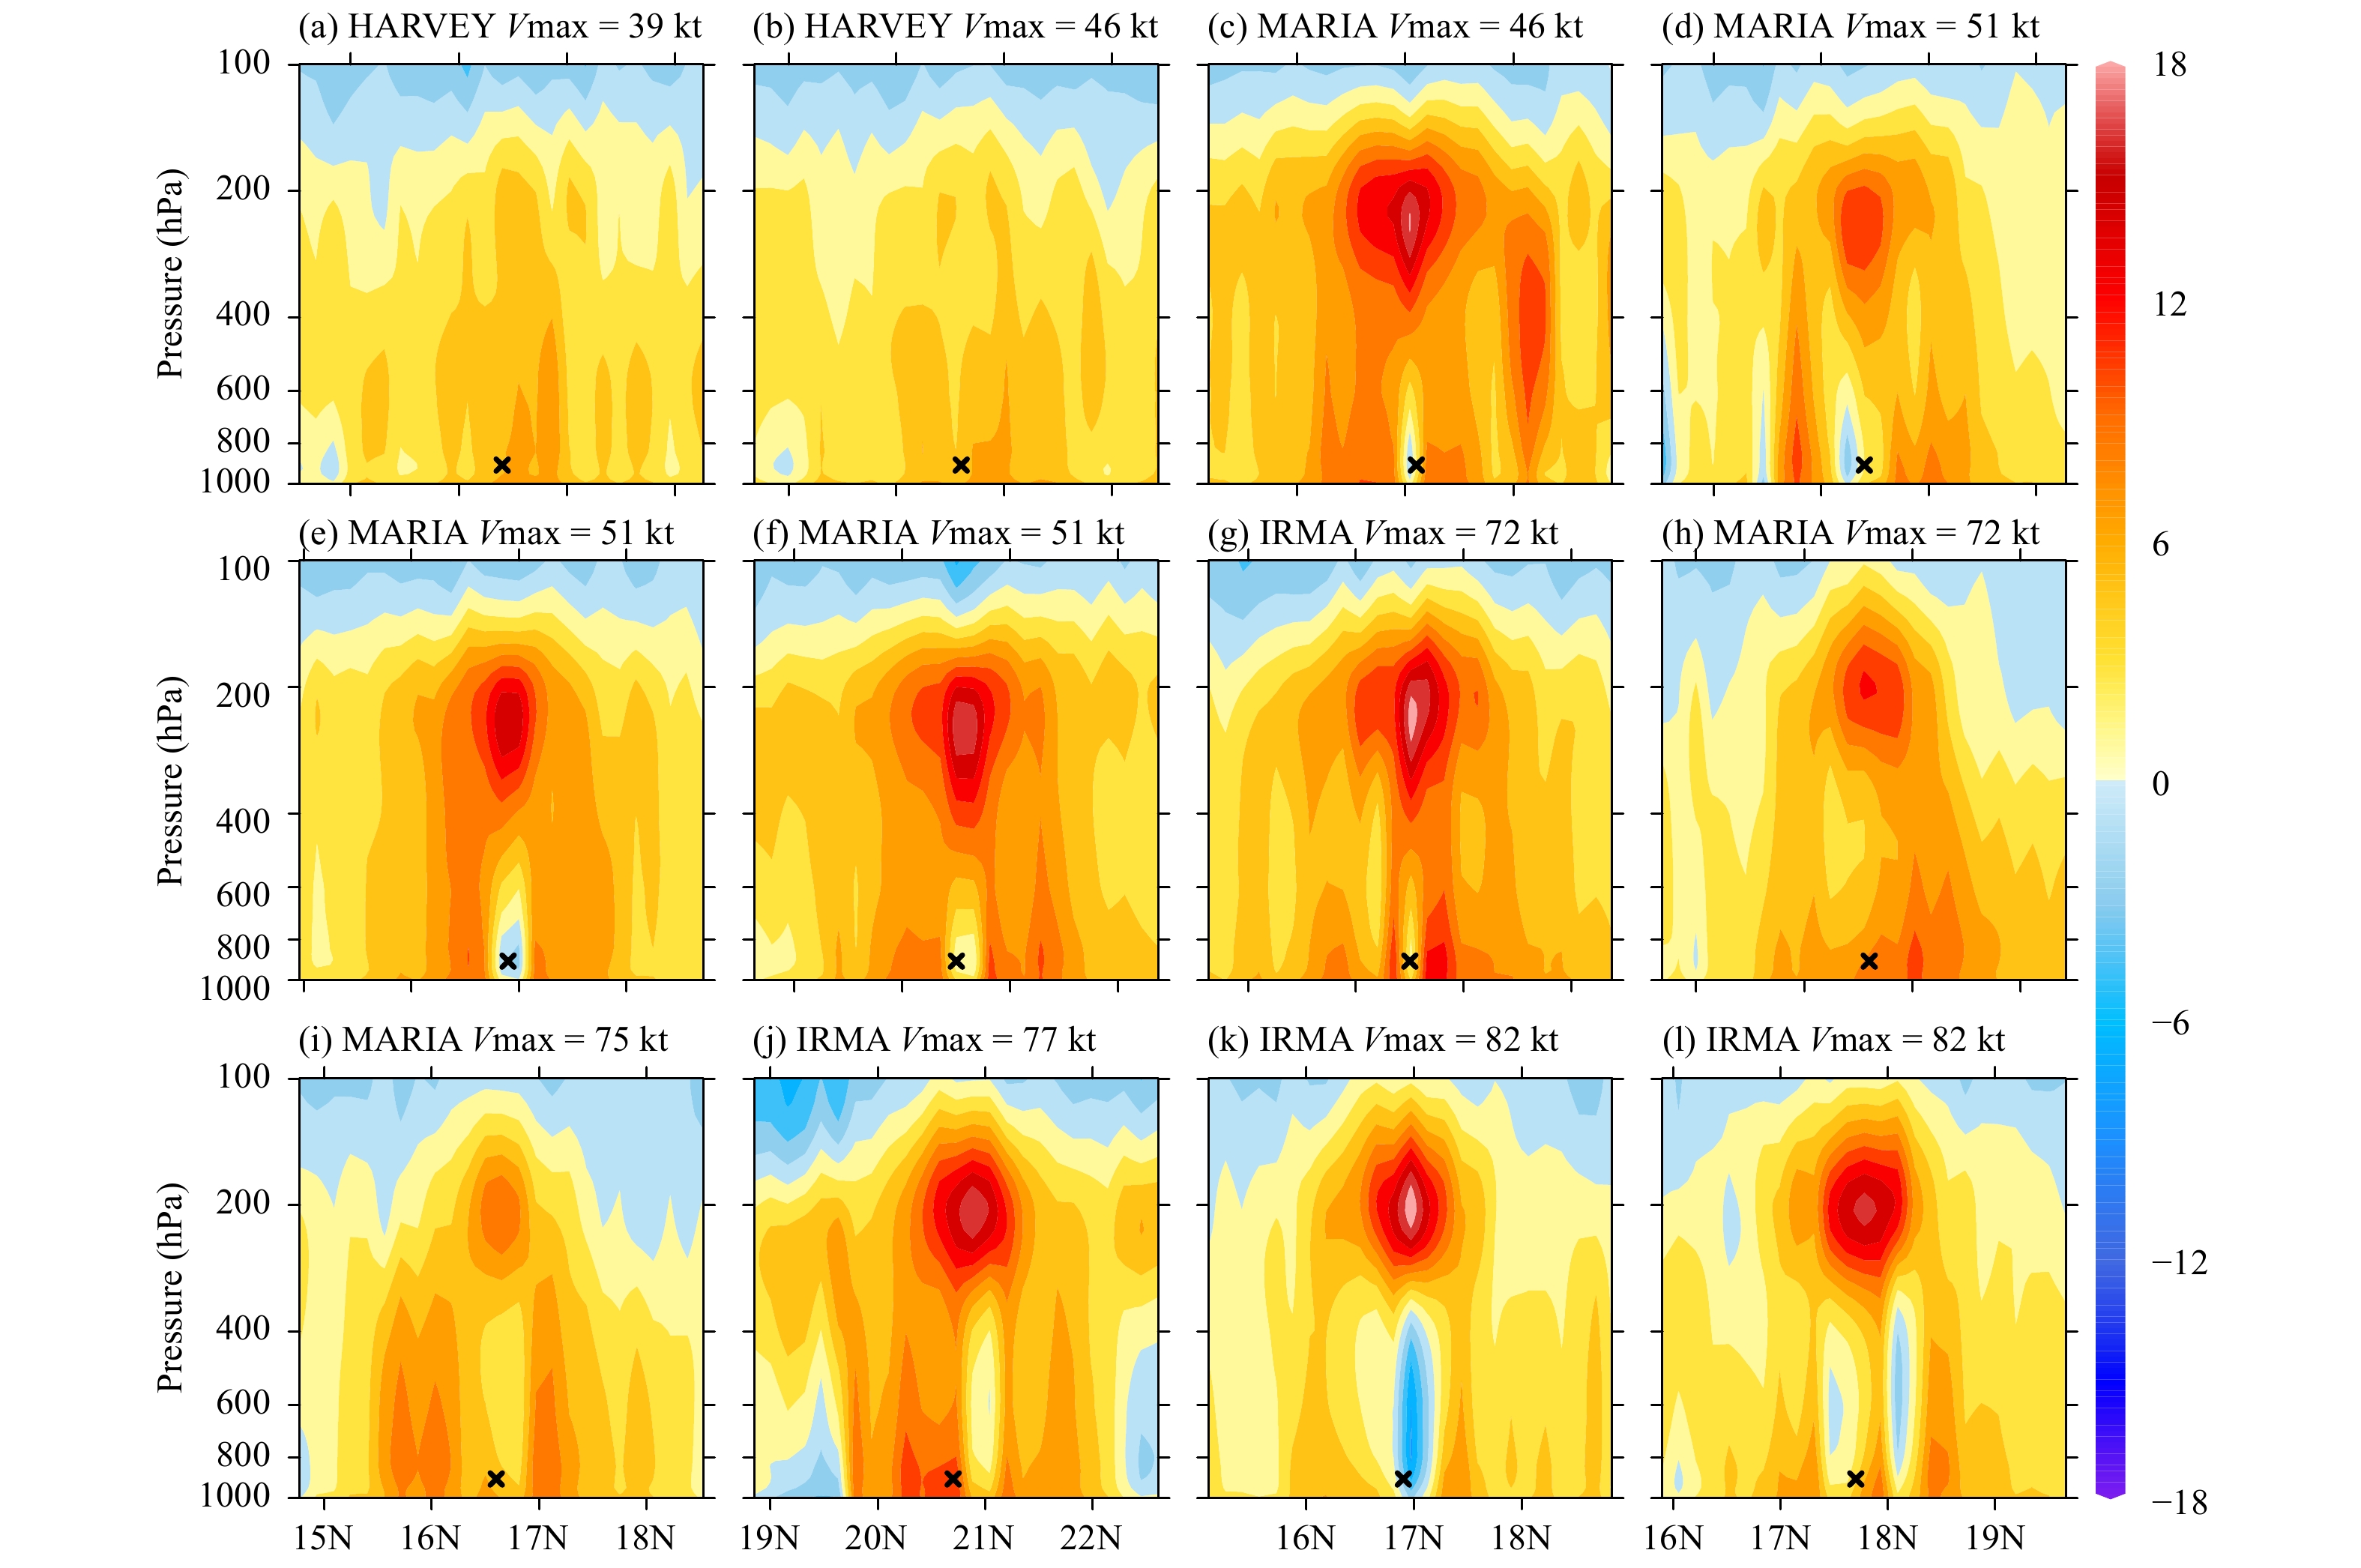
Figures 7–9 display the warm core structure from multi-case experiments using cloud-based background profiles, standard background profiles, and GFS forecast field background profiles, respectively. The warm core could be detected for all strong cases (Figs. 7c–i; 8c–i; 9c–i) no matter which background profiles are utilized. However, the unexpected low-level cold pool exists when using standard background (e.g., Figs. 8c–e, j–l) and GFS forecast field background (e.g., Figs. 9d–e, j–l). These cold pools, similar to the scattering effect related cold pool in Section 3, are eliminated by using the cloud-based background profiles. It is worth mentioning that for extremely strong cases (Figs. 7j–l) a cold pool could also be noticed when using the cloud-based background profiles, but the cold pool is much weaker compared with that in Figs. 8, 9. For relatively weak cases, the warm core could hardly be detected when using standard background profiles (Figs. 8a, b) and GFS background profiles (Figs. 9a, b), while a clear warm core could be found in the experiment using cloud-based background profiles (Figs. 7a, b). This result illustrates that the new background profiles could improve the retrieved TC thermal structure not only for strong cases, but also for relative weak cases.
|
| Figure 7 The warm core structure of the hurricanes from the multi-case experiments using the cloud-based background profiles, with hurricane name as well as its intensity (Vmax) shown in the subtitle. The cross symbol indicates the center of the hurricane. |
|
| Figure 8 As in Fig. 7, except for using the tropical standard profiles. |

|
| Figure 9 As in Fig. 7, except for using the GFS forecast profiles. |
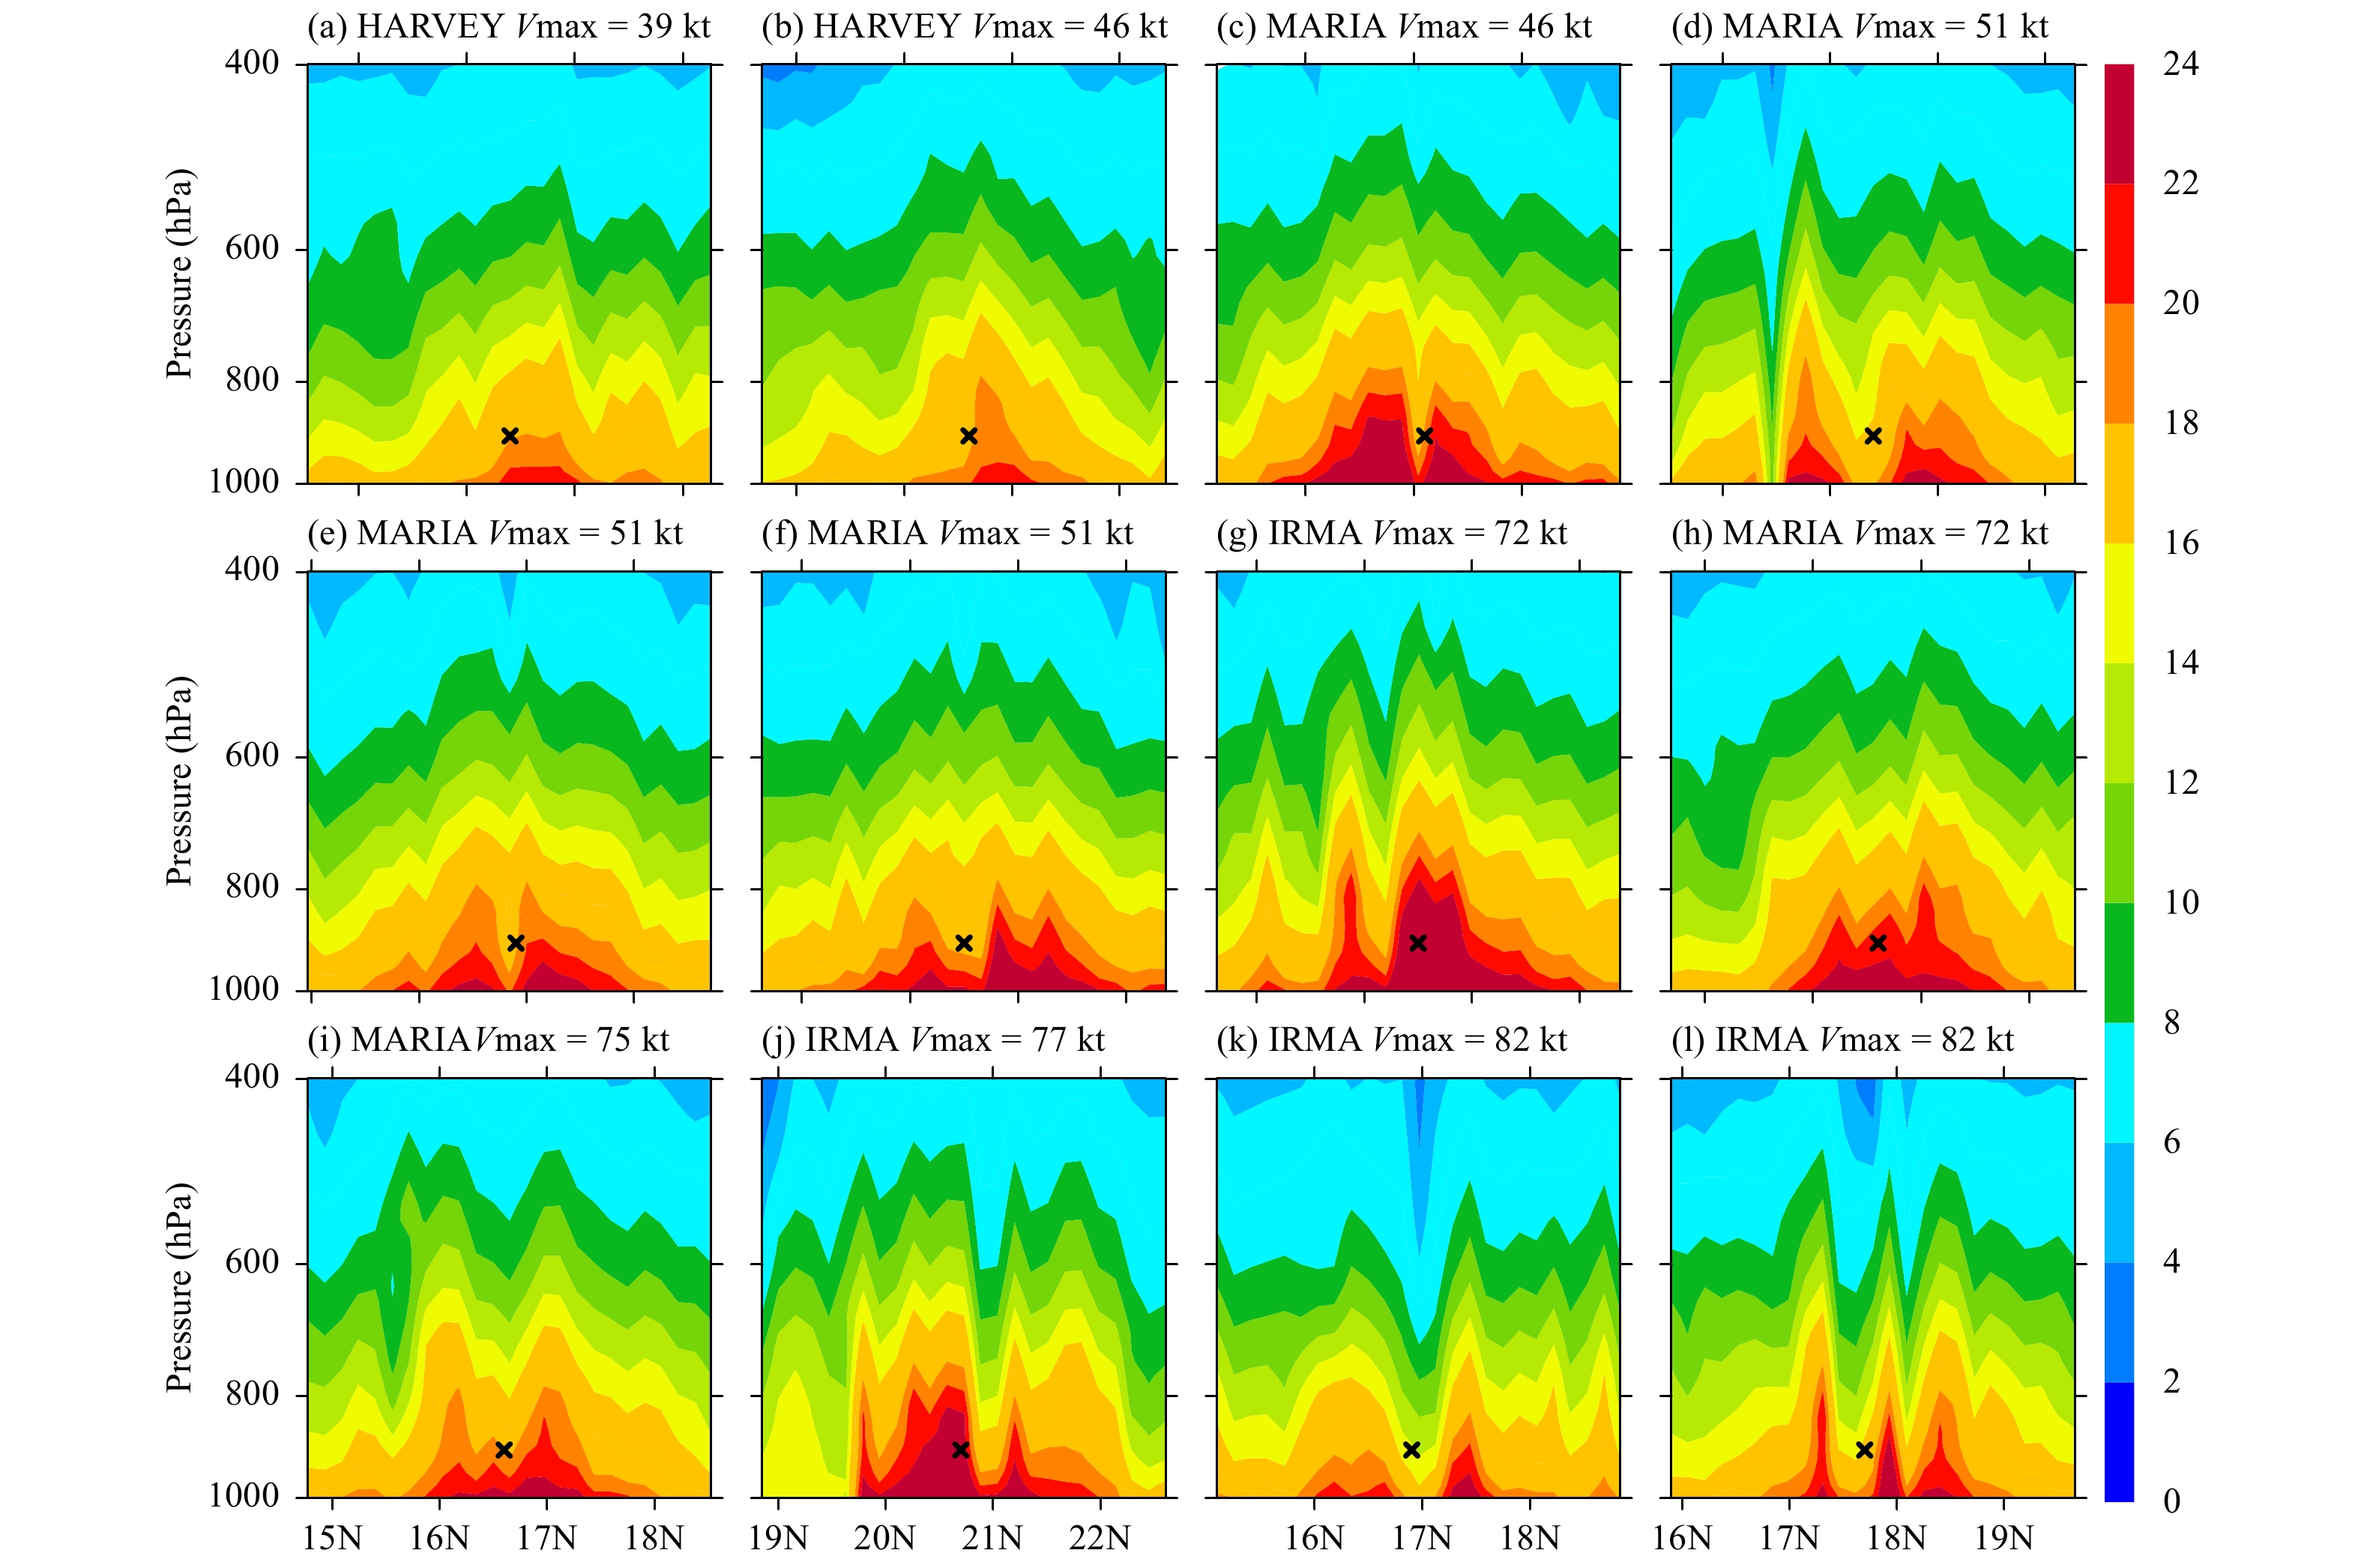
Figures 10–12 show the cross-sections of specific humidity using cloud-based background profiles, standard background profiles, and GFS forecast field background profiles, respectively. As all channels are used in the experiments, the humidity structures are reasonable, with higher values concentrated below 600 hPa, and well-detected eyewall structures in strong cases. However, the specific humidity retrieved from standard background profiles are larger than those retrieved from cloud-based background profiles and GFS forecast background profiles, for both strong and weak cases. The overestimation of specific humidity would also result in larger temperature errors (unrealistic cold pool) as shown in HW18 when all the ATMS channels are used.
|
| Figure 10 Cross-sections of specific humidity (g kg–1) from the multi-case experiments using the cloud-based background profiles, with hurricane name as well as its intensity (Vmax) shown in the subtitle. The cross symbol indicates the center of the hurricane. |

|
| Figure 11 As in Fig. 10, except for using the tropical standard profiles. |

|
| Figure 12 As in Fig. 10, except for using the GFS forecast profiles. |
Lin and Weng (2018) compared the storm surface maximum damage wind with the retrieved warm core intensity and found a good correlation. However, according to Stern and Zhang (2016), there is no evidence that could prove the relationship between TC intensity (storm minimum pressure) and warm core intensity, as different temperature profiles might result in the same surface pressure based on the hydrostatic balance. In this study, the GPS dropsondes within 500 km from TC centers over ocean, downloaded from https://www.nhc.noaa.gov/archive/recon/2017/, are used to validate the retrieved thermal structures. The retrieved profiles are first collocated with the dropsonde profiles. The satellite and dropsonde data with their spatial distance less than 20 km and temporal distance less than 3 h are collocated, and satellite retrievals are then interpolated onto the dropsonde pressure levels. The locations of the GPS dropsondes used for assessment are shown in Fig. 6. Since all the ATMS channels are successfully used in our experiments, including those channels with high frequency, both the temperature (in K) and the specific humidity (in g kg–1) profiles are considered in comparison.
Figure 13 shows the distributions of the error between dropsonde profiles and retrieved profiles using tropical standard background (Estd; Figs. 13a, d for temperature and humidity, respectively), and the error between dropsonde profiles and retrieved profiles using cloud-based background (Ecloud; Figs. 13b, e for temperature and humidity, respectively), along with the pressure levels and the distance from the storm center. The distributions of the error difference, defined as Estd – Ecloud, are displayed in Figs. 13c, f for temperature and humidity, respectively. Note that the warm core structure could not be observed even by using the GPS dropsonde observations, as the observed profiles are lower than 600 hPa in the inner region. Under the effect of heavy precipitation, the temperature error tends to be larger in the inner region than in the outer region, for distributions of both Estd and Ecloud. But the temperature error is reduced in both the inner and outer regions after using the cloud-based profiles. Specifically, the temperature error is reduced to less than 3 K in the low troposphere in the inner region, and less than 2 K in the mid and low troposphere in the outer region. Meanwhile, the retrieved specific humidity is also improved at the low level of the inner region, with the error being reduced to less than 2.5 g kg–1. This gives us confidence in using the humidity structure derived from microwave observations under heavy precipitation for storm analysis. However, the error of specific humidity has a slight increase in the outer region (less than 1.5 g kg–1), especially in the mid and high troposphere. Considering the fact that humidity tends to be more concentrated in the low troposphere, and that the relative error is still small, we gather that the retrieved humidity structures are more reasonable by using cloud-based background profiles.

|
| Figure 13 Distributions of (a, d) Estd and (b, e) Ecloud of the (a, b) temperature and (d, e) specific humidity as a function of distance from the storm center (x axis) and pressure levels (y axis). Panels (c, f) indicate the error difference (Estd – Ecloud) distribution of temperature and specific humidity, respectively. All errors and error differences are binned within 50 km × 100 hPa bins. |
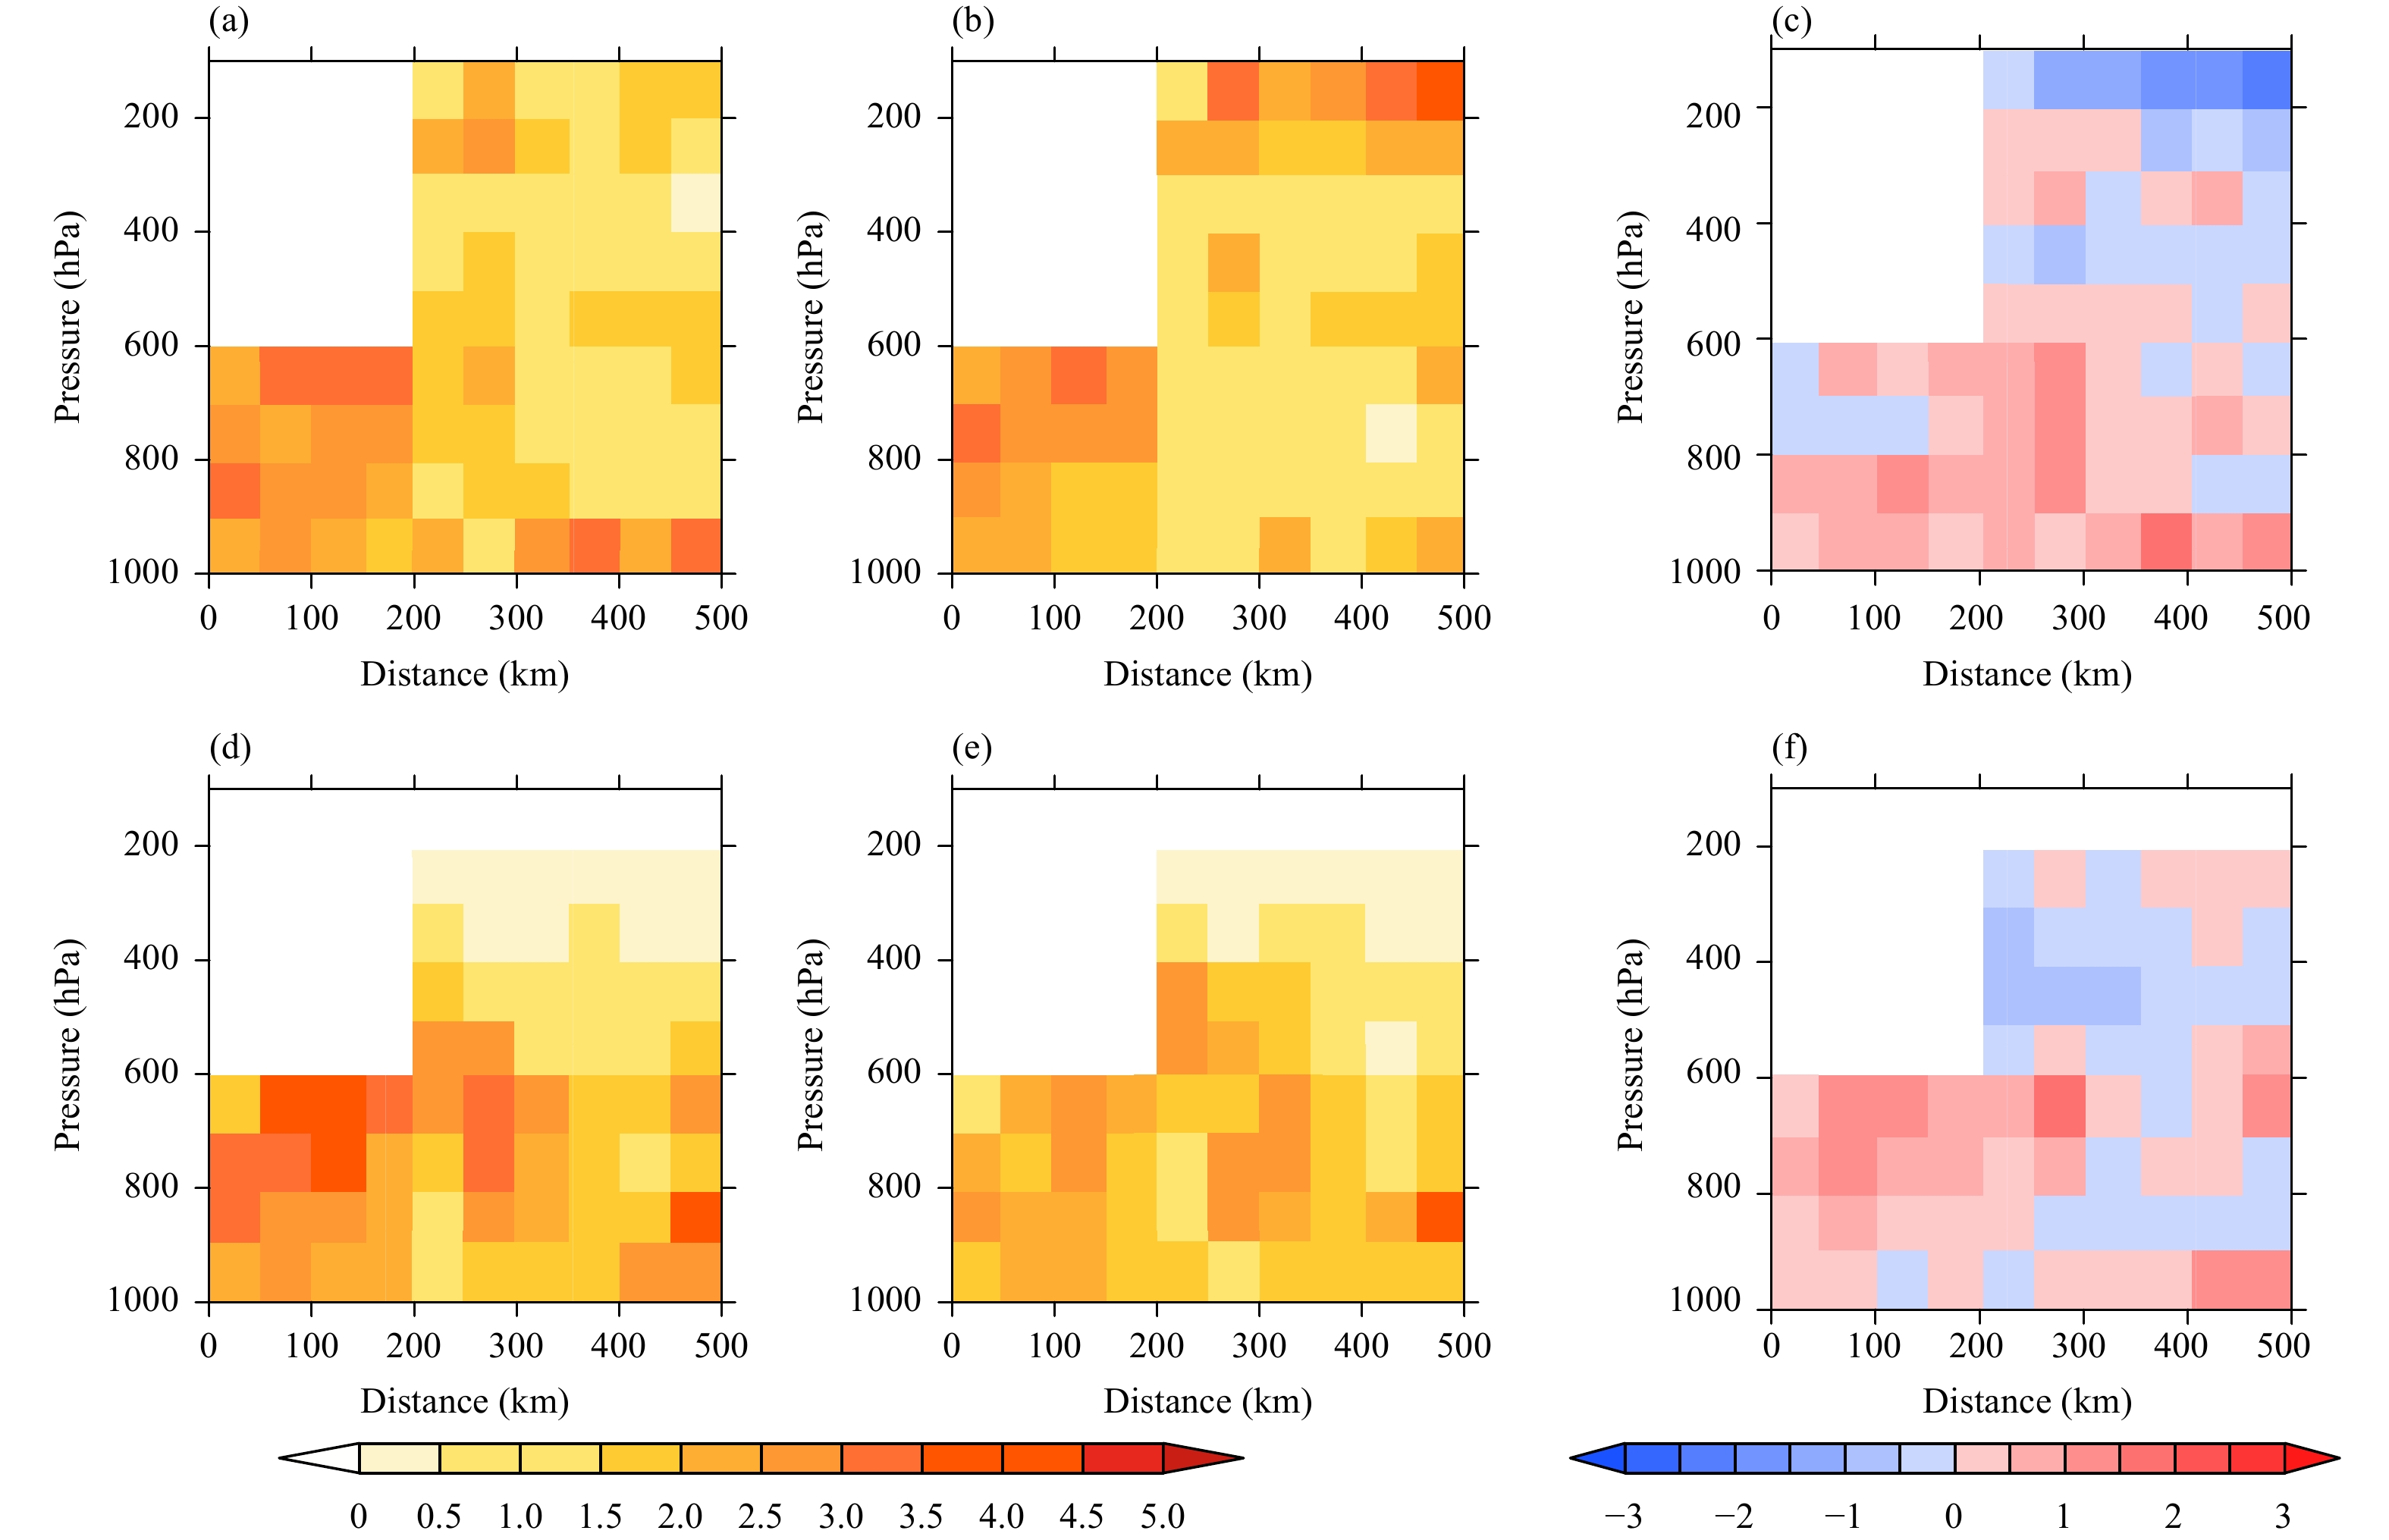
Similar to Fig. 13, Fig. 14 displays the error distributions using GFS forecast background profiles (EGFS; Figs. 14a, d for temperature and humidity, respectively), and the distributions of the error difference defined as EGFS – Ecloud (Figs. 14c, f for temperature and humidity, respectively). Note that Figs. 14b, e show the distributions of Ecloud for temperature and humidity, respectively. It is clear that using GFS forecast filed as background profiles could improve the retrievals as EGFS values are smaller than Estd values, but EGFS values are still larger than Ecloud values, especially over the inner regions. Compared with EGFS, using cloud-based background profiles will reduce the retrieve error by as large as 1.5 K and 1.5 g kg–1 for temperature and specific humidity, respectively. Although GFS forecast fields are closer to the real observations, the temporal and spatial interpolations will result in additional errors, especially for convective systems at small spatial and temporal scales. That is the reason why the unexpected cold pool still exists in the inner region of strong cases (Figs. 9j–l) when using GFS background profiles.
|
| Figure 14 Distributions of (a, d) EGFS and (b, e) Ecloud of the (a, b) temperature and (d, e) specific humidity as a function of distance from the storm center (x axis) and pressure levels (y axis). Panels (c, f) indicate the error difference (EGFS – Ecloud) distribution of temperature and specific humidity, respectively. All errors and error differences are binned within 50 km × 100 hPa bins. |
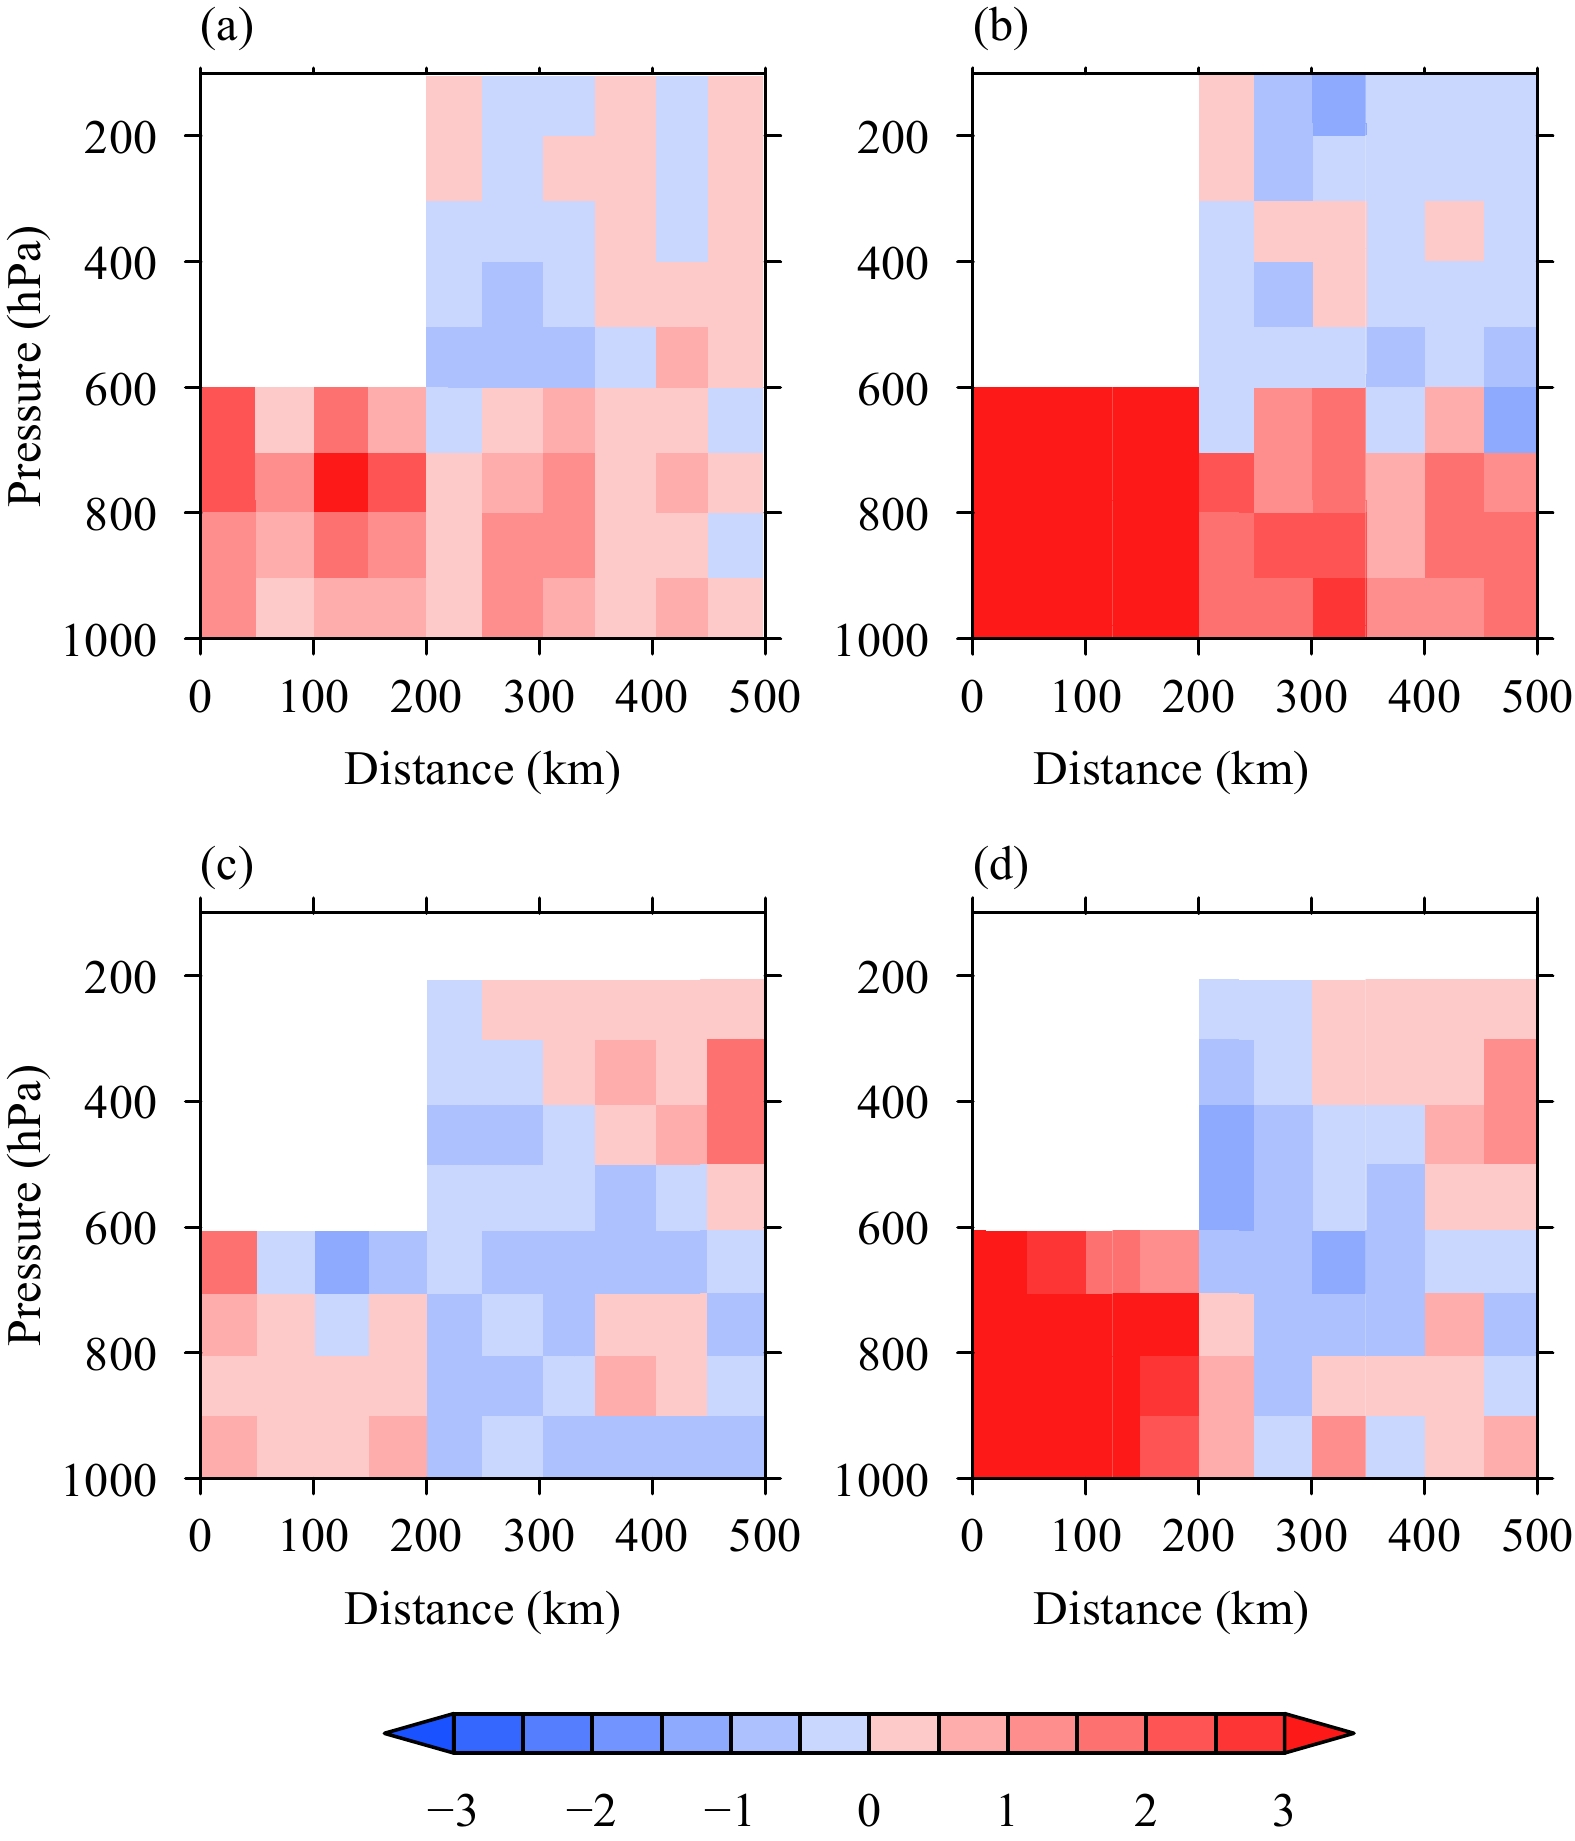
In HW18, we suggested that the retrieved hurricane warm core structure could be more reasonable when turning off the ATMS window channels as well as the water vapor channels. In order to test the effect of channels after replacing the background profiles with the cloud-based profiles, two experiments similar to those in HW18 are taken into account for all cases in this section. These experiments are described in Table 2, with the experiments turning off water vapor channels (using only channels 1–15) and turning off water vapor channels as well as window channels (using only channels 4–15), named as EXP1–15 and EXP4–15, respectively. Meanwhile, the experiment with all channels included is considered as a control experiment and named as EXPall. Figure 15 shows the distributions of the error difference along with the distance from the storm center and the pressure levels, with a positive value indicating a lower error in EXPall. The temperature error difference is positive in most regions in Fig. 15a, especially at low levels in the inner core area, with the temperature error decreasing by about 2K after using all channel observations. However, the temperature error changes less between EXPall and EXP4–15 (Fig. 15c), with the error difference being around 1 K in the inner region and –1 K in the ou-ter region. This is consistent with the results in HW18 in that using channels 4–15 could produce a most plausible temperature distribution. However, adding high frequency channels will not impose a negative effect on the retrieved thermal structure when cloud-based background profiles are used.
| Name | Channel usage |
| EXPall | All channels included (channels 1–22) |
| EXP1–15 | Channels 1–15 included |
| EXP4–15 | Channels 4–15 included |
|
| Figure 15 Distributions of the error difference in (a, c) temperature and (b, d) specific humidity. Panels (a, b) indicate the error difference between EXPall and EXP1–15 (EXP1–15 – EXP all), while (c, d) indicate the error difference between EXPall and EXP4–15 (EXP4–15 – EXP all). All error differences are binned within 50 km × 100 hPa bins. |
The humidity error should be large in EXP4–15 and EXP1–15 considering the fact that no water vapor channels are utilized in those experiments. As shown in Figs. 15b, d, EXPall tends to have better humidity structures, especially in the inner region where convective precipitation is more likely to occur. The error difference is grea-ter than 3 g kg–1 in the inner region in both Fig. 15b and 5d. In the outer region, EXPall still has an improvement of about 2 g kg–1 compared with EXP1–15 (Fig. 15b), while that improvement is less distinct when compared with EXP4–15 (Fig. 15d). Though using only channels 4–15 could produce a temperature structure similar with using all channels, and even a reasonable outer region humidity structure compared with EXPall, the huge improvements in the inner core humidity retrieval indicate that using all channels could produce a better thermal structure with the cloud-based profiles as the background field. This result also proves that the use of cloud-based background profiles could reduce the influence of the scattering effect on retrievals and generate a reasonable thermal structure from low to high levels.
5 Conclusions and discussionIn HW18, we developed a Microwave Retrieval Testbed (MRT) and tested its performance in retrieving TCs thermal structure using ATMS observations. Considering the different characteristics of profiles among different precipitation types, this study further improves the microwave retrieval of TCs thermal structure using the cloud-based background profiles generated from histori-cal TCs profiles clustered into stratiform and convective precipitation conditions. These cloud-based profiles are reasonable, compared to those in the previous studies (Houze, 2014; Wang and Fu, 2017), and are capable of retrieving a more accurate temperature anomaly structure using all ATMS channels, especially at low levels of the inner core region where the retrievals are more impacted by the scattering effect of heavy precipitation. The unexpected low-level cold anomalies could be found in previous retrieval studies (e.g., Zhu and Weng, 2013; Tian and Zou, 2016; HW18; Lin and Weng, 2018), and their magnitudes are reduced to less than –2 K when cloud-based background profiles are used. The multi-case experiments indicate that using the cloud-based background profiles could not only weaken the low-level unexpected cold pools in strong TC cases, but also improve the warm core structure in relatively weak cases, which is hardly detected when using the standard background profiles.
With the GPS dropsonde observations collocated with ATMS data, the retrieved thermal fields, including temperature and specific humidity fields, are validated. When using the cloud-based profiles in retrievals, the errors are decreased in both temperature and humidity fields, especially at low levels in the inner region. Based on the multi-case experiments, the channel experiments similar to HW18 are considered in our study to test the performance of using all channels. The all channels experiment produces more accurate temperature structures, compared with only using channels 1–15. Meanwhile, the specific humidity structures from all channels experiment are highly improved in the inner region, compared with the experiments using channels 1–15 and channels 4–15. This illustrates that the high frequency channels could be used effectively in the retrieval systems if the background profiles are based on cloud type.
Although the TC warm core structure was doubted to have a direct relationship with TC intensity (Stern and Nolan, 2012), the hydrostatic balance could be used to produce the surface pressure from temperature and pressure profiles. Also, the successful retrieval of humidity structures in hurricane conditions offers us a new product to evaluate TC size parameters and asymmetric structures, as well as the retrieval of rain rate. Meanwhile, the derived TC thermal structures can be used for monitoring the storm intensity in vast oceans where there is no operational GPS dropsonde observations. Future investigations will try to improve the retrieved structures through refining the observation error covariance and uses of advanced forward operator such as the Radiative Transfer for TIROS Operational Vertical sounder (RTTOV) (Saunders et al., 1999; Matricardi et al., 2004).
| Bennartz, R., A. Thoss, A. Dybbroe, et al., 2002: Precipitation analysis using the Advanced Microwave Sounding Unit in support of nowcasting applications. Meteor. Appl., 9, 177–189. DOI:10.1017/S1350482702002037 |
| Bormann, N., A. Fouilloux, and W. Bell, 2013: Evaluation and assimilation of ATMS data in the ECMWF system. J. Geophys. Res. Atmos., 118, 12970–12980. DOI:10.1002/2013JD020325 |
| Boukabara, S.-A., K. Garrett, W. C. Chen, et al., 2011: MiRS: An all-weather 1DVAR satellite data assimilation and retrieval system. IEEE Trans. Geosci. Remote Sens., 49, 3249–3272. DOI:10.1109/TGRS.2011.2158438 |
| Chen, H., and D.-L. Zhang, 2013: On the rapid intensification of Hurricane Wilma (2005). Part II: Convective bursts and the upper-level warm core. J. Atmos. Sci., 70, 146–162. DOI:10.1175/jas-d-12-062.1 |
| Chen, H., D.-L. Zhang, J. Carton, et al., 2011: On the rapid intensification of Hurricane Wilma (2005). Part I: Model prediction and structural changes. Wea. Forecasting, 26, 885–901. DOI:10.1175/waf-d-11-00001.1 |
| Geer, A. J., P. Bauer, and P. Lopez, 2008: Lessons learnt from the operational 1D + 4D-Var assimilation of rain- and cloud-affected SSM/I observations at ECMWF. Quart. J. Roy. Meteor. Soc., 134, 1513–1525. DOI:10.1002/qj.304 |
| Grody, N., J. Zhao, R. Ferraro, et al., 2001: Determination of precipitable water and cloud liquid water over oceans from the NOAA 15 Advanced Microwave Sounding Unit. J. Geophys. Res. Atmos., 106, 2943–2953. DOI:10.1029/2000JD900616 |
| Han, Y., and F. Z. Weng, 2018: Remote sensing of tropical cyclone thermal structure from satellite microwave sounding instruments: Impacts of optimal channel selection on retrievals. J. Meteor. Res., 32, 804–818. DOI:10.1007/s13351-018-8005-x |
| Hawkins, H. F., and D. T. Rubsam, 1968: Hurricane Hilda, 1964: II. Structure and budgets of the hurricane on October 1, 1964. Mon. Wea. Rev., 96, 617–636. DOI:10.1175/1520-0493(1968)096<0617:hh>2.0.co;2 |
| Hawkins, H. F., and S. M. Imbembo, 1976: The structure of a small, intense hurricane—Inez 1966. Mon. Wea. Rev., 104, 418–442. DOI:10.1175/1520-0493(1976)104<0418:tsoasi>2.0.co;2 |
| Houze, R. A., Jr., 2014: Cloud Dynamics. 2nd ed. Elsevier/Academic Press, Oxford, 432 pp. |
| JPSS ATMS SDR Science Team, 2013: Joint Polar Satellite System (JPSS) Advanced Technology Microwave Sounder (ATMS) SDR Calibration Algorithm Theoretical Basis Document (ATBD). E/RA-00001, Center for Satellite Applications and Research, Maryland, 41 pp. Available at www.star.nesdis.noaa.gov/jpss/documents/ATBD. Accessed on 28 December 2018. |
| Knaff, J. A., R. M. Zehr, M. D. Goldberg, et al., 2000: An example of temperature structure differences in two cyclone systems derived from the Advanced Microwave Sounder Unit. Wea. Forecasting, 15, 476–483. DOI:10.1175/1520-0434(2000)015<0476:AEOTSD>2.0.CO;2 |
| Knaff, J. A., S. A. Seseske, M. DeMaria, et al., 2004: On the influences of vertical wind shear on symmetric tropical cyclone structure derived from AMSU. Mon. Wea. Rev., 132, 2503–2510. DOI:10.1175/1520-0493(2004)132<2503:OTIOVW>2.0.CO;2 |
| LaSeur, N. E., and H. F. Hawkins, 1963: An analysis of Hurricane Cleo (1958) based on data from research reconnaissance aircraft. Mon. Wea. Rev., 91, 694–709. DOI:10.1175/1520-0493(1963)091<0694:aaohcb>2.3.co;2 |
| Lin, L., and F. Z. Weng, 2018: Estimation of hurricane maximum wind speed using temperature anomaly derived from Advanced Technology Microwave Sounder. IEEE Geosci. Remote Sens. Lett., 15, 639–643. DOI:10.1109/LGRS.2018.2807763 |
| Liu, Q. H., and F. Z. Weng, 2005: One-dimensional variational retrieval algorithm of temperature, water vapor, and cloud water profiles from Advanced Microwave Sounding Unit (AMSU). IEEE Trans. Geosci. Remote Sens., 43, 1087–1095. DOI:10.1109/TGRS.2004.843211 |
| Lloyd, S., 1982: Least squares quantization in PCM. IEEE Trans. Inf. Theory, 28, 129–137. DOI:10.1109/TIT.1982.1056489 |
| Matricardi, M., F. Chevallier, G. Kelly, et al., 2004: An improved general fast radiative transfer model for the assimilation of radiance observations. Quart. J. Roy. Meteor. Soc., 130, 153–173. DOI:10.1256/qj.02.181 |
| Saunders, R., M. Matricardi, and P. Brunel, 1999: An improved fast radiative transfer model for assimilation of satellite radiance observations. Quart. J. Roy. Meteor. Soc., 125, 1407–1425. DOI:10.1002/qj.1999.49712555615 |
| Stern, D. P., and D. S. Nolan, 2012: On the height of the warm core in tropical cyclones. J. Atmos. Sci., 69, 1657–1680. DOI:10.1175/jas-d-11-010.1 |
| Stern, D. P., and F. Q. Zhang, 2016: The warm-core structure of Hurricane Earl (2010). J. Atmos. Sci., 73, 3305–3328. DOI:10.1175/jas-d-15-0328.1 |
| Tian, X. X., and X. L. Zou, 2016: ATMS- and AMSU-A-derived hurricane warm core structures using a modified retrieval algorithm. J. Geophys. Res. Atmos., 121, 12630–12646. DOI:10.1002/2016JD025042 |
| Wang, R., and Y. F. Fu, 2017: Structural characteristics of atmospheric temperature and humidity inside clouds of convective and stratiform precipitation in the rainy season over East Asia. J. Meteor. Res., 31, 890–905. DOI:10.1007/s13351-017-7038-x |
| Weng, F. Z., X. L. Zou, N. H. Sun, et al., 2013: Calibration of Suomi national polar-orbiting partnership advanced technology microwave sounder. J. Geophys. Res. Atmos., 118, 11,187–11,200. DOI:10.1002/jgrd.50840 |
| Zhu, T., and F. Z. Weng, 2013: Hurricane Sandy warm-core structure observed from Advanced Technology Microwave Sounder. Geophys. Res. Lett., 40, 3325–3330. DOI:10.1002/grl.50626 |
| Zhu, T., D.-L. Zhang, and F. Z. Weng, 2002: Impact of the advanced microwave sounding unit measurements on hurricane prediction. Mon. Wea. Rev., 130, 2416–2432. DOI:10.1175/1520-0493(2002)130<2416:iotams>2.0.co;2 |
| Zou, X., F. Weng, B. Zhang, et al., 2013: Impacts of assimilation of ATMS data in HWRF on track and intensity forecasts of 2012 four landfall hurricanes. J. Geophys. Res. Atmos., 118, 11,558–11,576. DOI:10.1002/2013JD020405 |
 2019, Vol. 33


