The Chinese Meteorological Society
Article Information
- HU, Po, Minghao WANG, Liu YANG, et al., 2018.
- Water Vapor Transport Related to the Interdecadal Shift of Summer Precipitation over Northern East Asia in the Late 1990s. 2018.
- J. Meteor. Res., 32(5): 781-793
- http://dx.doi.org/10.1007/s13351-018-8021-x
Article History
- Received February 28, 2018
- in final form June 24, 2018
2. Laboratory for Climate Studies, National Climate Center, China Meteorological Administration, Beijing 100081;
3. Changwang School of Honors, Nanjing University of Information Science & Technology, Nanjing 211004;
4. College of Physical Science and Technology, Yangzhou University, Yangzhou 225002;
5. College of Physics and Electronic Engineering, Changshu Institute of Technology, Changshu 215500
Summer rainfall in East Asia (EA) exhibits clear interdecadal variability (Ding, 1992; Li et al., 2004; Zhou et al., 2009) and experienced shifts in the late 1970s and in the early and late 1990s (Huang and Yan, 1999; Huang R. H. et al., 2013; Gao et al., 2014). Summer rainfall in North China decreased after 1977, whereas summer precipitation in the Yangtze–Huaihe River basin changed to a wet spell (Wu and Chen, 1998). In the late 1990s, the summer precipitation anomaly in eastern China presented a “+ – +” tripole meridional pattern from south to north during 1993–98 and exhibited a “+ –” dipole pattern during 1999–2009 (Gong et al., 2016). Zhu et al. (2011, 2015) also found that the summer precipitation in the Yellow and Huaihe River basins increased significantly, while the precipitation in the Yangtze River basin decreased significantly after 1998/99. The studies on the interdecadal shifts of summer rainfall in EA are important and demanding both scientifically and operationally.
The interdecadal variation of summer precipitation is a result of the interaction among the atmospheric and oceanic systems (Jiang et al., 2009; Huang W. et al., 2013). For example, Zhu and Wang (2001) reported that the East Asian summer monsoon (EASM) has variations on multiple timescales such as interannual and interdecadal. Han et al. (2015) pointed out that the Northeast Asian summer monsoon (NEASM) index has weakened since 1999, which is one of the reasons for the declining interdecadal summer precipitation in Northeast China. Furthermore, the interdecadal changes associated with the Pacific Ocean has also been studied (Wang, 1995) and the principle component of sea surface temperature (SST) over the central and northern Pacific Ocean shows obvious interdecadal variation, causing the responses/variability of the atmospheric circulation (Li and Li, 2000). Besides, Han et al. (2017) also proved that the atmospheric circulation that influences precipitation in northeastern China (NEC) develops into the Siberian high and an anomalous cyclone over NEC after the late 1990s, which are strongly correlated with the spring eastern ENSO. Due to the combined influence of oceanic and atmospheric anomalies, atmospheric water vapor as one of the influential processes in the hydrologic cycle causes multiple timescale variations of precipitation in EA.
The northern East Asia (NEA) is located within the middle and high latitudes of EA and the summer precipitation in this region is affected by both western- and low-latitude water vapor transport of the Asian monsoon system (Zhou and Yu, 2005; Chen and Lu, 2014a, b; Gong et al., 2015). According to recent studies, the summer precipitation over NEA also exhibits obvious interdecadal characteristics around the late 1990s, which is even more significant that the internal dynamical cause changes over southern EA (Huang R. H. et al., 2013). There have been many studies regarding water vapor transport over EA, those conclusions are of great help for understanding the interannual and interdecadal water vapor transmission and summer precipitation changes in NEA. For example, water vapor in eastern China mainly originates from the South China Sea and Bay of Bengal (Simmonds et al., 1999; Wang, 2001). For sections of Northeast and North China, midlatitude westerly vapor transport plays a dominant role in influencing the precipitation in northeastern China, while the westerly and western Pacific water vapor transport has important influences on heavy rains in northern China (Ding et al., 2008, 2009; Zhu et al., 2011; Sun and Wang, 2015). Water vapor transport in North and Northeast China has also experienced significant interdecadal changes, leading to corresponding variability of regional precipitation (Feng et al., 2008; He et al., 2012). Meanwhile, under the background of global warming, observational data and numerical simulation results indicate that global warming has accelerated the water cycle rate (Held and Soden, 2000; Ding and Chan, 2005; Solomon et al., 2010).
The SST anomalies in the Pacific and Atlantic Oceans have important impacts on the summer monsoon climate in East Asia. Since the 1990s, Pacific Decadal Oscillation (PDO) shifted from positive to negative phases, which affected the circulation over Lake Baikal through air–sea interaction, and then affected the interdecadal variation of the summer circulation over Northeast China (Zhu et al., 2011; Hu et al., 2014; Han et al., 2015). Wang et al. (2000) pointed out that the cyclonic/anticyclonic anomalies in Northwest Pacific from winter to summer can transmit El Niño signals from winter to summer. Through numerical simulations, Lu et al. (2006) found that the decadal oscillations of the North Atlantic Ocean could cause the feedback between the oceans and atmosphere outside the North Atlantic Ocean to affect the EASM, and they proposed a non-local influential mechanism. Xu et al. (2013) discovered that the North Atlantic SST tripole could influence the precipitation anomalies in East and Central Northeast Asia through the interaction of so-called “atmospheric bridge” and “ocean bridge.” However, due to inconsistent warming trends among regions, the influences of climate change on the water vapor cycle exhibit regional differences and uncertainties, leading to changes in the distribution of the precipitation and related drought and wet events. Compared with summer precipitation variations on other timescales in EA, the interdecadal variability of summer precipitation in NEA is more pronounced. It is necessary to further confirm the interdecadal shifts of summer precipitation in NEA and discuss its probable relationships with water vapor transport.
Based on the above literature review, regarding the interdecadal shifts of summer precipitation in NEA, many aspects of the association between water vapor transport and interdecadal precipitation shifts in NEA remain unknown. For example, what is the main source of the water vapor that crucially influences the summer precipitation shift in NEA? How does the vertical distribution of water vapor transport cause changes in the regional moisture budget? From which boundary does the transported water vapor flux have the closest correlation with the summer precipitation shift in the late 1990s? To answer these questions, we analyze the summer precipitation shift in NEA that occurred in the late 1990s, the corresponding water vapor transport anomalies in horizontal, vertical, and temporal dimensions, the moisture transport across each regional boundary, and their association with the wind and moisture disturbance fields.
2 Data and methodsIn this study, the area studied is the northern East Asia (NEA; 35°–55°N, 90°–145°E), and the datasets used are described as follows. (1) The Global Precipitation Climatology Project (GPCP) monthly precipitation observation dataset (https://www.esrl.noaa.gov/psd/data/gridded/data.gpcp.html) was used for validation, among which we only focus on the summer precipitation from 1983 to 2011. (2) The NCEP/NCAR monthly and four-times daily reanalysis data (https://www.esrl.noaa.gov/psd/data/gridded/data.ncep.reanalysis.pressure.html) were used to estimate the water vapor transport fluxes (Kalnay et al., 1996). The variables used include surface pressure, zonal and meridional winds, and specific humidity. (3) The PDO index and AMO (Atlantic Multidecadal Oscillation) index used are from the NOAA Climate Prediction Center (CPC) (https://www.esrl.noaa.gov/psd/data/climateindices/list/).
Based on Eqs. (1) and (2) in the following, fluxes of water vapor transport can be calculated as
| ${Q_{\rm{u}}} = \frac{1}{g}\mathop \int_{{p_{\rm t}}}^{{p_{\rm s}}} {qu} {\rm{d}}p,$ | (1) |
| ${Q_{\rm{v}}} = \frac{1}{g}\mathop \int_{{p_{\rm t}}}^{{p_{\rm s}}} {qv} {\rm{d}}p,$ | (2) |
where Qu and Qv are the vertically integrated meridional and zonal water vapor fluxes; q denotes the specific humidity; g represents the gravitational acceleration; v is the meridional wind, u is zonal wind, and pt and ps are the pressure at 300 and 1000 hPa (Trenberth, 1991).
The water vapor amount across boundaries of a certain area as the input or output for a certain period is defined as the budget of water vapor. The area is usually rectangular, and the water vapor budget is determined by calculating the moisture flux across each boundary and then calculating the moisture balance of the entire region. The water vapor flux across each boundary is calculated as follows:
| ${Q_{\rm{W}}} = \mathop \int_{{\varphi _1}}^{{\varphi _2}} {Q_{\rm{u}}}\left( {{\lambda _1},\varphi ,t} \right){\rm{d}}\varphi ,$ | (3) |
| ${Q_{\rm{E}}} = \mathop \int_{{\varphi _1}}^{{\varphi _2}} {Q_{\rm{u}}}\left( {{\lambda _2},\varphi ,t} \right){\rm{d}}\varphi ,$ | (4) |
| ${Q_{\rm{S}}} = \mathop \int_{{\lambda _1}}^{{\lambda _2}} {Q_{\rm{v}}}\left( {\lambda ,{\varphi _1},t} \right){\rm{d}}\lambda ,$ | (5) |
| ${Q_{\rm{N}}} = \mathop \int_{{\lambda _1}}^{{\lambda _2}} {Q_{\rm{v}}}\left( {\lambda ,{\varphi _2},t} \right){\rm{d}}\lambda ,$ | (6) |
where QW, QE, QS, and QN represent the western, eastern, southern and northern boundary input (or output) of water vapor, respectively; and φ1 and φ2 (λ1 and λ2) are the latitudes (longitudes) of the southern, northern, eastern, and western boundaries, respectively.
Based on Eqs. (7)–(10), the anomaly of water vapor flux is calculated as (Li et al., 2011):
| $\begin{split} \mathop {{ Q}'} = & \mathop { Q}\,\, -\,\,\, \overline {\mathop { Q} }\\ = & \displaystyle\frac{1}{g}\mathop \int_{{p_{\rm t}}}^{{p_{\rm s}}} \left( {\bar q \!\!+\!\! q'} \right)\left( {\overline {\mathop { V} } \!\!+\!\! \mathop {{ V}'} } \right){\rm{d}}p \!\!-\!\! \displaystyle\frac{1}{g}\mathop \int_{{p_{\rm t}}}^{{p_{\rm s}}} \overline {\left( {\bar q \!\!+\!\! q'} \right)\left( {\overline {\mathop { V} } \!+\!\! \mathop {{ V}'} } \right)} {\rm{d}}p \\ \!\!=\! & \displaystyle\frac{1}{g}\mathop \int_{{p_{\rm t}}}^{{p_{\rm s}}} \bar q\mathop {{ V}'} {\rm{d}}p \!\!+\!\! \displaystyle\frac{1}{g}\mathop \int_{{p_{\rm t}}}^{{p_{\rm s}}} q'\overline {\mathop { V} } {\rm{d}}p \!\!+\!\! \displaystyle\frac{1}{g}\mathop \int_{{p_{\rm t}}}^{{p_{\rm s}}} (q'\mathop {{ V}'} \!\!-\!\! \overline {q'\mathop {{ V}'} } ){\rm{d}}p,\end{split}\!\!\!\!$ | (7) |
| ${ Q}_{{\rm{wind}}}' = \frac{1}{g}\mathop \int_{{p_{\rm t}}}^{{p_{\rm s}}} \bar q\mathop {{ V}'} {\rm{d}}p, \quad\quad\quad\quad\quad\quad\quad\quad\quad\quad\quad\quad\;$ | (8) |
| ${ Q}_{{\rm{moisture}}}' = \frac{1}{g}\mathop \int_{{p_{\rm t}}}^{{p_{\rm s}}} q'\overline {\mathop { V} } {\rm{d}}p,\quad\quad\quad\quad\quad\quad\quad\quad\quad\quad\quad\;$ | (9) |
| ${ Q}_{{\rm{anomaly}}}' = \frac{1}{g}\mathop \int_{{p_{\rm t}}}^{{p_{\rm s}}} \left( {q'\mathop {{ V}'} - \overline {q'\mathop {{ V}'} } } \right){\rm{d}}p.\quad\quad\quad\quad\quad\quad\quad$ | (10) |
In Eqs. (7)–(10), overbar represents the time average, and prime represents the anomaly.
Figure 1 shows the cross-section of summer precipitation anomaly percentage averaged from 90° to 145°E during 1983–2011. Summer precipitation anomalies in the region north of 35°N exhibited obvious interdecadal variation characteristics around the late 1990s, accompanied by a rapid decrease in summer precipitation after 1999 (Gong et al., 2015). The interdecadal variation in the low-latitude area (south of 35°N) is not so significant as that in the high-latitude region.

|
| Figure 1 Cross-section of the anomaly percentage (%) of summer precipitation averaged from 90° to 145°E during 1983–2017. Shadings indicate positives values. |
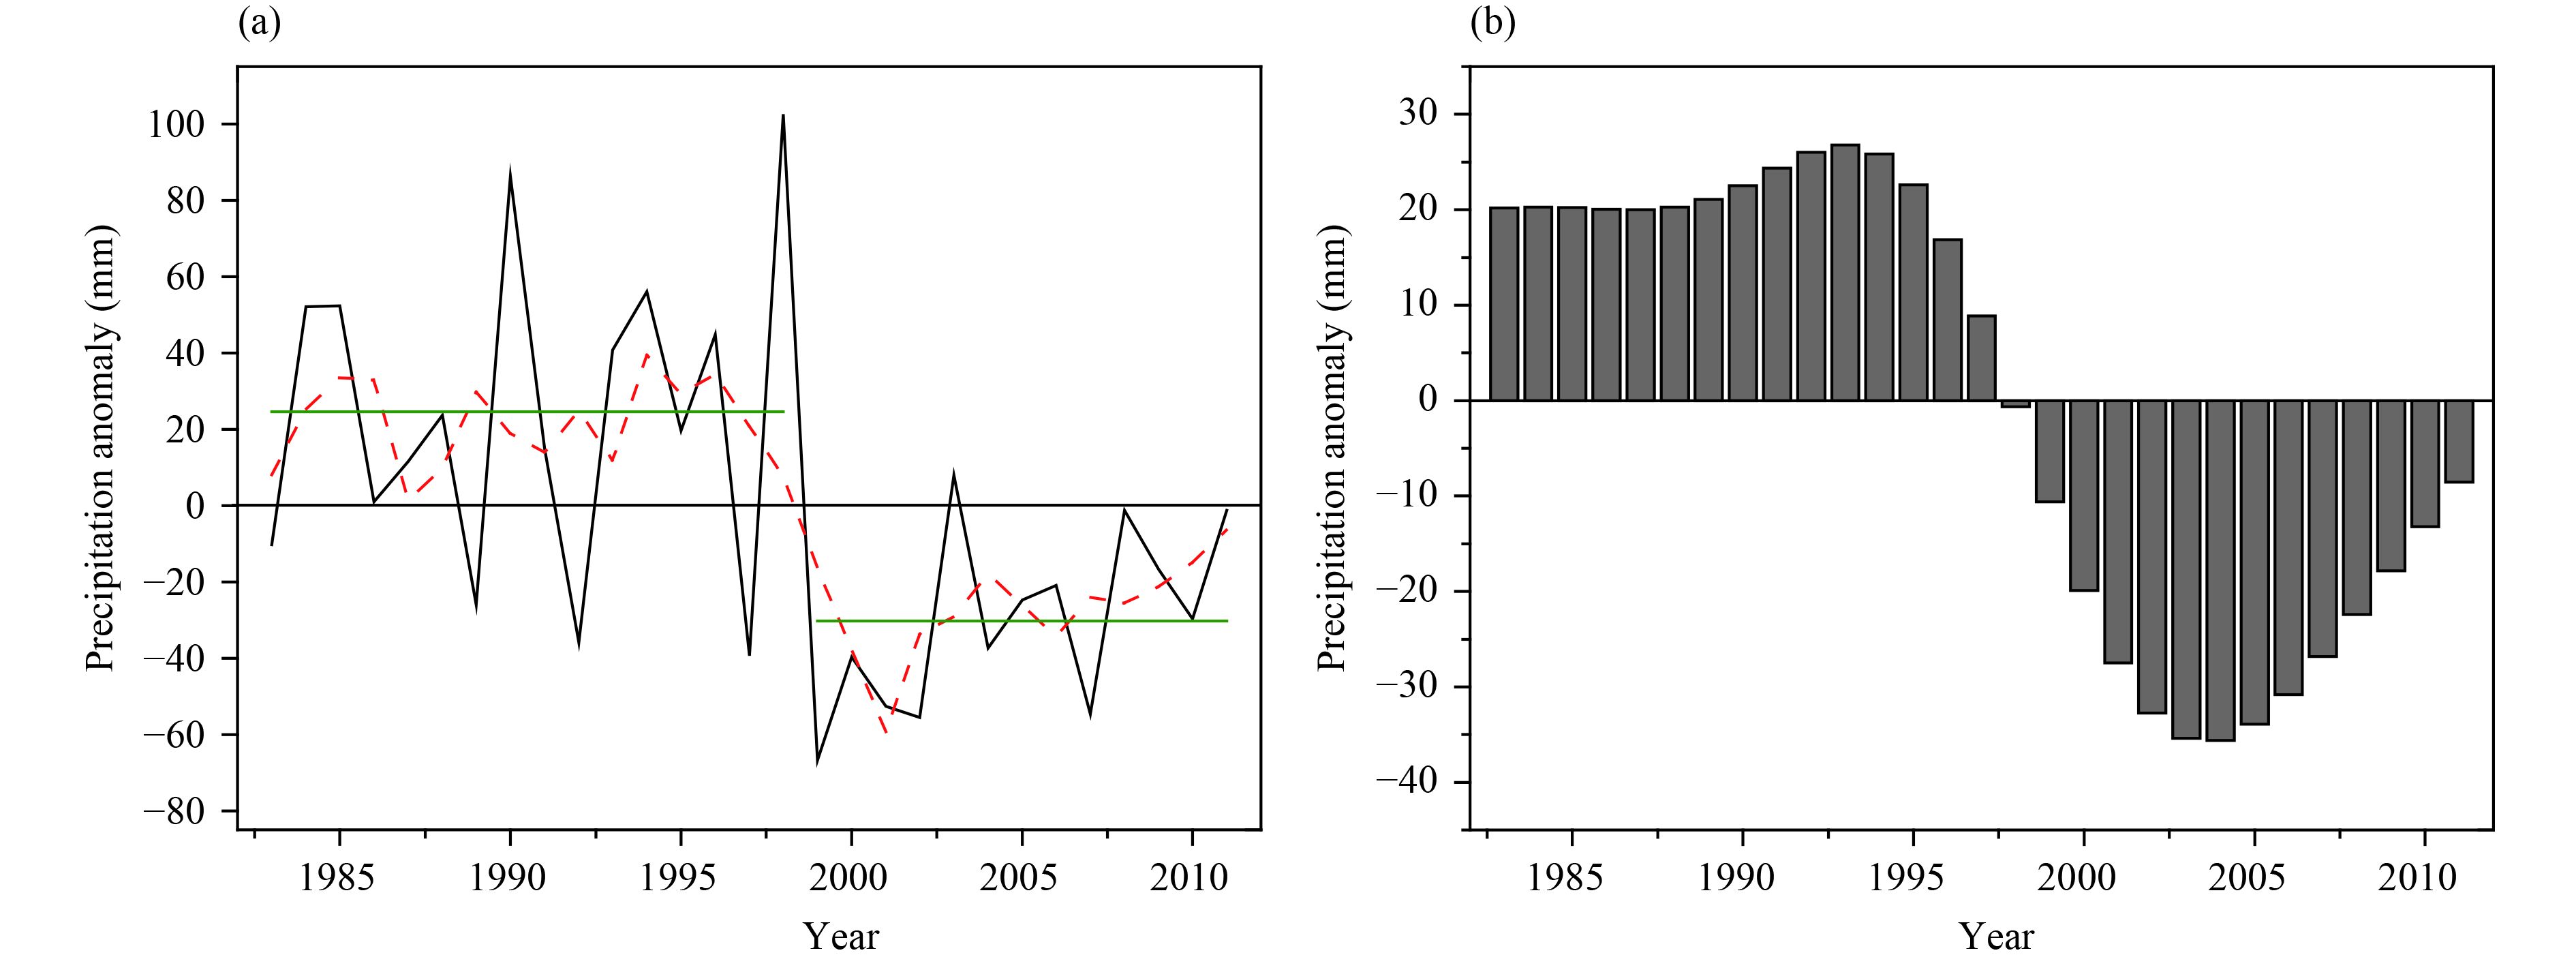
Figure 2 shows the annual anomaly series of summer precipitation averaged over NEA. The original precipitation time series and 7-yr smoothed precipitation time series both exhibit an obvious interdecadal variation around the late 1990s. This interdecadal variation of summer precipitation is consistent with that found in previous studies, indicating that NEA received sufficient precipitation from the early 1980s through the late 1990s, and then precipitation decreased sharply (Si and Ding, 2013; Hu et al., 2014; Sun and Wang, 2015; Xu et al., 2015). The precipitation shift presented in Fig. 2b was obvious in 1998–99, and similar conclusion was obtained in Gong et al. (2015) using empirical orthogonal function analysis. Figure 1 also shows that the precipitation in NEA and southern East Asia increased obviously after 2011. In order to accurately indicate the precipitation decrease after the 1990s, we analyze the precipitation data up to 2011 and show the precipitation anomalies during 1983–98 and 1999–2011, respectively. The average values for the two periods 1983–98 and 1999–2011 exhibit distinct differences in Fig. 3. During 1983–98, except for part of eastern NEA and middle–southern NEA, more precipitation dominated most part of NEA. Compared with that in the prior period, precipitation during 1999–2011 exhibited an opposite anomaly distribution, with less precipitation over most of NEA. Therefore, the summer precipitation in NEA has an obvious interdecadal shift around 1998/99.
|
| Figure 2 Annual summer precipitation anomaly (mm) averaged over NEA (35°–55°N, 90°–145°E) from 1983 to 2011: (a) original time series and (b) the 10-yr filtered time series. In (a), the dashed line indicates the 7-yr smoothed average, and the two horizontal straight green lines indicate the averaged values for the period 1983–98 and 1999–2011, respectively. |

|
| Figure 3 The composite summer precipitation anomaly percentage (%) over NEA for the periods (a) 1983–98 and (b) 1999–2011. Shadings indicate the 95% confidence level. |
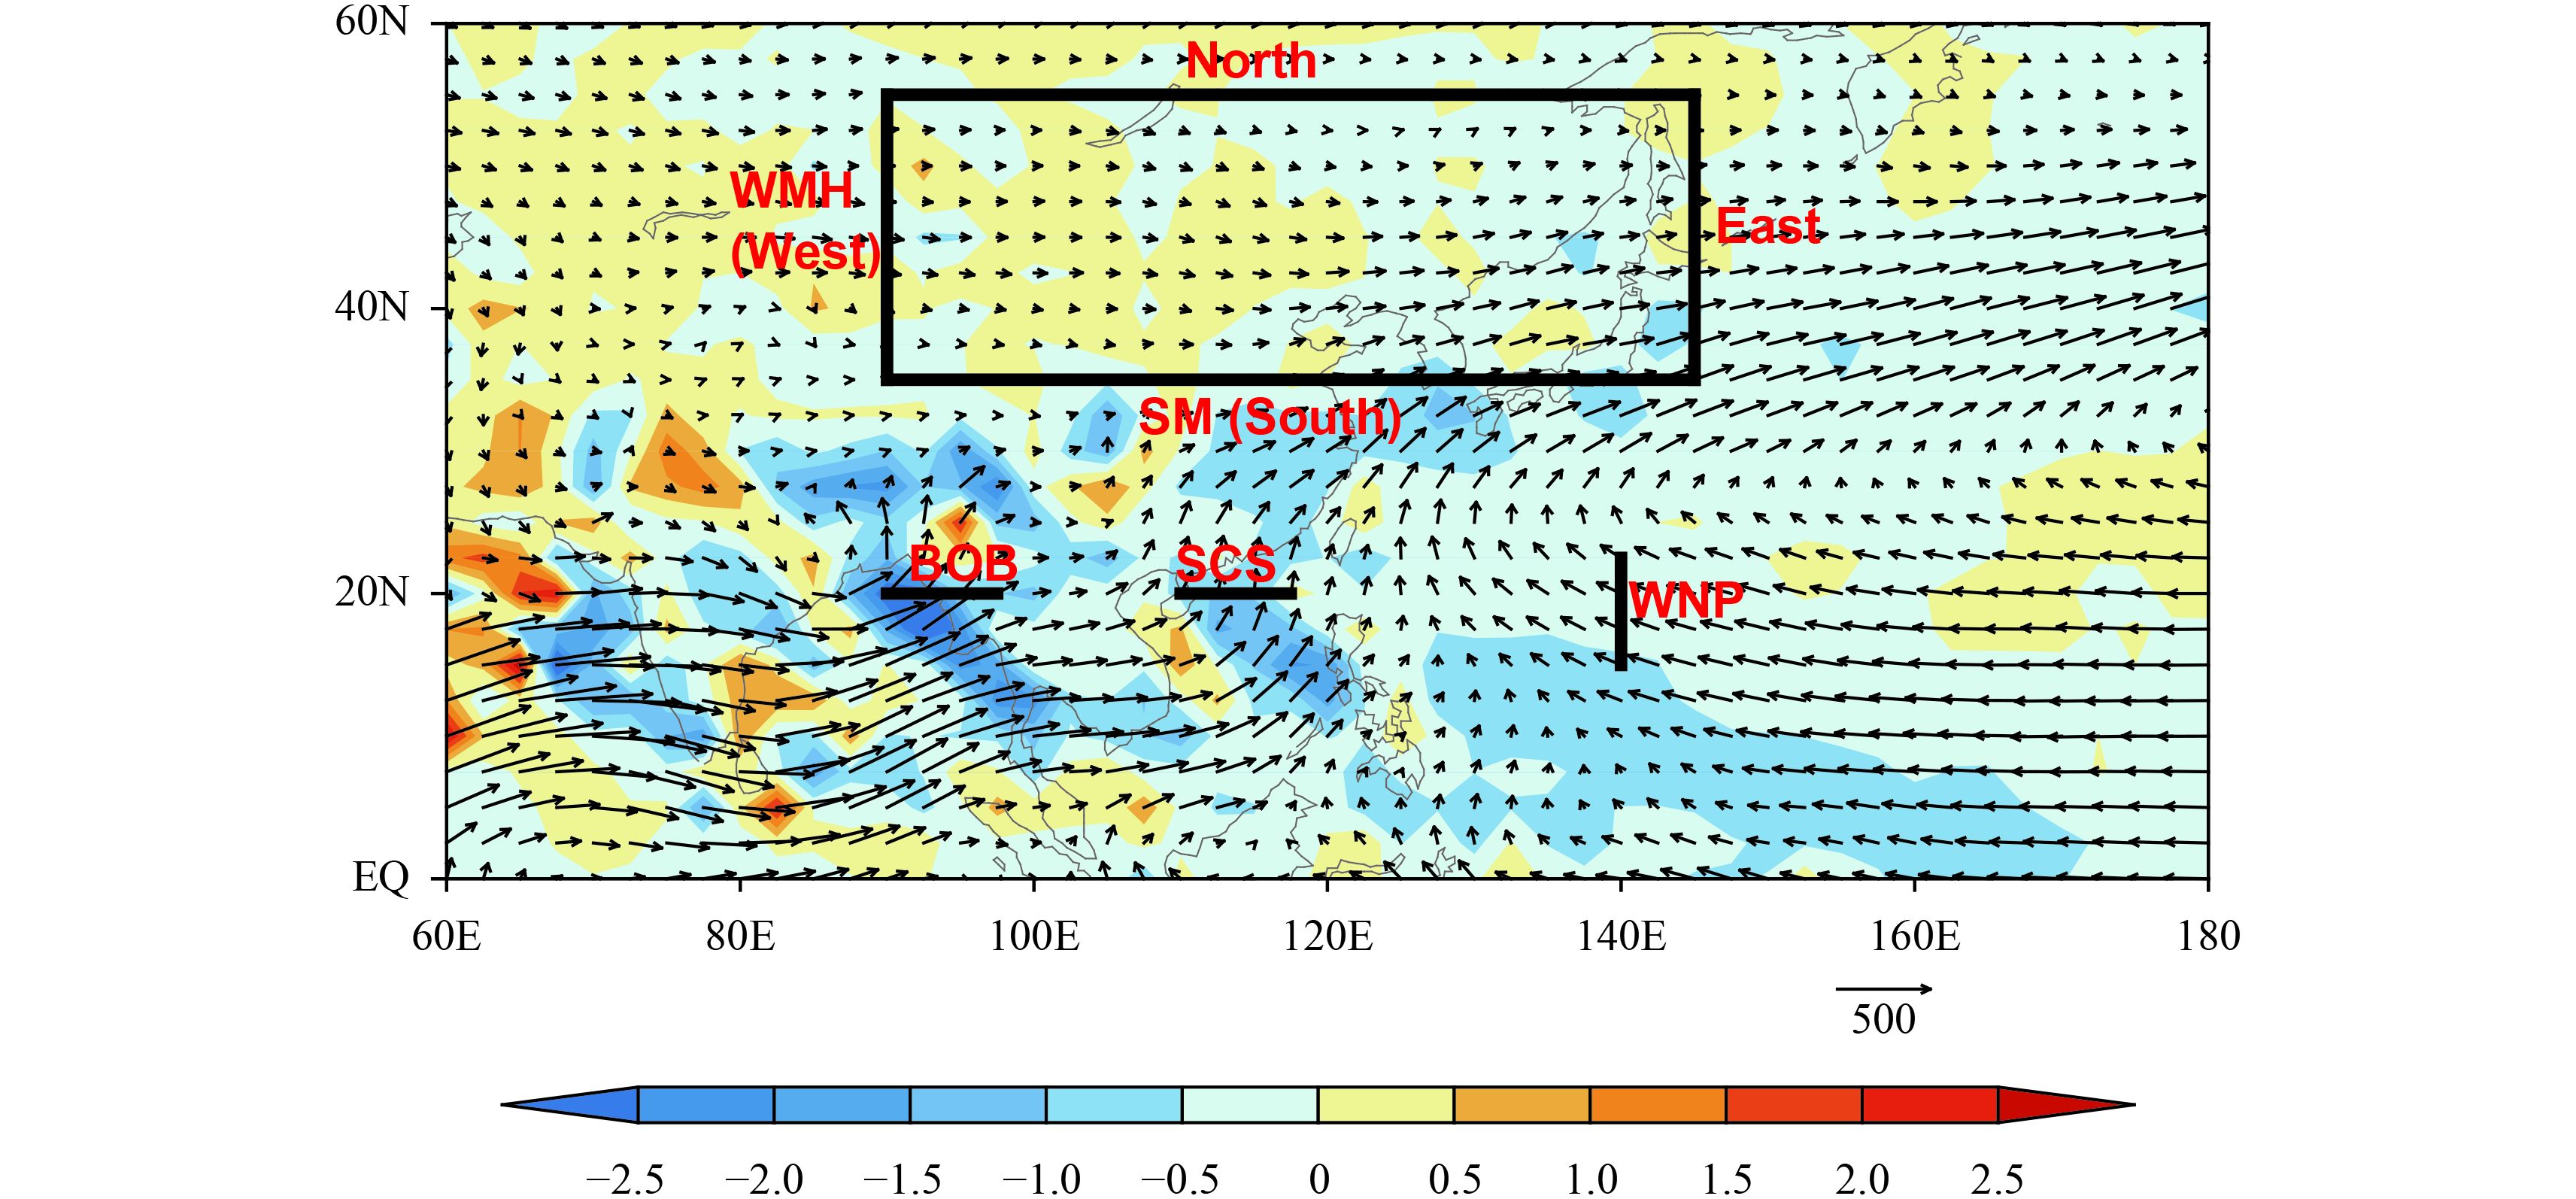
Summer water vapor transport has been previously investigated (Simmonds et al., 1999), and this investigation revealed a close relationship of water vapor transport and summer precipitation in EA. In Fig. 4, water vapor can be transported to EA through four main paths: the southwesterly flow from the Bay of Bengal, the cross-equatorial flow through the South China Sea, the southeasterly summer monsoon flow over western North Pacific, and the westerlies in midlatitudes. Therefore, cross-section lines corresponding to each water vapor transport path are set as: the Bay of Bengal path (BOB; 20°N, 90°–97.5°E); the South China Sea path (SCS; 20°N, 110°–117.5°E); the western North Pacific path (WNP; 15°–22.5°N, 140°E); and the westerly mid–high latitude path (WMH; 35°–55°N, 90°E), which is also the western boundary of NEA (Fig. 4). To calculate the total water vapor transported from the low-latitude region via paths BOB, SCS, and WNP, the cross-section line, which is also the southern boundary of NEA, is set as the southern meridional path (SM; 35°N, 90°–145°E).
|
| Figure 4 The vertically integrated climatological summer moisture flux field (shading denotes magnitude; kg m–1 s–1) averaged from 1991 to 2010. The rectangle represents the NEA region, the three straight thick lines represent the boundaries of water vapor transport path in the low-latitude region, and the abbreviations in red denote the names of each water vapor transport path. |
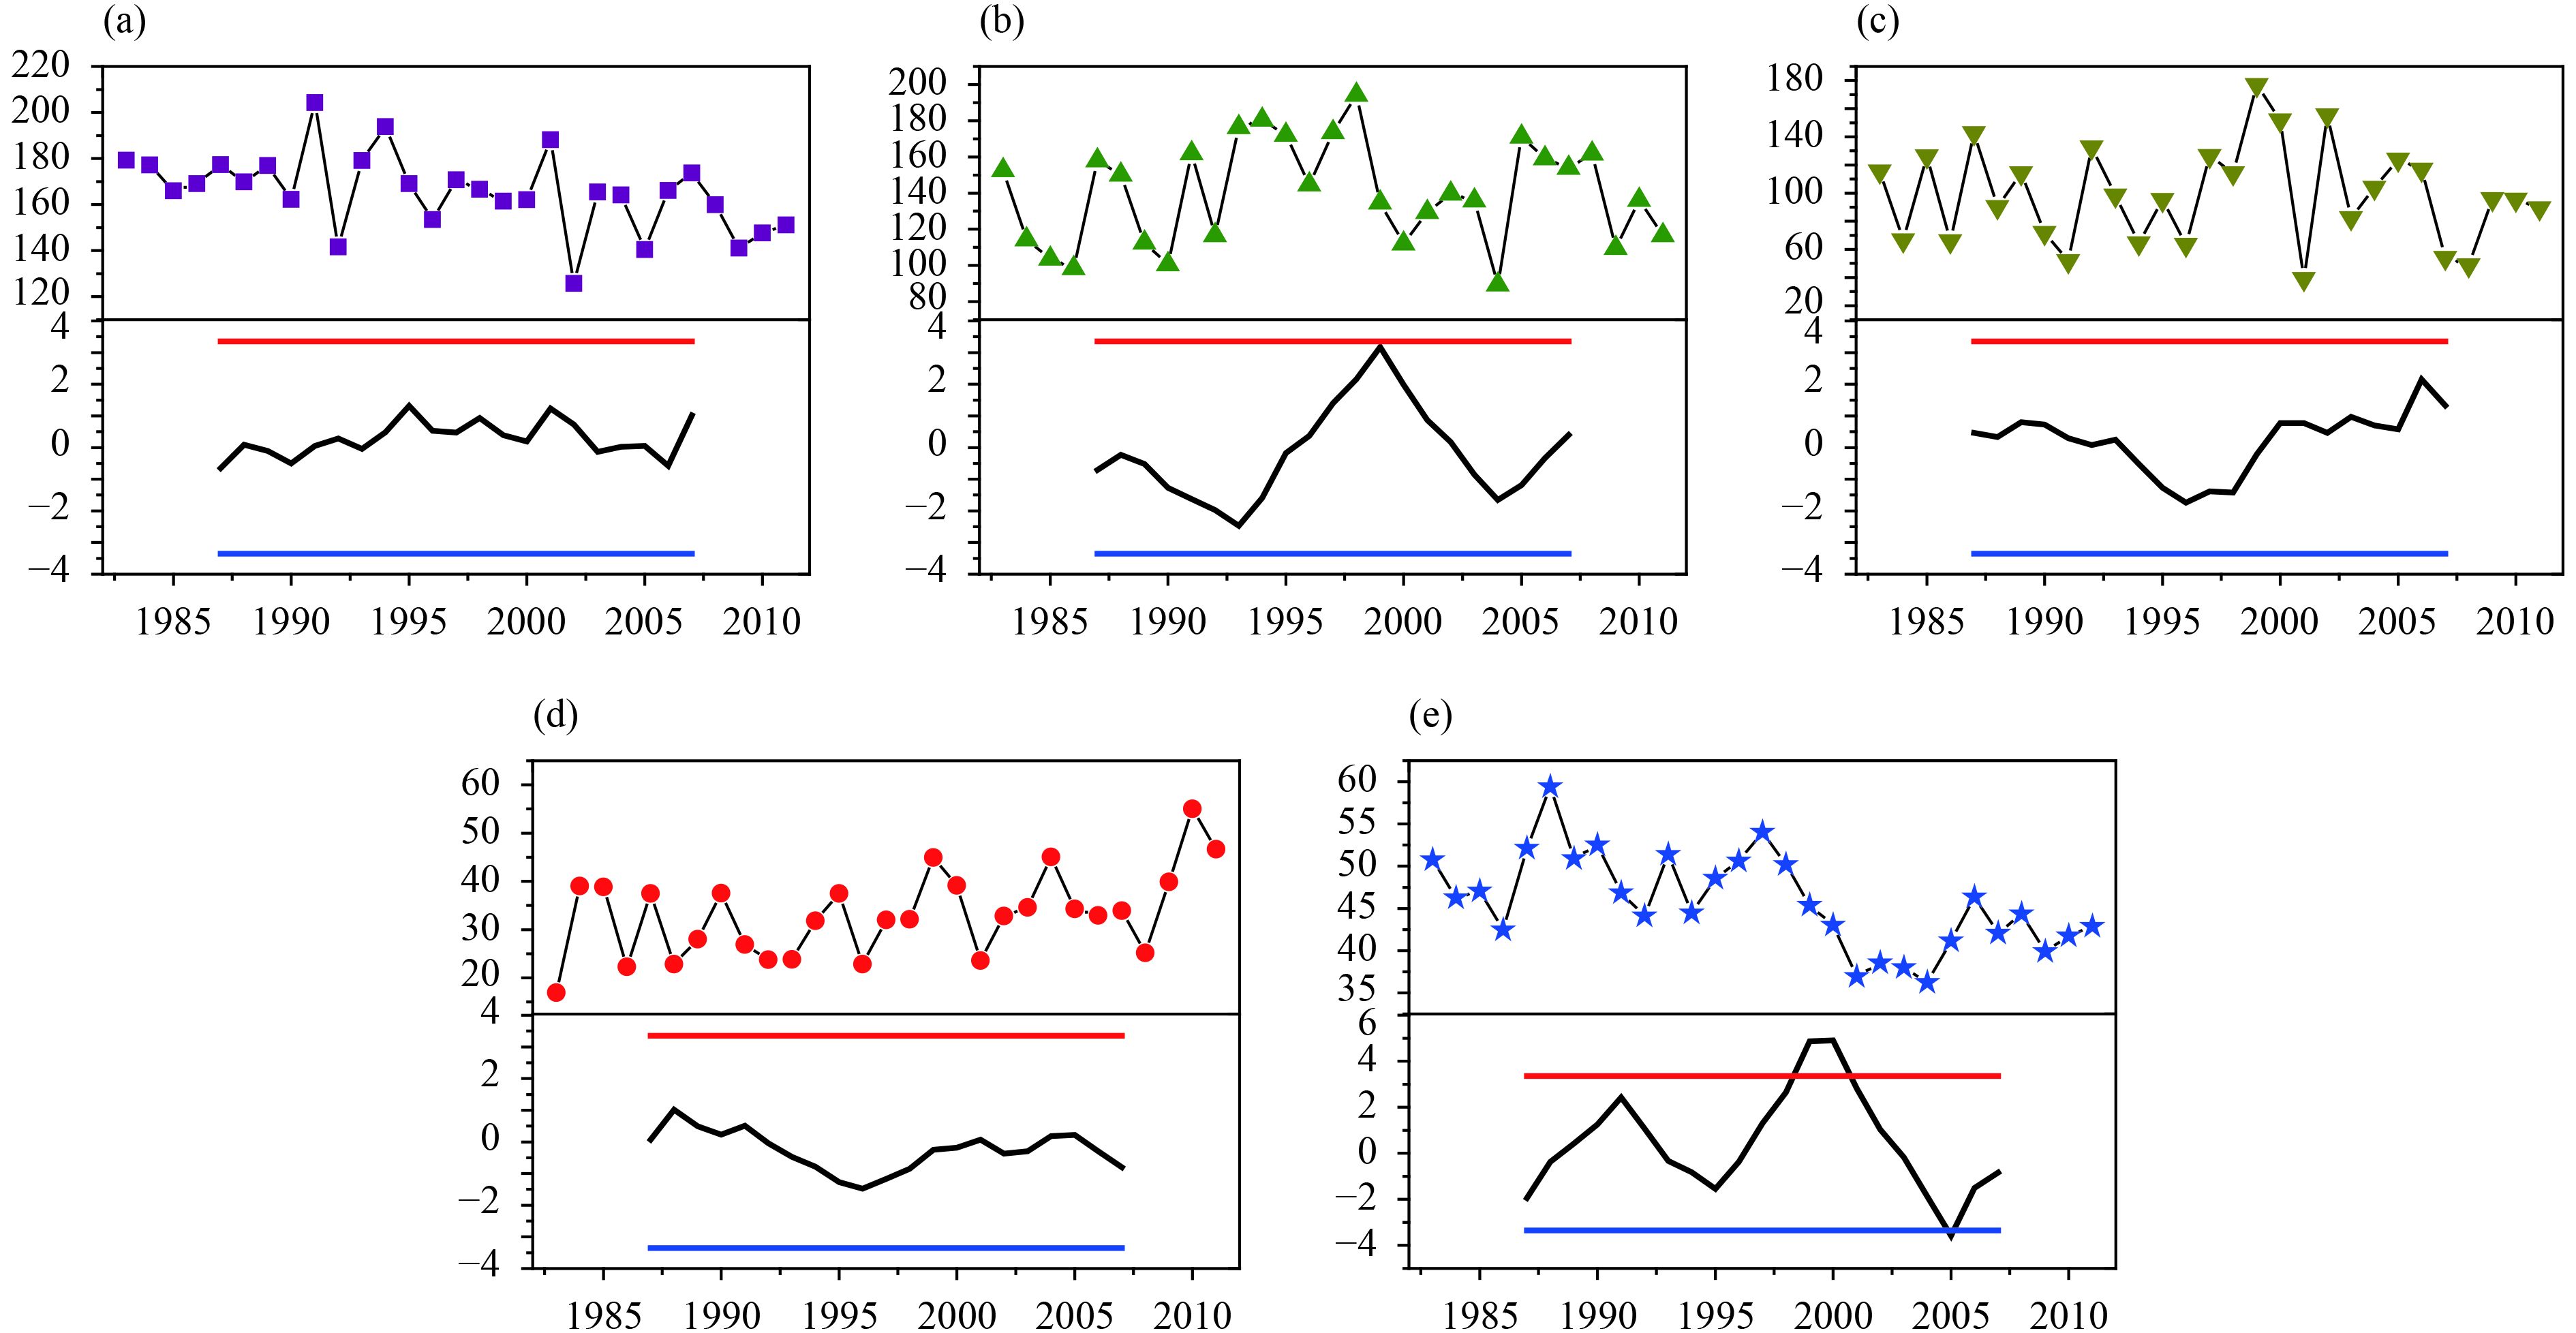
Xu et al. (2015) revealed that water vapor transport has a distinct influence on summer precipitation anomalies. In order to discuss the connection between the water vapor flux and the summer precipitation shift in NEA, anomalies of water vapor flux via five paths defined above were calculated by using Eqs. (1)–(6). These calculations can be applied to understand the contribution of water vapor transport along each path to the summer precipitation shift in NEA around the late 1990s. The annual variations in water vapor flux for each path are shown in Fig. 5. The water vapor fluxes through paths BOB, SCS, WNP, and SM are all dominated by interannual variability rather than the interdecadal change (Figs. 5a–d). The WMH water vapor flux exhibits a significant (as determined with Student’s t-test) and abrupt change in 1999 (Fig. 5e). Accordingly, the water vapor flux transported through the WMH may have contributed to the summer precipitation shift around the late 1990s.
|
| Figure 5 Annual variations of water vapor flux (kg m–1 s–1) through the (a) BOB, (b) SCS, (c) WNP, (d) SM, and (e) WMH path, indicated by the lines with symbols in the upper half of each panel. The lines without symbols in the lower part show the corresponding Student’s t-test results. |
Table 1 lists the mean value and standard deviation of water vapor fluxes transported via each path and the correlation coefficients with summer precipitation in NEA. The average water vapor flux via the BOB path has the largest value, followed in order by the fluxes via SCS, WNP, WMH, and SM. The standard deviation in the water vapor flux transported via WNP has the largest value, followed in order by the standard deviations associated with SCS, BOB, SM, and WMH. The water vapor fluxes transported via the three low-latitude paths of BOB, SCS, and WNP are much greater than via the WMH path, and the flux via the SM path is less than that transported via WMH. This difference implies that moisture inputs to NEA from the BOB, SCS, and WNP paths are limited because most water vapor was transported eastward instead of being advanced northward to NEA via the southern boundary (Fig. 4). The correlation coefficient (CC) between the SM water vapor flux and the NEA summer precipitation reaches 0.48, passing the 95% confidence level. However, CCs of the NEA summer precipitation with water vapor fluxes via the other four paths are all not significant, indicating that summer precipitation anomalies in NEA were mainly caused by water vapor transported via the WMH path.
| Moisture path | Mean value
(kg m–1 s–1) |
Standard deviation | Correlation coefficient |
| BOB | 165.6 | 16.7 | 0.24 |
| SCS | 139.9 | 28.4 | 0.11 |
| WNP | 99.1 | 35.1 | –0.12 |
| SM | 33.16 | 8.7 | 0.04 |
| WMH | 45.3 | 4.5 | 0.48* |
| Note: * indicates the 95% confidence level. | |||
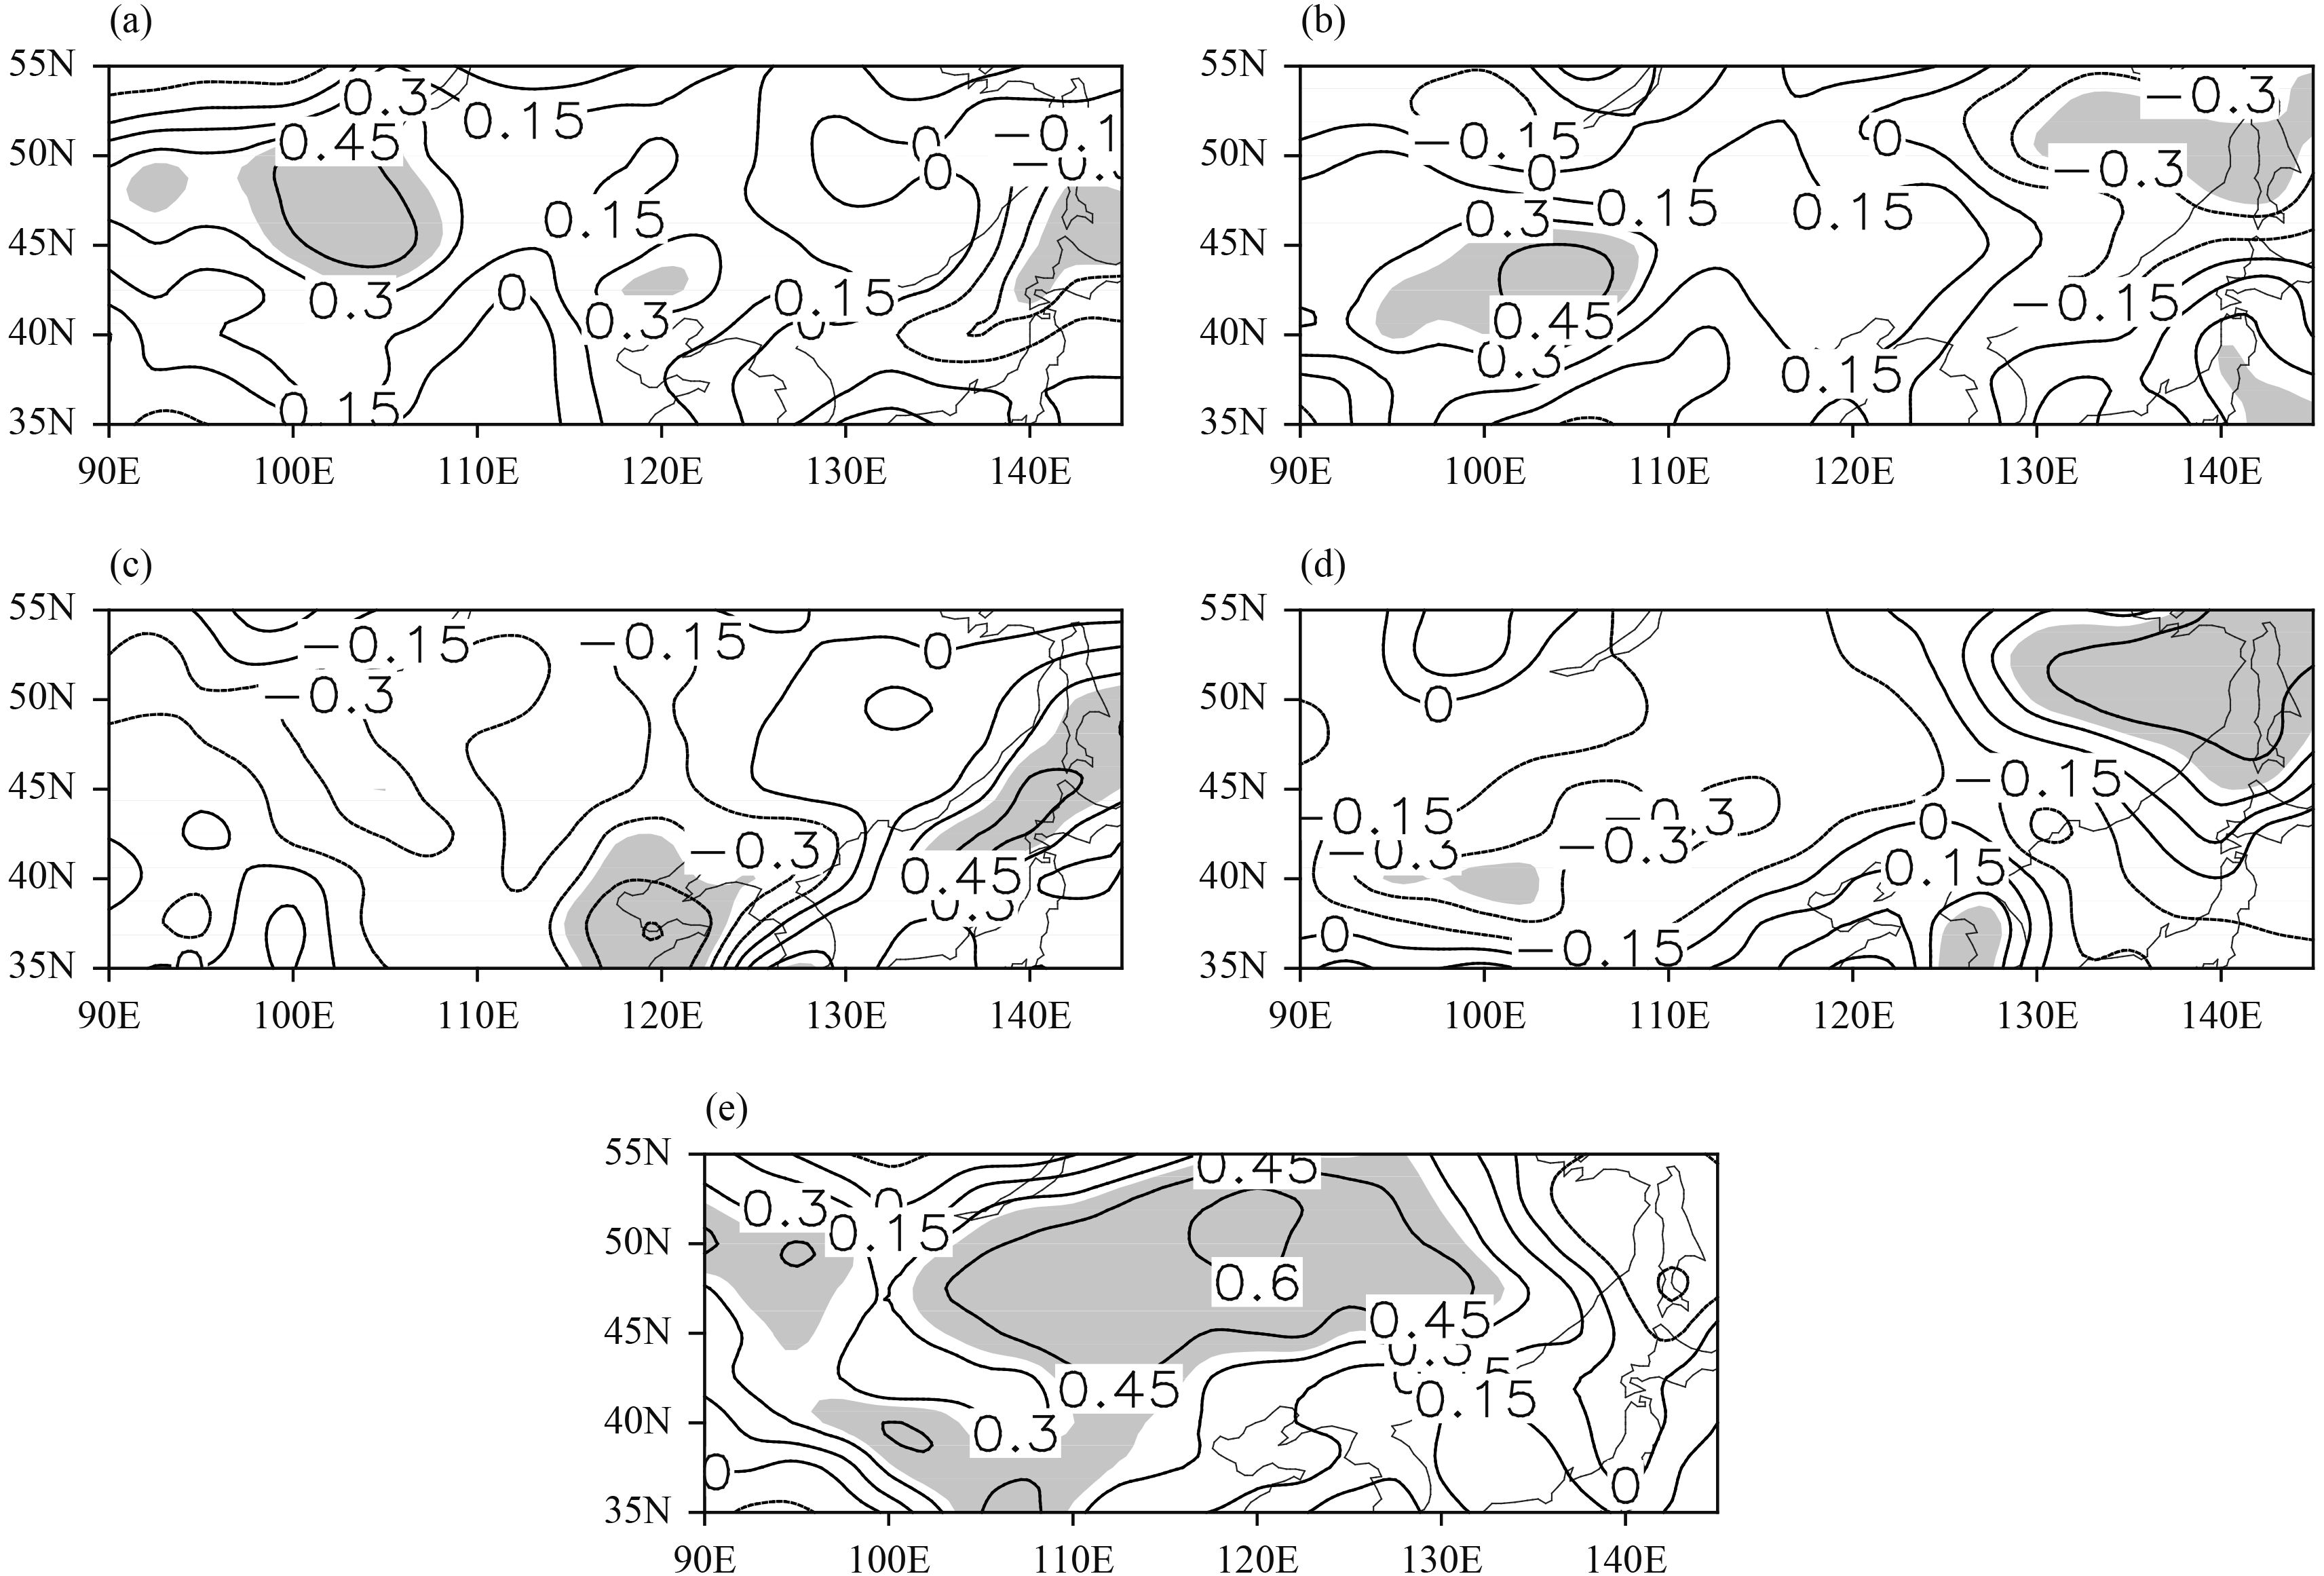
The distributions of CCs between water vapor flux along each path and the NEA summer precipitation are presented in Fig. 6. The significant correlations with the water vapor flux via BOB was mainly limited to parts of western and eastern NEA (Fig. 6a). A similar distribution of significant correlation with water vapor flux via SCS is observed in Fig. 6b. Significantly positive correlations for water vapor flux via WNP and SM are both mainly distributed in parts of eastern NEA (Figs. 6c, d). Moreover, significantly positive correlations for water vapor flux via WMH dominate most of NEA (Fig. 6e), implying that water vapor transported via this path played the most important role in influencing the summer precipitation in NEA.
|
| Figure 6 Correlation coefficients (CCs) of NEA summer precipitation and water vapor transport flux from 1983 to 2011 via paths of: (a) BOB, (b) SCS, (c) WNP, (d) SM, (e) WMH. Shadings indicate the 90% confidence level. |
The average moisture budget via each boundary of NEA associated with the summer precipitation shift around the late 1990s is presented in Fig. 7. The summer water vapor flowing into NEA mainly comes from the northern, western, and southern boundaries, and the water vapor primarily flows out of NEA via the eastern boundary. Before and after the summer precipitation shift occurred around 1998/99, the water vapor flux transported into NEA via the southern boundary increased within (14.57–18.53) × 107 kg s–1, and it is increased within (0.58–1.77) × 107 kg s–1 via the northern boundary, with associated changes in the moisture budget of (3.78 and 1.19) × 107 kg s–1, respectively. The flux transported into NEA via the western boundary decreased within (11.17–9.11) × 107 kg s–1, with the moisture budget change of –2.06 × 10⁷ kg s–1, whereas the flux transported out of NEA via the eastern boundary increased within (21.18–27.43) × 107 kg s–1, with an the moisture budget change of –6.52 × 10⁷ kg s–1. Consequently, the net moisture budget in NEA decreased within (5.14–1.81) × 107 kg s–1. The CC of the summer precipitation in NEA with the relevant net moisture budget is 0.76, implying that less input and more output of moisture via the four boundaries directly cause the decrease of summer precipitation in NEA. The CCs between summer precipitation in NEA and the water vapor transport fluxes via the four boundaries are respectively –0.29, 0.59, 0.06, and 0.23, of which only the correlation for the western boundary passes the 95% confidence level. Accordingly, the reduced net moisture budget may directly lead to the decrease in summer precipitation in NEA after 1999, and the less moisture input from the western boundary contributed the most to this shift. Although the input through the southern boundary was much greater than that from the west, most of the water vapor transport was eastward (Fig. 6) and had limited contribution to the interdecadal shift of summer precipitation in NEA.

|
| Figure 7 Average summer water vapor flux (kg s–1) through each NEA boundary and the moisture budget (kg s–1) over NEA associated with the summer precipitation shift during (a) 1983–98 and (b) 1999–2011. The values in the rectangle represents the net moisture budget. Negative fluxes at the northern boundary refer to the water vapor input. |
In Fig. 8, the zonal water vapor flux gradually increased from west to east. Compared with the zonal water vapor flux for 1999–2011, the flux for 1983–98 exhibits that higher values dominate the region west of 128°E and lower values control the region east of 128°E (Fig. 8a). In Fig. 9a, negative differences in zonal water vapor are located in the region (35°–50°N, 90°–128°E), implying that water vapor transported from west to east in the middle and western NEA decreased and caused a lesser moisture input via the western boundary. The positive differences distributed in the region (35°–55°N, 130°–135°E) indicate that water transport from west to east in the eastern NEA increased, leading to more output via the eastern boundary. As shown in Fig. 8b, the meridional water vapor fluxes for the two periods were very similar, especially in the low-latitude region. However, the zonal water vapor flux in this region was much greater and gradually decreased from east to west (Fig. 8a). The northward water vapor flux over 40°–55°N for 1983–98 was less than that for 1999–2011, indicating that a negative difference in water vapor flux dominated most of the region (40°–50°N, 120°–130°E), as shown in Fig. 9b. The moisture input for the second period through the northern boundary was much greater than that in the first period, implying that the northern boundary water vapor transport is not the key factor triggering the reduction in summer precipitation in NEA after 1998/99. Therefore, variations in the zonal water vapor transport played a more crucial role than meridional transport in causing the summer precipitation shift in NEA in the late 1990s.

|
| Figure 8 The (a) zonal and (b) meridional water vapor fluxes (kg m–1 s–1) averaged over 35°–55°N, 90°–145°E. The black and green lines indicate the averages during 1983–98 and 1999–2011, respectively. |

|
| Figure 9 Spatial distributions of the difference of (a) zonal and (b) meridional water vapor fluxes (kg m–1 s–1) calculated as the value for 1999–2011 minus that for 1983–98. Shadings indicate the 95% confidence level. |
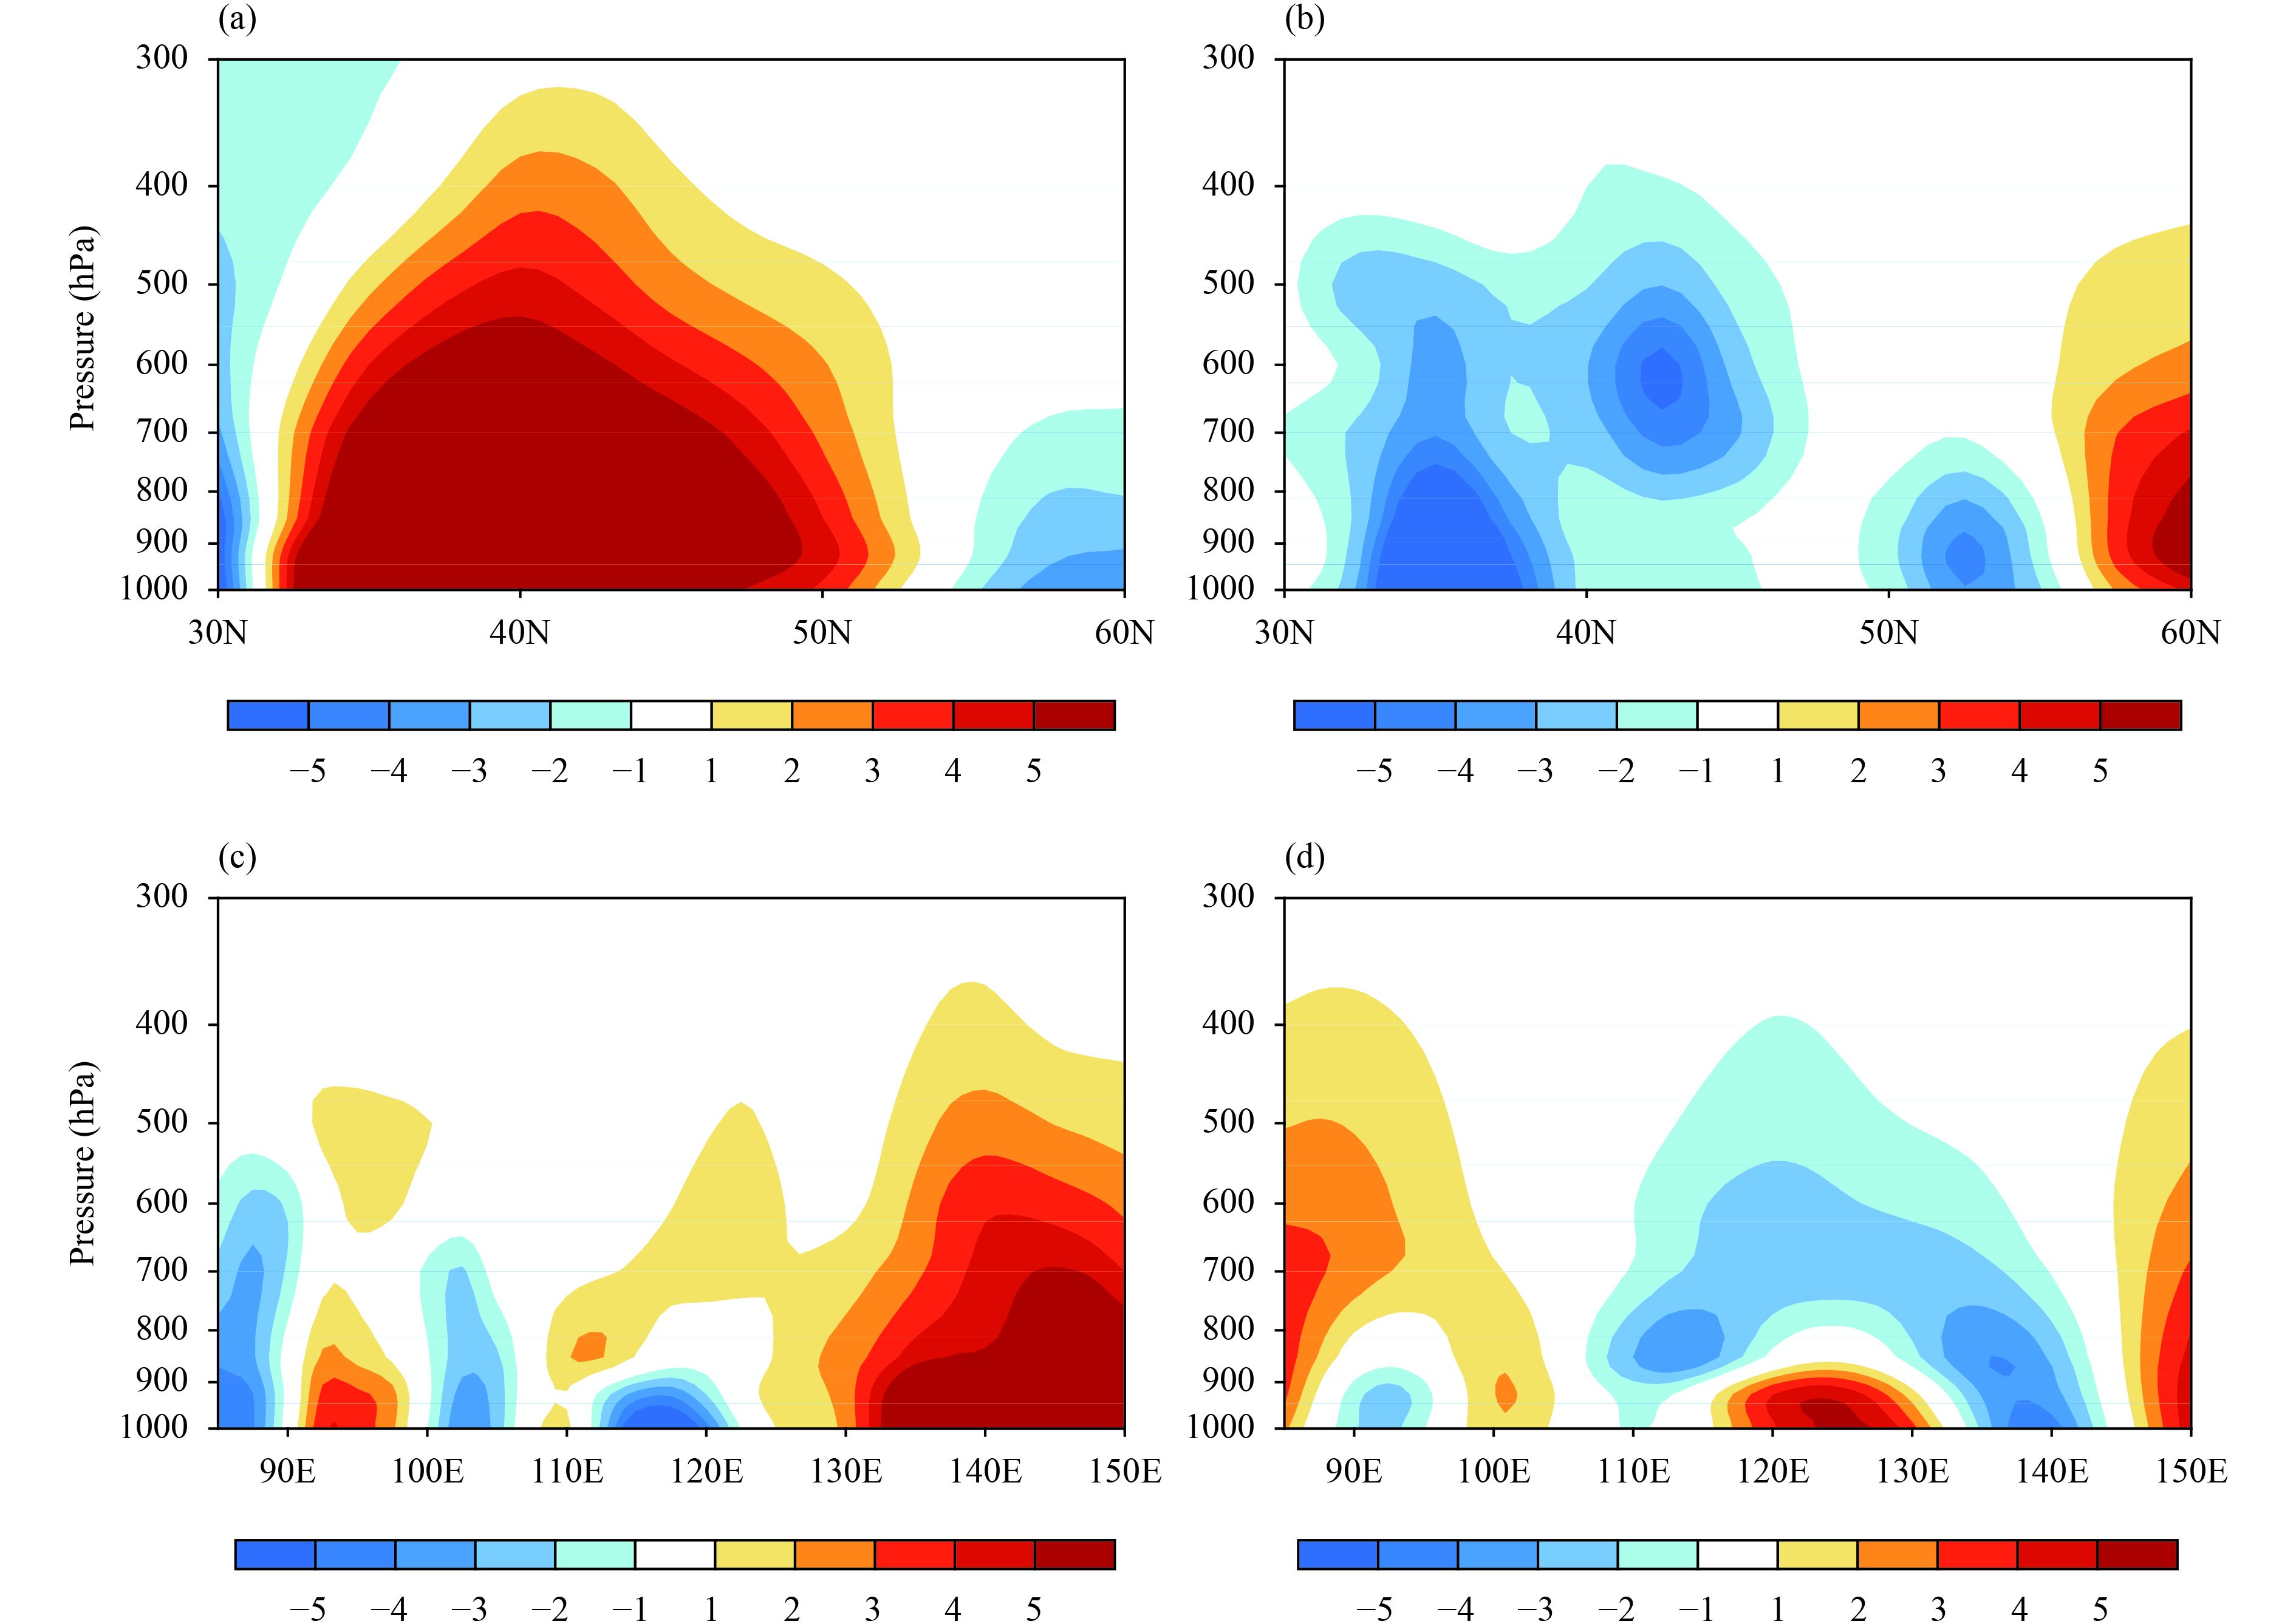
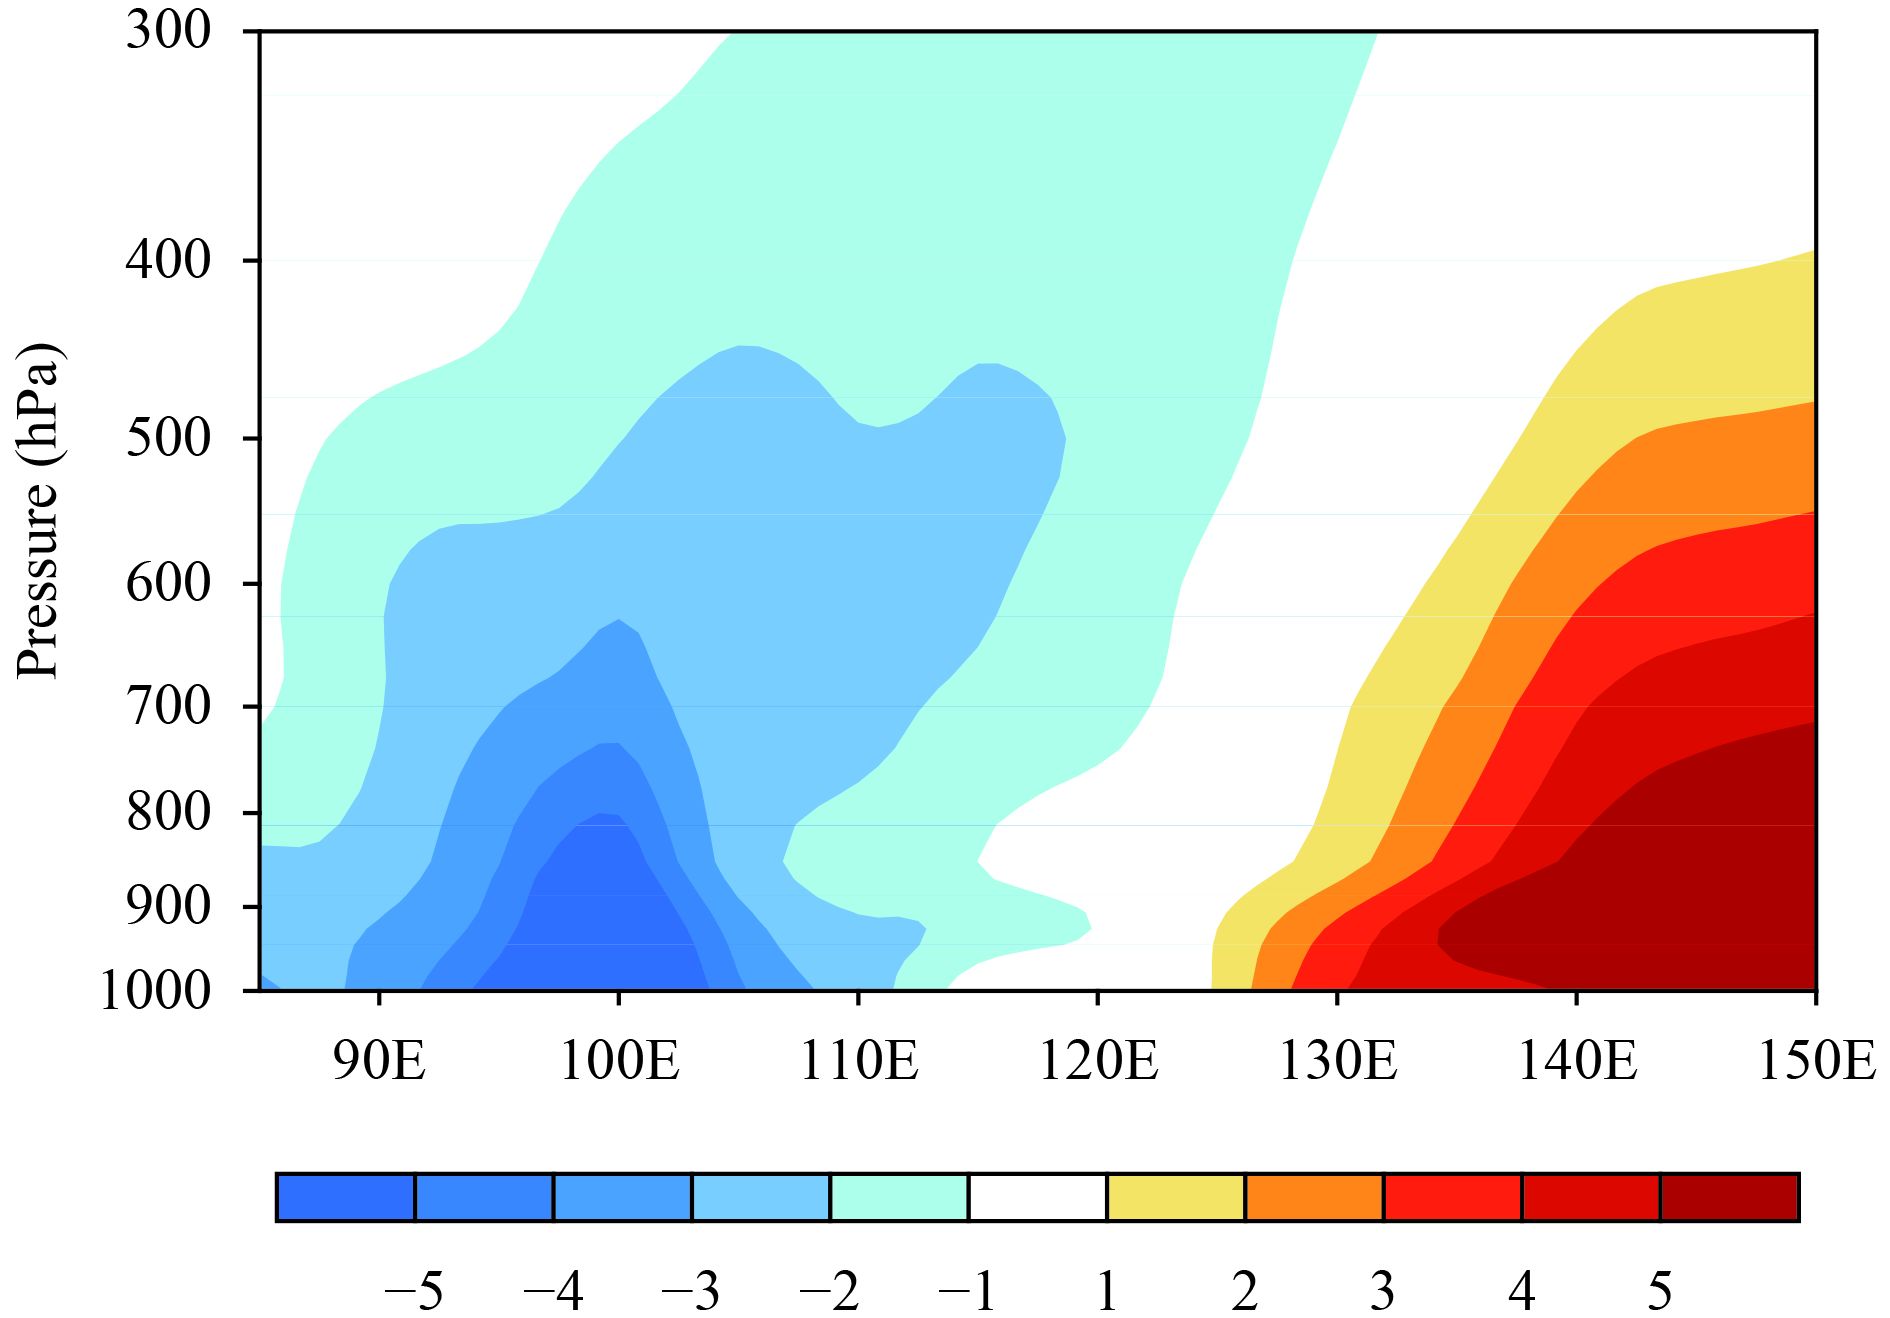
To further understand water vapor transport variation, vertical distributions of the water vapor flux difference via each lateral NEA boundary before and after the late-1990s shift are presented in Fig. 10. The anomalous water vapor output during the second period was mainly concentrated along the whole eastern boundary from 1000 to 500 hPa (Fig. 10a). The anomalous input of water vapor via the western boundary was mainly located over 35°–40°, 40°–45°, and 50°–55°N (Fig. 10b), with high-value centers distributed at levels 1000–900 and 700–600 hPa, respectively. A scattered distribution of anomalous water vapor input through the southern boundary was located west of 125°E, whereas anomalous outputs were concentrated in the region east of 130°E over 1000–500 hPa (Fig. 10c). In Fig. 10d, anomalous water vapor inputs via the northern boundary were primarily located in the region 110°–140°E over 900–700 hPa. In Fig. 11, the difference of the meridional average in water vapor fluxes exhibited vertical inputs in the region west of 120°E and outputs in the region east of 130°E. These changes were mainly concentrated at low levels from 1000 to 700 hPa, accompanied by some unique vertical differences at each NEA boundary.
|
| Figure 10 Vertical cross-sections of water vapor transport flux differences (kg m–1 s–1) via the (a) eastern, (b) western, (c) southern, and (d) northern boundaries calculated as the value for 1999–2011 minus that for 1983–98. |
|
| Figure 11 Vertical cross-section of differences in meridional average of water vapor transport flux (kg m–1 s–1) calculated as the value for 1999–2011 minus that for 1983–98. |
Based on the above analysis, it is inferred that the westerly water vapor transport is one of the key factors that influence the shift in summer precipitation over NEA in the late 1990s. Figure 12 shows the anomalous water vapor transport and its divergence. The water vapor from the Pacific Ocean, in addition to other locations in NEA, formed a cyclonic anomaly of water vapor transport and moisture convergence, which corresponded to enhanced precipitation in NEA, during 1983–98 (Fig. 12a). During 1999–2011, the water vapor transport exhibited an opposite trend and was accompanied by an abnormal anticyclonic water vapor circulation and moisture divergence over NEA (Fig. 12b), thereby reducing precipitation in NEA. The anomalous anticyclone appearing to the south of Lake Baikal (Fig. 12b) is important for the decreased water vapor and thus precipitation over NEA after the late 1990s. Branching from this anomalous anticyclone, the easterly anomalies indicate weakened westerlies (Zhu et al., 2011, 2015; Han et al., 2015, 2017).

|
| Figure 12 Anomalies of the divergence (shaded) and relevant vertically integrated water vapor transport flux (vector; kg m–1 s–1) during (a) 1983–98 and (b) 1999–2011. Shadings indicate the 90% confidence level. |
The variations in water vapor transport around the late 1990s, in addition to the moisture budget, played a crucial role in influencing the NEA summer precipitation shift. Understanding the possible connection between NEA summer precipitation and the water vapor transport, especially recognizing factors affecting the moisture budget, will improve our knowledge of drought and flood changes in NEA. Water vapor transport means the moisture transported from the source to convergence/divergence region, so its variation has close connections with the combined effect of the wind and humidity fields. Huang et al. (1998) revealed that the wind disturbance field played an important role in influencing the water vapor transport anomalies over EA. It was also found that the low-level wind has a determining role in impacting the anomalies of water vapor transport over EA.
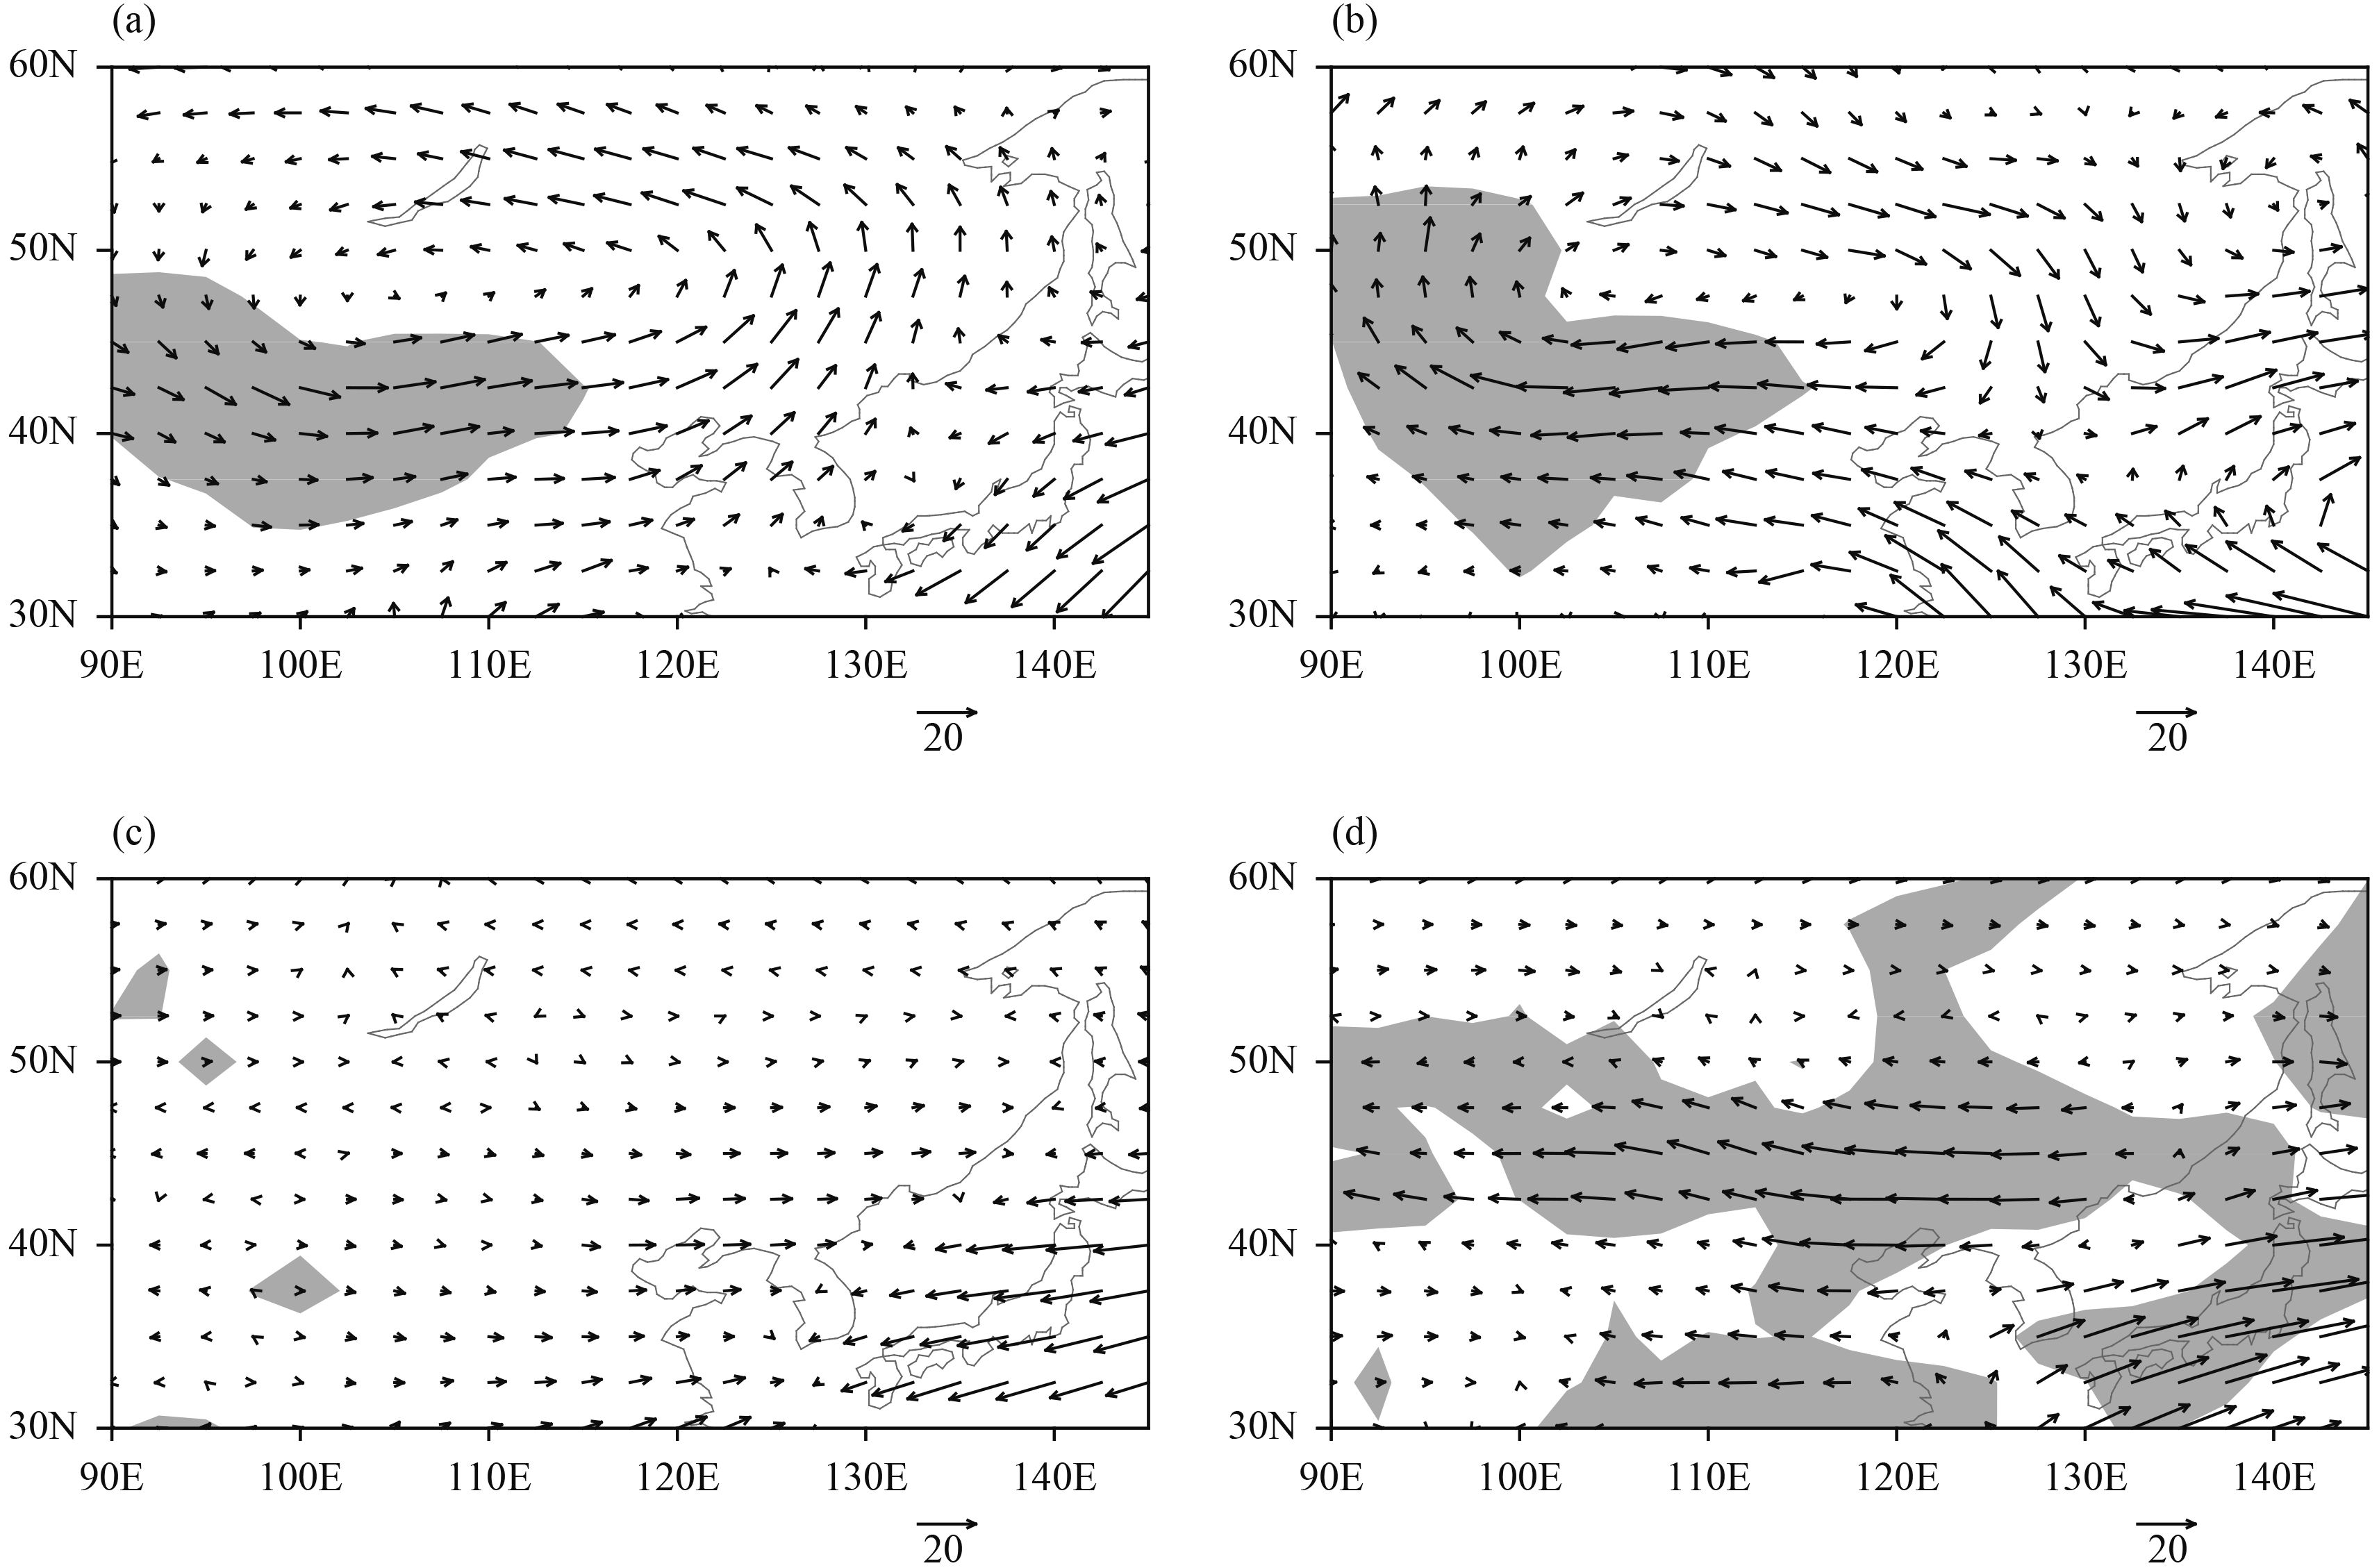
In order to study the respective effects on the shift of water vapor transport of the relevant humidity field and the wind field at 850-hPa level during 1983–98 and 1999–2011, anomalies of the water vapor fluxes were respectively decomposed into the wind component
|
| Figure 13 Mean water vapor (kg m–1 s–1) transported by (a, b) the wind disturbance field and (c, d) moisture disturbance field at 850 hPa during (a, c) 1983 –98 and (b, d) 1999–2011. Shadings indicate the 95% confidence level. |
Regarding the physical mechanism of the water vapor transport leading to the precipitation shift after 1999, the anomalous anticyclone over NEA presented in this study played an important role. Han et al. (2017) also revealed a zonal tripole pattern in the middle to high latitudes of the North Asia–Pacific region and an anomalous anticyclone over Japan was mainly responsible for Northeast China summer precipitation anomaly, which is consistent with the reason for the water vapor transport and precipitation anomalies over NEA revealed in the current paper. Zhu et al. (2015) also illustrated that the East Asian westerly jet stream (EAWJS) shifted poleward after the late 1990s compared to the period 1980–99, which may have induced weakened and poleward shifted jet-related secondary meridional–vertical circulation, with anomalous descending motion to its north, causing the anticyclonic anomalies in NEA. Accordingly, the anticyclonic anomalies in NEA may have caused the water vapor transported via the western boundary to significantly decrease and played a crucial role in reducing precipitation in NEA.
In addition to the aforementioned causes for adjustment of the water vapor transport over NEA, linkage may also exist between the some remote factors (e.g., Pacific Decadal Oscillation/Atlantic Multidecadal Oscillation, PDO/AMO) and the anticyclonic anomalies over NEA. According to some previous studies (e.g., Zhu et al., 2011; Sun and Wang, 2012), the former (PDO) linkage is relatively direct due to the close locations, while the later (AMO) relationship is mainly through a teleconnection wave train pattern from North Atlantic to East Asia. In Fig. 14, the obvious interdecadal changes of PDO and AMO around the late 1990s were both observed, well consistent with the water vapor transport and summer precipitation adjustment in NEA. This further reflects that PDO/AMO may act as the remote factors in triggering the late 1990s change. According to the simulations conducted by Zhu et al. (2015), the negative PDO mode is most likely the prime driver of observed changes in the upper circulation since the late 1990s, especially for the weakened and poleward shifted EAWJS, which could be a bridge to link the negative PDO mode to the local circulation over East China, thus result in more precipitation in middle East Asia but less precipitation in Northeast China. Zhu et al. (2015) also simulated the teleconnection wave train pattern forced by the positive AMO mode from North Atlantic to East Asia through the Eurasian continent. The anticyclonic anomalies were reproduced but with much weaker and insignificant values, reflecting that only very weak changes were induced by the positive AMO.

|
| Figure 14 Annual variations of summer (a) PDO and (b) AMO indices. The red curves indicate the 5-yr moving average. |
In this study, the summer precipitation shift over NEA that occurred around the late 1990s and relevant changes in water vapor transport over East Asia and North Pacific were investigated. The water vapor transport flux via different paths and its association with the summer precipitation shift in NEA were examined. The horizontal and vertical distributions, temporal variation of water vapor transport, net moisture budget in NEA, the crucial boundary of the water vapor transport fluxes, and the contribution caused by the wind disturbance as well as moisture disturbance were also elaborated. Preliminary conclusions are as follows.
(1) The anomalies in summer precipitation in NEA exhibited an obvious interdecadal shift in the late 1990s, which was accompanied by a rapid summer precipitation decrease after 1999, consistent with the adjustment of summer precipitation in EA revealed by previous studies (Huang R. H. et al., 2013; Gong et al., 2016). Moisture input in EA was primarily transported through the paths of BOB, SCS, WNP, and WMH, in which water vapor transported via the three low-latitude paths, i.e., BOB, SCS, and WNP, were much greater than that via the WMH path. However, the moisture input to NEA contributed by the three low-latitude paths was much limited because most water vapor was transported eastward instead of being advanced northward to NEA. Water vapor from the WMH path exhibited a significant shift around the late 1990s and had a significant correlation with summer precipitation in NEA, implying that water vapor transported via the WMH path played the most important role in triggering the late 1990s summer precipitation shift in NEA.
(2) The water vapor transport in the zonal direction increased from west to east, whereas the water vapor transport in the meridional direction decreased from south to north. During 1999–2011, in the middle and western NEA, zonal water vapor transport decreased, causing less input to the water vapor via the western boundary, while the water vapor transport increased in the eastern NEA, leading to more output through the eastern boundary. Moreover, the moisture inputs during 1999–2011 via the northern and southern boundary were both greater than during 1983–98. The vertical water vapor transport also reflected less input through the western boundary and more output through the eastern boundary, with zonal water vapor transport fluxes concentrated at low–middle levels. Compared to the variations of the meridional water vapor, the zonal water vapor transport contributed more in causing the late 1990s shift of the summer precipitation in NEA. It is found that the anomalies of water vapor transport and summer precipitation over NEA were primarily influenced by the wind disturbance rather than the moisture disturbance.
Compared with previous studies (Lu, 2005; Wang et al., 2010; Li et al., 2012), this paper confirmed the summer precipitation shift over NEA in the late 1990s and revealed the relevant water vapor transport anomalies that are responsible for this interdecadal shift. As remote factors, the PDO/AMO played important roles in triggering the late 1990s changes in water vapor transport and summer precipitation in NEA. In addition to the anomalous water vapor transport and PDO/AMO, soil moisture anomalies from previous winter to summer and snow cover anomalies over the Euro–Asia region (Wu et al., 2005; Zuo and Zhang, 2007) may also have influenced the interdecadal changes of summer precipitation in NEA. Accordingly, studies remain to be performed; for example, exploring the factors that influence water vapor transport via westerlies between North Atlantic and East Asian monsoon regions. Finding solutions to these water vapor and precipitation related problems will require further investigations in the future.
Acknowledgment. The authors thank Hongming Yan, Yuan Yuan, and Jianbo Cheng for help proofreading this paper. Moreover, we are grateful to the editors and reviewers for their valuable comments.
| Chen, W., and R. Y. Lu, 2014a: A decadal shift of summer surface air temperature over Northeast Asia around the mid-1990s. Adv. Atmos. Sci., 31, 735–742. DOI:10.1007/s00376-013-3154-4 |
| Chen, W., and R. Y. Lu, 2014b: The interannual variation in monthly temperature over Northeast China during summer. Adv. Atmos. Sci., 31, 515–524. DOI:10.1007/s00376-013-3102-3 |
| Ding, Y. H., 1992: Summer monsoon rainfalls in China. J. Meteor. Soc. Japan, 70, 373–396. |
| Ding, Y. H., and J. C. L. Chan, 2005: The East Asian summer monsoon: An overview. Meteor. Atmos. Phys., 89, 117–142. DOI:10.1007/s00703-005-0125-z |
| Ding, Y. H., Z. Y. Wang, and Y. Sun, 2008: Inter-decadal variation of the summer precipitation in East China and its association with decreasing Asian summer monsoon. Part I: Observed evidences. Int. J. Climatol., 28, 1139–1161. DOI:10.1002/joc.1615 |
| Ding, Y. H., Y. Sun, Z. Y. Wang, et al., 2009: Inter-decadal variation of the summer precipitation in China and its association with decreasing Asian summer monsoon. Part II: Possible causes. Int. J. Climatol., 29, 1926–1944. DOI:10.1002/joc.1759 |
| Feng, G. L., Z. Q. Gong, R. Zhi, et al., 2008: Analysis of precipitation characteristics of South and North China based on the power-law tail exponents. Chinese Phys. B, 17, 2745–2752. DOI:10.1088/1674-1056/17/7/065 |
| Gao, H., W. Jiang, and W. J. Li, 2014: Changed relationships between the East Asian summer monsoon circulations and the summer rainfall in eastern China. J. Meteor. Res., 28, 1075–1084. DOI:10.1007/s13351-014-4327-5 |
| Gong, Z. Q., J. H. Zhao, G. L. Feng, et al., 2015: Dynamic–statistics combined forecast scheme based on the abrupt decadal change component of summer precipitation in East Asia. Sci. China Earth Sci., 58, 404–419. DOI:10.1007/s11430-014-4967-4 |
| Gong, Z. Q., S. F. Li, P. Hu, et al., 2016: Dynamic–analogue correction of the decadal change of East Asian summer precipitation in the late 1990s. J. Meteor. Res., 30, 341–355. DOI:10.1007/s13351-016-5220-1 |
| Han, T. T., H. P. Chen, and H. J. Wang, 2015: Recent changes in summer precipitation in Northeast China and the background circulation. Int. J. Climatol., 35, 4210–4219. DOI:10.1002/joc.4280 |
| Han, T. T., H. J. Wang, and J. Q. Sun, 2017: Strengthened relationship between eastern ENSO and summer precipitation over northeastern China. J. Climate, 30, 4497–4512. DOI:10.1175/JCLI-D-16-0551.1 |
| He, W. P., G. L. Feng, Q. Wu, et al., 2012: A new method for abrupt dynamic change detection of correlated time series. Int. J. Climatol., 32, 1604–1614. DOI:10.1002/joc.2367 |
| Held, I. M., and B. J. Soden, 2000: Water vapor feedback and global warming. Annu. Rev. Energy Environ., 25, 441–475. DOI:10.1146/annurev.energy.25.1.441 |
| Hu, P., S. B. Qiao, and G. L. Feng, 2014: Interdecadal variation of precipitation pattern and preliminary studies during the summer of late-1990s in East Asia. Acta Phys. Sinica, 63, 209204. DOI:10.7498/aps.63.209204 |
| Huang, G., and Z. W. Yan, 1999: The East Asian summer monsoon circulation anomaly index and its interannual variations. Chinese Sci. Bull., 44, 1325–1329. DOI:10.1007/BF02885855 |
| Huang, R. H., Z. Z. Zhang, G. Huang, et al., 1998: Characteristics of the water vapor transport in East Asian monsoon region and its difference from that in South Asian monsoon region in summer. Chinese J. Atmos. Sci., 22, 460–469. DOI:10.3878/j.issn.1006-9895.1998.04.08 |
| Huang, R. H., Y. Liu, and T. Feng, 2013: Interdecadal change of summer precipitation over Eastern China around the late-1990s and associated circulation anomalies, internal dynamical causes. Chinese Sci. Bull., 58, 1339–1349. DOI:10.1007/s11434-012-5545-9 |
| Huang, W., F. H. Chen, S. Feng, et al., 2013: Interannual precipitation variations in the mid-latitude Asia and their association with large-scale atmospheric circulation. Chinese Sci. Bull., 58, 3962–3968. DOI:10.1007/s11434-013-5970-4 |
| Jiang, X. W., Y. Q. Li, and X. Wang, 2009: Water vapor transport over China and its relationship with drought and flood in Yangtze River basin. J. Geogr. Sci., 19, 153–163. DOI:10.1007/s11442-009-0153-6 |
| Kalnay, E., M. Kanamitsu, R. Kistler, et al., 1996: The NCEP/NCAR 40-year reanalysis project. Bull. Amer. Meteor. Soc., 77, 437–472. DOI:10.1175/1520-0477(1996)077<0437:TNYRP>2.0.CO;2 |
| Li, C. Y., and G. L. Li, 2000: The NPO/NAO and interdecadal climate variation in China. Adv. Atmos. Sci., 17, 555–561. DOI:10.1007/s00376-000-0018-5 |
| Li, C. Y., J. H. He, and J. H. Zhu, 2004: A review of decadal/interdecadal climate variation studies in China. Adv. Atmos. Sci., 21, 425–435. DOI:10.1007/BF02915569 |
| Li, X. Z., Z. P. Wen, and W. Zhou, 2011: Long-term change in summer water vapor transport over South China in recent decades. J. Meteor. Soc. Japan, 89, 271–282. DOI:10.2151/jmsj.2011-A17 |
| Li, X. Z., Z. P. Wen, W. Zhou, et al., 2012: Atmospheric water vapor transport associated with two decadal rainfall shifts over East China. J. Meteor. Soc. Japan, 90, 587–602. DOI:10.2151/jmsj.2012-501 |
| Lu, R. Y., 2005: Interannual variation of North China rainfall in rainy season and SSTs in the equatorial eastern Pacific. Chinese Sci. Bull., 50, 2069–2073. DOI:10.1360/04wd0271 |
| Lu, R. Y., B. W. Dong, and H. Ding, 2006: Impact of the Atlantic Multidecadal Oscillation on the Asian summer monsoon. Geophys. Res. Lett., 33, L24701. DOI:10.1029/2006GL027655 |
| Si, D., and Y. H. Ding, 2013: Decadal change in the correlation pattern between the Tibetan Plateau winter snow and the East Asian summer precipitation during 1979–2011. J. Climate, 26, 7622–7634. DOI:10.1175/JCLI-D-12-00587.1 |
| Simmonds, I., D. H. Bi, and P. Hope, 1999: Atmospheric water vapor flux and its association with rainfall over China in summer. J. Climate, 12, 1353–1367. DOI:10.1175/1520-0442(1999)012<1353:AWVFAI>2.0.CO;2 |
| Solomon, S., K. H. Rosenlof, R. W. Portmann, et al., 2010: Contributions of stratospheric water vapor to decadal changes in the rate of global warming. Science, 327, 1219–1223. DOI:10.1126/science.1182488 |
| Sun, B., and H. J. Wang, 2015: Inter-decadal transition of the leading mode of inter-annual variability of summer rainfall in East China and its associated atmospheric water vapor transport. Climte Dyn., 44, 2703–2722. DOI:10.1007/s00382-014-2251-0 |
| Sun, J. Q., and H. J. Wang, 2012: Changes of the connection between the summer North Atlantic oscillation and the East Asian summer rainfall. J. Geophys. Res. Atmos., 117, D08110. DOI:10.1029/2012JD017482 |
| Trenberth, K. E., 1991: Climate diagnostics from global analyses: Conservation of mass in ECMWF analyses. J. Climate, 4, 707–722. DOI:10.1175/1520-0442(1991)004<0707:CDFGAC>2.0.CO;2 |
| Wang, B., 1995: Interdecadal changes in El Niño onset in the last four decades. J. Climate, 8, 267–285. DOI:10.1175/1520-0442(1995)008<0267:ICIENO>2.0.CO;2 |
| Wang, B., R. G. Wu, and X. H. Fu, 2000: Pacific–East Asian teleconnection: How does ENSO affect East Asian climate?. J. Climate, 13, 1517–1536. DOI:10.1175/1520-0442(2000)013<1517:PEATHD>2.0.CO;2 |
| Wang, H. J., 2001: The weakening of the Asian monsoon circulation after the end of 1970’s. Adv. Atmos. Sci., 18, 376–386. DOI:10.1007/BF02919316 |
| Wang, L., W. Chen, W. Zhou, et al., 2010: Effect of the climate shift around mid 1970s on the relationship between wintertime Ural blocking circulation and East Asian climate. Int. J. Climatol., 30, 153–158. DOI:10.1002/joc.1876 |
| Wu, R. G., and L. T. Chen, 1998: Decadal variation of summer rainfall in the Yangtze–Huaihe River valley and its relationship to atmospheric circulation anomalies over East Asia and western North Pacific. Adv. Atmos. Sci., 15, 510–522. DOI:10.1007/s00376-998-0028-2 |
| Wu, R. G., J. L. Kinter III, and B. P. Kirtman, 2005: Discrepancy of interdecadal changes in the Asian region among the NCEP–NCAR reanalysis, objective analyses, and observations. J. Climate, 18, 3048–3067. DOI:10.1175/JCLI3465.1 |
| Xu, H. L., J. Feng, and C. Sun, 2013: Impact of preceding summer North Atlantic oscillation on early autumn precipitation over Central China. Atmos. Ocean. Sci. Lett., 6, 417–422. DOI:10.3878/j.issn.1674-2834.13.0027 |
| Xu, Z. Q., K. Fan, and H. J. Wang, 2015: Decadal variation of summer precipitation over China and associated atmospheric circulation after the late 1990s. J. Climate, 28, 4086–4106. DOI:10.1175/JCLI-D-14-00464.1 |
| Zhou, T. J., and R. C. Yu, 2005: Atmospheric water vapor transport associated with typical anomalous summer rainfall patterns in China. J. Geophys. Res. Atmos., 110, D08104. DOI:10.1029/2004JD005413 |
| Zhou, T. J., R. C. Yu, J. Zhang, et al., 2009: Why the western Pacific subtropical high has extended westward since the late 1970s?. J. Climate, 22, 2199–2215. DOI:10.1175/2008JCLI2527.1 |
| Zhu, J. H., and S. W. Wang, 2001: 80a-oscillation of summer rainfall over the east part of China and East-Asian summer monsoon. Adv. Atmos. Sci., 18, 1043–1051. |
| Zhu, Y. L., H. J. Wang, W. Zhou, et al., 2011: Recent changes in the summer precipitation pattern in East China and the background circulation. Climate Dyn., 36, 1463–1473. DOI:10.1007/s00382-010-0852-9 |
| Zhu, Y. L., H. J. Wang, J. H. Ma, et al., 2015: Contribution of the phase transition of Pacific Decadal Oscillation to the late 1990s’ shift in East China summer rainfall. J. Geophys. Res. Atmos., 120, 8817–8827. DOI:10.1002/2015JD023545 |
| Zuo, Z. Y., and R. H. Zhang, 2007: The spring soil moisture and the summer rainfall in eastern China. Chinese Sci. Bull., 52, 3310–3312. DOI:10.1007/s11434-007-0442-3 |
 2018, Vol. 32


