The Chinese Meteorological Society
Article Information
- XIE, Yi-Bing, Shou-Jun CHEN, I-Liang CHANG, et al., 2018.
- A Preliminarily Statistic and Synoptic Study about the Basic Currents over Southeastern Asia and the Initiation of Typhoons * # &. 2018.
- J. Meteor. Res., 32(4): 661-669
- http://dx.doi.org/10.1007/s13351-018-8888-6
Article History
- Received July 19, 2018
- in final form July 27, 2018
The trade winds and typhoons in the low latitudes are two of the most time-honored topics of meteorology, the studies of which can be traced back to the earliest days in the history of the science of meteorology. The nomenclature and preliminary explanations of the “equatorial westerlies” appeared more than one century ago (Reid, 1849). However, the physical origin, initiation, development, and evolution of the trade winds, equatorial westerlies, and typhoons still remain debatable due to many reasons, and the current understanding of these phenomena lags far behind operational need.
The present study seeks to explore the statistical relationship between the prevailing winds over Southeast Asia (i.e., the equatorial westerlies and the trade winds) and typhoons, in order to point out a few significant facts and lay the foundation for future studies.
1 Statistical relationship between the prevailing winds in Southeast Asia and typhoon genesisThe trade winds have been generally considered as the prevailing winds in the low latitudes. Despite the long history of research on the equatorial westerlies, the key characteristics of the equatorial westerlies need to be subjected to more scrutiny. The interpretation of the equatorial westerlies [i.e., equatorial reverse flowa (footnote on next page)] as averaged air motion south of a group of vortices has been widely adopted since it was proposed a decade ago (Dunn, 1951). Recent observations have revealed that westerlies in the low latitudes occupy around 40% of the parallels near the equator in the summer hemisphere (Mintz and Dean, 1951; Koteswaram, 1958), and are, to certain extent, quasi-steady, which is the character of prevailing winds. Tao and Chen (1957) pointed out that the westerlies can be regarded as the prevailing winds. Note that Tao and Chen (1957) referred to the equatorial westerlies as the southwesterly monsoon, although the large-scale winds actually flow from the west to the east, instead of from the southwest to the northeast. There is a clear trend to regard the equatorial westerlies as the prevailing winds.
The enduring idea holds that typhoon genesis is favored on the interface between the equatorial westerlies and the trade winds in the equatorial convergence zoneb. However, due to the lack of a thorough knowledge of the equatorial westerlies, the classical model of typhoon genesis only considers the circulation closely surrounding the typhoons (Riehl, 1954), while the relation between typhoons and the large-scale circulation is not well understood. Previous studies have sought to establish the relationship between typhoon genesis and the large-scale circulation over the Pacific Ocean based on sparse or outdated data (Dunn, 1951; Ramage, 1959), while less attention is given to the influence of the equatorial westerlies from the Indian Ocean on typhoon gene-sis, which requires further studies.
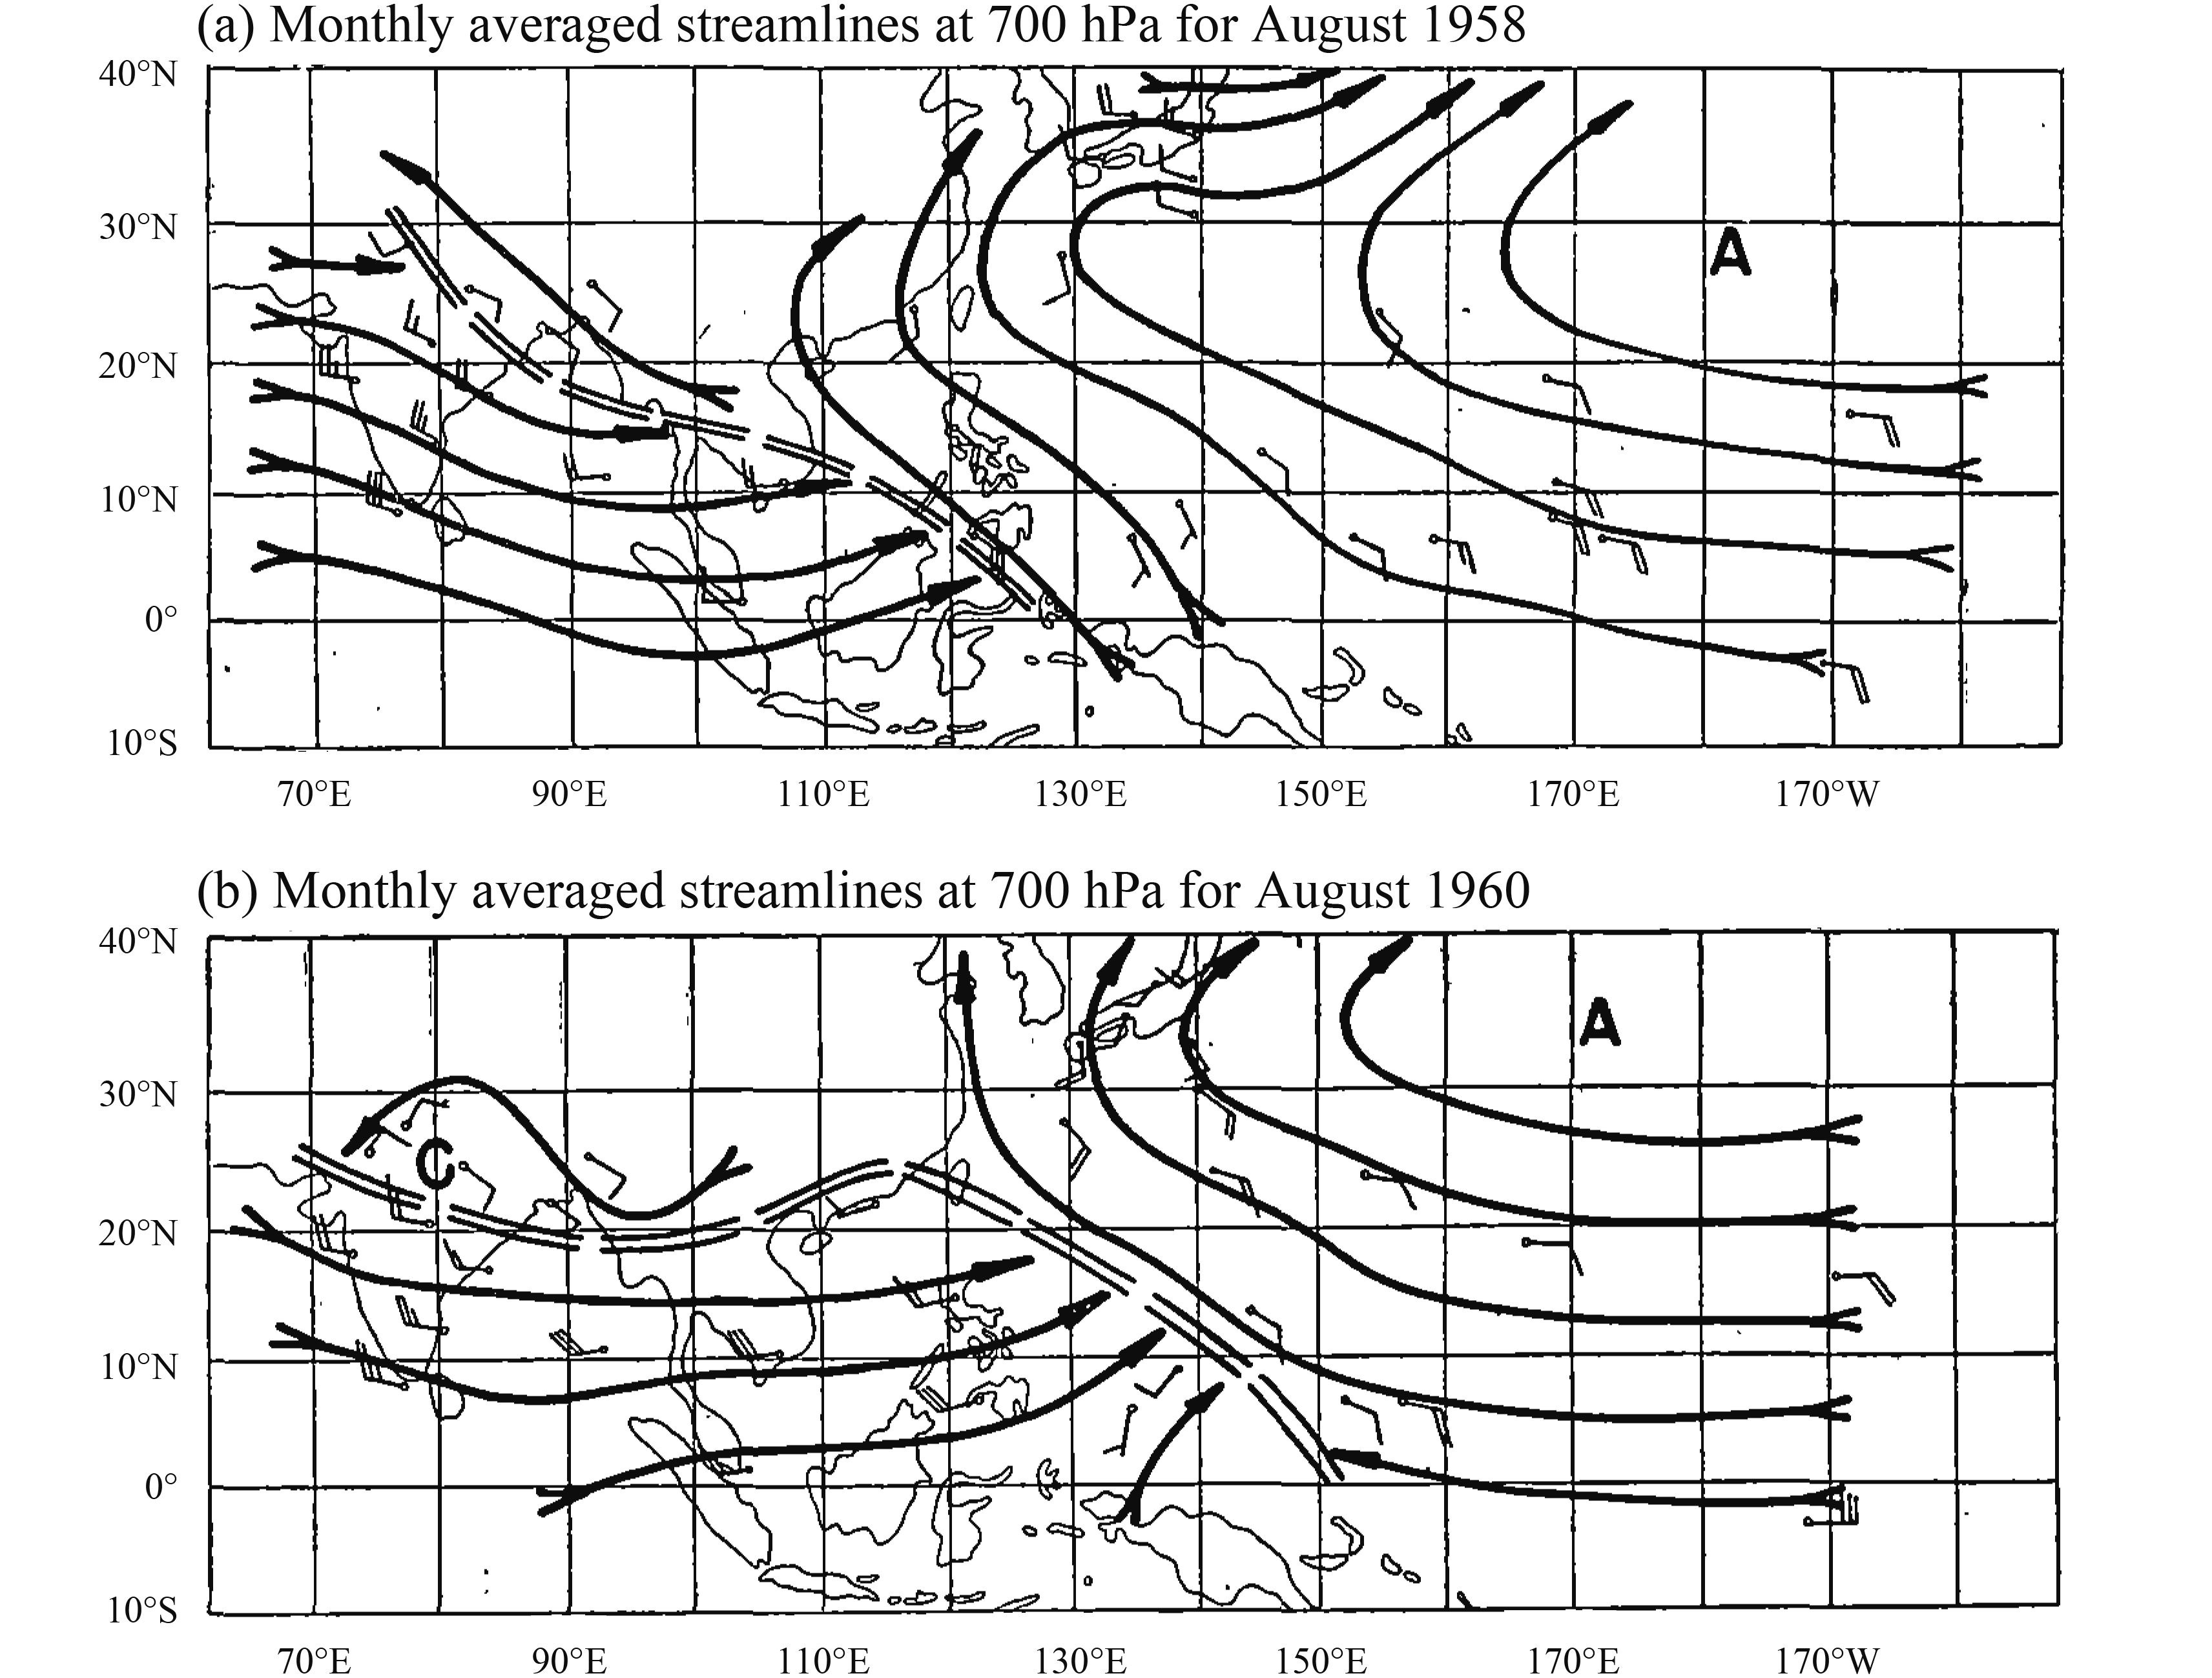
Figures 1a and 1b show the averaged flow patterns at 700 hPa over Asia and the western Pacific Ocean in August 1958 and August 1960, respectively. Excluding typhoons over the South China Sea, there were 4 typhoons in August 1958, while there were 9 in August 1960c. Thus, these two months are chosen to represent the general patterns of the summer circulation over the low-latitude ocean near Southeast Asia with fewer (Fig. 1a) and more (Fig. 1b) typhoons compared to the climatology. Comparing Figs. 1a, b finds that there are two major differences as follows:
1) The western Pacific subtropical anticyclone is located further to the south in August 1958 (i.e., the month with fewer typhoons), and the subtropical ridge centers around 27°N. In contrast, the western Pacific subtropical anticyclone is located further to the north in August 1960 (i.e., the month with more typhoons), and the subtropical ridge centers around 33°N, 6 degree north from that in August 1958.
2) In August 1958 (i.e., the month with fewer typhoons), the equatorial westerlies extend eastwards to the South China Sea west of the Philippines, while the equatorial westerlies extend eastwards beyond the Philippines to around 140°E in August 1960 (i.e., the month with more typhoons), 25° to the east compared to the former.
Note that there is hardly any difference in the strength of the cross-equatorial flow between Figs. 1a and 1b. In addition, according to the synoptic weather map, the number of days with low pressure systems over the South China Sea is 20 in August 1958, while the number is 23 in August 1960, which is not significantly different from the former.
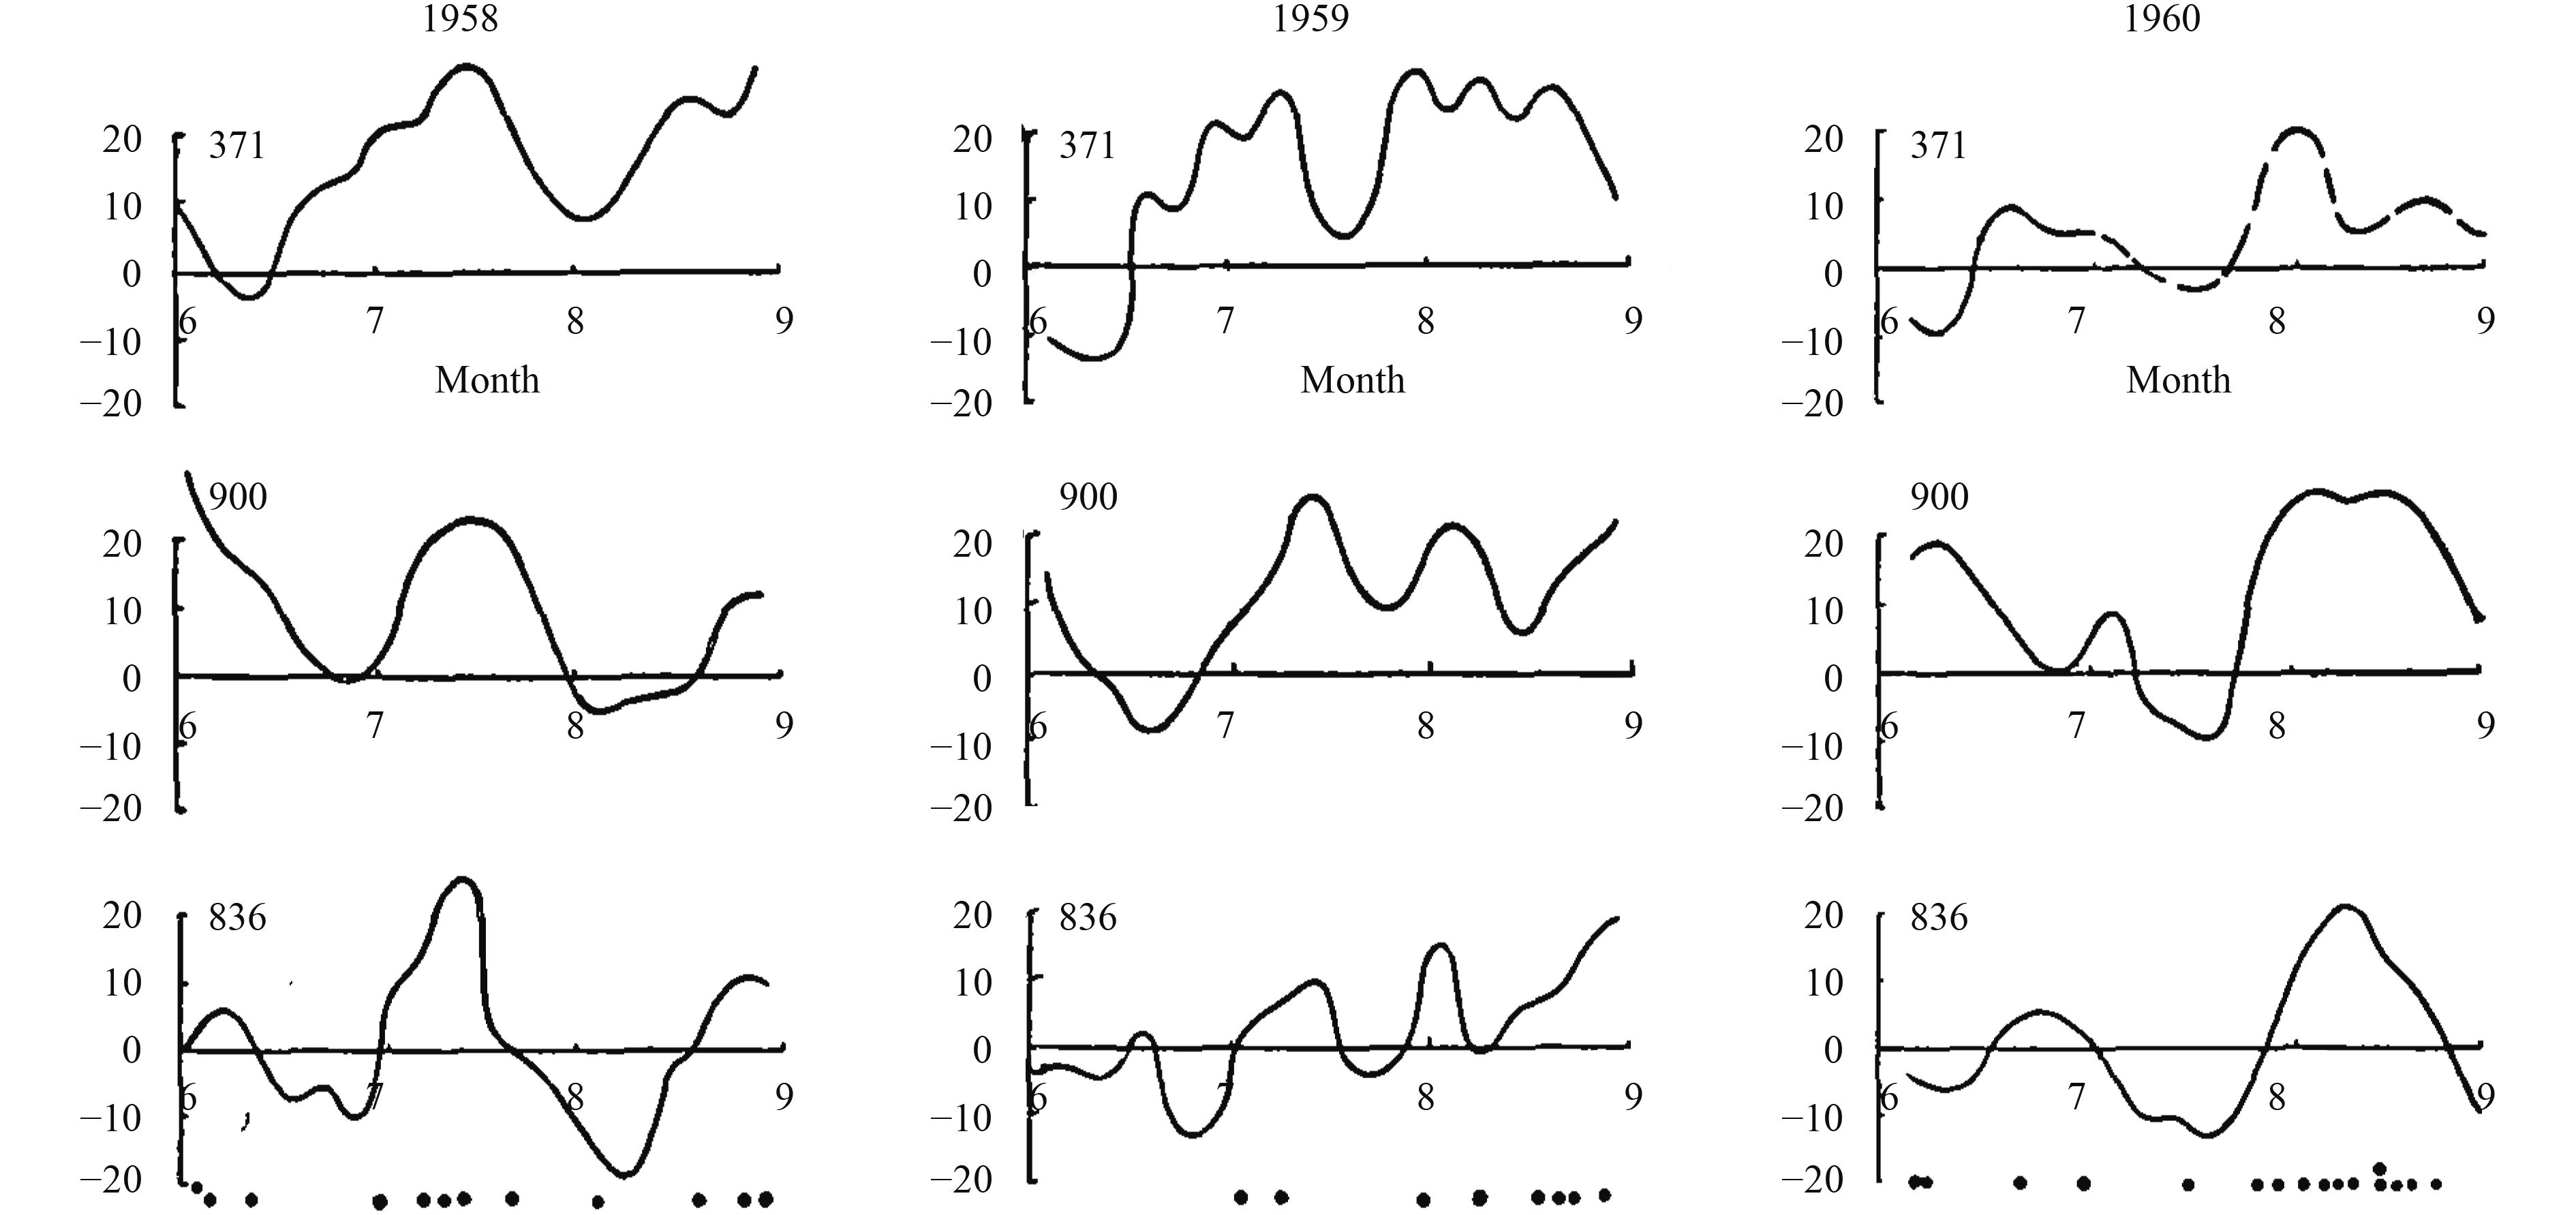
It is plausible that the meridional shift of the western Pacific anticyclone and the zonal displacement of the equatorial westerlies and trade winds are closely related to typhoon genesis. To further examine the hypothesized relationship, weather station No. 371 (southern end of the Indian subcontinent), weather station No. 900 (Ho Chi Minh City, Vietnam), and weather station No. 836 (southern end of the Philippines) are chosend, and the pentad averaged zonal winds at 700 hPa in June, July, and August (JJA) from 1958 to 1960 are plotted based on the observations from the three stations (Fig. 2). Figure 2 shows the following:
1) The changes in the strength of the equatorial westerlies exhibit consistency from India to the western Pacific Ocean. When the westerlies over South India enhance, the strength of the westerlies over Southeast Asia increases, with some lag in time.
2) Through the 9 summer months from 1958 to 1960, in total there are 36 typhoons, 28 of which originate on the interface between the equatorial westerlies and the trade winds, after the equatorial westerlies strengthen and march eastward. In contrast, only 1/5 of the typhoons, i.e., 8 altogether (2 in August 1958, 1 each in July and August 1959, and 2 in June and July 1960, respectively), originate while the equatorial westerlies weaken, with easterlies or weak westerlies observed at weather station Nos. 836 and 900.
3) The strength of the zonal winds at the three stations varies, to certain extent, periodically in time, and the period of the quasi-oscillation is rather long, around one month and a half, which may contribute to medium-range forecast of typhoon occurrence.
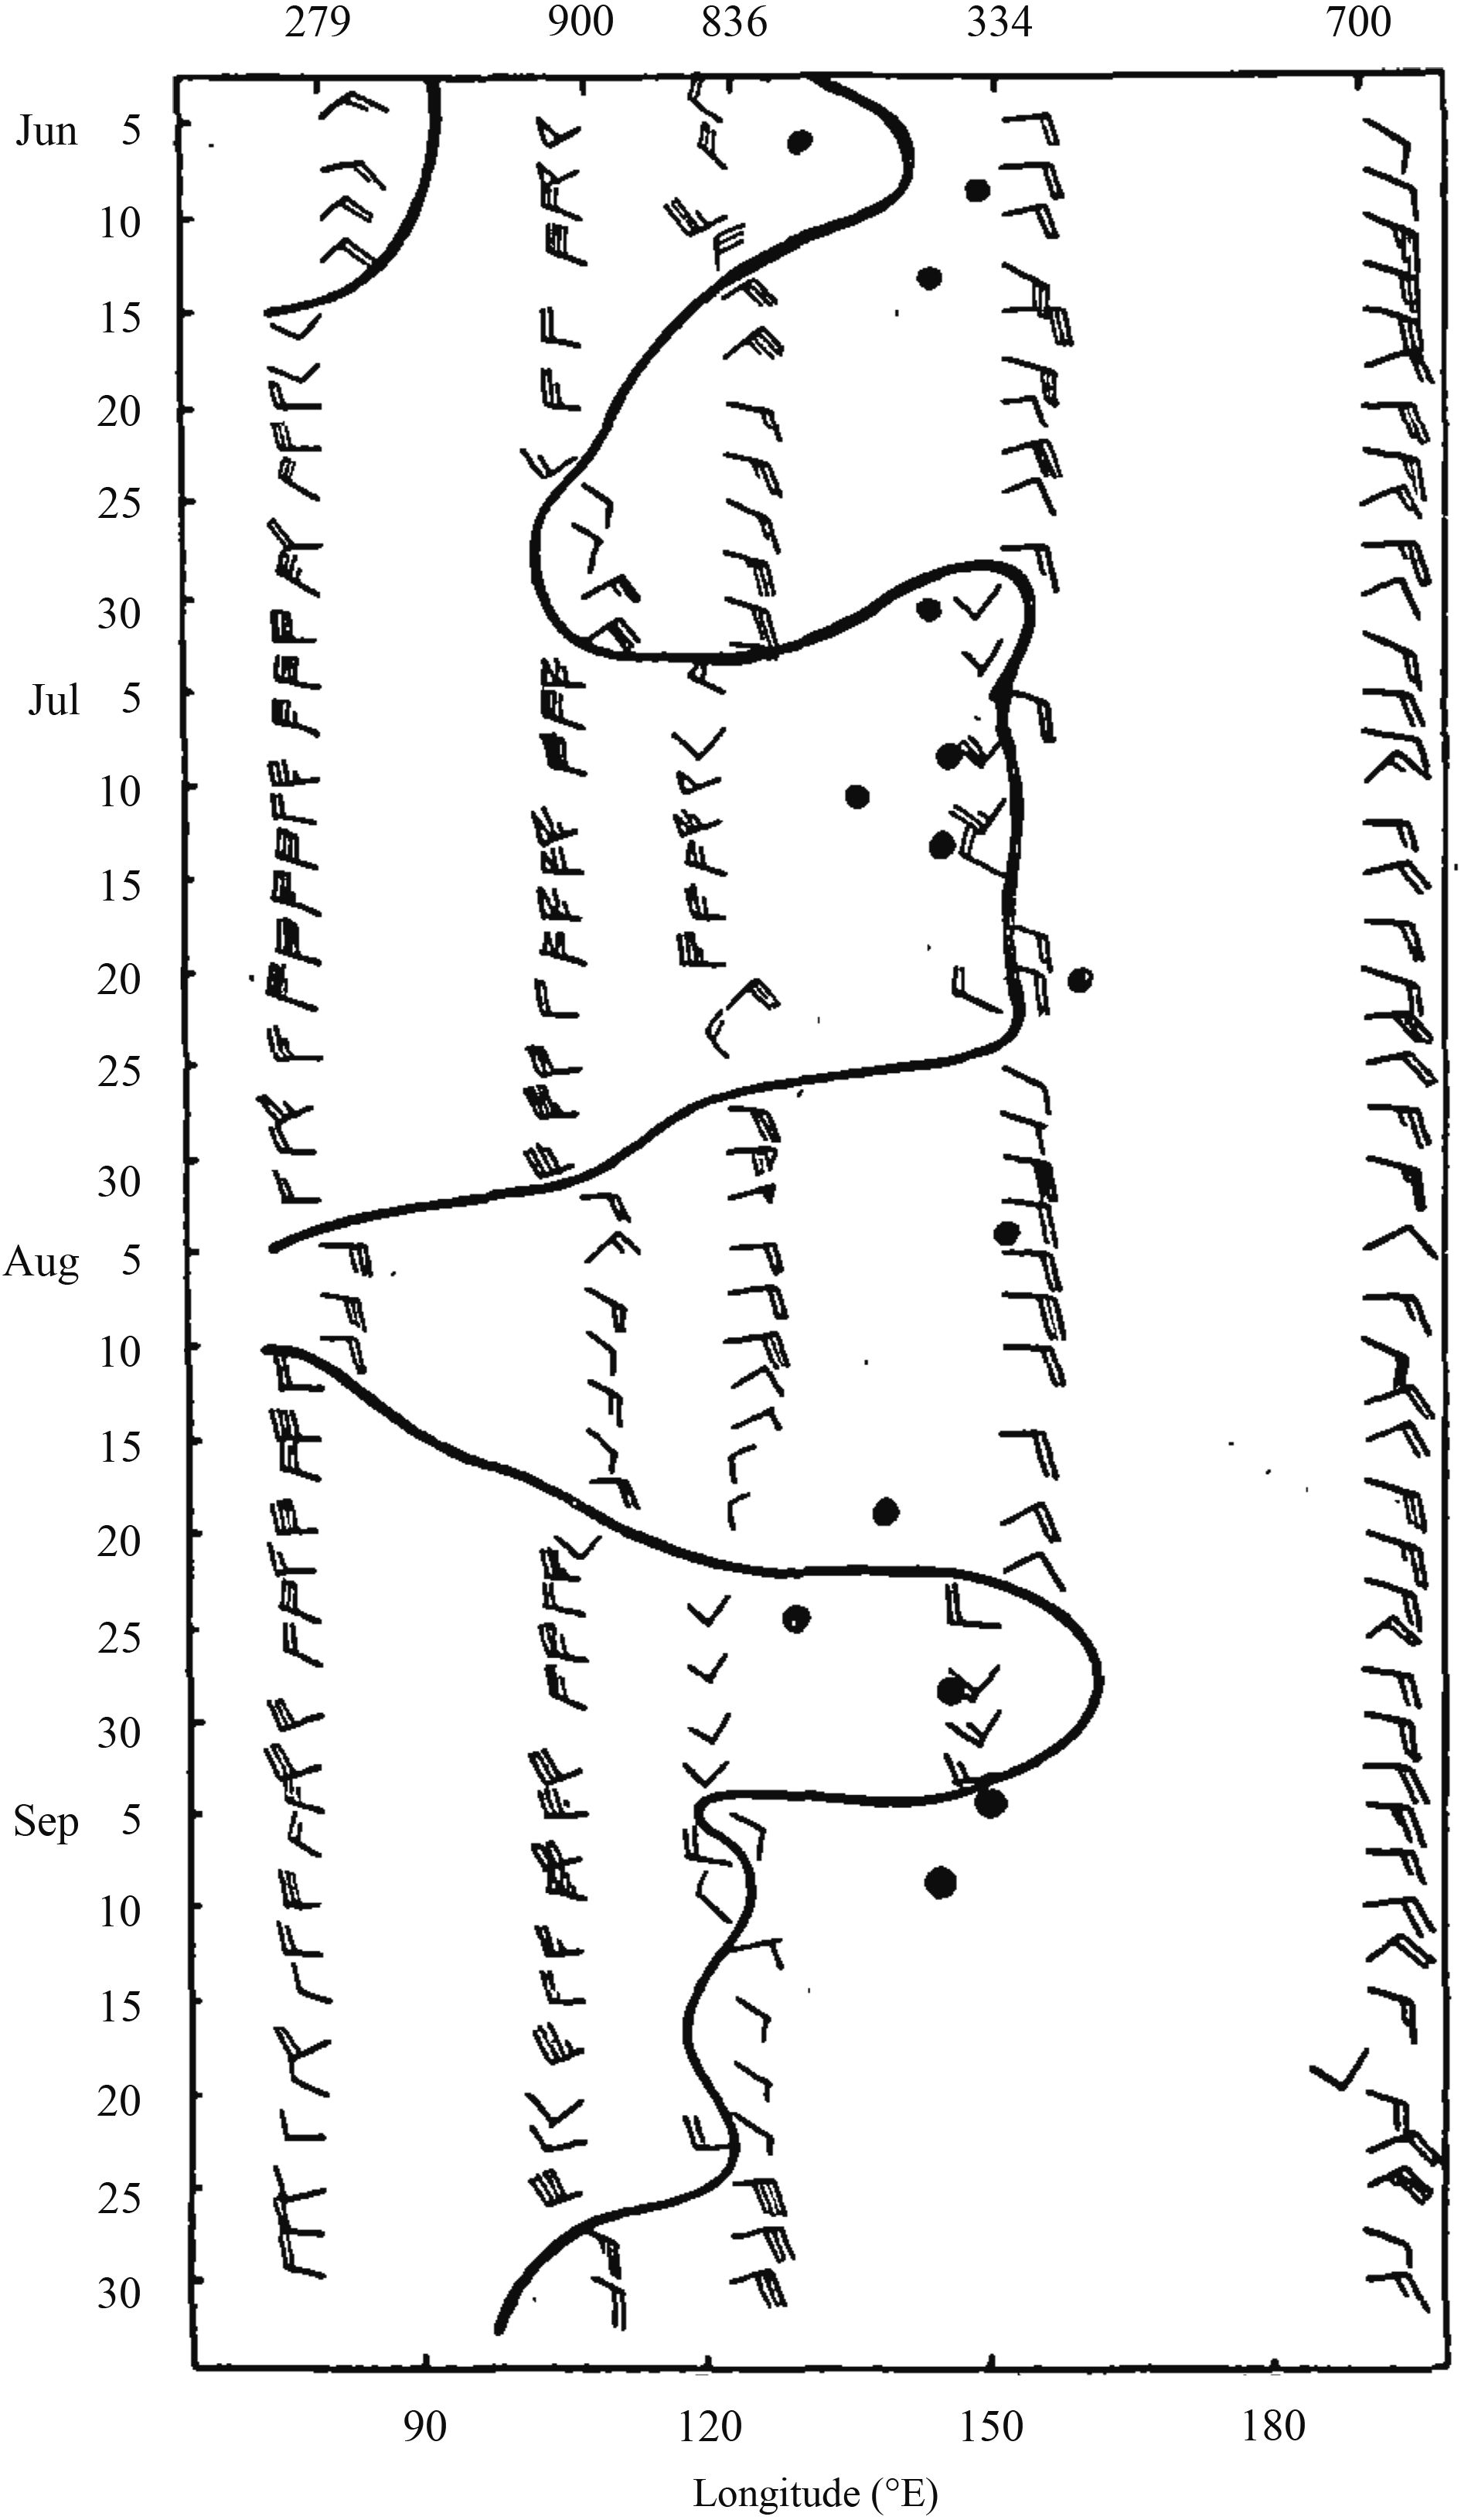
Figure 3 illustrates the observed 700-hPa zonal winds in June, July, August, and September 1958 across India and the central Pacific in the tropics. The confluence line between the westerlies and easterlies is marked as solid lines, with the dates and longitudes of typhoon genesis denoted by black dots. The following can be seen from Fig. 3:
1) Most of the typhoons (10 out of 14) originate close to the interface between the westerlies and easterlies. Note that the dates and longitudes of typhoon genesis are taken from Geophysical Review published by the Japan Weather Association (1958–60), and the interface between the westerlies and easterlies is interpolated from the strength of station observed zonal winds. In spite of interpolation errors, the conclusion is well-grounded that typhoon genesis is favored on the interface between the westerlies and easterlies.
2) Most typhoons form after the equatorial westerlies extend eastwards beyond weather station No. 836 at the southern end of the Philippines.
3) The oscillation period of zonal displacement of the interface between the westerlies and easterlies are consistent with that from Fig. 2.
2 Case studies of typhoon genesisTo gain an insight into the relationship between typhoon genesis and the equatorial westerlies as well as the trade winds, extensive case studies of typhoons through 1958 to 1960 are conducted, besides the statisti-cal investigation in the previous section. Four classic examples are chosen as follows.
Example 1: Typhoon genesis with the prevailing winds located anomalously further to the south. Figure 4a shows that the western Pacific anticyclone in the Northern Hemisphere lies further to the south, with its southwestern end extending into the South China Sea, compared to the climatology. The trade winds and equatorial westerlies center further south as well, with the equato-rial westerlies south of 10°N over the western Pacific Ocean. The westerly trough in the midlatitudes rests north of 30°N. The meridional winds in the Southern Hemispheric low latitudes are weak. Between the Philippines and West Papua of Indonesia, there are indeed cross-equatorial southwesterlies, which, however, are supposed to be attributed to the oscillation of equatorial westerlies, rather than the cross-equatorial flow from the Southern Hemispheric midlatitudes. In addition, there is a clear pattern of double equatorial convergence zone in the western Pacific.
In Fig. 4b, the Southern Hemispheric midlatitudes westerly trough shifts eastward, leaving a strong anticyclone over Australia. North of Australia, there are clear southeasterly trade winds, but based on the sparse observations, it is unclear whether they cross the equator. North of the equator, the circulation remains similar to that in Fig. 4a, while the amplitude of the oscillation of the equatorial westerlies is smaller compared to the previous day. The typhoon moves northwestwards following the steering flow.
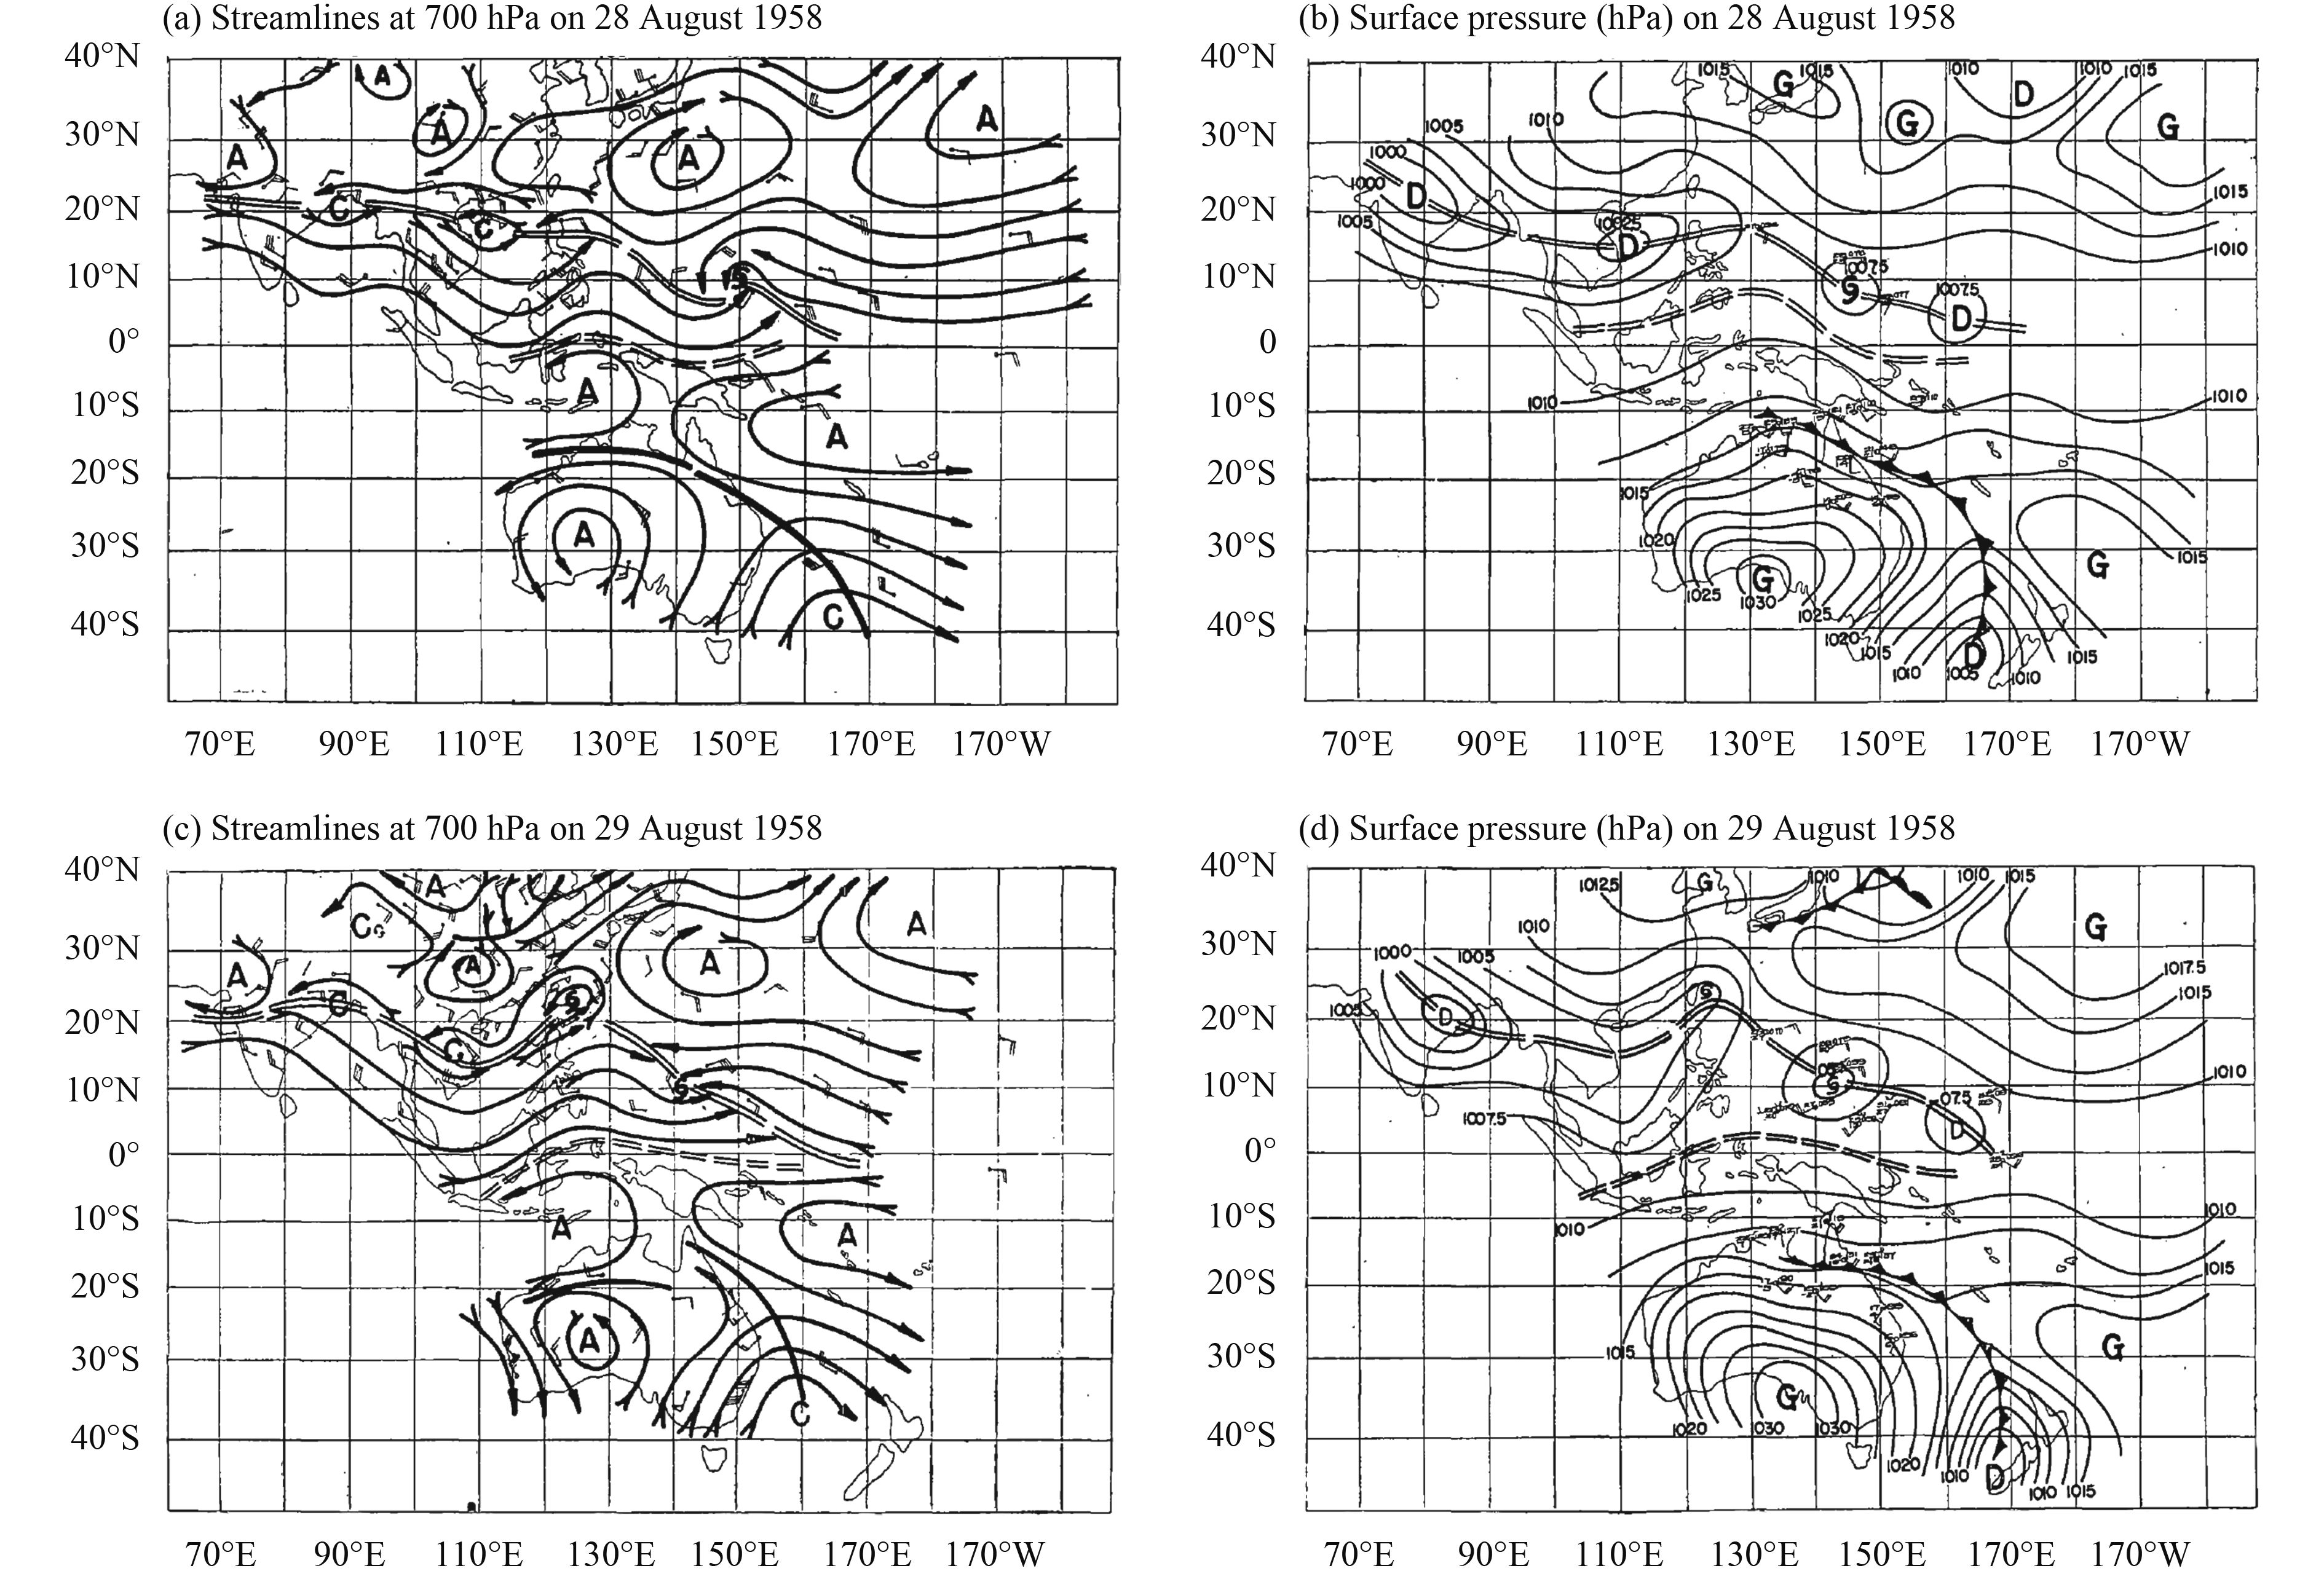
Example 2: Typhoon geneses in group with the Southern Hemispheric cold spells not crossing the equa-tor. Figures 5a–d show the streamlines at 700 hPa and surface pressure on 28 and 29 August 1958. There is a strong cold spell over Australia in the Southern Hemisphere, but the polar front stays 10 degree away from the equator, and never extends beyond the northern end of Australia. The equatorial westerlies are located in the Northern Hemisphere, further to the north compared the previous example. There are a group of typhoons between the equatorial westerlies and Northern Hemispheric trade winds. The typhoon centering at 10°N, 145°E just forms. The equatorial westerlies extend eastward to 7°N, 160°E, with increasing wind shear at 700 hPa and low pressure at the surface, indicating the genesis of another typhoon.
According to the surface pressure, the equatorial westerlies cover a narrow range of latitudes, which might be the reason why the equatorial westerlies have been interpreted as westerly air motion south of the typhoons and low pressure systems and called “equatorial reverse flow.” In contrast, the 700-hPa streamlines clearly show that the equatorial westerlies are characterized by much larger spatial scale compared to the typhoons. In consequence, it is reasonable to regard the equatorial westerlies as prevailing winds, and the typhoons as a group of vortices on the interface between the equatorial westerlies and easterly trade winds.
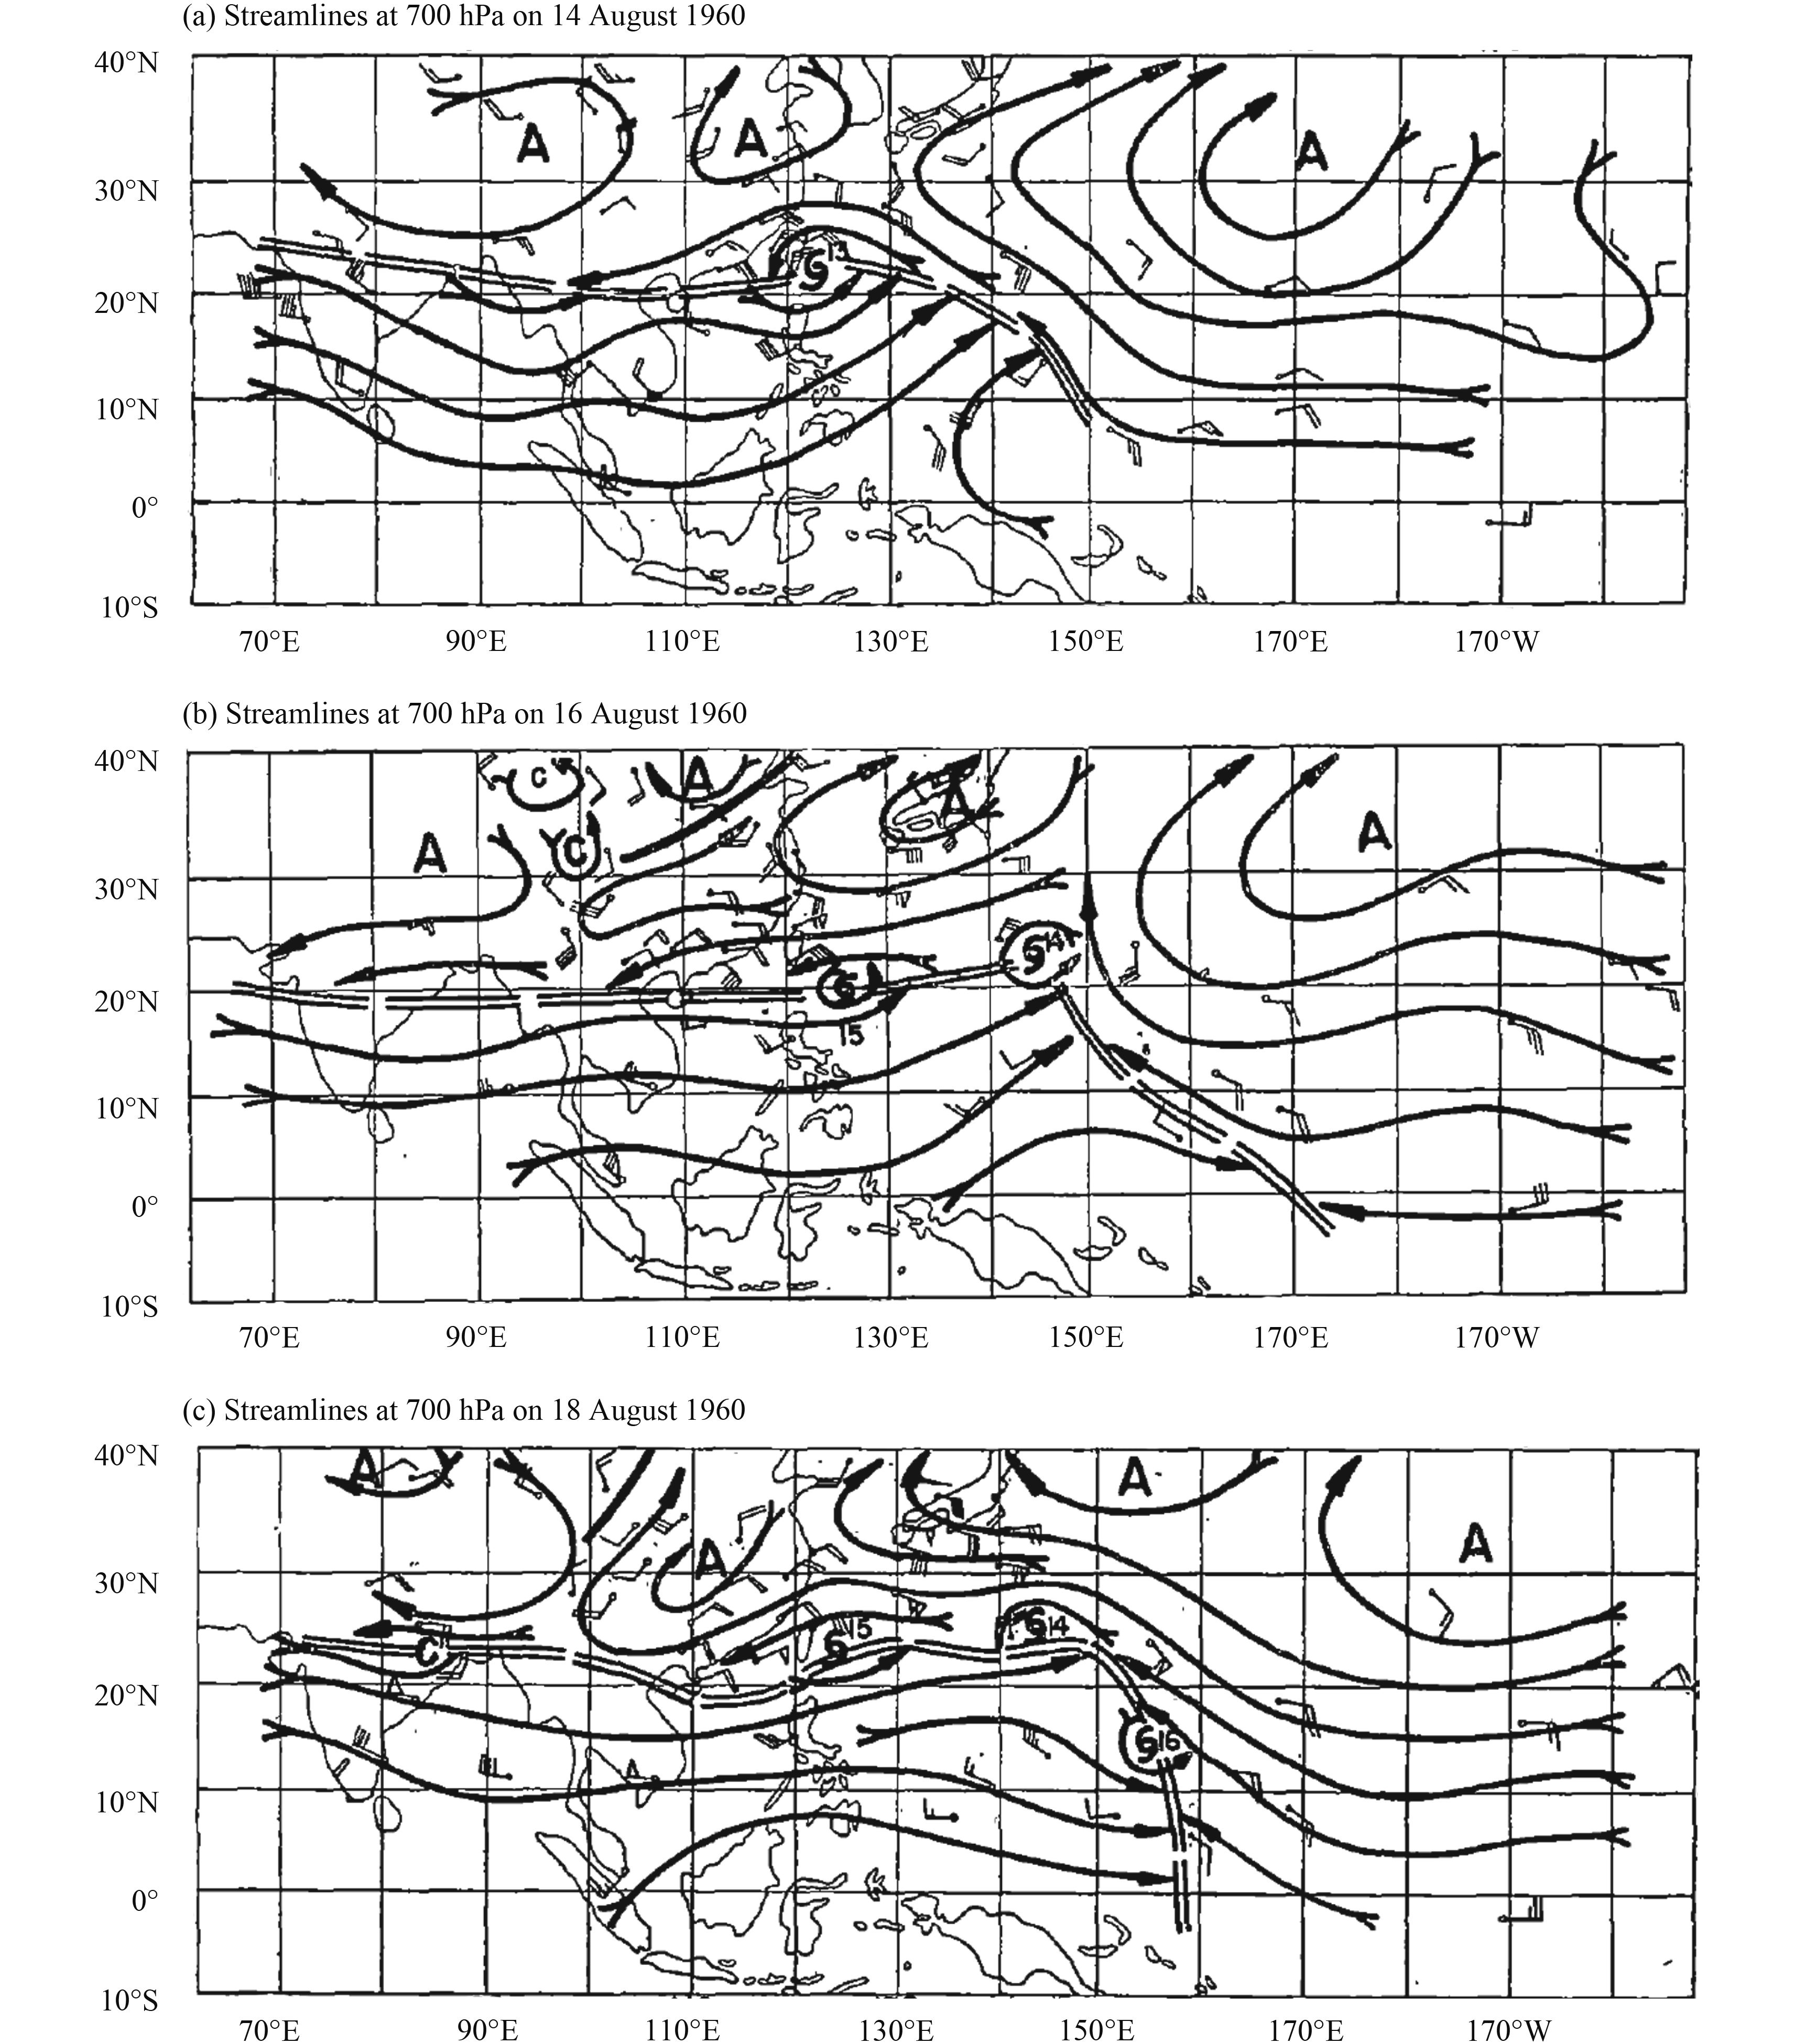
Example 3: Typhoon geneses with strong equatorial westerlies in the Northern Hemisphere. Figures 6a–c show the streamlines at 700 hPa on 14, 16, and 18 August 1960, when the western Pacific anticyclone is located further to the north compared to the climatology. Between the equator and 20°N, there are strong and steady equatorial westerlies, extending from India to 150°E. There is only one typhoon (Typhoon No. 13) on 14 August, which dissipates over the Chinese mainland after landing. On 16 August, two typhoons (Typhoon No. 14 and Typhoon No. 15) form north of the equatorial westerlies at 22°N, 145°E and 21°N, 127°E, respectively, and in addition, on 18 August, another typhoon (Ty-phoon No. 16) forms at the east end of the equatorial westerlies at 15°N, 155°E.
The difference in the spatial scales between the equatorial westerlies and typhoons is more pronounced in Fig. 6 than that in Fig. 5. Besides, the three typhoons form with steady equatorial westerlies, which denies the interpretation that the eastward expansion of low-latitude westerlies results from the typhoon geneses.
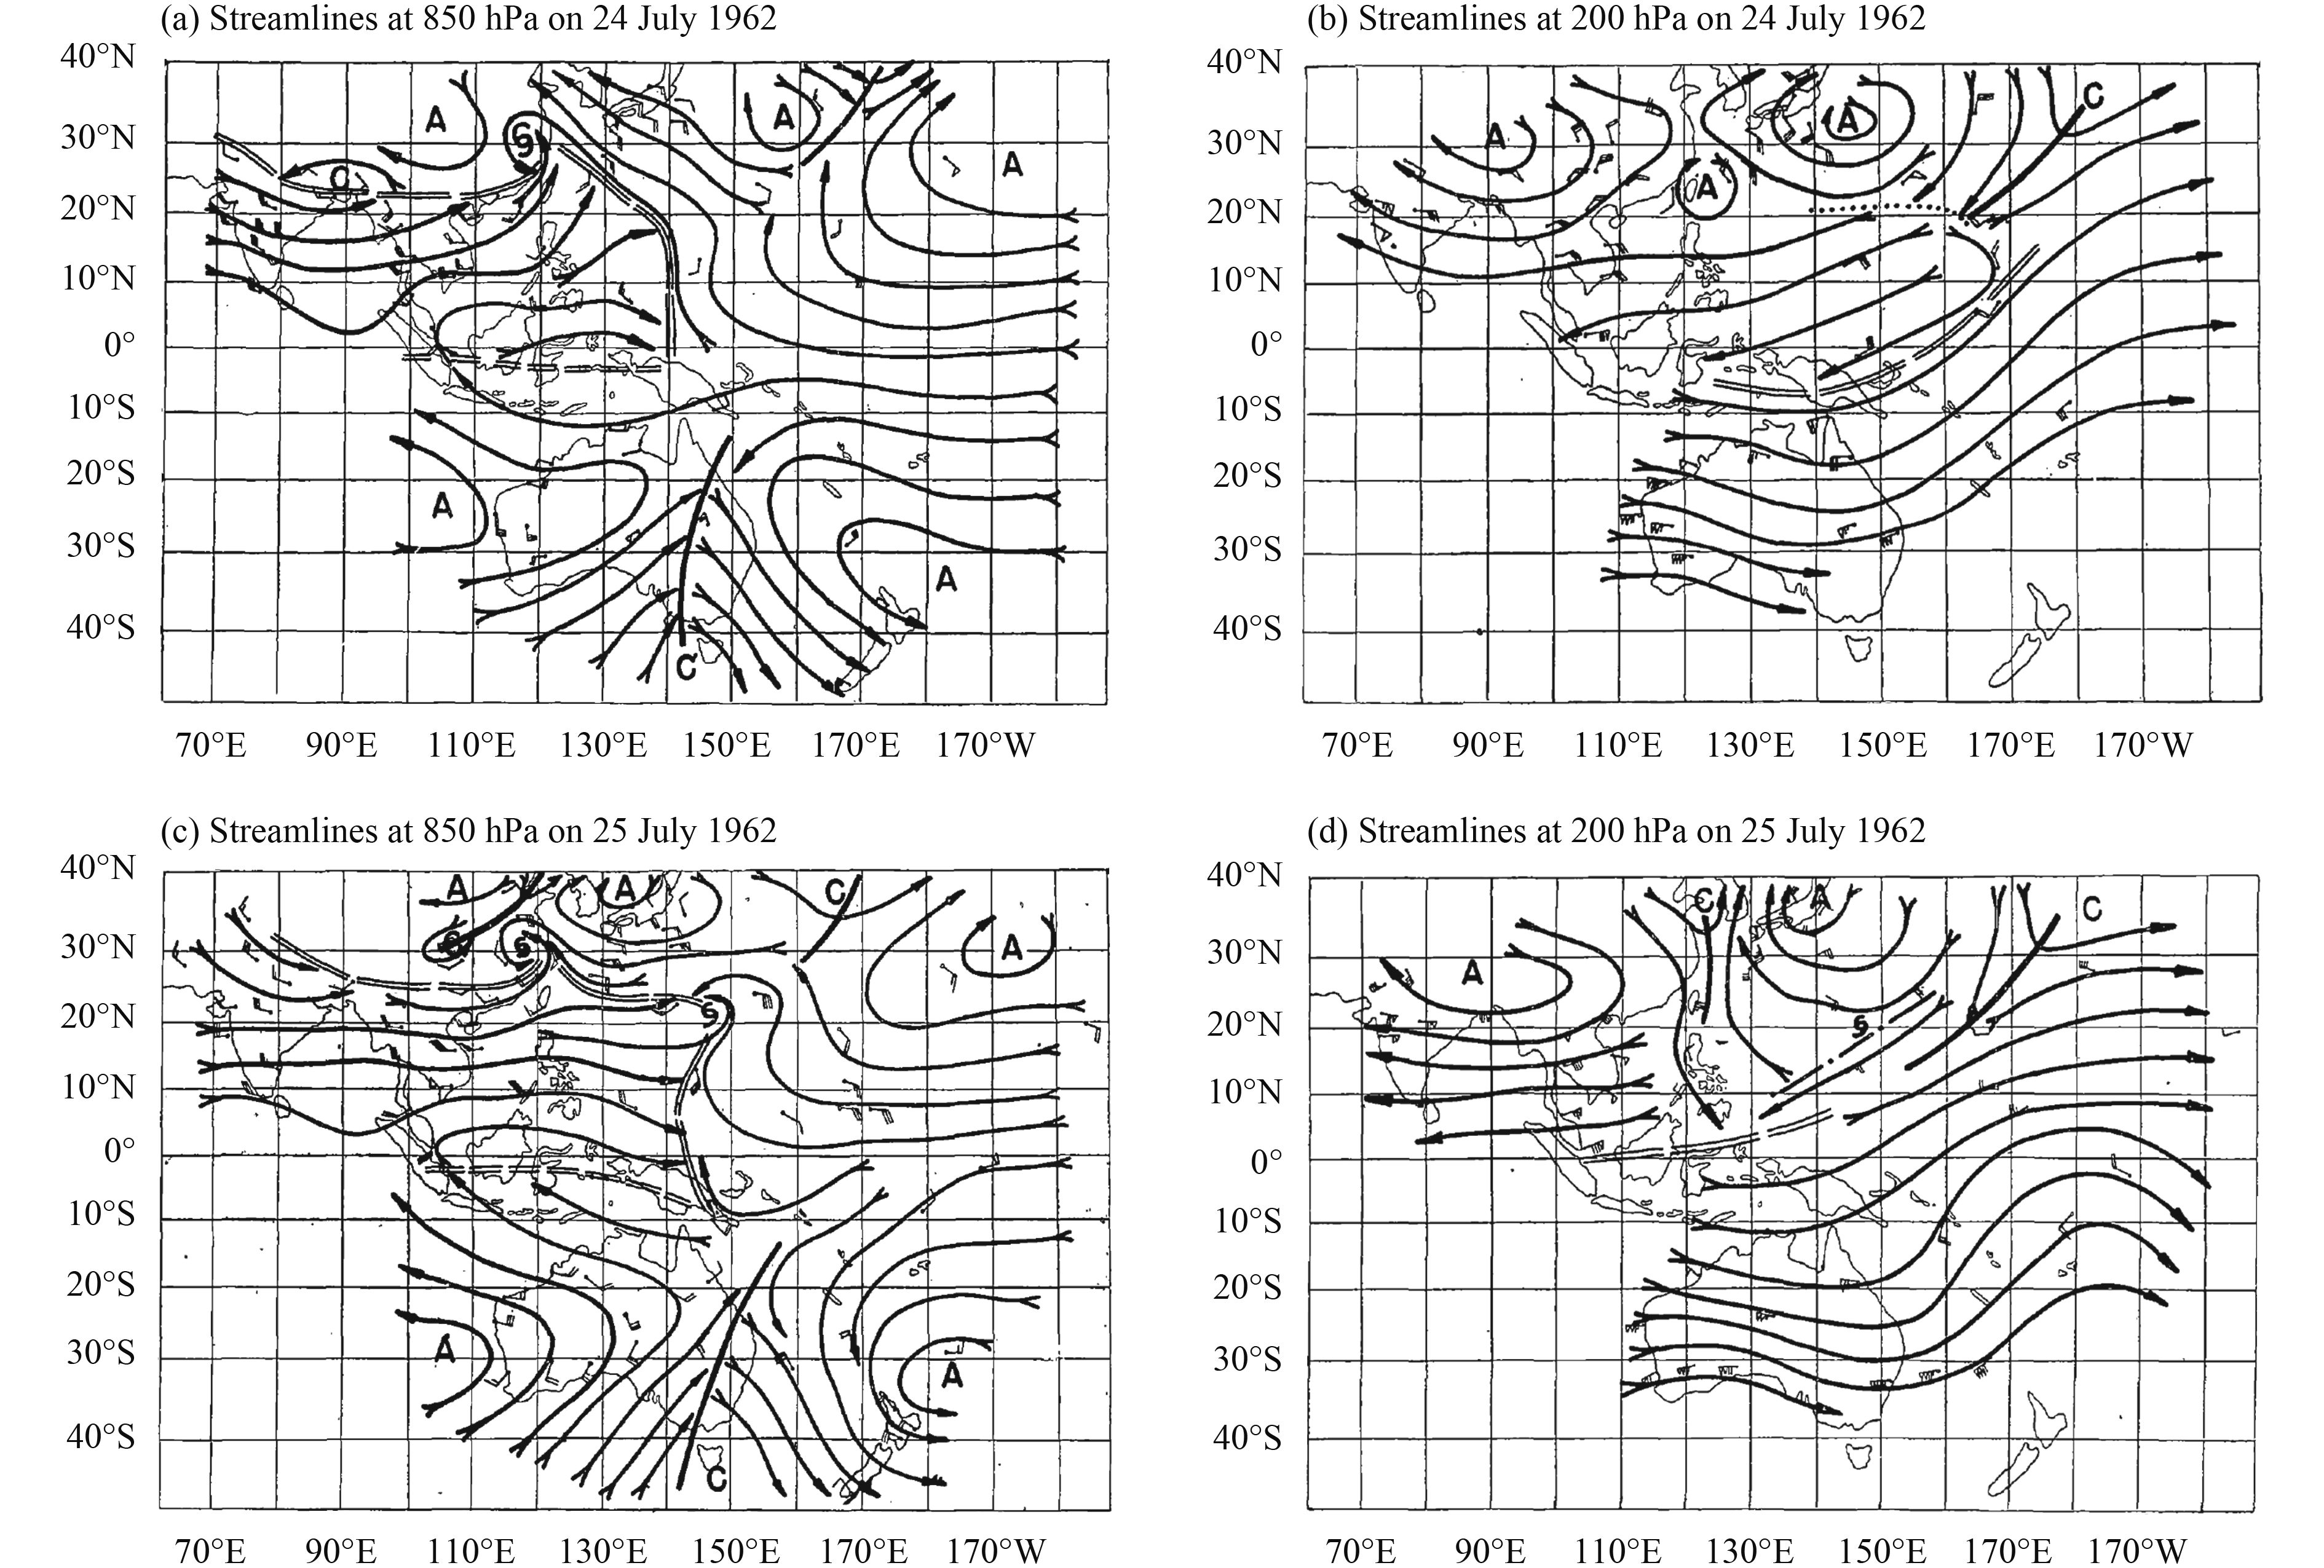
Example 4: 200-hPa streamlines with typhoon genesis. Figure 7 shows the typhoon formation at 22°N, 147°E in July 1962. On 24 July (Figs. 7a, b), the circulation remains largely unchanged compared to the previous day (figure omitted), with equatorial westerlies at 850 hPa extending from the Indian Ocean to 140°E zonally, and beyond 20°N meridionally. The circulations at 700 and 500 hPa (figures omitted) are generally consistent with that at 850 hPa. At 200 hPa (Fig. 7b), the southeastern end of the anticyclone reaches the western Pacific and Southeast Asia, with northeasterly wind in the upper troposphere. The winds slightly reverse between 140°E and 160°E at 20°N, generating weak convergence. The region between Australia and the central Pacific Ocean is dominated by southwesterly winds, which might be part of the westerly circulation in austral winter and note that this particular upper level westerly in the Northern Hemisphere is also known as southwesterly anti-trades. A typhoon formed at 22°N, 147°E north of the equato-rial westerlies can be seen from the 850-hPa circulation on 25 July, when the aforementioned 200-hPa upper level weak convergence clearly becomes divergent (Fig. 7d).
This example contradicts the hypothesis proposed by Riehl (1948) that typhoon genesis results from the low level convergence after 200-hPa divergence, while it is consistent with Syono’s argument that the development of typhoon leads to the upper level divergence Syono (1953).
3 Conclusions and discussionBased on the statistical analysis and case studies in the previous sections, the following preliminary arguments are made.
(1) In the boreal summer, the lower troposphere across the Indian Ocean and western Pacific Ocean in the Northern Hemisphere is dominated by quasi-steady westerlies in the low latitudes, and the strength and spatial distribution of the westerlies are characterized by oscillations with a period of longer than one month. These low-latitude westerly winds can be regarded as the prevailing winds, a proper name of which could be equatorial westerlies.
(2) The variations of the strength and spatial distribution of the equatorial westerlies are closely related to those of the western Pacific anticyclone, and of another type of prevailing winds in the low latitudes, the easterly trade winds. When the western Pacific anticyclone and the trade winds are located anomalously further to the south, the equatorial westerlies are weaker, located further to the south, and extend less to the east, and vice versa.
(3) Most of the typhoons over the western Pacific can be interpreted as vortices on the interface between the equatorial westerlies and the trade winds. When the equatorial westerlies are stronger, located further to the north, and extend more to the east, typhoon genesis is more frequent, and vice versa. The relationship between the strength and spatial distribution of the equatorial westerlies and typhoon genesis, along with the over-a-month periodicity of the westerlies, will contribute to medium-range forecast of typhoon genesis.
(4) Ramage (1959) showed that 2/3 of the typhoons in the Northern Hemisphere form between 130°E and 150°E, which was attributed to the quasi-stationary trough over the central Pacific at 200 hPa. The present results provide a novel interpretation that typhoon gene-sis is favored by the equatorial convergence zone (130°–150°E) between the trade winds and the equatorial westerlies, because the equatorial westerlies over Southeast Asia are stronger and more steady than those in other regions in the low latitudes of the Northern Hemisphere.
(5) The upper level divergence at 200 hPa during some typhoon formations results from the ascending air motions with the development of cyclonic circulations, which contradicts a previous theory that the upper level divergence leads to the lower level convergence and development of cyclonic circulations.
(6) The present study seeks to explore the relationship between typhoon genesis and the equatorial westerlies as well as the trade winds, and the results indicate a close connection between typhoon formations and variations in the prevailing winds. However, one has to be cautious to apply the relationship established for the western Pacific in boreal summer to other seasons or regions, as this is not the only cause nor mechanism of typhoon genesis. Similar to midlatitude cyclones, typhoons in the low latitudes might be of various types, and correspond to different mechanisms. For example, instability associated with easterly waves is supposed to be responsible for another type of typhoons. Many questions remain unsolved concerning the interaction between the prevailing winds and disturbances (including typhoons), and further investigations will be conducted combining statistical examination, case studies, and theoretical analysis, in order to better understand the evolution of the circulations and weather in the low latitudes.
Acknowledgments*. The authors acknowledge data pro-vided by the Institute of Geophysics (Chinese Academy of Sciences), Information Center of China Meteorologi-cal Administration, and Shanghai Meteorological Observatory. We are grateful for the insightful comments by Shiyang Tao. We thank Wenjun Xiao, Huirong Ye, and Zhenhua Chen for their help with the data and plots.
|
| Figure 1 Monthly averaged streamlines at 700 hPa for August (a) 1958 and (b) 1960. Letters A and C denote the centers of anticyclonic flow and cyclonic flow, respectively. The double dashed curves denote the convergence zone between the westerlies and easterlies. |
|
| Figure 2 Pentad averaged zonal winds (m s–1) at 700 hPa in June, July, and August 1958 (left column), 1959 (middle column), and 1960 (right column). The top, middle, and bottom rows correspond to weather stations No. 371 (southern end of the Indian subcontinent), No. 900 (Ho Chi Minh City, Vietnam), and No. 836 (southern end of the Philippines), respectively. The x-axis denotes time, and the black dots in the bottom of the plot indicate the dates with typhoons. The discontinuity of the curve in the upper right panel is associated with missing data. |
|
| Figure 3 700-hPa zonal winds between the southern end of India and the equatorial Pacific Ocean in June, July, August, and September 1958. The black contour denotes the interface between westerlies and easterlies, and the black dots indicate typhoons. |

|
| Figure 4 Streamlines at 700 hPa on (a) 20 and (b) 21 August 1958. Letters A and C denote the centers of anticyclonic flow and cyclonic flow, respectively. The double dashed curves denote the convergence zone between the westerlies and easterlies. |
|
| Figure 5 (a, c) Streamlines at 700 hPa and (b, d) surface pressure on (a, b) 28 and (c, d) 29 August 1958. Letters A and C denote the centers of anticyclonic flow and cyclonic flow, respectively. Letters G and D denote the centers of high pressure and low pressure, respectively. The double dashed curves denote the convergence zone between the westerlies and easterlies. |
|
| Figure 6 Streamlines at 700 hPa on (a) 14, (b) 16, and (c) 18 August 1960. Letters A and C denote the centers of anticyclonic flow and cyclonic flow, respectively. The double dashed curves denote the convergence zone between the westerlies and easterlies. |
|
| Figure 7 Streamlines at (a, c) 850 and (b, d) 200 hPa on (a, b) 24 and (c, d) 25 July 1962. Letters A and C denote the centers of anticyclonic flow and cyclonic flow, respectively. The double dashed curves denote the convergence zone between the westerlies and easterlies. |
 2018, Vol. 32
