The Chinese Meteorological Society
Article Information
- GUAN, Qin, Xiuping YAO, Qingping LI, et al., 2018.
- Study of a Horizontal Shear Line over the Qinghai–Tibetan Plateau and the Impact of Diabatic Heating on Its Evolution. 2018.
- J. Meteor. Res., 32(4): 612-626
- http://dx.doi.org/10.1007/s13351-018-7186-7
Article History
- Received December 25, 2017
- in final form May 7, 2018
2. China Meteorological Administration Training Centre, Beijing 100081;
3. Huangnanzhou Meteorological Office of Qinghai Province, Tongren 811300;
4. Lianyungang Meteorological Observatory of Jiangsu Province, Lianyungang 222006
The horizontal plateau shear line (hereinafter referred to as the plateau shear line, TSL) is a unique weather system within the boundary layer of the Qinghai–Tibetan Plateau (QTP) and is one of the main precipitation systems in the plateau areas. The TSL usually refers to a convergence line opposite the direction of the wind, which is recorded at more than 3 stations at 500 hPa. The length of the TSL is greater than 5 latitudes, its thickness is less than 2 km, and the 24-h variation in its temperature and pressure is small, compared to that at the ground (QTP Meteorological Research Collaborative Group, 1981). Over the QTP, heavy snowfall in winter and rainstorms in summer are primarily related to the TSL (Ma et al., 2003; Zhang et al., 2016), such as the heavy snowfall in the eastern pasture area of the QTP in 16–18 January 1996 (Xu et al., 2000) and the rainstorm that occurred over the mid–lower reaches of the Yarlung Zangbo River during 22–23 June 1978 (Xue, 1980). The eastward movement of the TSL may also strongly impact the surrounding areas and areas downstream (Shi and He, 2011). For example, the heavy rainfall in Sichuan basin in 11–15 July 1981 (Kuo et al., 1986) and the 6 out of 8 flood peaks that occurred in the Yangtze River basin in 1998 were all related to the TSL (Zhou et al., 2001; Zhang and Tao, 2002; Yu and Gao, 2010).
Research on TSLs started in the 1950s. By examining the data from 1954 to 1956, Ye et al. (1957) concluded that shear lines were likely to develop over eastern part of the QTP due to the dynamic effect of the terrain and the thermal effect of the plateau. Luo (1963) proposed that the friction effect in the terrain boundary layer was the main reason for the formation of the shear line over the eastern side of the plateau in winter. By calculating the frontogenesis function, Yi (1979) arrived at the conclusion that the diabatic local frontogenesis in the middle of the plateau could lead to the occurrence of ground cyclones on the plateau. With the help of model computation, Yamada (2008) found that soil moisture and vegetation of the plateau had some influence on the structure and evolution of convective cloud clusters above the plateau. Through experimentation, Ye (1981) determined that the plateau boundary layer was dominated by thermal low pressure activities in summer, and the interruption of these thermal low pressure activities could easily promote the development of shear lines. By analyzing the data in 1979, Luo and Yanai (1983) found that the terrain and thermodynamic effects would affect the wind field in the lower layer. By analyzing the distribution of different apparent heat sources and moisture sinks, they also revealed that different parts of the plateau had different heating mechanisms (Luo and Yanai, 1984). According to Benjamin (1986), the diabatic heating effect of the plateau could drive the occurrence and development of mesoscale convective systems on the lee trough, and the low thermal pressure and terrain could cause strong convection and latent heat in the afternoon and at dusk. Through numerical modeling, Demko and Geerts (2010a) argued that heating over the QTP was beneficial to the development of shallow convection, while strengthened convergence in the boundary layer could promote the development of deep convection (Demko and Geerts, 2010b). Shi and He (2011) conducted a survey of changes in the TSL from 2000 to 2004, and they discovered that the existence of two troughs and one ridge at 500 hPa, the South Asian high at 200 hPa, and warm advection in the lower layer were favorable for the TSL formation. As implied by previous studies, the formation of the TSL is closely related to the underlying surface, the thermal force, and the terrain of the QTP, as well as the circulation configuration and coupling be-tween high and low altitudes.
Based on a statistical analysis of the data for 1969–76 by theQTP Meteorological Research Collaborative Group (1981), the east–west oriented TSL mainly occurred at 32.5°N near Naqu County in Tibet, the north–south TSL appeared mainly at 103°E near Ya’an and Kunming, and the northeast–southwest TSL mainly appeared in Qumacai, Nagqu, Shigatse, and Darjeeling in India. Moreover, TSLs were classified into several types, such as the horizontal TSL and the vertical TSL. Meanwhile, it was pointed out that the horizontal TSL appeared almost twice as frequently as the vertical TSL. In summer, the TSL appeared most frequently in June, yet fewest TSLs were observed in May and September. He et al. (2009), Yu et al. (2013,2014), and Zhang et al. (2016) drew similar conclusions based on different datasets. In 2006, the Chengdu Plateau Meteorological Research Institute, as a leading unit, compiled Yearbook of Low Vortexes and Shear Lines in the Qinghai–Tibetan Plateau and made it published, providing basic information for further in-depth and systematic studies on the changes and influences of plateau vortexes and shear lines. Based on the observation data for 1969–76, theQTP Meteorological Research Collaborative Group (1981) came to the conclusion that the apparent heat source/diabatic heating on the plateau in summer has triggered the convective instability and caused formation of the TSL.
The TSL is a unique weather system observed over the QTP. As pointed out by Ye et al. (1977) and Ye (1981), the TSL was weakly baroclinic in most cases. It was warm and wet in the south, cold and dry in the north, and its axis was inclined northward, which was indicated by a zone of cumulus cloud on the satellite cloud image. Based on experimental data obtained from May to August 1979, Tao et al. (1984) concluded that the TSL was located in warm air within a cyclonic vorticity and it was relatively shallow. Qiao and Tan (1984) divided the planetary wind zone above the location where the TSL activities occurred into the calm zone, the eastern zone, and the western zone, which correspond to the warm, cold, and baroclinic TSL, respectively. Xu and Zhang (1983), He and Shi (2011), and Li (2007) reported that the QTP TSL was wet in the south and dry in the north, the temperature gradient was relatively small on both sides, and the shear line was shallow. Li (1978) summarized the characteristics of satellite cloud images of the plateau weather, pointing out that TSLs were zonal and mostly northeast–southwest or east–west oriented in the satellite cloud images.
In terms of the movement of the TSL, Ye et al. (1958) pointed out that a sudden change in the general atmospheric circulation caused the north–south movement of the TSL and enhancement of the plateau heat source would lead to northward movement of the TSL (Ye and Zhang, 1974). Liu and Pan (1987) argued that southward movement of the TSL was related to the southwest movement of the anticyclone north of the shear line and the southward movement of the subtropical high south of the shear line. According to Zhang and Cheng (2000), the formation and development of the TSL was closely related to the formation and development of the local vorticity center and vorticity zone above the plateau. Wang and Cheng (2000, 2002) pointed out that a two-dimensional nonlinear symmetric instability could better describe the role of vorticity in the eastward and southward movement of the TSL. Shi and He (2011) maintained that the 500-hPa deep trough near 32°–49°N, the upper-level jet stream, the strong warm advection in the lower layer, and the positive vorticity advection in the mid–lower layers above the northern QTP helped the TSL move away from the plateau.He (2013) and Yao et al. (2014) presented systematic reviews on other aspects, such as precipitation systems and the relation of the TSL to the vortex over the QTP.
Based on a statistical analysis of newly acquired high-precision experimental and satellite data and the establishment of a new land surface model, Yang et al. (2011) found that the maximum QTP heating occurred in July (the mature stage of the rainy season) rather than in May or June (monsoon season) as was concluded by previous studies. The new data indicated that the eastern part of the QTP was a stronger heat source than the western part in summer. However, studies on the structure of the TSL are limited to averages of several typical cases, and there are relatively few studies on the structure and evolution of different stages of the TSL. Therefore, for this study, we chose a TSL that had persisted for a relatively long time, analyzed its structural and evolutionary characteristics, and presented the effects of QTP surface diabatic heating on the evolution of the TSL, in the hope of further improving understanding of TSLs.
2 Data and methods 2.1 DataBased on previous evaluation of the applicability of various reanalysis datasets (Zhao and Fu, 2009; Xie et al., 2011; Bai et al., 2013), the ERA-Interim 4 times daily upper-air reanalysis data on a 0.75° × 0.75° horizontal resolution produced by the ECMWF (available at apps.ecmwf.int/datasets) were adopted for use in this study. The ECMWF reanalysis data are at 37 vertical levels, with intervals of 50 hPa from 700 to 200 hPa.
2.2 Methods 2.2.1 Objective identification of the TSL over the QTPIn this study, the TSL was identified objectively by using a combination of three parameters: the meridional shear of zonal wind, the relative vorticity, and the zonal zero wind speed line. The specific conditions are as follows (Zhang et al., 2016):
| $\left\{ {\begin{array}{*{20}{c}}{\displaystyle\frac{{\partial u}}{{\partial y}} < 0},\qquad\qquad\,\,\,\\{\zeta = \displaystyle\frac{{\partial v}}{{\partial x}} - \frac{{\partial u}}{{\partial y}} > 0},\\{\!\!u = 0},\qquad\qquad\quad\end{array}} \right.$ | (1) |
where u (v) denotes the zonal (meridional) wind, ζ is the relative vorticity, and y is the north–south coordinate. We focus on 500 hPa in this study for examining the horizontal features of the TSL.
2.2.2 Study areaThe QTP covers a region 25°–40°N, 76°–104°E, with altitudes over 3000 m (Zhang et al., 2016). It mainly includes the Tibetan Autonomous Region, the northern part of Yunnan Province, the western part of Sichuan Pro-vince, the southwestern part of Gansu and Qinghai pro-vinces, and the southern part of the Xinjiang Autonomous Region.
3 Synoptic background of the TSL caseA horizontal shear line that occurred above the QTP from 15 to 19 August 2015 was chosen for this study. Due to the presence of this TSL, rainfall occurred near and on the southern side of the TSL, which caused secondary natural disasters including debris flows, landslides, and so on. The largest cumulative precipitation observed at Nyingchi station was 139 mm, and the daily precipitation in Bomi reached 76 mm on 19 August 2015, exceeding the historical extreme (Liu et al., 2016).
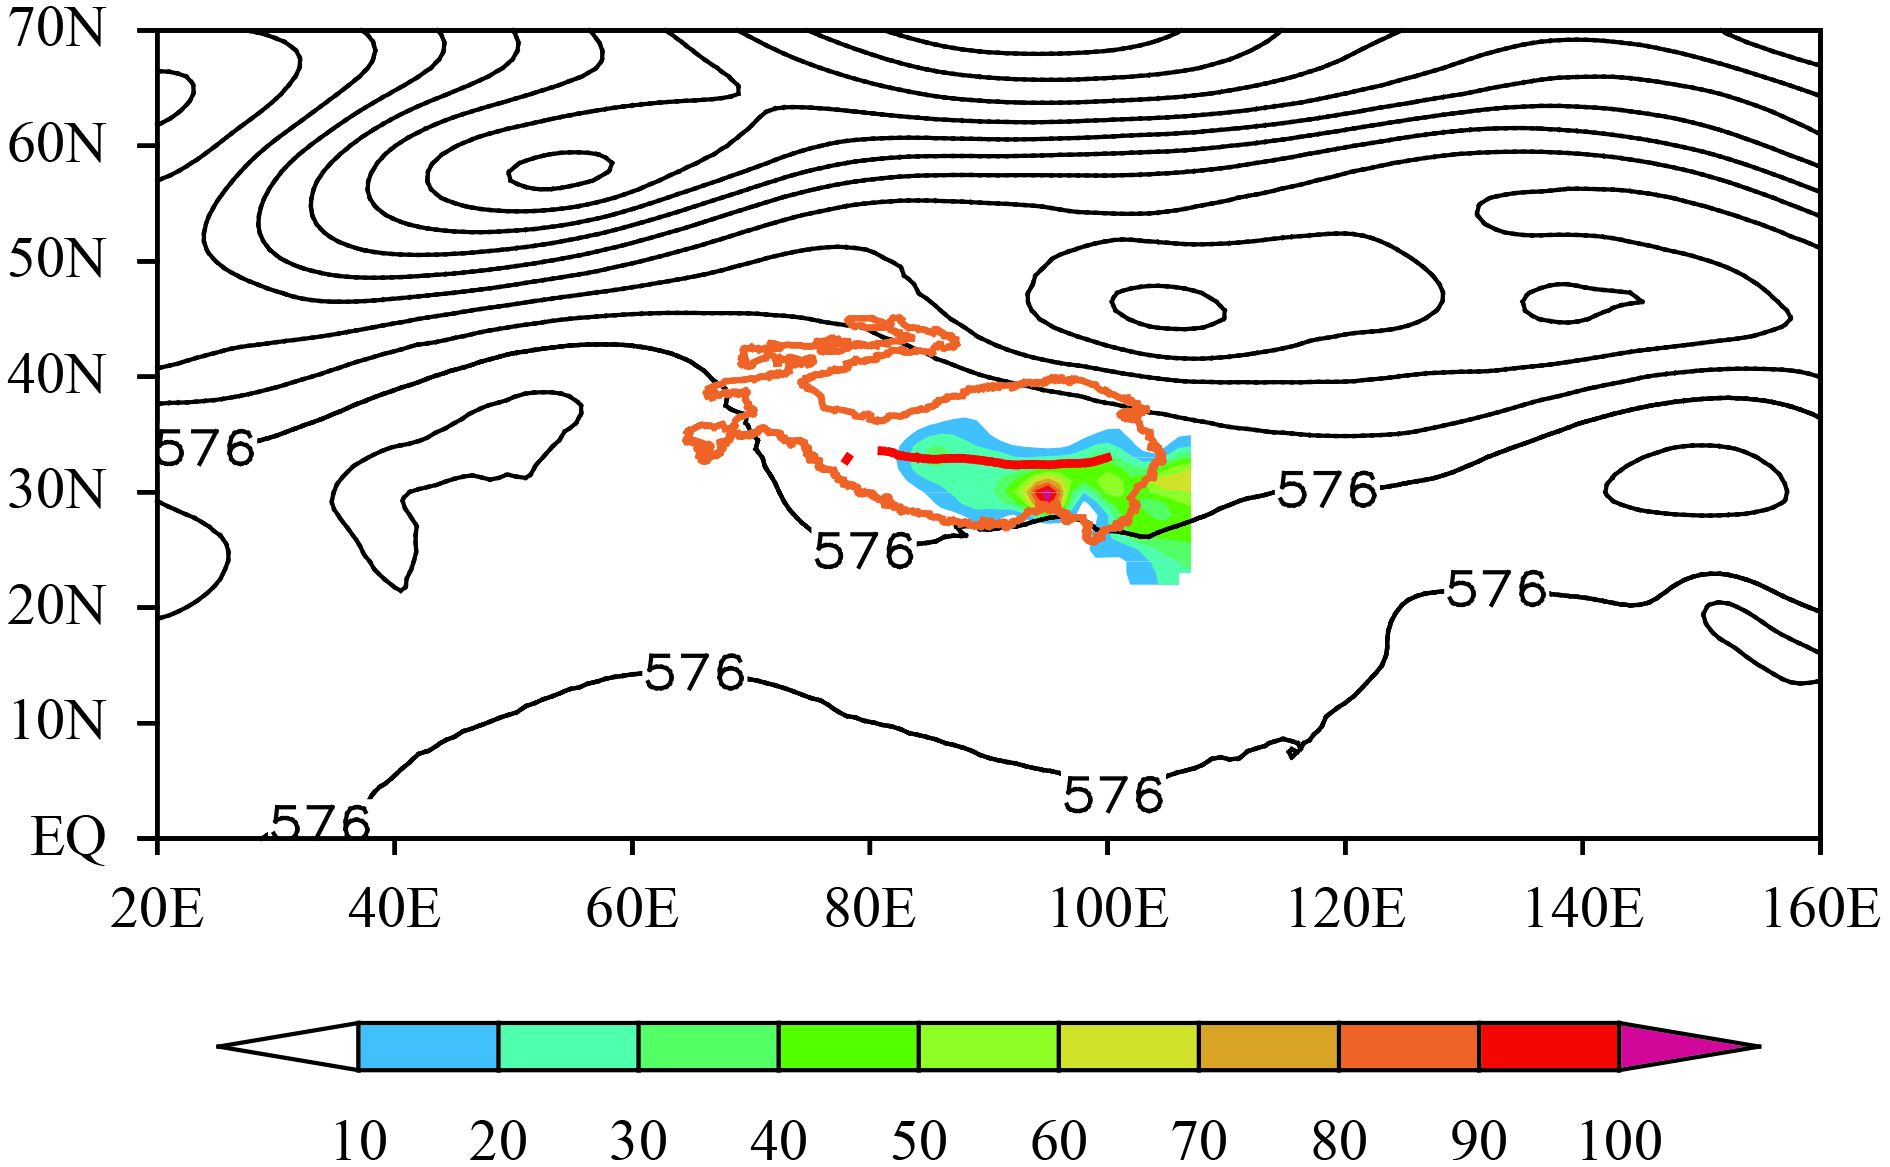
In mid-August 2015, under the influences of a number of synoptic weather systems such as a weak eastward-inclining ridge in Xinjiang, the Mongolian vortex, the western Pacific subtropical high, the Indo–Burma trough, etc., an east–west-oriented shear line (namely, the TSL) developed over the central QTP (32.5°–34°N, 82°–100°E) on 15 August 2015. At 1800 UTC 19 August 2015, the TSL shifted to the south of the plateau (28°–31°N, 89.5°–95.5°E), and it disappeared from the southern boundary of the plateau at 2000 UTC 20 August 2015 (figure omitted).Figure 1 shows the mean field of geopotential height, the identified TSL, and the cumulative precipitation that occurred from 1200 UTC 15 to 1800 UTC 19 August 2015. As shown in Fig. 1, the only low value system that emerged during this period was the plateau horizontal (east–west-oriented) shear line, i.e., the red line inFig. 1, which basically resembled what was described by Xu and Zhang (1983)—“In the average flow field, the horizontal shear line is the only low value system that can be clearly manifested.”
|
| Figure 1 The mean 500-hPa geopential height field (contour; gpdm) and the cumulative precipitation (shaded; mm) from 1200 UTC 15 to 1800 UTC 19 August 2015. The thick red line denotes average position of the TSL and the orange line delineates the QTP above 3000-m altitude. |
The 500-hPa circulation pattern (figure omitted) indicates that, affected by the eastward-inclining high-pressure ridge in Xinjiang and the Mongolian vortex, north or northeast winds occurred in the northern QTP; and influenced by the Indo–Burma monsoon trough and/or the western Pacific subtropical high, the southern QTP was affected by southwest winds. Since there were east–west mountains in the middle of the QTP (e.g., the Tanggula Mountains), the east–west oriented TSL occurred over central QTP. Meanwhile, due to the impact of the plateau’s thermal effect, a weak convective system (comprising warm low vortexes in the lower layer) occurred near the TSL in the afternoon, which then moved eastward with the TSL. Specifically, six low plateau vortexes appeared near the TSL, after which two of them moved eastward and two moved southeastward. When the TSL was active, the South Asian high was stably maintained in the southerly areas above the TSL; and as the South Asian high moved westward from 1800 UTC 18 August, the TSL began to move southeastward and disappeared over the southern slope of the QTP on 1800 UTC 19 August. Thus, it is inferred that the synoptic background configuration among the eastward-inclining ridge in Xinjiang, the Mongolian vortex, the Indo–Burma monsoon trough, the western Pacific subtropical high, and the South Asian high in the upper layer, provides a conducive environment for the formation of the TSL. Among them, the location of the South Asian high determined the location of the TSL, and the development and movement of the eastward-inclining ridge in Xinjiang and the Indo–Burma monsoon trough played a key role in the movement of the TSL. These are basically consistent with the results fromLiu and Pan (1987).
4 Evolution of the TSLThe TSL is generally located from 30° to 35°N over the central and eastern parts of the QTP in summer. The thermal and dynamic characteristics of the TSL have been investigated by many a study, while the structural characteristics and evolution have been investigated fairly less. In this section, based on the data for 15–19 August 2015, we will analyze the average structural characteristics of the TSL that occurred above the QTP during this 5-day time period.
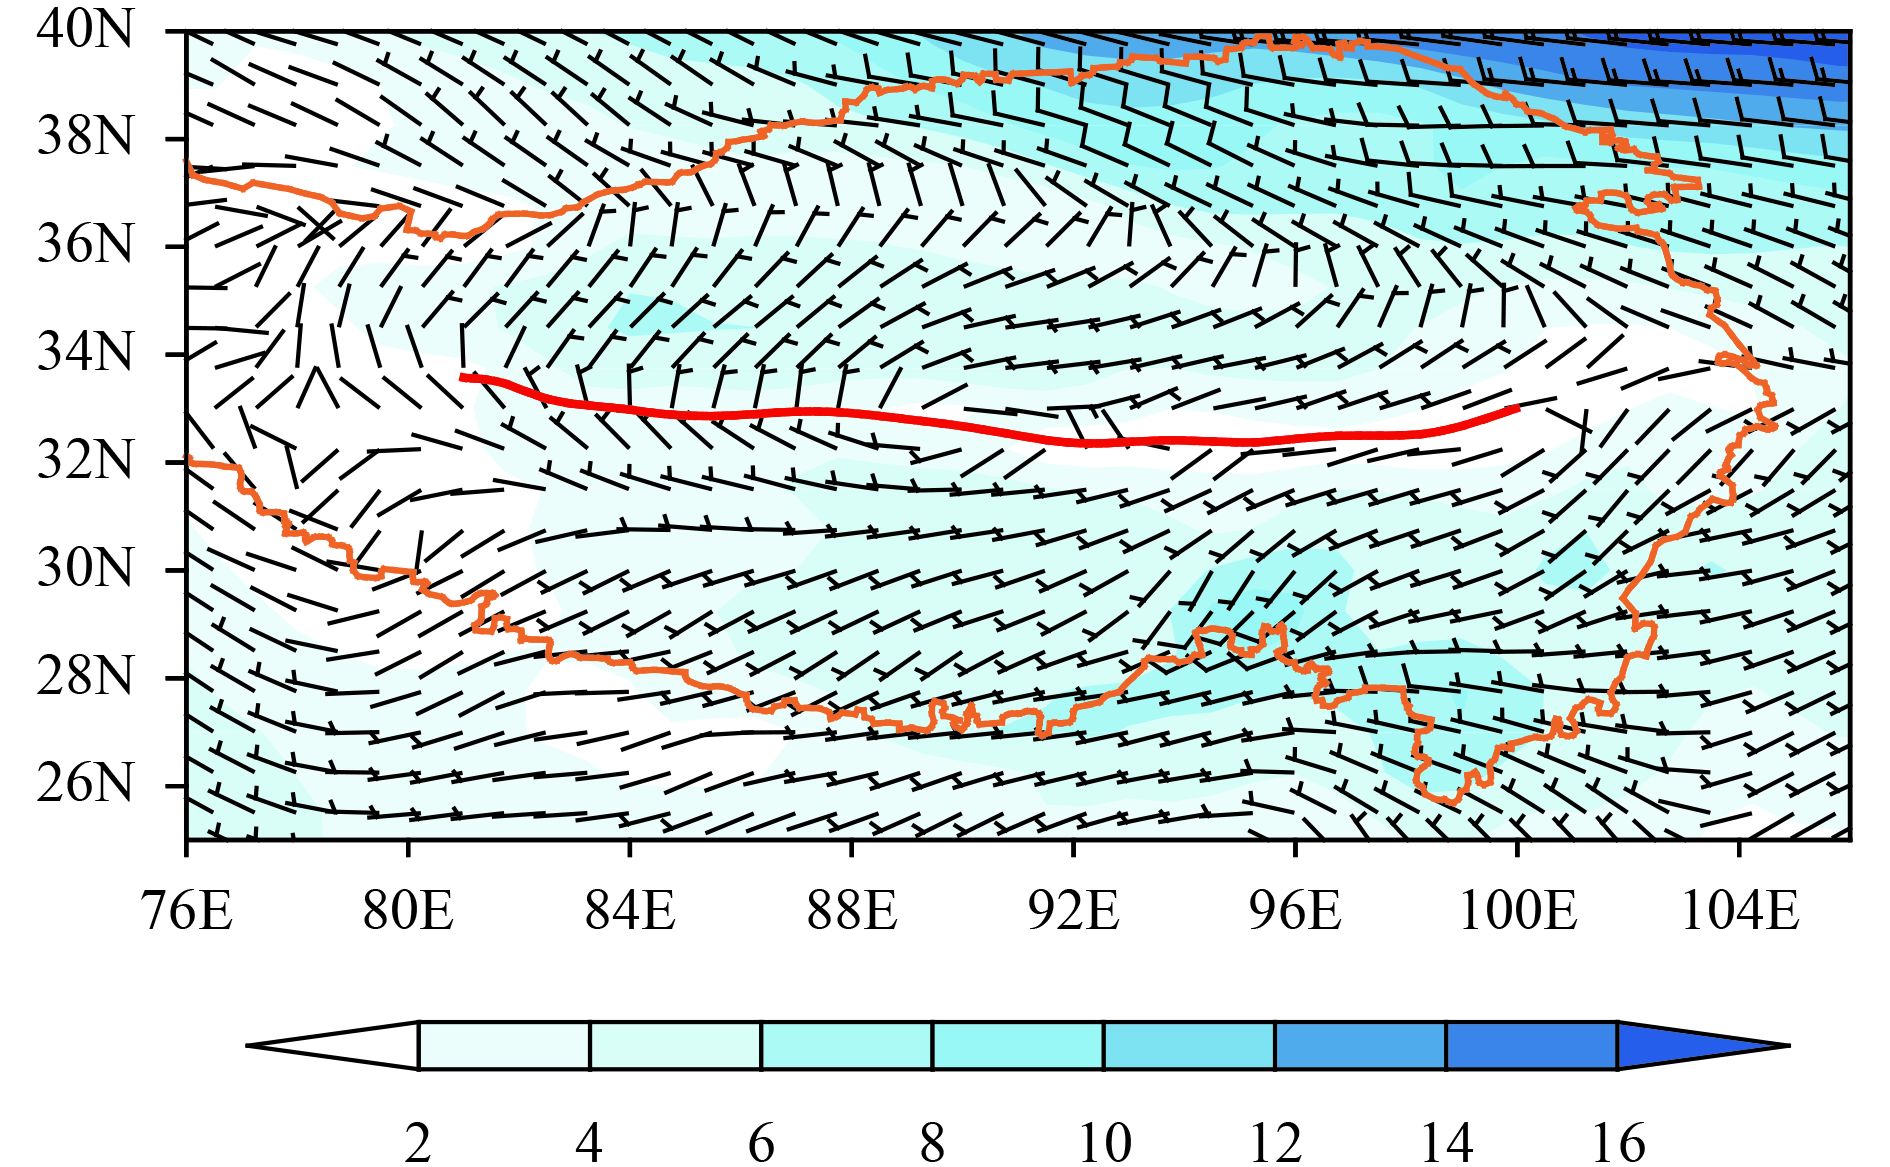
4.1 Structural characteristics 4.1.1 Horizontal structureThe TSL usually refers to the convergence line be-tween opposite wind directions on the 500-hPa isobaric surface observed at more than 3 observation stations, and its length is about 5 degrees in longitude/latitude (QTP Meteorological Research Collaborative Group, 1981). In this study, the objective identification method was used to identify the TSL (the red contour line in Fig. 2). The average horizontal wind vectors and wind speed from 1200 UTC 15 to 1800 UTC 19 August 2015 are also shown in Fig. 2. Except for the Qilian Mountains, most areas on the northern part of the QTP were dominated by north or northeast winds, while the southern part of the QTP experienced west or southwest winds. There was a cyclonic shear between the north/northeast wind and the west/southwest wind in the central part of the plateau (32°–34°N), i.e., there was a full-size TSL near 33°N that measured about 20° longitudes from east to west (80°–100°E) and about 1.5° latitudes from north to south (32.5°–34°N). At the same time, the TSL was in the low value zone with horizontal wind speeds of 0–4 m s–1, covering about 2° latitude from north to south, among which the wind speed east of 90°E was obviously low.
|
| Figure 2 Distribution of the average 500-hPa wind field (wind barb, with wind speed shaded; m s–1) and the TSL (red line) from 1200 UTC 15 to 1800 UTC 19 August 2015. The orange line delineates the QTP above 3000-m altitude. |
Figure 3 displays the average fields for the temperature and dew point temperature at 500 hPa from 1200 UTC 15 to 1800 UTC 19 August 2015. It is seen that the temperature and dew point temperature on the southern side of the TSL exhibited an east–west zonal distribution, the temperature and humidity were high, and yet their gradients were comparatively small. The contour lines of the temperature and dew point temperature on the northern side of the TSL were parallel to the TSL with obvious gradients, and the temperature gradient on the northern side was larger than that on the southern side, slightly different from the findings of Li (2007).

|
| Figure 3 Distribution of the 500-hPa temperature (shaded; K) and dew point temperature (black contour; K) fields averaged from 1200 UTC 15 to 1800 UTC 19 August 2015. The white horizontal line denotes the TSL and the white contour outlines the QTP above 3000-m altitude. |
Figure 4 shows the average vorticity and vertical speed at 500 hPa from 1200 UTC 15 to 1800 UTC 19 August 2015. There was a positive vorticity zone near the TSL, the location of which was basically the same as the axis of the positive vorticity zone. The positive vorticity zone was about 3°–4° latitudes wide and 24° longitudes long, and the largest vorticity center, 0.5 × 10⁻³ s–1, was near 33°N, 89°E. There were obvious negative vorticity areas north of 35°N in the northern part of the positive vorticity zone. Alternating positive and negative vorticity areas existed to the south of 31°N in the southern part of the positive vorticity zone. There was weak ascending motion associated with the TSL, and the ascending motion in the eastern section was more obvious than that in the western section. Meanwhile, the large value area of the vorticity was not consistent with the area of maximum ascending motion, which was located on the southern side of the TSL (in the northern part of the area near the southern slope of the plateau), which is not entirely consistent with the results of He et al. (2009).

|
| Figure 4 Distribution of 500-hPa vorticity (shaded; 10–3 s–1) and vertical wind speed (contour; 10–2 Pa s–1) averaged from 1200 UTC 15 to 1800 UTC 19 August 2015 around the TSL (the horizontal line in magenta) over the QTP (delineated by the orange line). |
Therefore, the TSL at 500 hPa has the following structural features. The TSL was in a cyclonic shear zone between the north/northeast wind and the west/southwest wind; there was a warm and humid zone with relatively small temperature and dew point temperature gradients over the southern part of the plateau, while there was a cold and dry zone with comparatively large temperature and dew point temperature gradients over the northern part of the plateau; the TSL was in the weak wind zone and along the axis of the positive vorticity zone; and the TSL was dominated by weak ascending motion with ascending motion on the southern side of the TSL.
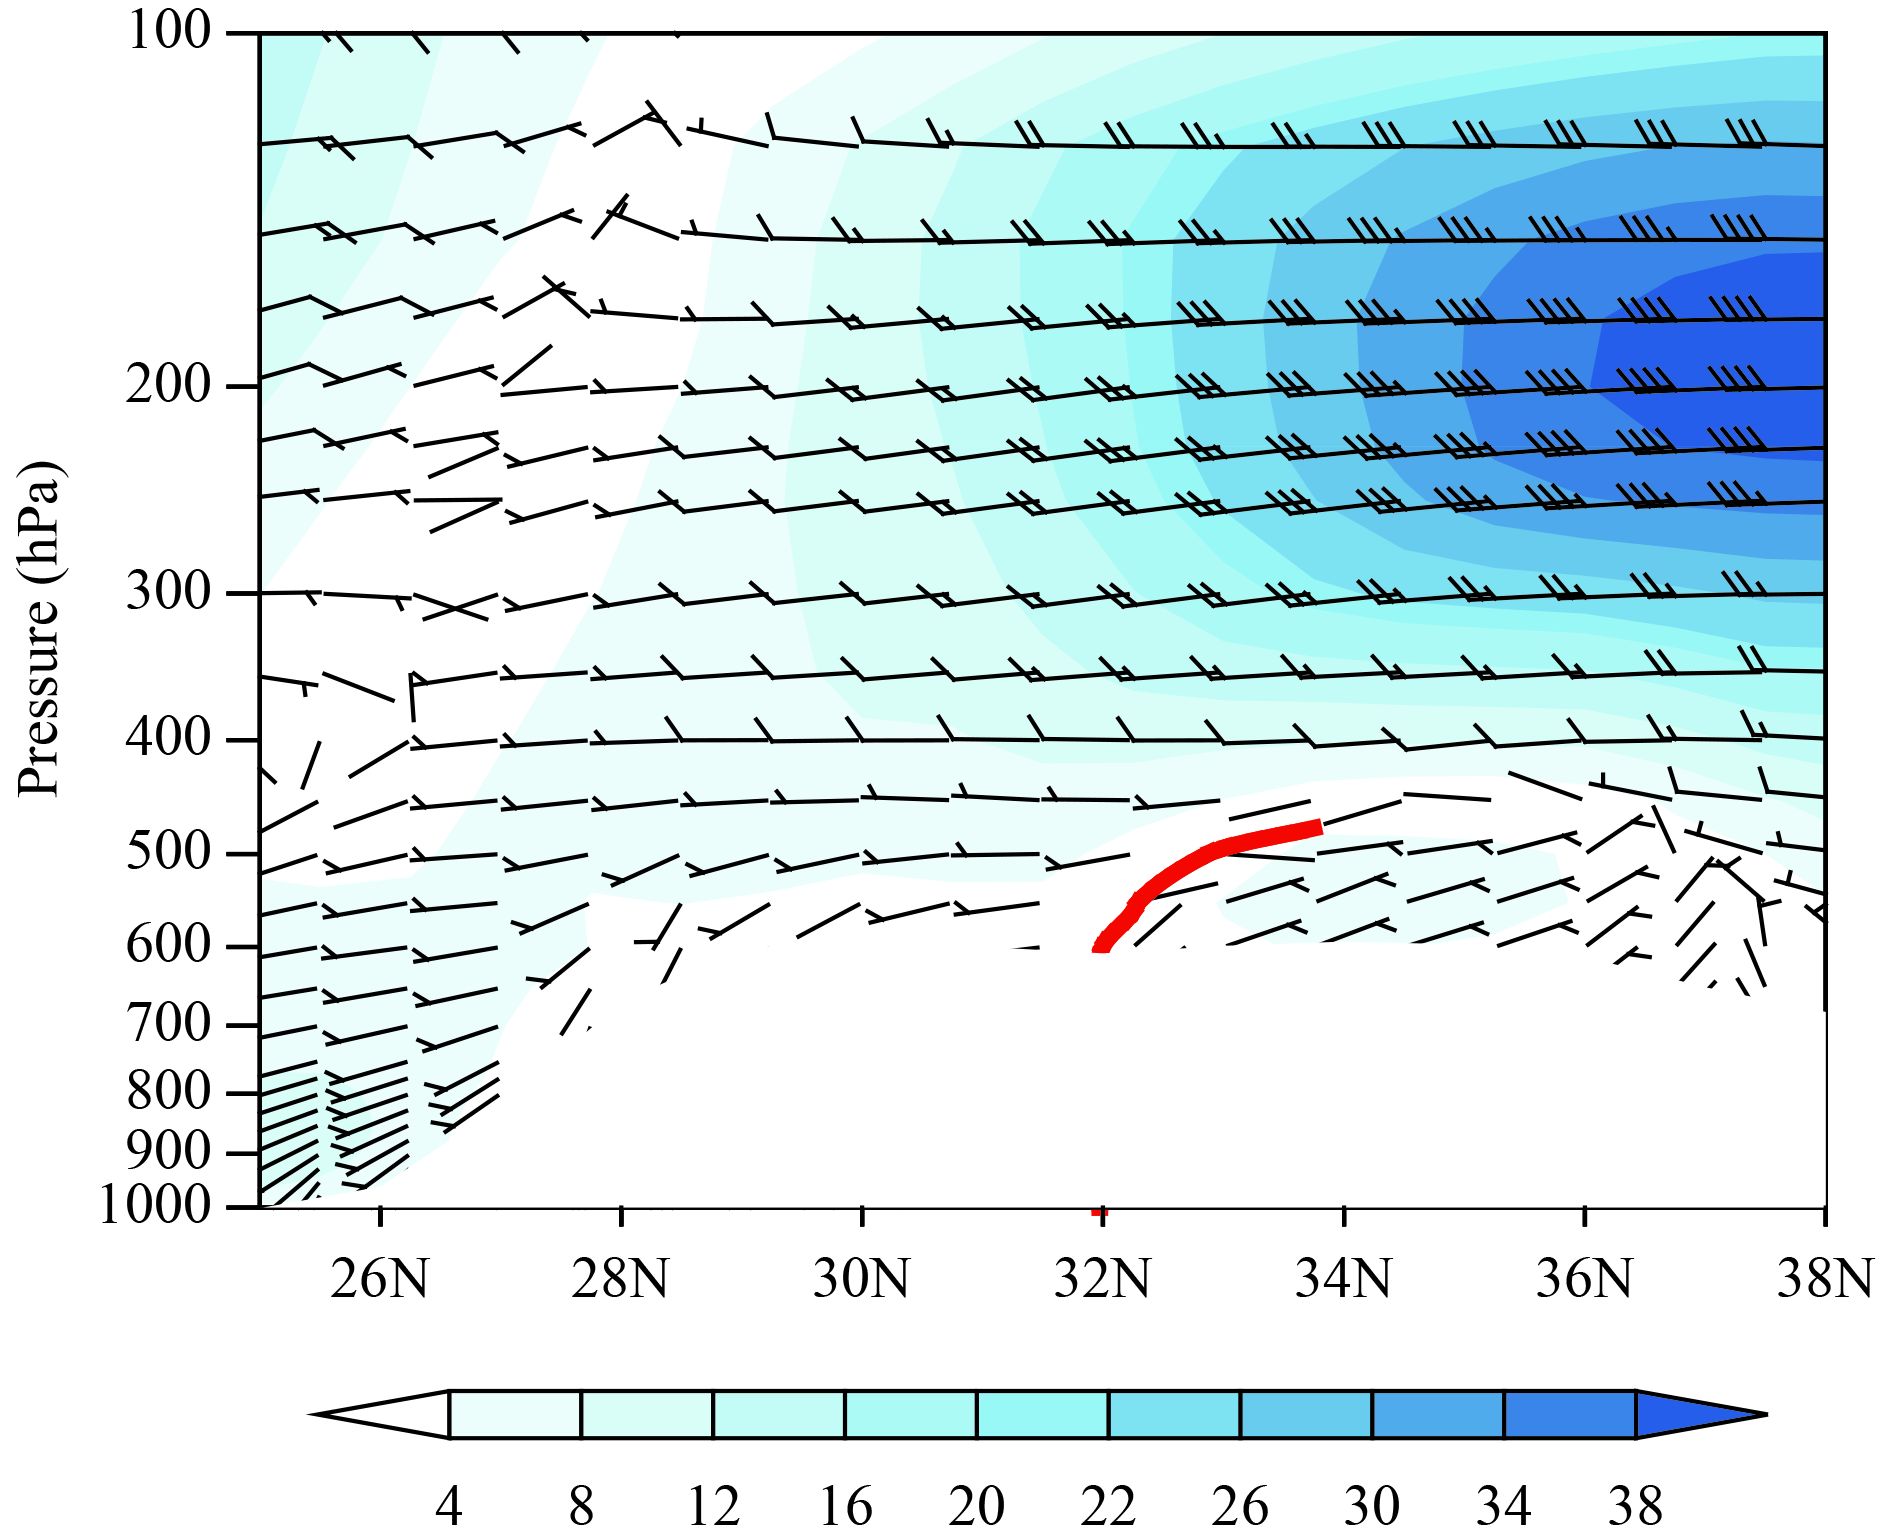
4.1.2 Vertical structureFigure 5 shows the vertical section of the average horizontal wind field at 90°E from 1200 UTC 15 to 1800 UTC 19 August 2015. There was a cyclonic shear be-tween the southwest wind and the north/northeast wind near the TSL; the TSL was maintained over 31.5°–33.5°N and inclined northward with height; and the TSL extended from the ground (about 600 hPa) to about 450 hPa, with a thickness of about 1.5 km. Meanwhile, since the TSL was in the weak wind zone, the upper-level jet stream at 200 hPa was located about 3° latitude from the northern side of the TSL, and the area dominated by northeast wind with small wind speed was located about 4° latitude from the southern side of the TSL. Based on the 200–100-hPa height fields, this was the northern margin of the South Asian high.
|
| Figure 5 Height–latitude cross-section along 90°E of the wind field (wind barb, with wind speed shaded; m s–1) averaged from 1200 UTC 15 to 1800 UTC 19 August 2015. The thick solid red line denotes the TSL and the white blank area denotes the QTP terrain. |
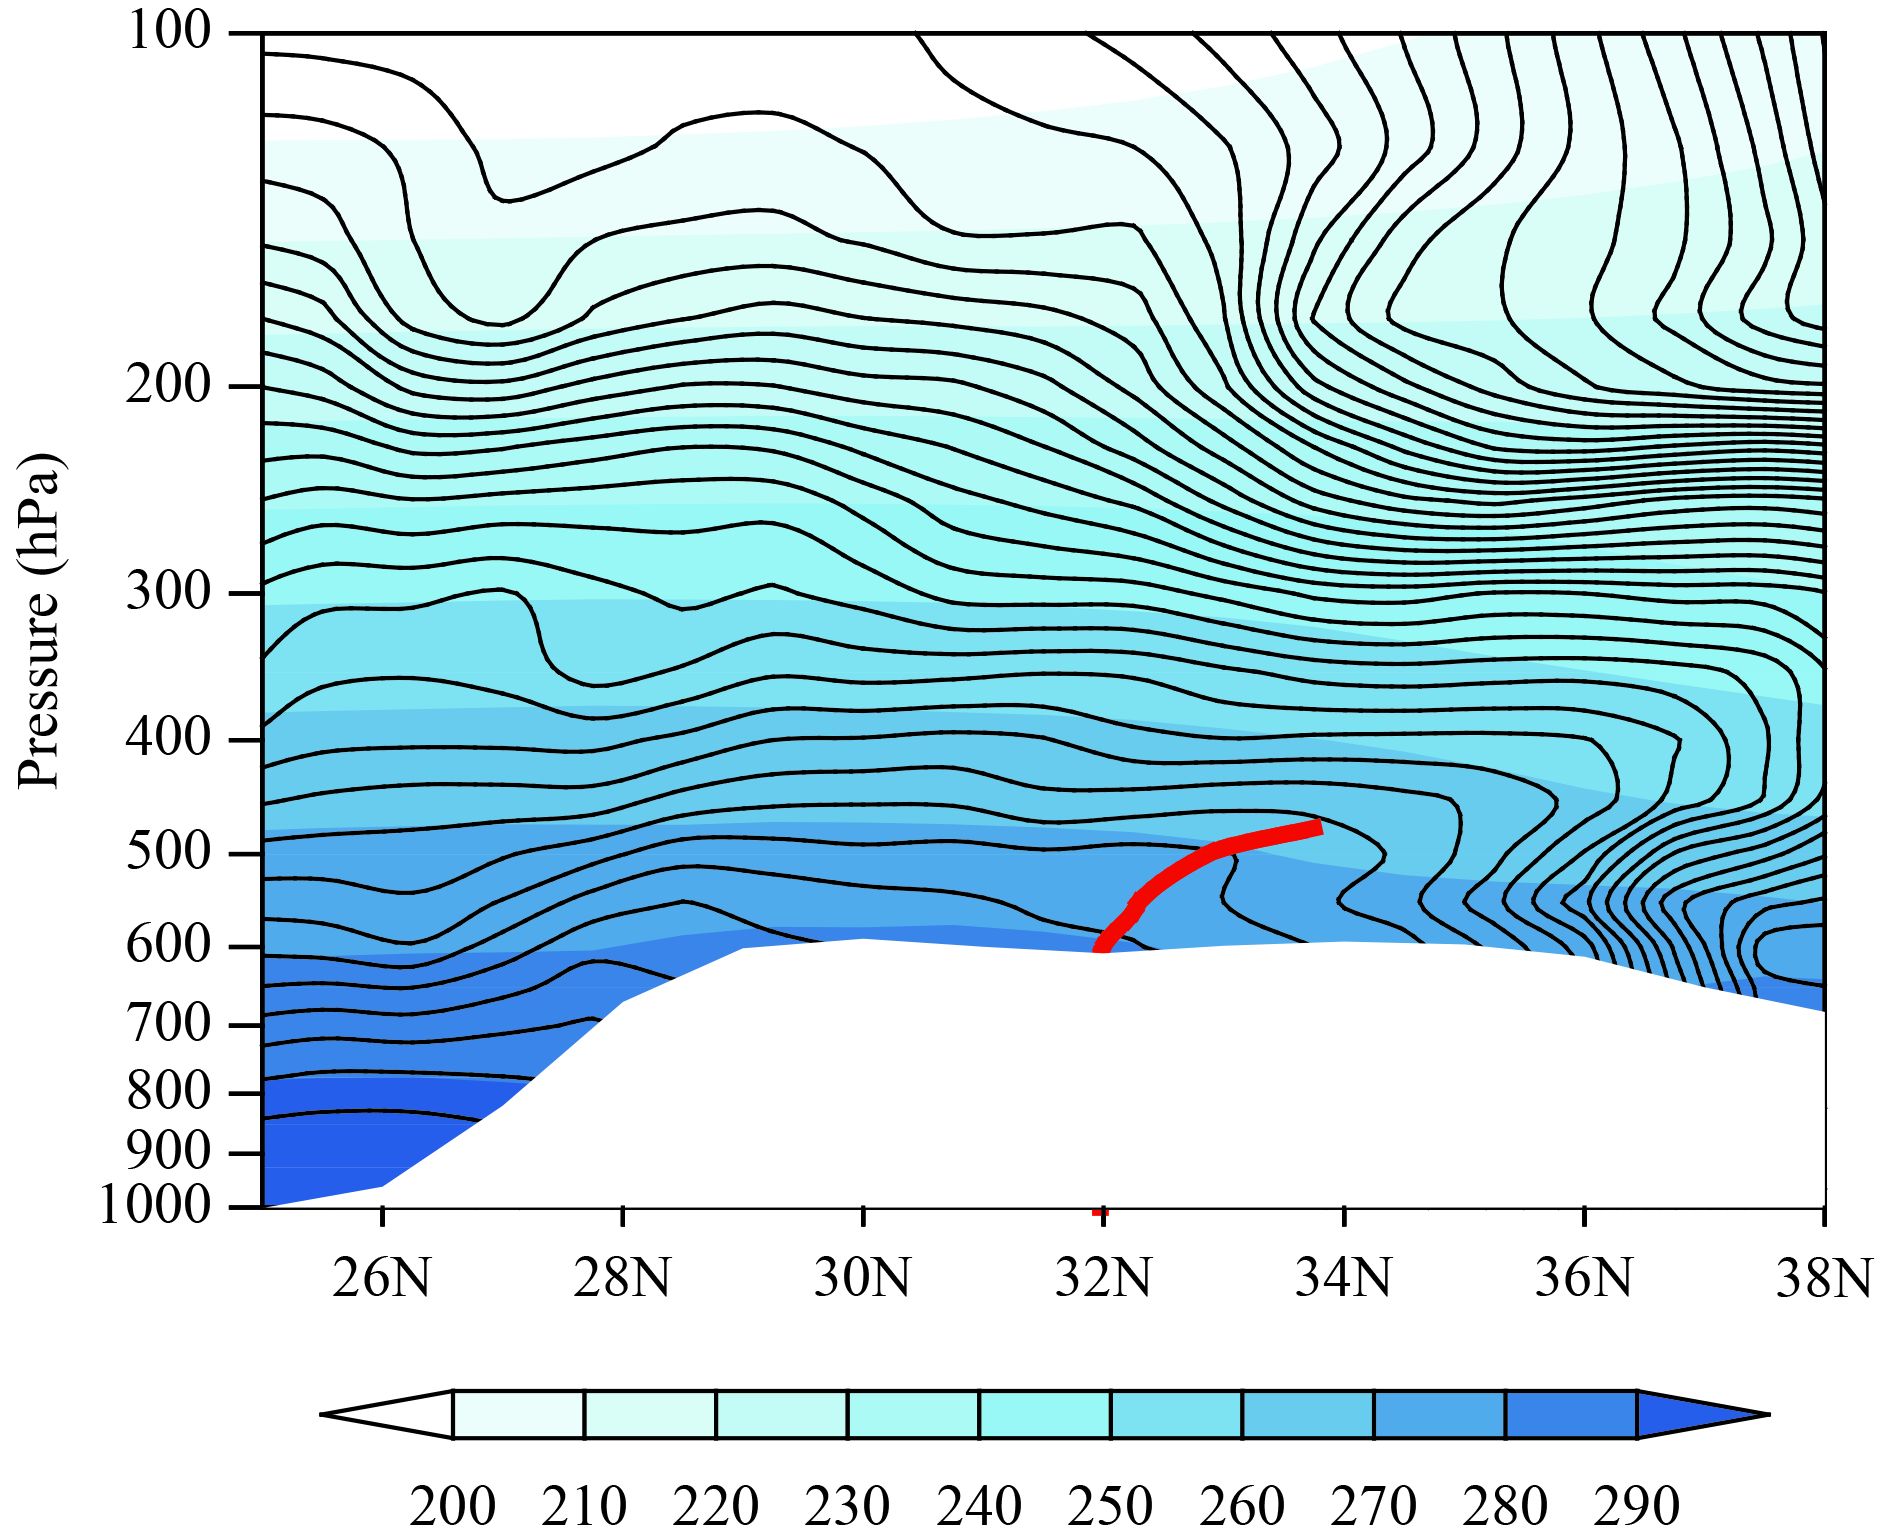
Figure 6 shows the vertical sections of the average temperature and dew point temperature at 90°E from 1200 UTC 15 to 1800 UTC 19 August 2015. As can be seen from Fig. 6, the TSL was located over 32°–34°N, the isothermal lines below 550 hPa on the southern side of the TSL protruded slightly upward while those on the northern side were slightly concaving downward. For the dew point temperature, the TSL was in the protruding moisture tongue whose height extended to approximately 38°N and 300 hPa. Meanwhile, the dew point temperature gradient on the southern side of the TSL was small and that on the northern side was relatively large, indicating that the TSL had a warm moisture tongue with warm and wet air (high temperature and humidity) on a small gradient on the southern side, and dry and cold air (low temperature and humidity) of a large gradient on the northern side.
|
| Figure 6 Height–latitude cross-section along 90°E of the temperature (shaded; K) and dew point temperature (black contour; K) averaged from 1200 UTC 15 to 1800 UTC 19 August 2015. The thick solid red line denotes the TSL and the white blank area denotes the QTP terrain. |
As the QTP surface was largely at approximately 600 hPa, Fig. 7 shows the vertical cross-section of the vorticity and vertical velocity at 90°E from 1200 UTC 15 to 1800 UTC 19 August 2015. It can be seen from Fig. 7 that there was a positive vorticity area near the TSL, yet the vertical height of the TSL was slightly lower than that of the positive vorticity area (375 hPa), indicating that the TSL was a shallow system in the vertical direction. Additionally, the movement of the TSL was consistent with the axial direction of the positive vorticity zone, i.e., inclining northward as the height increases, and both of them were baroclinic to some extent. There was weak descending motion in the surface layer (near 600 hPa) of the TSL, and there was of weak ascending motion within 580–475 hPa. The maximum ascending motion near the TSL was located at approximately 400 hPa, and the vertical velocity on the southern side in the upper layer (200–100 hPa) was zero, indicating that the TSL was located below the northern margin of the descending motion of the South Asian high.

|
| Figure 7 Height–latitude cross-section along 90°E of the vorticity (shaded; 10–3 s–1) and vertical wind speed (contour; 10–2 Pa s–1) averaged from 1200 UTC 15 to 1800 UTC 19 August 2015. The thick red line denotes the TSL. |
Based on the vertical sections at other longitudes (figures omitted), the vertical section of the TSL has the following characteristics. The vertical thickness of the TSL was about 150 hPa (1.5 km) and the maximum height was about 450 hPa, so it was relatively shallow. There was a cyclonic shear near the TSL, and as it was in the warm and moisture tongue and below the positive vorticity axis, it was characterized by certain baroclinicity. The TSL was dominated by weak ascending motion. The western section of the TSL was characterized by a slightly lower height, strong baroclinicity, and a weak warm moisture tongue. The higher the eastern part of the TSL, the weaker the baroclinicity, the more obvious the warm moisture tongue, and more prone the lower layer of the TSL was to stretch below the South Asian high.
4.2 Evolution characteristics of the TSLThe TSL was under the influences of a combination of factors, including atmospheric circulation, complex terrain, thermal forcing, and dynamic effects of the QTP (QTP Meteorological Research Collaborative Group, 1981). The above analysis in this study has indicated that the TSL was located near the positive vorticity axis, and it was a shallow system with baroclinicity. In this section, we then examine its evolution characteristics.
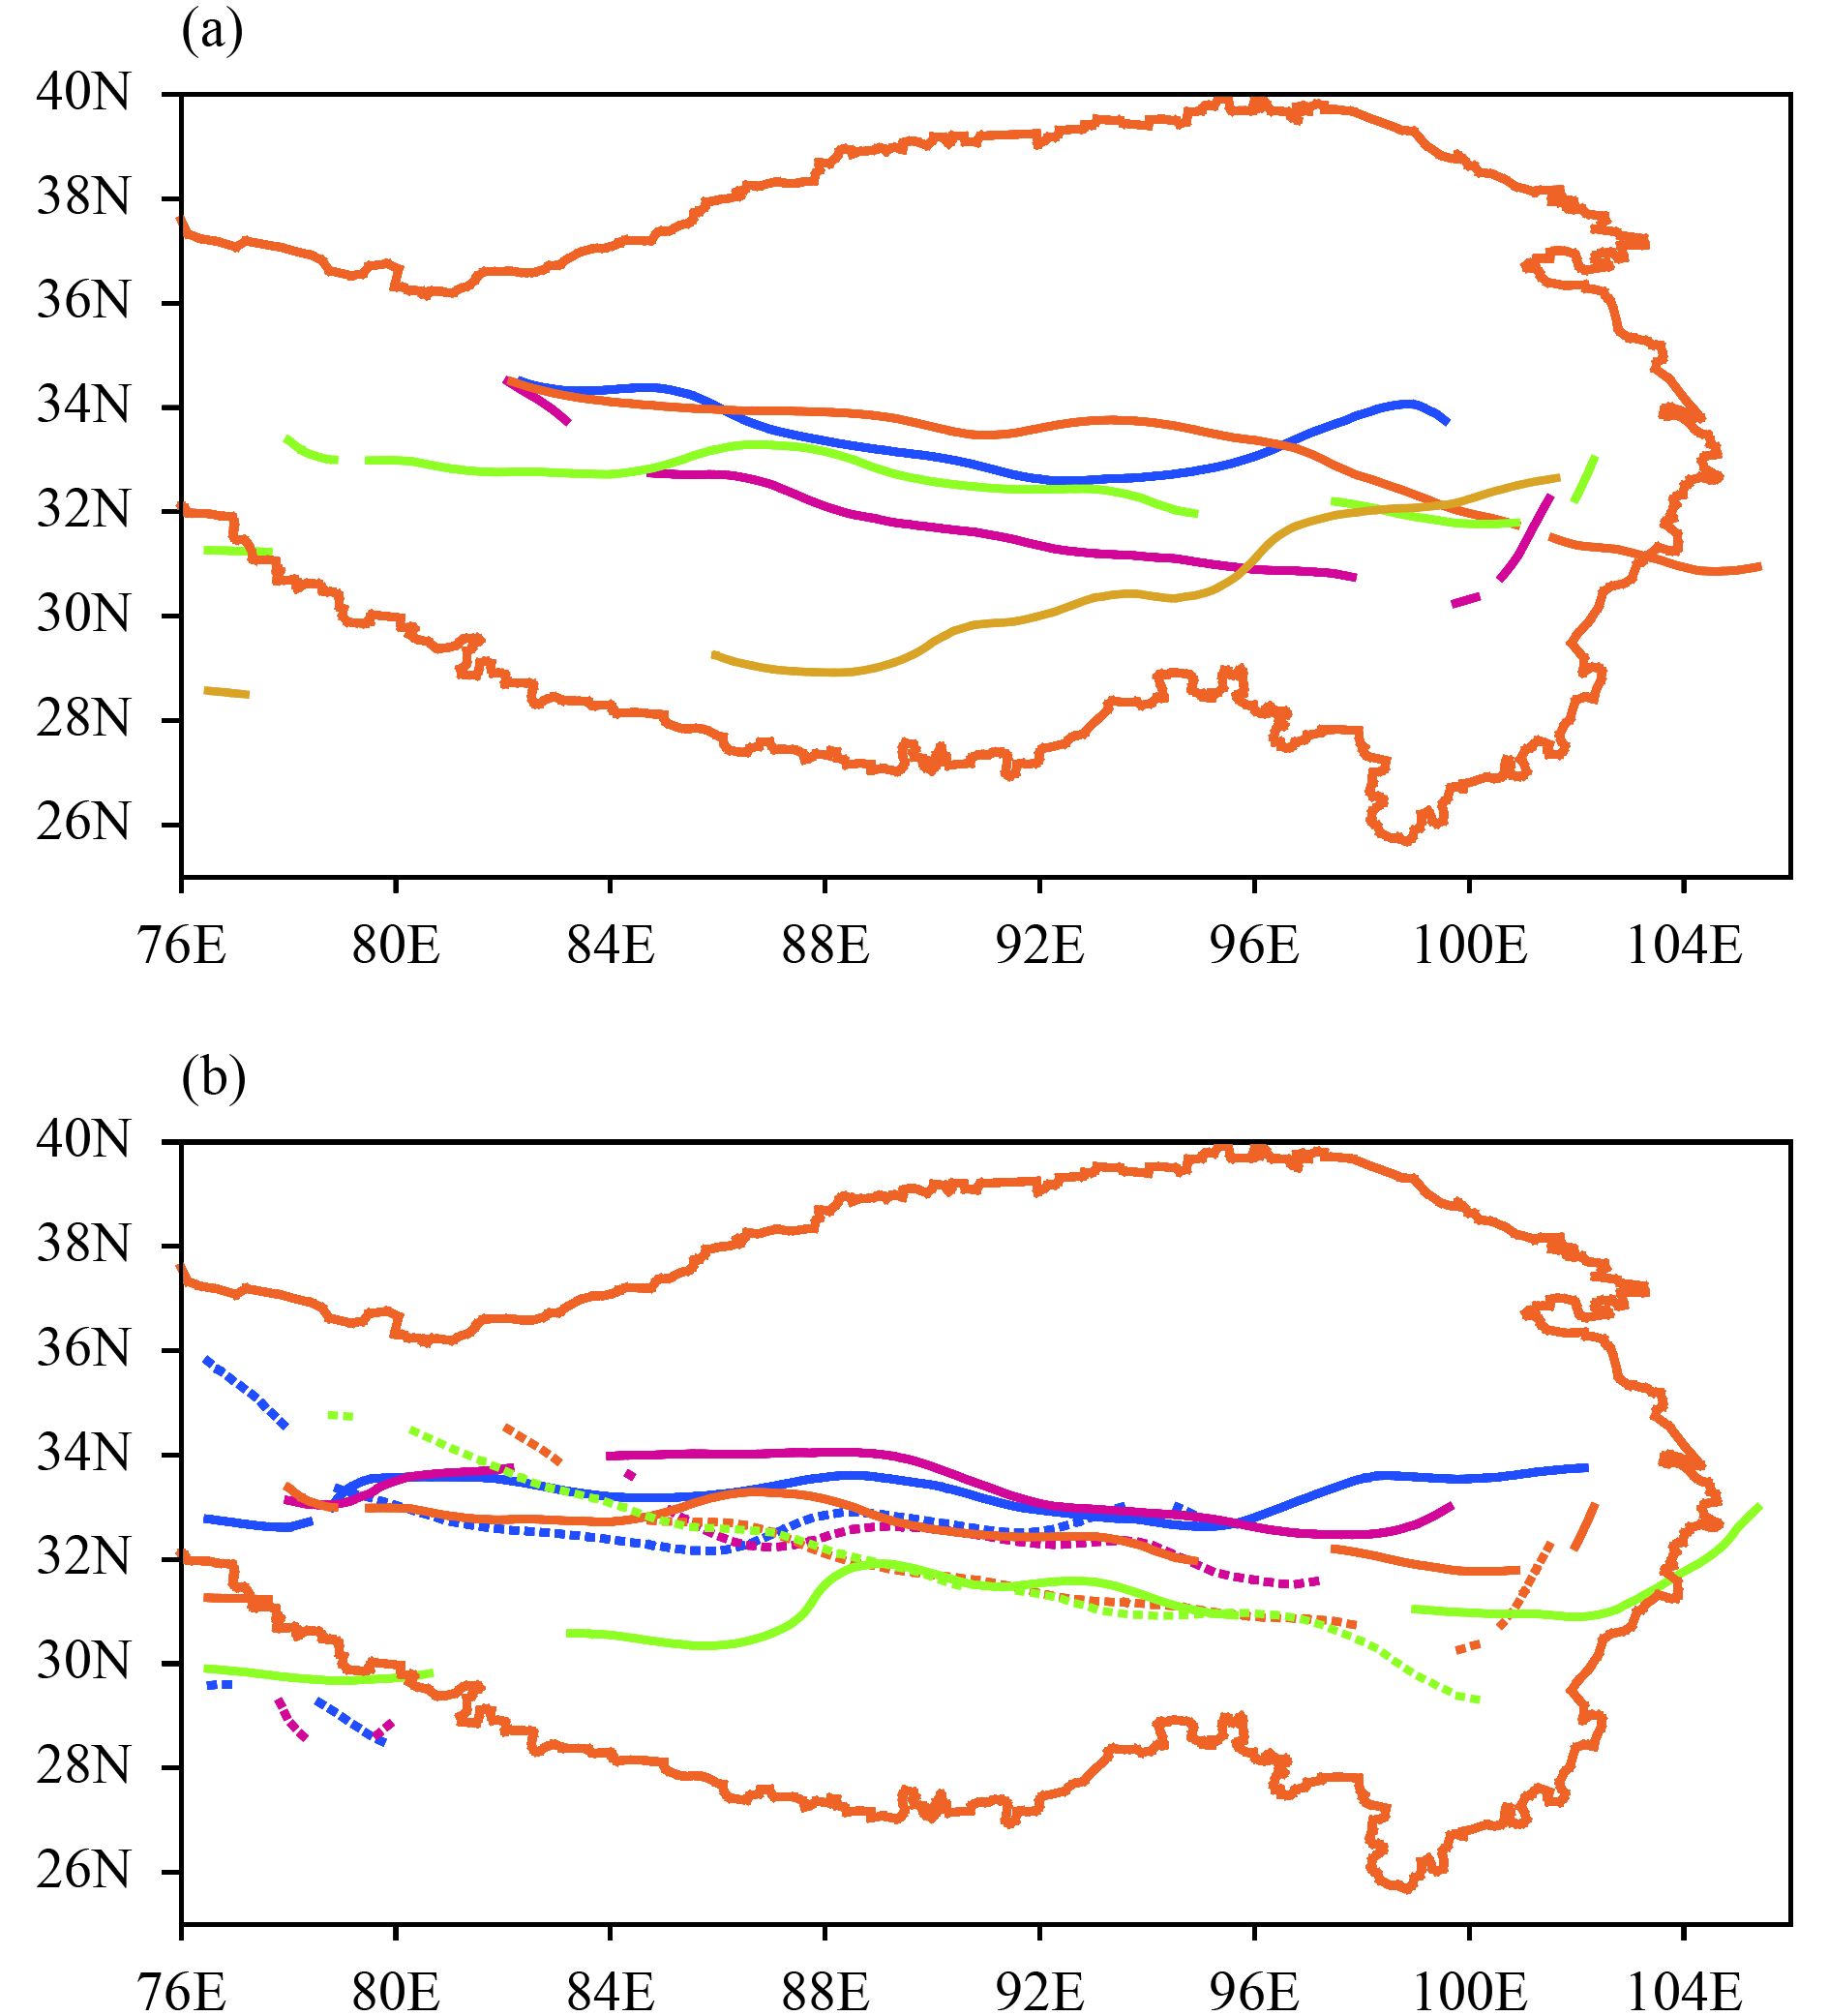
4.2.1 Evolution of the TSL at 500 hPaFigure 8a shows the activity of the 500-hPa TSL, which was automatically identified at 1200 UTC every day. As shown in Fig. 8a, on 15 August, the entire TSL was over 33°–34.5°N, 82°–100°E and extended in a quasi east–west direction. On 16 August, the TSL moved southward and extended to both the east and west, and the eastern section experienced a fracture. On 17 August, the TSL perceptibly moved northward, the north–south span increased to about 4° latitudes (30.5°–34.5°N), and it extended in a quasi northwest–southeast direction, with the western section disappearing and the eastern section extending eastward. On 18 August, the TSL moved slightly southward, the western section extended westward, and the middle and eastern sections fractured or disappeared. At this time, the TSL was divided into 4 sections with divisions at approximately 79°, 96°, and 101°E, the north–south span decreased obviously (32°–33.5°N), and the west–east length increased (78°–102.5°E). On 19 August, the TSL perceptively reoriented from a quasi east–west direction to a quasi northeast–southwest direction, and the western section moved perceptibly southward. Thus, it is clear that the TSL moved along the following path: from north to south, then to the north, and back to the south in the end, during which the TSL’s west–east length, its north–south span, and its shape (continuity and fracture) changed accordingly.
|
| Figure 8 Evolution of the TSL at 500 hPa from 15 to 19 August 2015: (a) daily evolution at 1200 UTC (blue: 15 August; magenta: 16 August; orange: 17 August; green: 18 August; dark yellow: 19 August); and (b) diurnal evolution every 6 h on 16 (dotted lines) and 18 (solid lines) August (blue: 0000 UTC; magenta, 0600 UTC; orange: 1200 UTC; green: 1800 UTC). |
Figure 8b shows the evolution of the TSL every 6 hours on 18 August. It can be seen from Fig. 8b that on 18 August, the TSL was oriented in a quasi east–west direction. At 0000 UTC, the TSL was relatively long (about 30° longitude) in the east–west direction. At 0600 UTC, with 92°E as the center, the TSL experienced a minor clockwise rotation, i.e., the north–south span increased, the length of the TSL decreased, and fracturing occurred. At 1200 UTC, the TSL moved slightly southward and the east–west length increased, yet it fractured at 79°, 96°, and 101°E. At 1800 UTC, the TSL moved further southward, with the southern section having the most perceptible amount of movement, and new TSLs were generated northward from the eastern part, i.e., the north–south span of the TSL increased, the east–west length also increased slightly, and the distance between the dividing points increased. Relative to the southward movement of the TSL, at 0600 UTC, the TSL moved northward, and thus, we reached the same conclusion concerning the evolution of the TSL on 16 August (Fig. 8b). In other words, there was a diurnal variation in the evolution of the TSL.
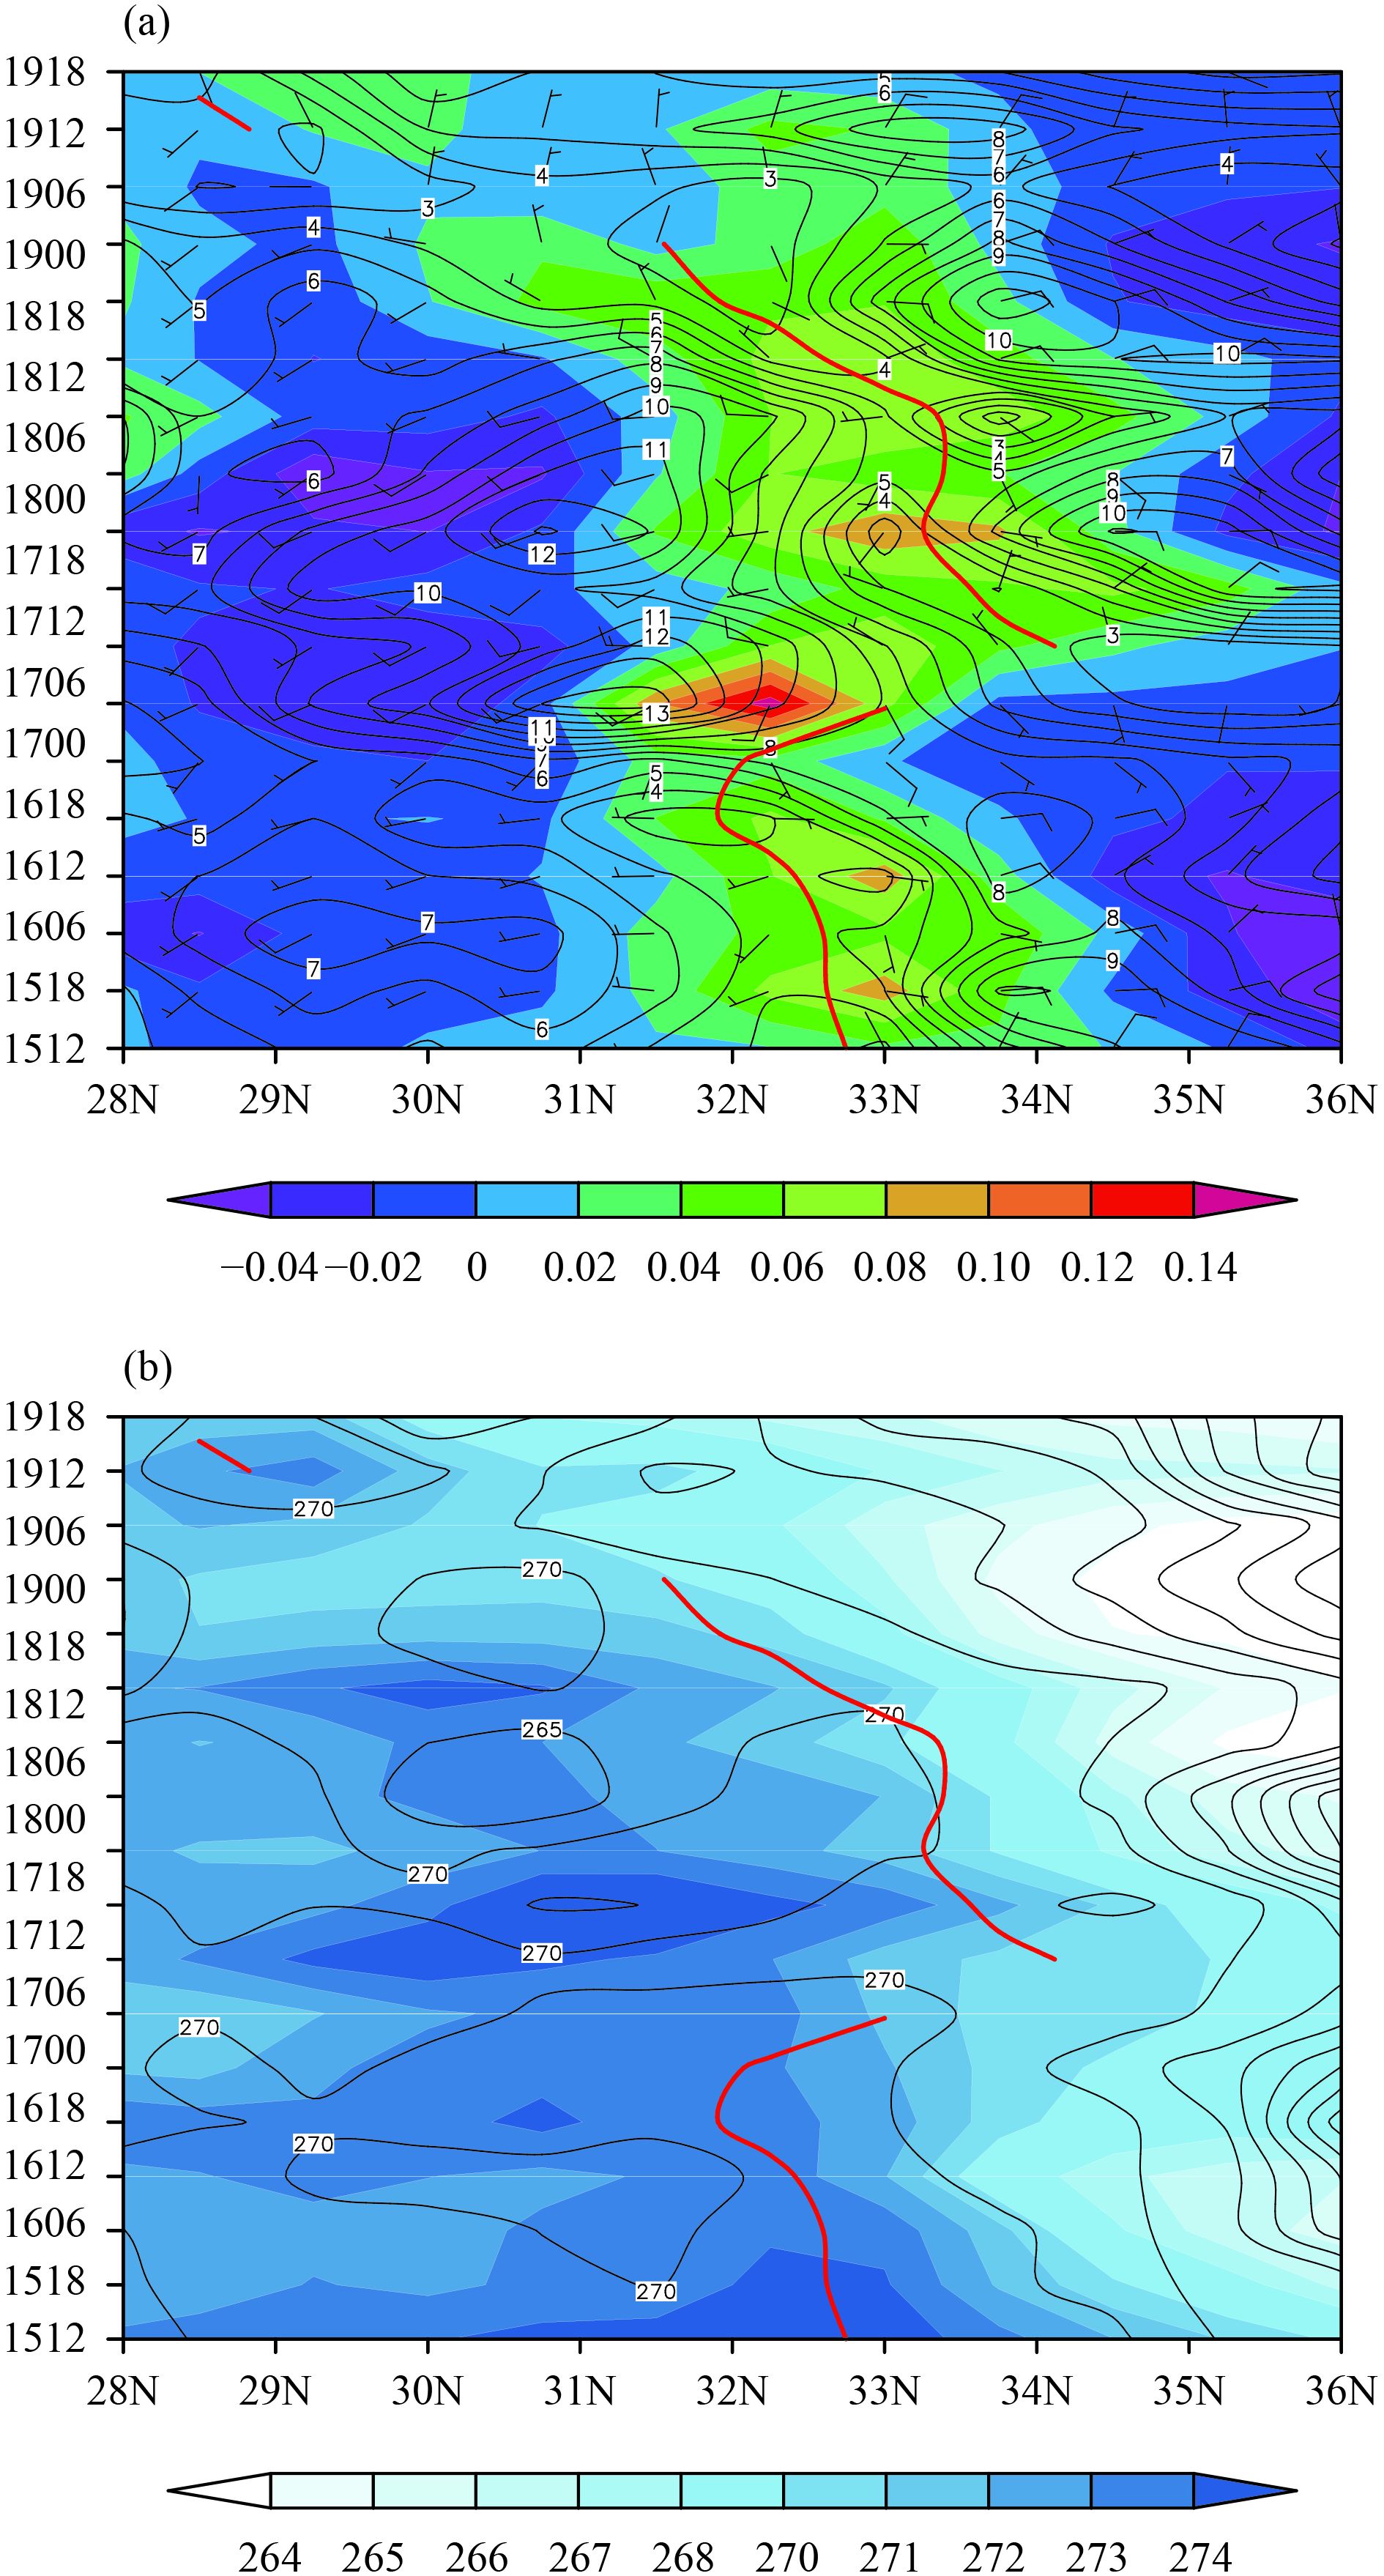
Figure 9 shows temporal evolutions of the wind field, temperature, dew point temperature, and TSL at 500 hPa. It is obvious that the TSL moved from north to south, then moved northward, and then moved southward from 1200 UTC 15 to 1800 UTC 19 August. Yet it had been observed that in plateau areas south of 36°N, the TSL underwent a latitudinal fluctuation of about 4–5° latitude, during which the TSL’s structure had the following common features. The TSL was located in the cyclonic shear zone between the north wind (northwest, north, or northeast wind) and the west/southwest wind. There was a warm and humid zone with relatively small temperature and dew point temperature gradients on the southern side of the TSL, while there was a cold and dry zone with comparatively large temperature and dew point temperature gradients on the northern side. The TSL was in the low wind zone and along the axis of the positive vorticity. The TSL was dominated by weak ascending motion, and the center of the ascending motion was basically on the southern side of the TSL.
|
| Figure 9 Time–latitude cross-sections along 90°E at 500 hPa of (a) the wind barb and wind speed (contour; m s–1), and vorticity (shaded; 10–3 s–1); and (b) the temperature (shaded; K) and dew point temperature (contour; K). The y-coordinate is the date, e.g., 1512 denotes 1200 UTC 15 August. The thick red line denotes the TSL. |
In addition, the horizontal evolution of the TSL also has the following characteristics. (1) The north–south range of motion in the western part of the TSL was larger than those in the middle and eastern parts. The north–south range of motion in the western part was 28°–36°N and that in the eastern part was 29°–34°N. In addition, the diurnal variation of the latitudinal fluctuations of the western part of the TSL were more obvious than those of the middle and eastern parts. (2) The west part of the TSL was likely to fracture or disappear as it moved northward, while it was prone to regenerate or merge while moving southward. The eastern part of the TSL was likely to fracture or disappear as it moved southward, while it was prone to regenerate or merge as it moved northward. (3) As the north–south span (north–south latitude) of the TSL increased, the TSL could easily fracture. When the north–south span decreased, the TSL tended to stay complete (not fracture). (4) From 0000 to 0600 UTC, the TSL was likely to veer clockwise, while it was prone to veer counterclockwise from 1200 to 18UTC. There were more TSLs in the western part at 0000 UTC than at other times, and there were slightly more TSLs in the eastern part at 1200 UTC than at other times.
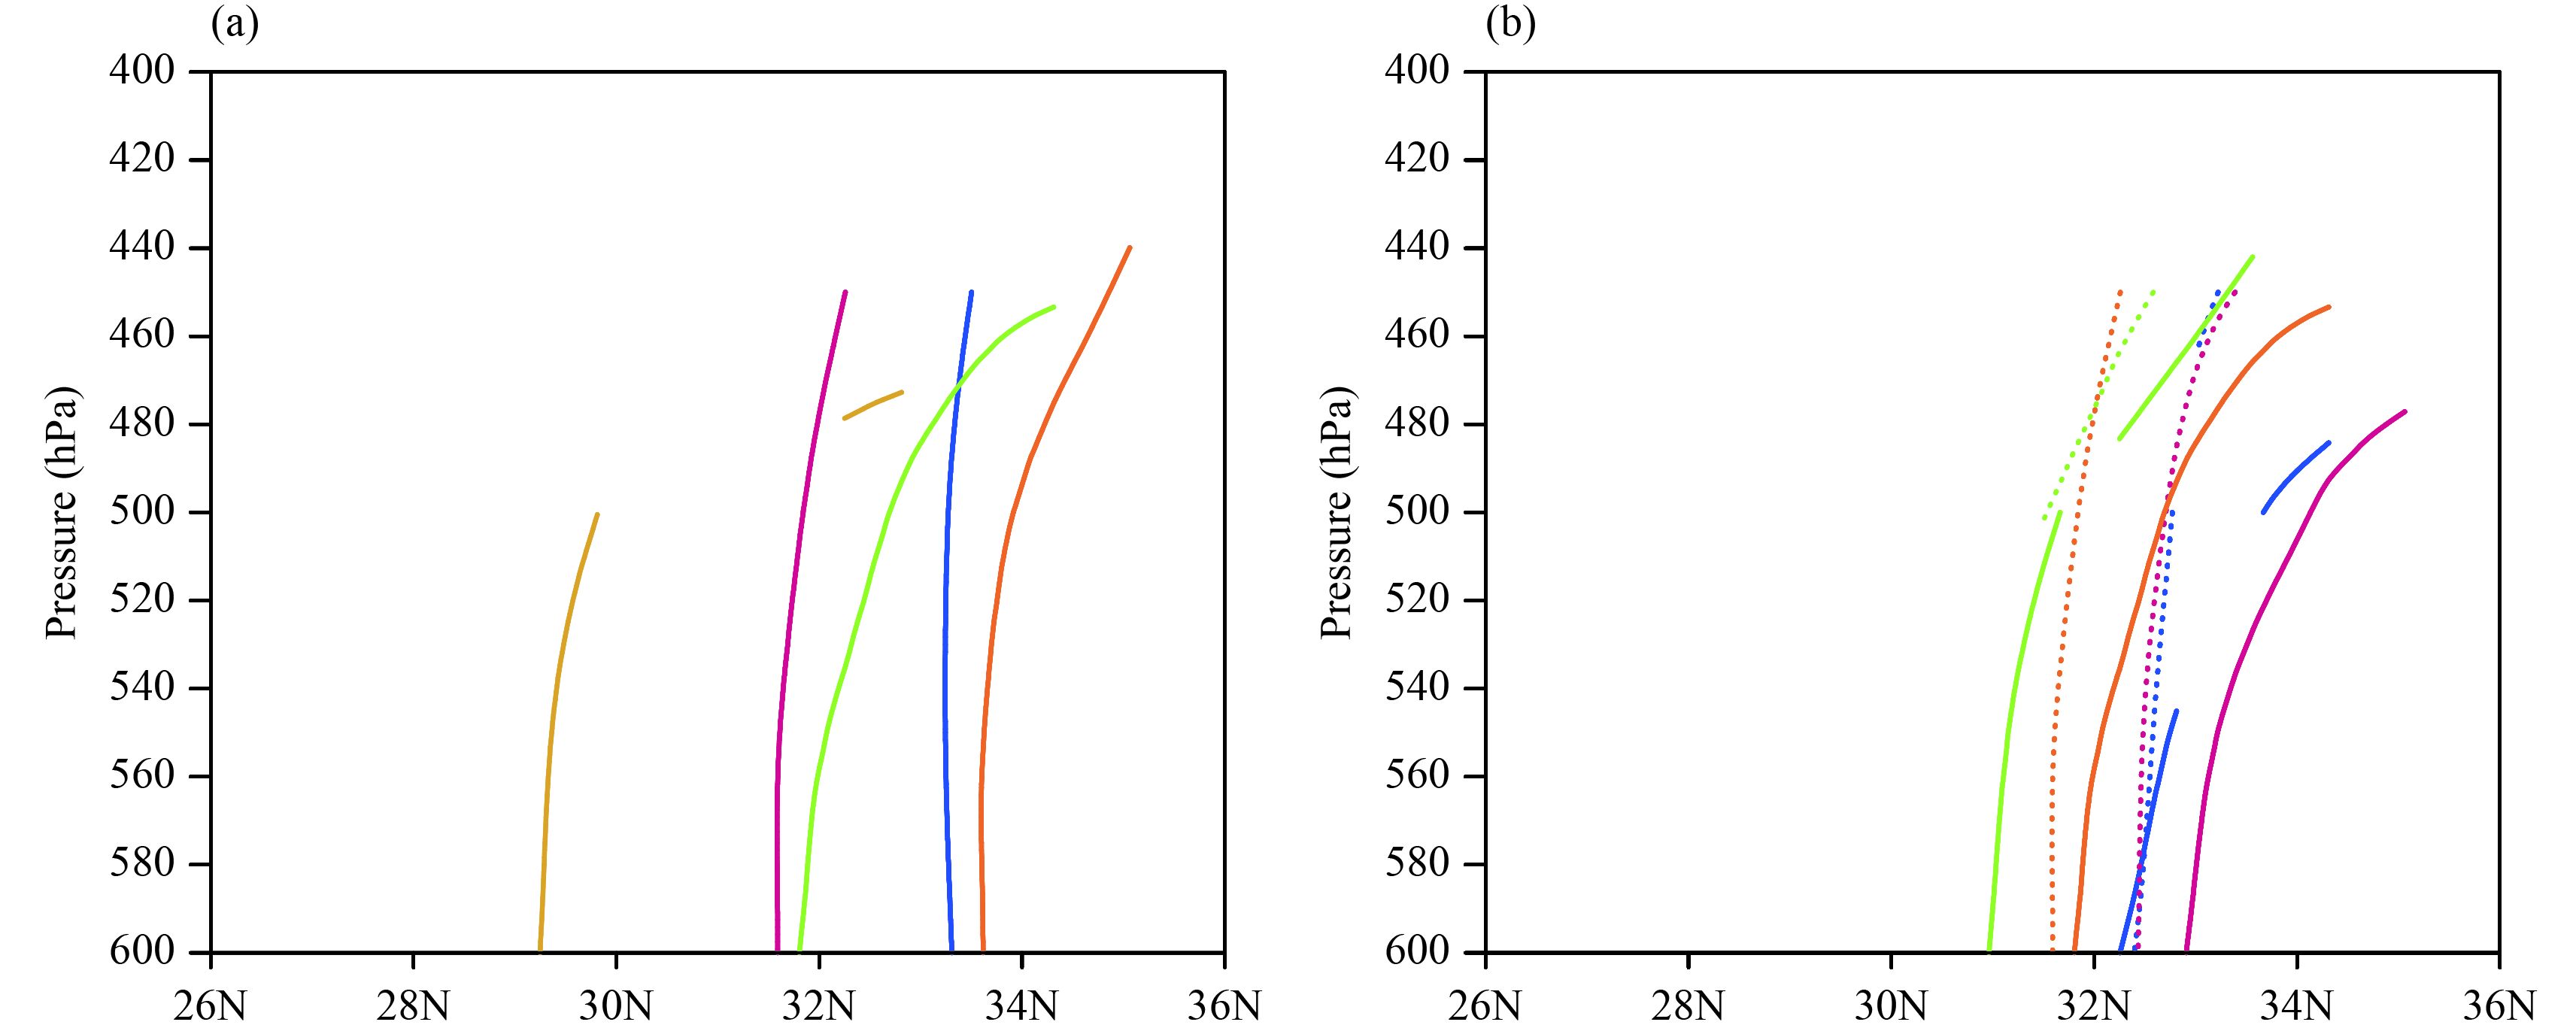
4.2.2 Evolution of the TSL vertical structureFigure 10a shows the daily evolution of the vertical section of the TSL at 90°E. The changes in the TSL at this location primarily occurred over 28°–36°N. The maximum height that the TSL reached was about 440 hPa, the minimum was about 540 hPa, and most fractures of the TSL appeared within 540–450 hPa. More-over, according to distributions of temperature and other variables, the vertical structure of the TSL has the following common features. The TSL had always been in the cyclonic shear zone with a relatively low wind speed, its maximum height was < 440 hPa, and it inclined northward as the height increased. The TSL was located in the moisture tongue on the north side of the warm zone where the dew point temperature gradient on the north side of the TSL was comparatively larger. The TSL was near the positive vorticity axis, and the surface layer (580–520 hPa) of the TSL was dominated by descending motion, while the rest of the layers was dominated by ascending motion. As indicated by the evolution every 6 h in Fig. 10b, the TSL moved northward from 0000 to 0600 UTC and moved southward the rest of the time. The height of the TSL at 1200 and 1800 UTC is higher than that at 0000 and 0600 UTC, implying a diurnal variation.
|
| Figure 10 Height–latitude sections of the TSL along 90°E from 15 to 19 August 2015: (a) daily evolution at 1200 UTC (blue: 15 August; magenta: 16 August; orange: 17 August; green: 18 August; dark yellow: 19 August) and (b) diurnal evolution every 6 h on 16 (dotted lines) and 18 (solid lines) August (blue: 0000 UTC; magenta: 0600 UTC; orange: 1200 UTC; green: 1800 UTC). |
Additionally, the evolution of the vertical section of the TSL also has the following characteristics, which are similar to those shown in Fig. 9. (1) In areas near 500–550 hPa, areas with large wind speeds caused the TSL to move away from them. When the area with a large wind speed approached the TSL, fracturing easily occurred. (2) When the dew point temperature gradient on both sides of the TSL was weakened, the TSL would move southward, fracture, or disappear. Otherwise, it would move northward or regenerate. (3) When the positive vorticity center moved downward or was divided into two vorticity centers, the height of the TSL decreased, fractured, or disappeared. Otherwise, it would increase or regenerate. (4) The height of the TSL was at a minimum at 0000 UTC, and it reached its maximum at 1800 UTC, which was to some extent determined by the plateau’s thermal effect in summer. (5) At 1800 UTC, the TSL in the western section tended to move southward at an increased height. At 0600 UTC, it was prone to move northward at a decreased height. At 1200 UTC, the TSL in the eastern section could easily move northward at an increased height. At 0000 UTC, it was suspended between 600 and 500 hPa.
5 Effect of diabatic heating on the TSLThe above analysis of the structural evolution of the TSL reveals that, on both vertical sections and isobaric surfaces, the TSL was located near the positive vorticity axis and moved synchronously with the positive vorticity zone. Therefore, in this section, the mechanism that controls the evolution of the TSL is investigated by analyzing variations in the vorticity based on the vertical vorticity tendency equation.
Using the concept of potential vorticity and the origi-nal potential vorticity equation, Wu and Liu (1999) derived the complete form vertical vorticity tendency equation, which incorporated both the dynamic and the thermal effects of the atmosphere on the vorticity variation. Chen et al. (2006) directly introduced the thermal equation into the vortex equation to derive the complete form vertical vorticity tendency equation. The complete form vertical vorticity tendency equation obtained by the above two studies via different approaches shows the effect of atmospheric thermal forcing on variations in the vertical vorticity. In this study, the following complete form vertical vorticity tendency equation obtained by Chen et al. (2006) is applied:
| $\begin{split}& \hfill \frac{{\partial {\zeta _z}}}{{\partial t}} + \left( {{\mathop { V}\limits} \cdot \nabla } \right){\zeta _ z}+\beta v = - \left( {f + {\zeta _z}} \right)\left( {\nabla \cdot \mathop { V}\limits} \right) + \frac{\lambda }{{\left| {\nabla \theta } \right|}}{\mathop{{ \zeta} _ {\rm a}}\limits} \cdot \nabla Q \;-\hfill \frac{\lambda }{{\left| {\nabla \theta } \right|}} \\&\cdot {{\mathop{{ \zeta} _{\rm h}}\limits} } \cdot \frac{\rm d}{{{\rm d}t}}{\nabla _{\rm h}}\theta - \frac{\lambda }{{\left| {\nabla \theta } \right|}}\left( {f + {\zeta _z}} \right)\frac{\rm {\rm d}}{{{\rm d}t}}\left( {\frac{{\partial \theta }}{{\partial z}}} \right) - \left( {\frac{{\partial \alpha }}{{\partial x}}\frac{{\partial p}}{{\partial y}} - \frac{{\partial \alpha }}{{\partial y}}\frac{{\partial p}}{{\partial x}}} \right) + {\zeta _{\rm f}}, \end{split}$ \ | (2) |
where
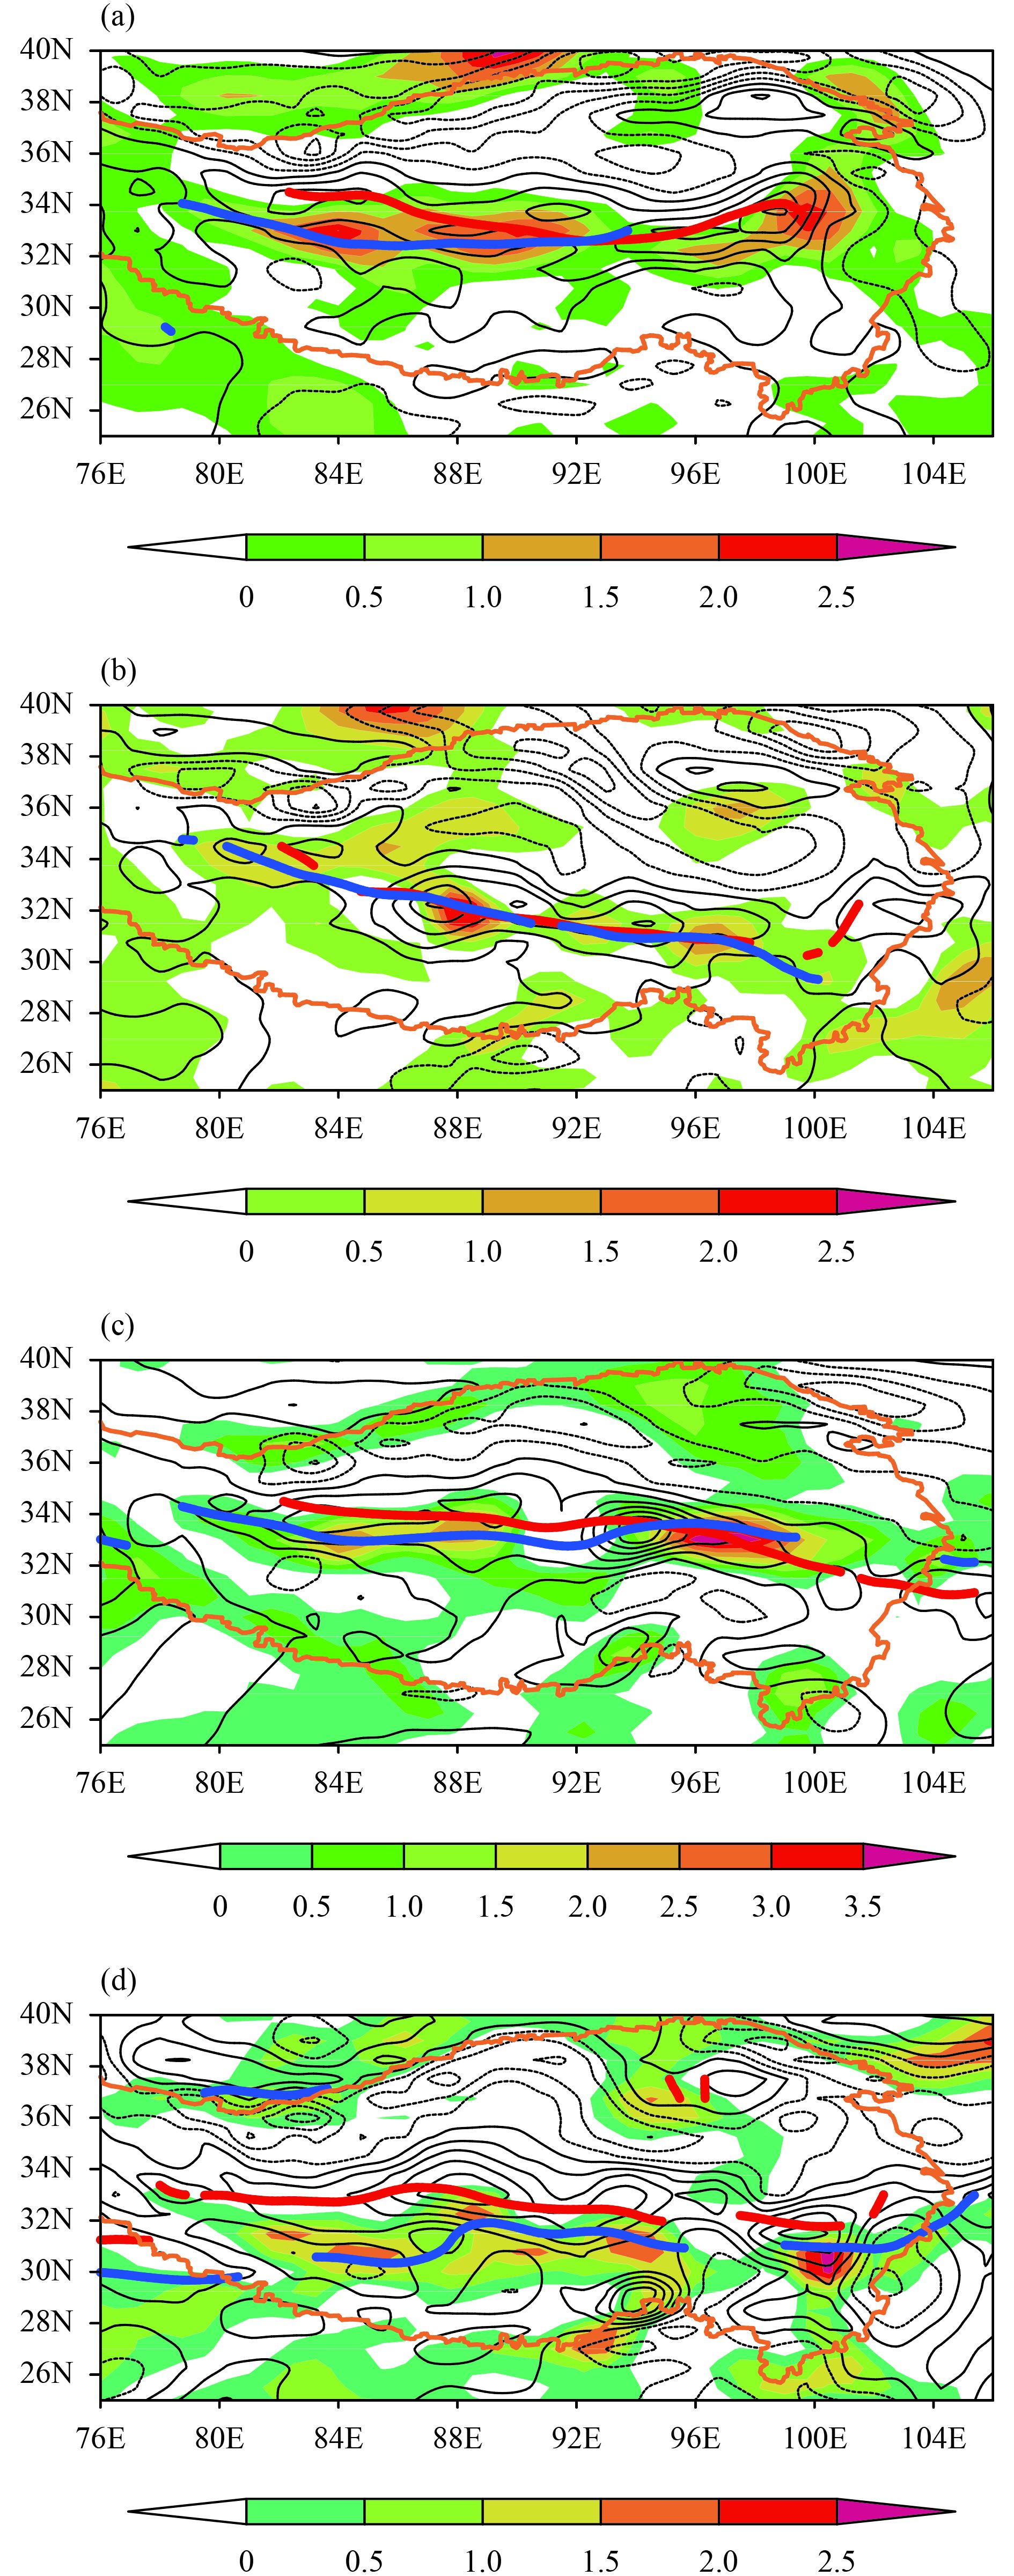
Figure 11 shows the vorticity at 500 hPa at 1200 UTC from 15 to 18 August 2015, its variation in the next 6 h, and the positions of the TSL at 1200 and 1800 UTC. It is seen that the TSL moved towards the areas of positive vorticity where the vorticity increases perceptibly. For example, at 1200 UTC 15 August, the TSL to the west of 92°E was expected to move southward; at 1200 UTC 16 August, the TSL was estimated to be quasi-stationary; at 1200 UTC 17 August, the TSL was predicted to veer counterclockwise with its center at 94°E; and at 1200 UTC 18 August, the TSL moved southward. In addition, the movement of the TSL at other times was also characterized by such a pattern.
|
| Figure 11 Distributions of the vorticity (contour; 10–3 s–1), the vorticity change (shaded; 10–8 s–2), and the TSL at 1200 UTC (red line) and 1800 UTC (blue line) at 500 hPa on (a) 15, (b) 16, (c) 17, and (d) 18 August 2015. |
By studying the thermodynamic mechanism of the unique, large terrain of the QTP and its effect on the amount of water held in the clouds, Xu et al. (2014) reported how the hydrological cycle was influenced by the changes in water resources of the QTP, highlighting the influence of the QTP on the global climate and environmental change. To analyze the impact of diabatic heating on the TSL, the reverse calculation method proposed by Yanai and Li (1994) was used to calculate the apparent atmospheric heat source (Q1), which included the latent heat of condensation, so as to characterize the distribution of the diabatic heating field. In addition, the apparent heat source expressed in terms of potential temperature can be written as (Yao and Sun, 2013):
| ${Q_1} = {c_p}{\left( {\frac{p}{{{p_{_{00}}}}}} \right)^k}\left( {\frac{{\partial \theta }}{{\partial t}} + \mathop { V}\limits \cdot \nabla \theta + \omega \frac{{\partial \theta }}{{\partial p}}} \right),$ | (3) |
where θ denotes the potential temperature, k = R/cp, R and cp stand for the gas constant of the dry air and the specific heat at constant pressure, respectively; and p00 is set as 1000 hPa. The three terms on the right side of Eq. (3), from left to right, represent local variation (Q1t), horizontal advection (Q1h), and vertical advection (Q1v) of the diabatic heating.
In the complete form vertical vorticity tendency equation [Eq. (2)], the influence of diabatic heating on the vertical vorticity is expressed as

|
| Figure 12 Diabatic heating (shaded; K s–1) along 90°E and the meridional vertical section of vorticity (contour; 10–3 s–1) along with the TSL (red line: current TSL; blue line: TSL 6 h later) at (a) 0600 UTC 17, (b) 1800 UTC 18, and (c) 1200 UTC 16 August 2015. |
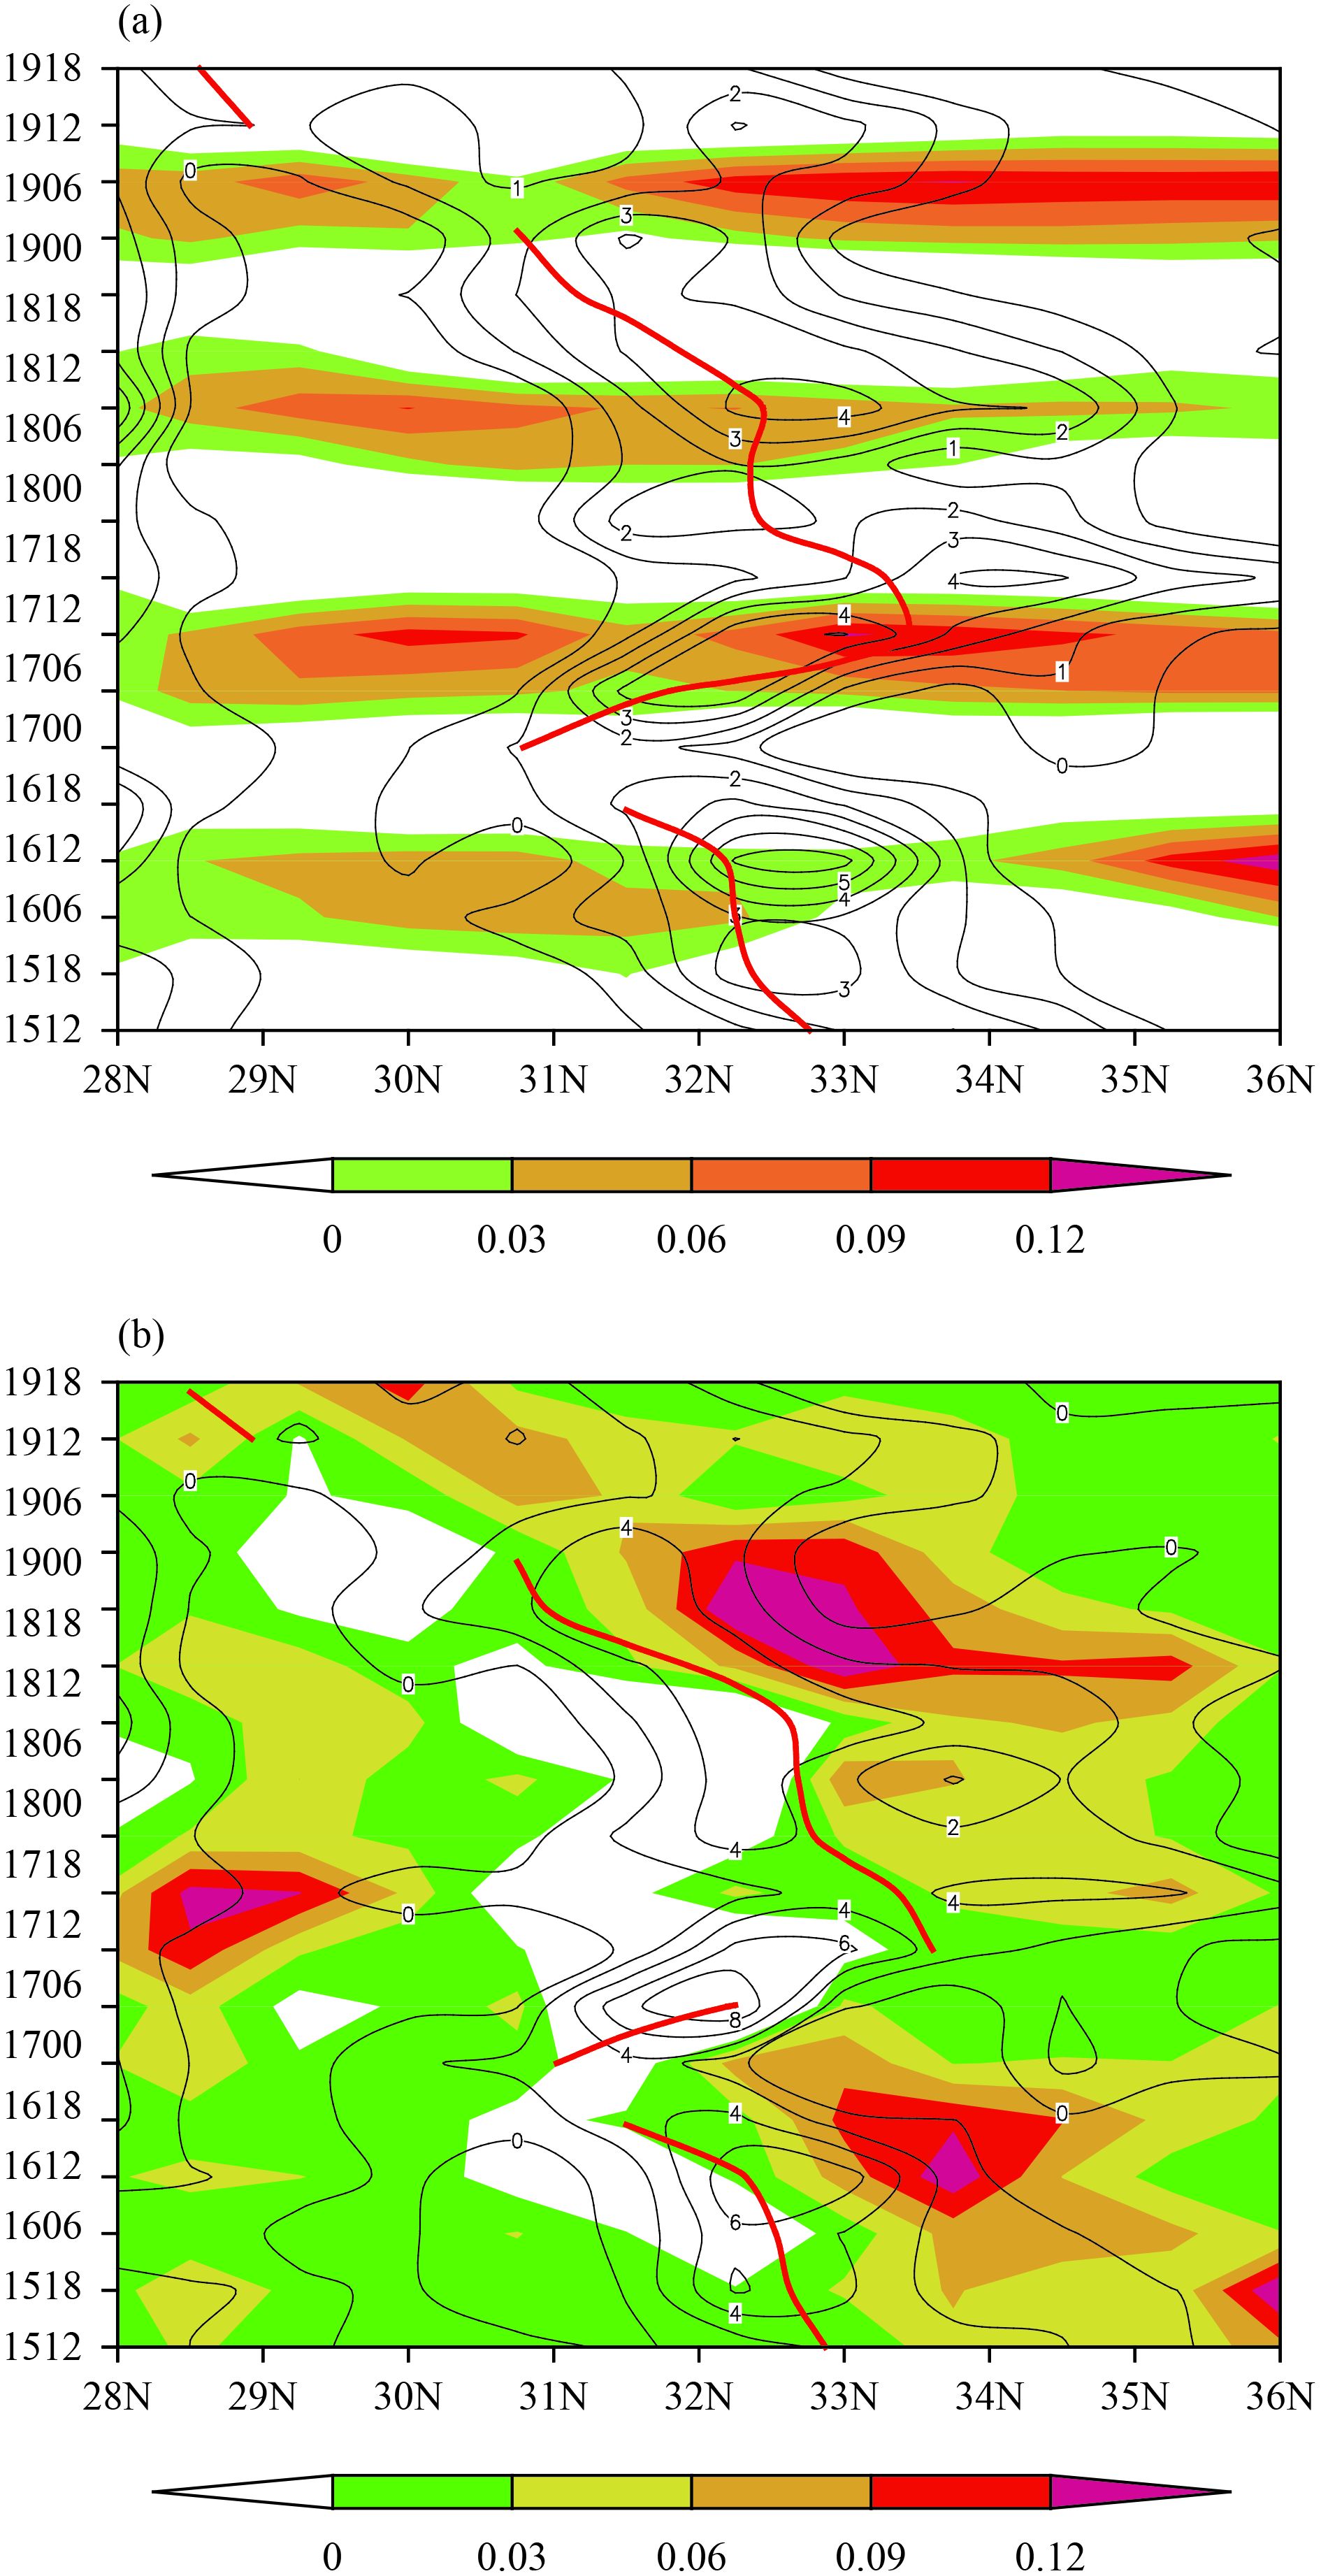
Equation (3) shows that the apparent heat source includes three terms, i.e., the local variation (Q1t), horizon-tal advection (Q1h), and vertical advection (Q1v). As indicated by the calculation results, the apparent heat source was dominated by Q1t and Q1h at 600 hPa, of which Q1t exhibited significant diurnal variation. Q1v on the south side of the TSL at 550 hPa was large, and there was some difference between the values of Q1t and Q1h. Above 500 hPa, the apparent heat source was primarily dominated by Q1v, while the impacts of Q1t and Q1h were relatively small. As can be seen in the vertical section along 90°E (figure omitted), the local variation term was characterized by obvious diurnal variation. From 1200–1800 UTC, diabatic cooling occurred in most of the layers near the TSL; at 0000 UTC, diabatic heating occurred in the layers below 500–550 hPa; and at 0600 UTC, within the height of the TSL, most of the layers were dominated by diabatic heating. The local variation term had a large impact on the maximum positive vorticity value near the TSL and on the height of the TSL, which further validated the diurnal variation characteristics of the TSL height. Figure 13a shows temporal evolution of the local variation in diabatic heating, the vorticity, and the TSL at 600 hPa. Q1t was positive during the day, and the vorticity near the TSL reached its maximum around 1200 UTC (see also Fig. 10b). The stretching height of the TSL increased from 1200 to 1800 UTC, and Q1t at 600 hPa was consistent with the stretching height of the TSL. As indicated by the calculation results for the horizontal advection term at 90°E (figure omitted), in most cases, diabatic heating occurred in the northern area below 500 hPa, while the southern part was dominated by diabatic cooling or weak diabatic heating. This indicates that Q1 was distributed non-uniformly in the north–south direction near the TSL, and calculation results of the diabatic heating term in the complete form vertical vorticity equation also revealed that the vorticity near the TSL decreased, causing the TSL to move southward toward the positive vorticity axis. At 1800 UTC 16 August, the TSL was raised to above 500 hPa, most areas near 600 hPa were affected by diabatic heating, and the diabatic heating in the south was slightly more obvious, and thus, the TSL moved northward. Figure 13b shows temporal evolution of the horizontal advection term, the vorticity, and the TSL at 550 hPa, revealing that Q1h of the surface layer played a major role in the movement of the TSL. In Fig. 13b, Q1h on the north side of the TSL was positive, and the change in Q1 was positive. This indicates that Q1 was non-uniformly distributed in the north–south direction and
|
| Figure 13 Time–latitude cross-sections along 90°E of (a) local variation (K s–1) of the diabatic heating at 600 hPa and (b) horizontal advection (K s–1) of the diabatic heating at 550 hPa. Shadings denote vorticity. The thick red line denotes the TSL and the y-coordinate is the date, e.g., 1512 denotes 1200 UTC 15 August. |
In this study, the ERA-Interim data on a 0.75° × 0.75° horizontal resolution and available 4 times a day, were used to analyze the structural and evolutionary characteristics of a Tibetan Plateau horizontal shear line (i.e., a TSL) from 1200 UTC 15 to 1800 UTC 19 August 2015. By analyzing the variation in the TSL’s vorticity, which is affected by diabatic heating, the evolutionary characteristics of the TSL were explored. The following conclusions are derived.
(1) The TSL was generated near the axis of the positive vorticity zone, the zone with low wind speed, and on the northern side of the South Asian high at the high levels. There was warm and humid air with a small gradient in temperature on the southern side of the TSL, while there was dry and cold air with a large gradient in dew point temperaute on the northern side. When viewed on the vertical section, the TSL was a shallow system with baroclinicity. The TSL below 600 hPa was dominated by weak descending motion, while at all other heights, it was dominated by weak ascending motion.
(2) The structure and morphological evolution of the TSL were characterized by diurnal variations. At 0000 UTC, the height of the TSL was at its minimum, and at 1800 UTC, it reached its highest. From 0000 to 0600 UTC, the TSL was likely to veer clockwise, while from 1200 to 1800 UTC, it was prone to veer counterclockwise. The diurnal variations in the eastern and western parts of the TSL were slightly different, i.e., the western part of the TSL was likely to move southward and increase in height at night, while the eastern part of the TSL was prone to move northward and increase in height in the afternoon.
(3) Latitudinal fluctuations occurred during the period when the TSL was maintained and as the TSL merged (regenerated) and fractured (disappeared). The north–south activity range of the western part of the TSL was larger than that of the middle and eastern parts. In addition, the western part easily fractured or disappeared as it moved northward, while it was likely to regenerate or merge when it moved southward. When the north–south span of the TSL increased, the TSL was likely to fracture; and as the north–south span decreased, the TSL tended to remain complete. As the dew point temperature gradient on both sides of the TSL weakened or when an area of large winds approached, the TSL moved southward, fractured, or disappeared. When the positive vorticity center moved downward or was divided into two vorticity centers, the height of the TSL decreased, and it was fractured or disappeared.
(4) As indicated by our analysis of the apparent heat source, the height of the TSL increased when diabatic heating occurred in the lower layer of the TSL. When diabatic heating occurred in the middle layer, the TSL was easily fractured. When diabatic heating occurred in the high layer, the height of the TSL was prone to decrease, or the TSL in the lower layer would disappear. The local variation of the apparent heat source mainly affected the strength of the TSL in the lower layer. The horizontal advection of surface heating played a dominant role in the movement of the TSL in the lower layer while vertical advection of heating mainly influenced the strength of the TSL at 500 hPa and above.
In this study, a TSL that persisted for a long time was investigated. The structure and evolution of the TSL were analyzed, and a preliminary analysis of its evolution was performed from the perspective of the diabatic heating diagnosis. Some results were achieved, yet these results have not been verified in other cases; and thus, they might bear some limitations. It will be necessary to explore more cases in the future to obtain results of universal significance.
| Bai, L., W. X. Wang, Y. N. Yao, et al., 2013: Reliability of NCEP/NCAR and ERA-Interim reanalysis data on Tianshan mountainous area. Desert Oasis Meteor., 7, 51–56. DOI:10.3969/j.issn.1002-0799.2013.03.012 |
| Benjamin, S. G., 1986: Some effects of surface heating and topography on the regional severe storm environment. Part II: Two-dimensional idealized experiments. Mon. Wea. Rev., 114, 330–343. DOI:10.1175/1520-0493(1986)114<0330:SEOSHA>2.0.CO;2 |
| Chen, Z. M., G. B. He, and W. B. Min, 2006: Another expression of the complete form of vertical vorticity tendency equation. Scientia Meteor. Sinica, 26, 365–369. DOI:10.3969/j.issn.1009-0827.2006.04.002 |
| Demko, J. C., and B. Geerts, 2010a: A numerical study of the evolving convective boundary layer and orographic circulation around the Santa Catalina mountains in Arizona. Part I: Circulation without deep convection. Mon. Wea. Rev., 138, 1902–1922. DOI:10.1175/2009MWR3098.1 |
| Demko, J. C., and B. Geerts, 2010b: A numerical study of the evolving convective boundary layer and orographic circulation around the Santa Catalina mountains in Arizona. Part II: Interaction with deep convection. Mon. Wea. Rev., 138, 3603–3622. DOI:10.1175/2010MWR3318.1 |
| He, G. B., 2013: Review of the plateau shear-line studies. Plateau Mt. Meteor. Res., 33, 90–96. DOI:10.3969/j.issn.1674-2184.2013.01.016 |
| He, G. B., and R. Shi, 2011: Studies on dynamic and thermal characteristics of different shear lines over the Tibetan Plateau in summer. Plateau Meteor., 30, 568–575. |
| He, G. B., W. L. Gao, and N. N. Tu, 2009: Observational analysis of shear lines and low vortexes over the Tibetan Plateau in summer from 2000 to 2007. Plateau Meteor., 28, 549–555. |
| Kuo, Y. H., L. S. Cheng, and R. A. Anthes, 1986: Mesoscale analyses of the Sichuan flood catastrophe, 11–15 July 1981. Mon. Wea. Rev., 114, 1984–2003. DOI:10.1175/1520-0493(1986)114<1984:MAOTSF>2.0.CO;2 |
| Li, G. P., 2007: Dynamic Meteorology of the Tibetan Plateau. China Meteorological Press, Beijing, 26 pp. (in Chinese) |
| Li, Y. L., 1978: Analysis of cloud picture for weather over the Tibetan Plateau. Meteor. Mon.(4), 10–12. |
| Liu, F. M., and P. S. Pan, 1987: A study on the southward-moving shear lines with quasi E–W orientation over the Qinghai–Xizang Plateau. Plateau Meteor., 6, 56–64. |
| Luo, H. B., and M. Yanai, 1983: The large-scale circulation and heat sources over the Tibetan Plateau and surrounding areas during the early summer of 1979. Part I: Precipitation and kinematic analyses. Mon. Wea. Rev., 111, 922–944. DOI:10.1175/1520-0493(1983)111<0922:TLSCAH>2.0.CO;2 |
| Luo, H. B., and M. Yanai, 1984: The large-scale circulation and heat sources over the Tibetan Plateau and surrounding areas during the early summer of 1979. Part II: Heat and moisture budgets. Mon. Wea. Rev., 112, 966–989. DOI:10.1175/1520-0493(1984)112<0966:TLSCAH>2.0.CO;2 |
| Luo, S. W., 1963: Analysis of the formation of shear lines on the east side of the Qinghai–Xizang Plateau in winter. Acta Meteor. Sinica, 33, 305–319. DOI:10.11676/qxxb1963.029 |
| Ma, L., Q. M. Zhang, C. N. Zhao, et al., 2003: Formation and forecast of spring snow-related disasterous weather in the eastern pasture area of the Qinghai–Xizang Plateau. J. Nat. Disast., 12, 61–68. DOI:10.3969/j.issn.1004-4574.2003.03.010 |
| Qiao, Q. M., and H. Q. Tan, 1984: The structure of a 500-mb shear line and large-scale circulation over the Qingzang Plateau in summer. Plateau Meteor., 3, 50–57. |
| Qinghai–Tibetan Plateau (QTP) Meteorological Research Collaborative Group, 1981: Vortexes and Shear Lines at 500 hPa over the Qinghai–Tibetan Plateau in Summer. Science Press, Beijing, 1–122. (in Chinese) |
| Shi, R., and G. B. He, 2011: Contrast analysis on background circulation of plateau shear lines moving out and not moving out of the Tibetan Plateau. Plateau Meteor., 30, 1453–1461. |
| Tao, S. Y., S. W. Luo, and H. C. Zhang, 1984: The meteorological science experiment and observation system over the Tibetan Plateau from May to August in 1979. Meteor. Mon.(7), 2–5. |
| Wang, W., and L. S. Cheng, 2000: Numerical study of conditional symmetric instability of the " 96.1” snowstorm. Plateau Meteor., 19, 129–140. DOI:10.3321/j.issn:1000-0534.2000.02.001 |
| Wang, W., and L. S. Cheng, 2002: Numerical study on three-dimensional conditionally symmetric instability of the " 96.1” snowstorm. Plateau Meteor., 21, 225–232. DOI:10.3321/j.issn:1000-0534.2002.03.001 |
| Wu, G. X., and H. Z. Liu, 1999: Complete form of vertical vorticity tendency equation and slantwise vorticity development. Acta Meteor. Sinica, 57, 1–15. DOI:10.11676/qxxb1999.001 |
| Xie, X., J. H. He, and L. Qi, 2011: A review on applicability evaluation of four reanalysis datasets in China. J. Meteor. Environ., 27, 58–65. DOI:10.3969/j.issn.1673-503X.2011.05.011 |
| Xu, G. C., and Z. Y. Zhang, 1983: The effect of Qinghai–Xizang Plateau on the formation of dry climate over Northwest China. Plateau Meteor., 2, 9–16. |
| Xu, J. F., J. H. Tao, and J. P. Xia, 2000: A meso-scale analysis of a Qinghai–Xizang Plateau snowstorm and its vorticity source study. Plateau Meteor., 19, 187–197. DOI:10.3321/j.issn:1000-0534.2000.02.008 |
| Xu, X. D., T. L. Zhao, C. G. Lu, et al., 2014: Characteristics of the water cycle in the atmosphere over the Tibetan Plateau. Acta Meteor. Sinica, 72, 1079–1095. DOI:10.11676/qxxb2014.091 |
| Xue, Z., 1980: A case study of a shear line producing heavy rainfall on the Qinghai–Xizang Plateau. Acta Meteor. Sinica, 38, 142–149. DOI:10.11676/qxxb1980.017 |
| Yamada, H., 2008: Numerical simulations of the role of land surface conditions in the evolution and structure of summertime thunderstorms over a flat highland. Mon. Wea. Rev., 136, 173–188. DOI:10.1175/2007MWR2053.1 |
| Yanai, M., and C. F. Li, 1994: Mechanism of heating and the boundary layer over the Tibetan Plateau. Mon. Wea. Rev., 122, 305–323. DOI:10.1175/1520-0493(1994)122<0305:MOHATB>2.0.CO;2 |
| Yang, K., X. F. Kun, J. He, et al., 2011: On the climatology and trend of the atmospheric heat source over the Tibetan Plateau: An experiments-supported revisit. J. Climate, 24, 1525–1541. DOI:10.1175/2010JCLI3848.1 |
| Yao, X. P., and J. Y. Sun, 2013: Thermodynamics analysis of the impact of disturbances in the easterlies on the short-term east–west shift of the western Pacific subtropical high. J. Trop. Meteor., 29, 551–558. DOI:10.3969/j.issn.1004-4965.2013.04.003 |
| Yao, X. P., J. Y. Sun, L. Kang, et al., 2014: Advances on research of shear/convergence lines over the Qinghai–Xizang Plateau. Plateau Meteor., 33, 294–300. |
| Ye, D. Z., 1981: Some characteristics of the summer circulation over the Qinghai–Xizang (Tibet) Plateau and its neighborhood. Bull. Amer. Meteor. Soc., 62, 14–19. DOI:10.1175/1520-0477(1981)062<0014:SCOTSC>2.0.CO;2 |
| Ye, D. Z., and J. Q. Zhang, 1974: A preliminary experimental simulation on the heating effect of the Tibetan Plateau on the general circulation over East Asia in summer. Sci. China A(3), 301–320. |
| Ye, D. Z., S. W. Luo, and B. Z. Zhu, 1957: The wind structure and heat balance in the lower troposphere over Tibetan Plateau and its surrounding. Acta Meteor. Sinica, 28, 108–121. DOI:10.11676/qxxb1957.010 |
| Ye, D. Z., S. Y. Tao, and M. C. Li, 1958: The abrupt change of circulation over Northern Hemisphere during June and October. Acta Meteor. Sinica, 29, 249–263. |
| Ye, D. Z., Y. X. Gao, and Q. Chen, 1977: On some features of the summer atmospheric circulation over the Tsinghai–Tibetan Plateau and its neighbourhood. Chinese J. Atmos. Sci., 1, 289–299. DOI:10.3878/j.issn.1006-9895.1977.04.06 |
| Yi, D. S., 1979: On the local diabatic frontogenesis in the central part of Qingzang Gaoyuan. Acta Meteor. Sinica, 37, 16–25. DOI:10.11676/qxxb1979.035 |
| Yu, S. H., and W. L. Gao, 2010: Comparison on structure characteristics of two Tibetan Plateau vortexes in summer 1998. Plateau Meteor., 29, 1357–1368. |
| Yu, S. H., W. L. Gao, and J. Peng, 2013: Statistical analysis of shear line activity in QXP and its influence on rainfall in China in recent 13 years. Plateau Meteor., 32, 1527–1537. |
| Yu, S. H., W. L. Gao, J. Peng, et al., 2014: Observational facts of sustained departure plateau vortexes. J. Meteor. Res., 28, 296–307. DOI:10.1007/s13351-014-3023-9 |
| Zhang, S. L., and S. Y. Tao, 2002: The influences of Tibetan Plateau on weather anomalies over Changjiang River in 1998. Acta Meteor. Sinica, 60, 442–452. DOI:10.11676/qxxb2002.052 |
| Zhang, X., X. P. Yao, J. L. Ma, et al., 2016: Climatology of transverse shear lines related to heavy rainfall over the Tibetan Plateau during boreal summer. J. Meteor. Res., 30, 915–926. DOI:10.1007/s13351-016-6952-7 |
| Zhang, X. L., and L. S. Cheng, 2000: Dynamic diagnoses of the genesis and development for the mesoscale shear line during " 96.1” snowstorm. I: Diagnoses of vorticity and vorticity variability. Plateau Meteor., 19, 285–294. DOI:10.3321/j.issn:1000-0534.2000.03.003 |
| Zhao, T. B., and C. B. Fu, 2009: Applicability evaluation for several reanalysis datasets using the upper-air observations over China. Chinese J. Atmos. Sci., 33, 634–648. DOI:10.3878/j.issn.1006-9895.2009.03.19 |
| Zhou, B., H. M. Xu, Y. K. Tan, et al., 2001: Research on vertical section of shear vorticity and diabatic heating with Wuhan torrential rain in 1998. Acta Meteor. Sinica, 59, 707–718. DOI:10.11676/qxxb2001.074 |
 2018, Vol. 32


