The Chinese Meteorological Society
Article Information
- LIU, Xiantong, Qilin WAN, Hong WANG, et al., 2018.
- Raindrop Size Distribution Parameters Retrieved from Guangzhou S-band Polarimetric Radar Observations. 2018.
- J. Meteor. Res., 32(4): 571-583
- http://dx.doi.org/10.1007/s13351-018-7152-4
Article History
- Received November 16, 2017
- in final form April 20, 2018
2. Guangzhou Meteorological Observatory, Guangzhou 511430
Precipitation is the combined effect of microphysical–dynamical–thermodynamic processes in clouds and many other factors (Bruintjes, 1999). The raindrop size distribution (DSD) is a fundamental microphysical property of precipitation. The variations of DSDs are the main factors that cause radar QPE (quantitative precipitation estimation) errors (Liu et al., 2002). The relationships between radar echo and the microphysical parameters of hydrometeors, such as DSD, are important bases for constructing the radar observation operator for data assimilation (Jung et al., 2008, 2010; Bao et al., 2017). DSDs are directly related to hydrometeor condensations, coalescences, and evaporations, which are important parameters affecting microphysical processes in numerical prediction models (Zhang et al., 2006; Gao et al., 2011). Thus, it is very important to grasp the characteristics of DSDs.
An increasing number of studies (Ulbrich, 1983; Zhang et al., 2001; Bringi et al., 2002) have shown that a gamma (Γ) distribution function has three variables: intercept (N0), size distribution shape (μ), and slope (Λ), which can better describe the changes in DSD of various precipitations with high precision and applicability (Bruintjes, 1999; Kumjian and Ryzhkov, 2010) compared with M–P distribution (Marshall and Palmer, 1948). Although accurate information of DSDs can be obtained by ground distrometers, there are only a few stations where it can be observed, which makes it difficult to describe the space–time variation characteristics of DSDs for severe convection weather. Weather radars are important tools for monitoring and providing early warning of severe weather. Compared to ordinary Doppler radar, dual-polarization (dual-pol) weather radar transmits and receives vertically and horizontally polarized signals, and add several parameters [e.g., differential reflectivity (ZDR; dB), specific differential phase shift (KDP; ° km–1), and the correlation coefficient (CC)]. ZDR strongly depends on the shape of the scatters and is independent of the hydrometeor concentration (Berne and Krajewski, 2013). KDP depends on both the number concentration and shape of the hydrometeors (Berne and Krajewski, 2013). In fact, dual-pol radar only detects the backscattering signals of hydrometeors, which are related to parameters of the Γ DSD function in a complex and nonlinear way, so the DSD information cannot be directly obtained by such radar detection. Therefore, DSD information with a large area and high spatial–temporal resolution can be obtained only when DSDs observed at the ground stations and polarimetric radar detections are combined to establish the relationship between radar detection parameters and DSD parameters. The retrieval of DSD with polarimetric radar observations is a hot research issue internationally, especially the three parameters (N0, μ, and Λ) of the Γ DSD function (Zhang et al., 2001; Bringi et al., 2002; Gorgucci et al., 2002; Brandes et al., 2004a; Cao et al., 2008, 2010).
Currently, there are mainly two DSD retrieval methods based on polarimetric radar observations: the beta (β) method and the constrained-gamma (C-G) method. The β method was proposed by Gorgucci et al. (2002), which assumed that the axial ratio slope (β) is a variable that can be retrieved by the dual-pol radar observations. The variable β is retrieved by radar reflectivity (ZHH; dB), ZDR, and KDP to further obtain the parameters of the mean diameter (D0), μ, and normalized number concentration (NW) of precipitation particles so as to obtain DSD characteristics. Zhang et al. (2001) proposed the C-G method based on the relationship between μ and Λ of the Γ function (μ–Λ relationship) and the relationship between the particle axis ratio and particle diameter (r–D relationship) observed by the 2D-Video-Disdrometer (2DVD), which provides DSD. With the C-G method, N0, μ, and Λ of the Γ function for DSD can be retrieved through the observations of ZHH and ZDR as detected by dual-pol radar. Brandes et al. (2003) and Cao et al. (2010) improved the C-G method and further increased the accuracy of retrieving DSD.
Brandes et al. (2004b) compared the β method and the C-G method. The comparative results showed that although the β method used ZHH, ZDR, and KDP to retrieve the DSD, it was very sensitive to KDP noise. Generally, KDP experiences large errors, which leads to large errors in the retrieval results. In addition, KDP is obtained from accumulative measurements of multiple range bins, which is different from the independent measurements of ZHH and ZDR at each range bin. When the range is great, there is a significant mismatch (Zhang et al., 2001; Cao et al., 2008), which degrades the retrieval precision (Cao et al., 2008) resulting in the unreasonable results of the β method. In contrast, the retrieval results from the C-G method are stable and closer to the distrometer observation results of DSD than the β method. Overall, the C-G method has higher retrieval precision and a larger range of applications, so it is widely used for DSD retrieval by dual-pol radar (Brandes et al., 2004a; Vivekanandan et al., 2004; Zhang et al., 2006; Cao et al., 2008, 2010; Wang et al., 2016). However, there are few studies using the C-G method and dual-pol radar in China (Chang et al., 2009; Wang et al., 2016), especially in South China.
The μ–Λ relationship of DSD is the core of the C-G method. Obtaining the region’s representative μ–Λ relationship is the key to the DSD retrieval scheme based on the C-G method. Although good correlation relationships between μ and Λ were observed in different regions (Cao et al., 2008; Chen et al., 2013; Tang et al., 2014), the μ–Λ relationship changes depending on climatology and rain type (Zhang et al., 2003; Cao et al., 2008; Tang et al., 2014). A highly reliable and representative μ–Λ relationship can be obtained for the region only by using a high-precision distrometer to obtain a large number of observations of DSD. The 2DVD performs high-speed scanning with line arrays in two mutually perpendicular directions, which can effectively avoid errors in particle superposition (Zhu et al., 2013) and measure the characteristic parameters, such as particle shape, diameter, axial ratio, size distribution, and fall velocity (Kruger and Krajewski, 2002) with high resolution vertically and horizontally. Based on 2DVD, various foreign countries have carried out numerous observation tests and obtained typical microphysical characteristics, such as DSD, axial ratio, and final fall velocity of precipitation particles in different areas (Bringi et al., 2003; Schönhuber et al., 2007; Chang et al., 2009; Marzuki et al., 2013; Williams et al., 2014). Due to the high price of 2DVD, it is rarely used in Mainland China to observe microphysical characteristics of precipitation particles (Liu et al., 2013; Wen et al., 2016).
To improve the understanding of the dynamics and microphysical characteristics of precipitation during monsoon season in southern China, field campaigns of the SCMREX (Southern China Monsoon Rainfall Experiment) project were conducted in South China from 2013 to 2017 (Luo et al., 2017). For the first time, several 2DVDs were collocated to observe the precipitation microphysics in South China, and the μ–Λ relationship of DSD was observed by 2DVD in this region. Meanwhile, the Guangzhou S-band Doppler weather radar was upgraded to polarimetric radar in early 2016. All of the S-band Doppler radar (CINRAD/SA) in South China will be upgraded to polarimetric radar before 2020. Therefore, it is an urgent matter to establish the relationship between S-band polarimetric radar observations and raindrop size distribution parameters in South China. The purpose of this study is to construct a Γ function DSD parameters retrieval scheme based on polarimetric radar observations taking Guangzhou S-band polarimetric radar as an example.
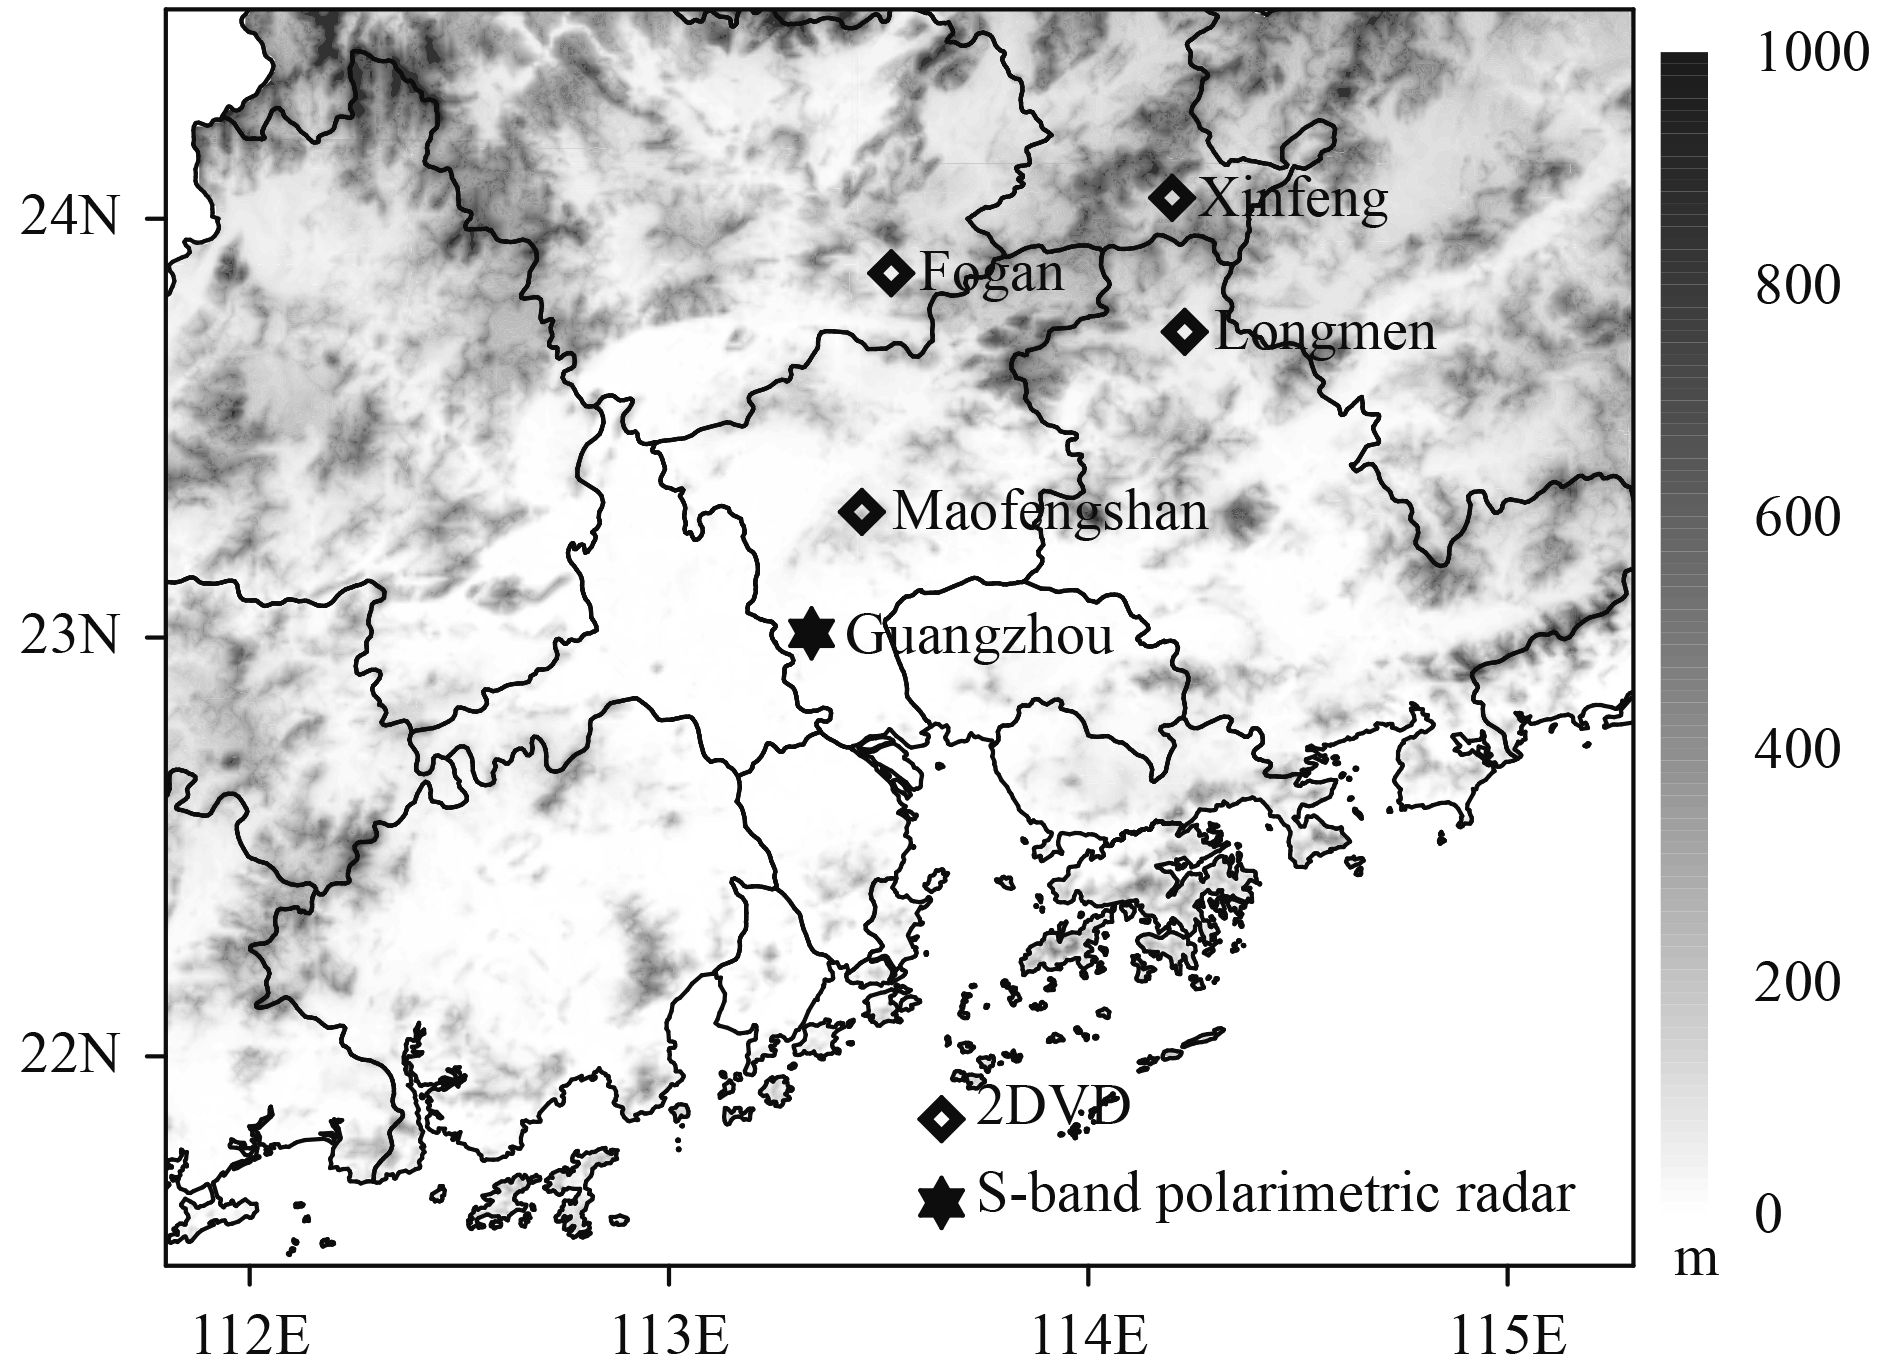
2 Data and methods 2.1 2DVD and datasetAimed at the needs of the development of area numerical prediction model, the Guangzhou Institute of Tropical and Marine Meteorology of China Meteorological Administration (CMA) and the Sate Key Laboratory of Severe Weather of the Chinese Academy of Meteorological Sciences (CAMS) have been jointly building the South China Cloud Physics and Heavy Rainfall Field Experiment Base since 2014. Based on the modern meteorological service observation network of Guangdong Province, the base has strengthened the local observation capabilities for clouds, precipitation, aerosol, and environmental fields (i.e., power, heat, and water vapor). The main station is located at Huizhou Lonmeng meteorological observation station (No. 59290). The 2DVDs are key instruments for precipitation characteristic observation at the base (Fig. 1). The 2DVDs used were the current third-generation version manufactured by Joanneum Research in Graz, Austria (details can be found at www.distrometer.at). The 2DVD performs high-speed scanning with light line arrays in two mutually perpendicular directions (55 kHz). The area of overlapping observation is about 10 × 10 cm2 and the vertical height difference between the two light beams is about 6 to 7 mm. Information regarding the precipitation amount, rain rate, DSD, raindrop fall velocity, and particle aspect ratio can be obtained by 2DVD, which contains horizontal and vertical resolutions of approximately 0.2 mm for raindrop observation (Schönhuber et al., 2007). In this study, the 2DVD observations are processed into 1-min resolution, and their quality are controlled using the method proposed by Tokay et al. (2013). For each 1 min of data from the 2DVD, if the total number of raindrop less than 10 or the rain rate less than 0.1 mm h–1, it is considered as noise and disregarded to ensure data quality (Wen et al., 2016).
|
| Figure 1 The geographical locations of 2DVDs and Guangzhou S-band polarimetric radar. Terrain is shaded (m). |
In this study, the DSD data collected by 2DVDs at Huizhou Longmen, Guangzhou Maofengshan, Shaoguan Xinfeng, and Qingyuan Fogang stations were used. The straight-line distance between Longmen Station and the Guangzhou dual-pol radar is about 124 km. The 2DVD at Longmen Station has been continuously observing since May 2016, and a large number of raindrop observations have been collected, which are mainly used for the statistics of the μ–Λ relationship of this region. Maofengshan Station is about 35 km away from the Guangzhou radar. The 2DVD at Maofengshan Station has been continuously observing since April 2017, and the observation data have mainly been used to test the accuracy of DSD parameters that were retrieved from Guangzhou dual-pol radar observations.
2.2 Raindrop size distributionThe three-parameter Γ function reflects the characteristics of DSD well, and its size distribution function is expressed as
| $N(D) = {N_0}{D^\mu }\exp (- \varLambda D), $ | (1) |
where N0 (mm–1–μ m–3) is the intercept, μ is the size distribution shape, and Λ (mm–1) is the slope. The curve is sunken when μ > 0 and is raised when μ < 0. When μ = 0, it degenerates into an exponential distribution, namely M–P distribution.
When DSD [N(D)] is given, the radar reflectivity factor (Z; dBZ), rain rate (R; mm h–1), rainwater content (W; g m–3), and total raindrop number concentration (Nt; m–3) can be calculated by the following equations
| $Z = \sum\limits_{i = 1}^L {D_i^6} N({D_i})\Delta {D_i}, \qquad $ | (2) |
| $R = \frac{{6\pi }}{{{{10}^4}}}\sum\limits_{i = 1}^L {D_i^3} {V_i}N({D_i})\Delta {D_i}, $ | (3) |
| $W = \frac{\pi }{{6000}}\sum\limits_{i = 1}^L {D_i^3} N({D_i})\Delta {D_i},\,\,\, $ | (4) |
| ${N_t} = \sum\limits_{i = 1}^L {N({D_i})\Delta {D_i}}, \qquad\qquad $ | (5) |
where L is the total number of particle size bins, Di (mm) is the equivalent spherical raindrop diameter of the i-th size bin, ΔDi (mm) is the corresponding diameter interval (mm), and Vi (m s–1) is the fall speed for the velocity bin i. The quality control method as used by Tokay et al. (2013) and Wen et al. (2016) is used to process the 2DVD observations. The equivalent-volume diameters are sorted into size categories of 0.2 mm, the range for particle size is 0.1–8.1 mm (41 bins). The fall velocity of each bin is then obtained by averaging measured particle velocities within that size bin.
For the Γ DSD model, the three parameters can be solved by using the order moment method. The nth order moment of the DSDs is expressed as
| ${M_n} = \int_0^{{D_{\max }}} {{D^n}N(D){\rm d}D} .$ | (6) |
Cao and Zhang (2009) compared the errors in solving the three parameters (N0, μ, and Λ) of the Γ function with different order moments. The results show that the errors are smaller when using 2nd, 3rd, and 4th order moments to solve the three parameters. In this study, the three parameters of the Γ function are solved with 2nd, 3rd, and 4th order moments as below
| $\mu = \frac{{3{M_4}{M_2} - 4M_3^2}}{{M_3^2 - {M_4}{M_2}}}, $ | (7) |
| $\varLambda = \frac{{{M_3}}}{{{M_4}}}(4 + \mu),\qquad $ | (8) |
| ${N_0} = \frac{{{M_2}{\varLambda ^{(\mu + 3)}}}}{{\Gamma (\mu + 3)}}.$ | (9) |
Meanwhile, the mean mass diameter (Dm; mm) is computed as the ratio of the 4th to 3rd moments of the size distribution,
| ${D_{\rm m}} = \frac{{{M_4}}}{{{M_3}}}.$ | (10) |
The intercept parameter (Nw; mm–1 m–3) after standardization is calculated as
| ${N_{\rm w}} = \frac{{{4^4}}}{{\pi {\rho _{\rm w}}}}\left(\frac{{{{10}^3}W}}{{D_{\rm m}^4}}\right), $ | (11) |
where ρw is the density of water (1 g cm–3).
2.3 Guangzhou S-band polarimetric radar and polarimetric radar parametersThe Guangzhou S-band weather radar is located at Dazhengangshan, Panyu District, Guangzhou, and its antenna is 179 m above sea level. The Guangdong Meteorological Service upgraded the China New Generation Weather Radar/SA (CINRAD/SA) to polarimetric radar in March 2016. The upgraded S-band polarimetric radar can detect the parameters of ZDR, differential phase (ΦDP; °), KDP, and CC, with range resolution increasing from 1000 to 250 m, which can obtain more detailed information of precipitation. The main performance indices of the upgraded radar are shown in Table 1.
| No. | Item | Parameter | No. | Item | Parameter | |
| Antenna system | Receiver | |||||
| 1 | Antenna type | Center feed and solid surface | 12 | Minimum detectable power | ≤ –109 dBm (1.57 μs)
≤ –114 dBm (4.5 μs) |
|
| 2 | Diameter | Rotating paraboloid and 8.5 m | ||||
| 3 | Beam width | ≤ 1° (3 dB) | 13 | Noise factor | ≤ 4 dB | |
| 4 | Antenna gain | ≥ 44 dB | 14 | Dynamic range | ≥ 85 dB | |
| 5 | Antenna directivity | Horizontal/vertical polarized wave
velocity principal axis deviation < 0.1 ° |
15 | Range resolution | 250 –1000 m | |
| 6 | Double channel isolation | ≥ 30 dB | Detection parameters and precision | |||
| Transmitter | 16 | Radar reflectivity ZHH | 1 dB | |||
| 7 | Operating frequency | 2885 MHz | 17 | Radial velocity (Vr)/
spectral width (Sw) |
1 m s–1 | |
| 8 | Peak power | ≥ 650 kW | 18 | Differential reflectivity
(ZDR) |
0.2 dB | |
| 9 | Pulse width | 1.57 and 4.7 μs | 19 | Specific differential
phase (ΦDP) |
2° | |
| 10 | Pulse repetition frequency | 322–1304 Hz | 20 | Specific differential phase
shift (KDP) |
0.2° km–1 | |
| 11 | Polarization | Dual-pol/double-emission
and double-receiving |
21 | Correlation coefficient (CC) | 0.01 |
ZHH and ZDR detected by polarimetric radar can better characterize DSD variability and estimate precipitation. The relationship between ZHH and N (D) is
| ${Z_{\rm {HH}}} = \frac{{4{\lambda ^4}}}{{{\pi ^4}{{\left| {{K_{\rm w}}} \right|}^2}}}\int_{{D_{\min }}}^{{D_{\max }}} {{{\left| {{f_{\rm {HH}}}(D)} \right|}^2}} N(D){\rm d}D, $ | (12) |
where λ is the radar wavelength, Kw is the dielectric constant of water, and fHH(D) is the backscattering amplitudes of a raindrop at horizontal or vertical polarization.
ZDR is the difference between horizontal and vertical radar reflectivity factors, which is expressed as
| ${Z_{\rm {DR}}} = 10 \cdot {\lg}\left(\frac{{{Z_{\rm {HH}}}}}{{{Z_{\rm {VV}}}}}\right).$ | (13) |
The observations of 2DVDs are used to calculate ZHH and ZDR based on the S-band polarimetric radar simulator developed by Wang et al. (2016), and compared with time–space matching Guangzhou S-band polarimetric radar observations. The relationship between the particle axial ratio and the particle diameter (r–D relationship) in the simulator is given by Zhang (2016). As
| $\begin{split} & r = 0.9951 + 0.02510D - 0.03644{D^2} \\ & \qquad + 0.005303{D^3} - 0.0002492{D^4}. \end{split} $ | (14) |
When the rain rate is calculated based on the DSD retrieval results from polarimetric radar, the final fall velocity of raindrops proposed by Brandes et al. (2002) is used as the raindrop fall velocity (Vt; m s–1), which is
| $\begin{split}& {V_t} = - 0.1021 + 4.932D - 0.9551{D^2} \\& \qquad + 0.07934{D^3} - 0.002362{D^4}.\end{split}$ | (15) |
Observation results show that the three parameters (N0, μ, and Λ) of the Γ DSD function are not mutually independent. Based on the observation results of the 2DVD in Florida, Zhang et al. (2001) found a good positive correlation between μ and Λ. Further studies (Zhang et al., 2003; Brandes et al., 2004a) indicate that the μ–Λ relationships are not observation errors, but reflect the intrinsic relationships between DSD parameters. The μ–Λ relationship is very important, and it reduces the Γ distribution function from 3 independent parameters to 2. Chen et al. (2013), Tang et al. (2014), and Jin et al. (2015) also found that there are good correlations between μ and Λ in different regions of China. The μ–Λ relationship changes depending on climatology, geographical location, and rain type. Therefore, high-precision and large-sample DSD observations are required to obtain a suitable μ–Λ relationship for the local area.
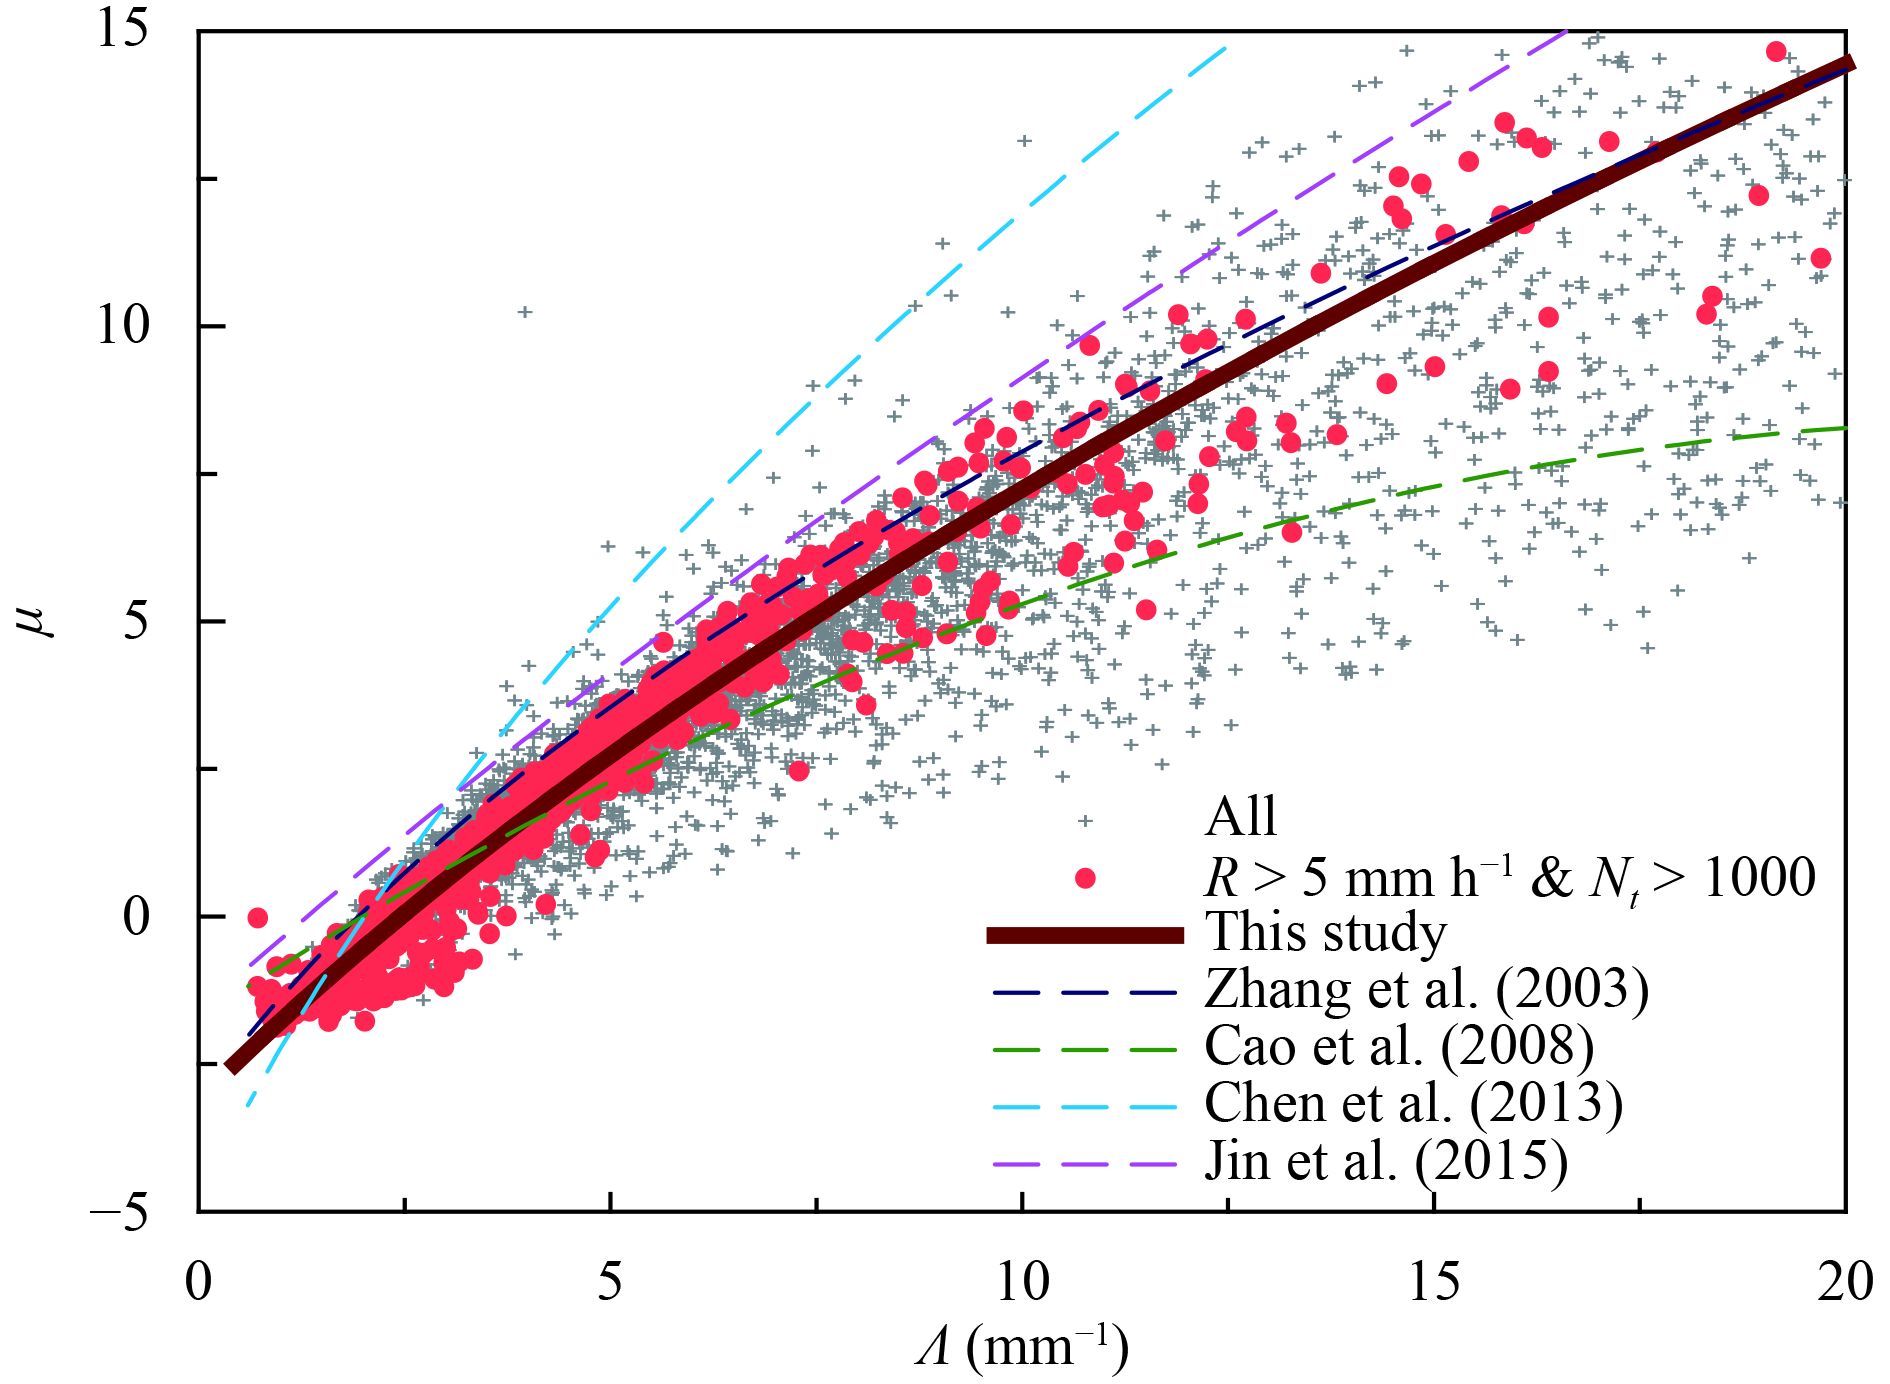
There were 6966 samples observed by the 2DVD at Huizhou Longmen Station from May to September 2016. The gray crosses in Fig. 2 show a scatterplot between μ and Λ. To minimize the error due to sampling effects, a data-filtering method proposed by Zhang et al. (2003) (R > 5 mm h –1 and Nt > 1000) was adopted. The light red dots in Fig. 2 show the 2048 filtered samples. The results show that the dispersion of filtered data is significantly smaller than unfiltered data. As shown in Fig. 2, there is a good positive correlation between μ and Λ. The μ–Λ relationship obtained here using polynomial least-squares fit is given by
| $\varLambda = 0.0241{\mu ^2} + 0.867\mu + 2.453.$ | (16) |
|
| Figure 2 A scatterplot of μ–Λwith DSD sorting. The gray crosses indicate unfiltered samples, light red dots indicate filtered samples; heavy dark red lines indicate fitted curves of filtered samples. In addition, the μ–Λ relationships from Zhang et al. (2003), Cao et al. (2008), Chen et al. (2013), and Jin et al. (2015) are provided, respectively. |
The observation results of Zhang et al. (2003) in Florida, Cao et al. (2008) in Oklahoma, Chen et al. (2013) in Nanjing, and Jin et al. (2015) in Chuzhou are also shown in Fig. 2. The relation in this study is closer to the Florida relation (2003). For a given Λ value, our fit has smaller μ value than the Florida relation.
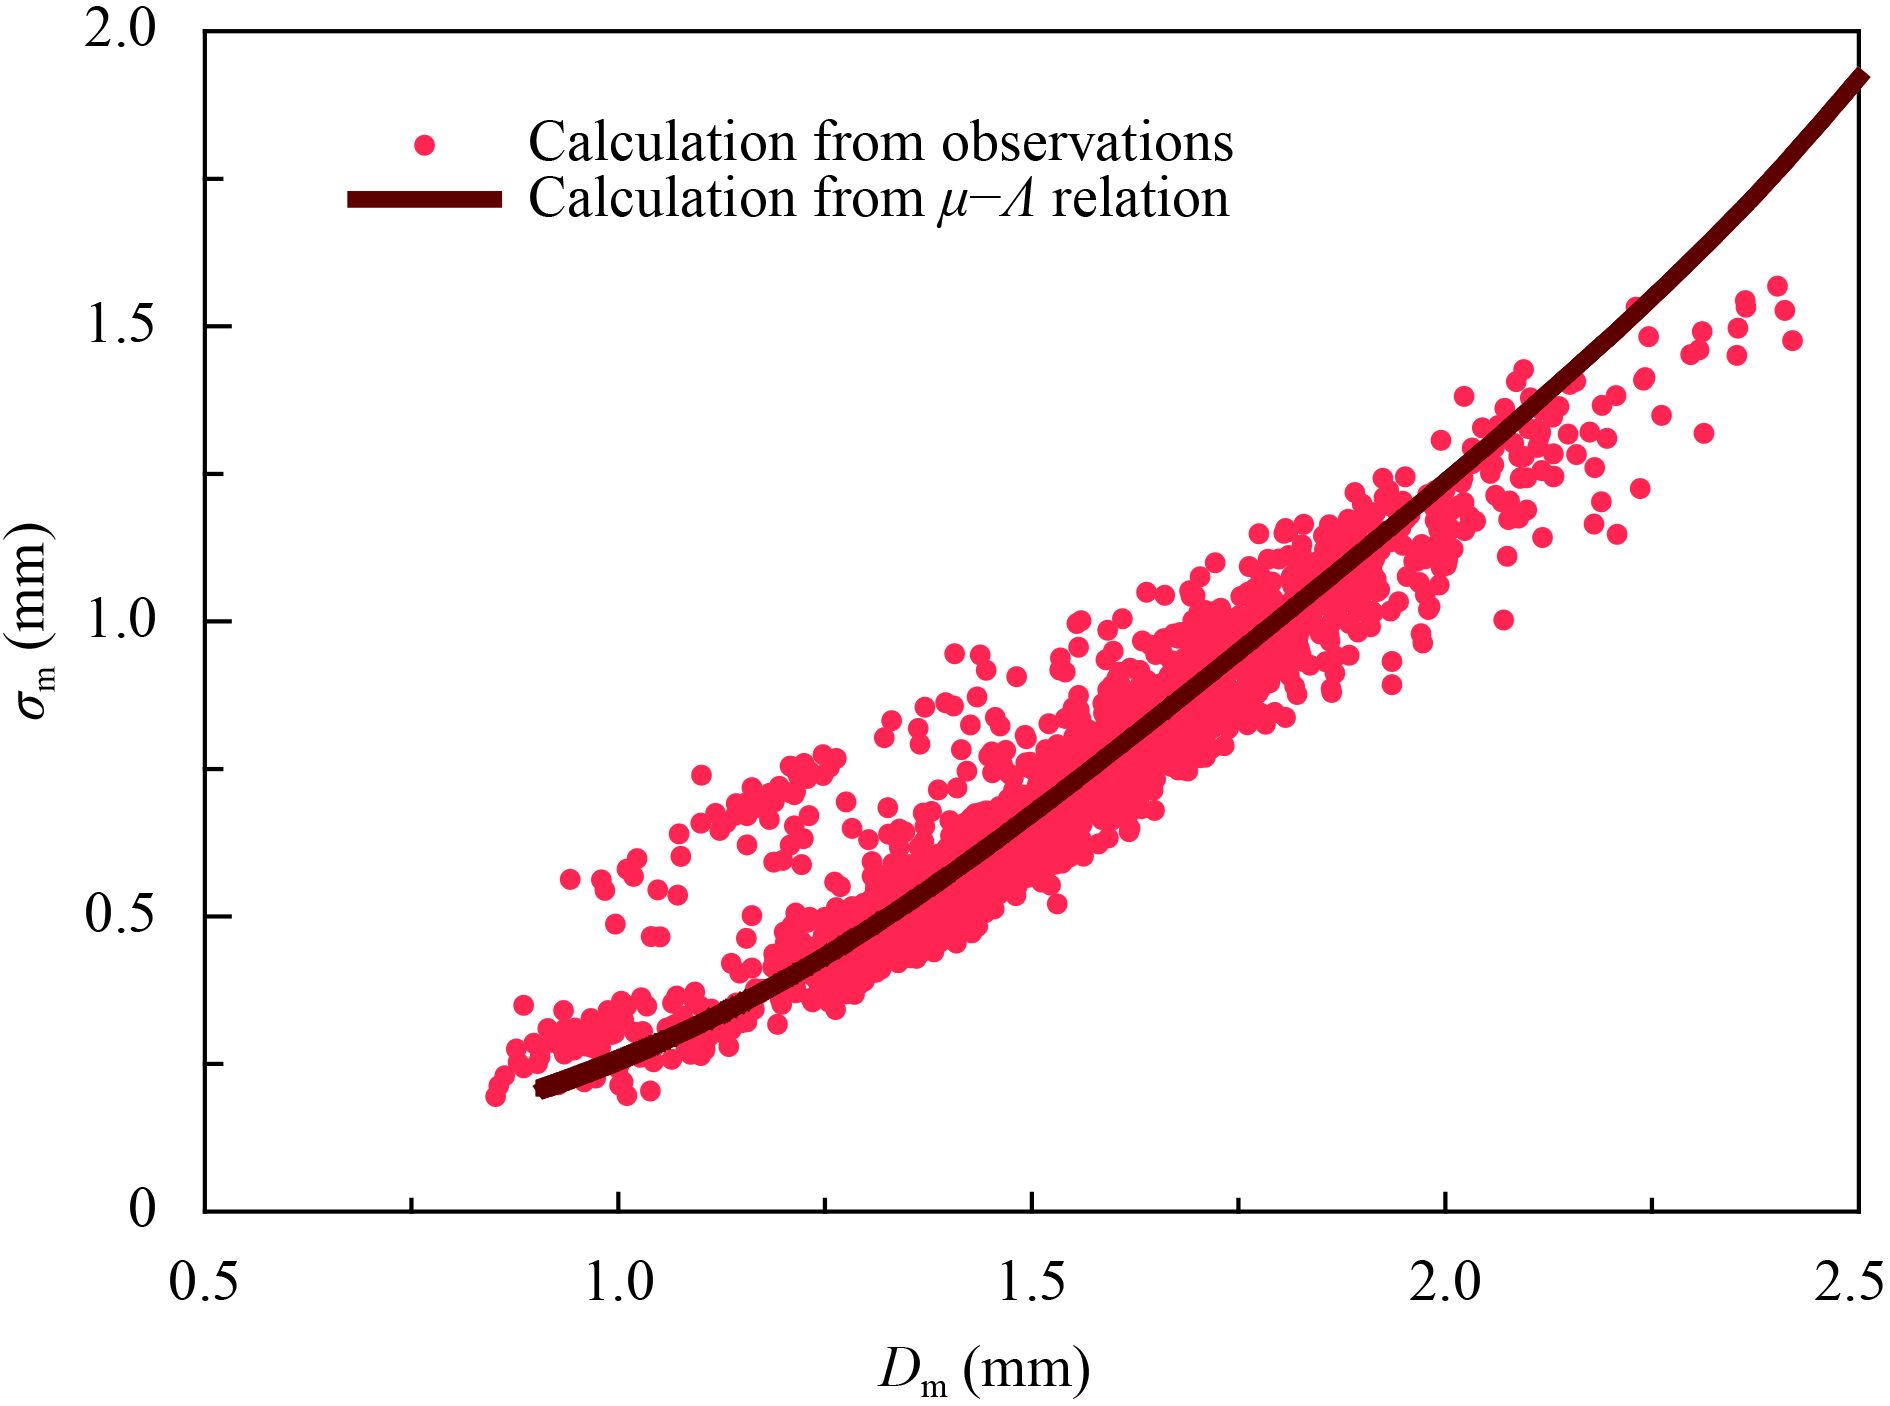
As both Dm and standard deviation of the mass-weighted diameter distribution (σm) can be directly derived from observations and are independent of sorting and fitting procedures, Dm and σm are examined to verify the refined μ–Λ relationship given by Eq. (16). If Eq. (16) represents rain physics, the Dm–σm relation derived from observations should be consistent with the relation derived from Eq. (16). As shown in Fig. 3, the solid line derived from Eq. (16) agrees with the scatterplot of Dm–σm calculated from 2DVD DSD observations.
|
| Figure 3 A scatterplot of Dm–σm. The light red dots denote the calculation of Dm and σm from 2DVD observation of DSDs of filtered samples. The heavy dark red line denotes the calculation of Dm and σm from gamma DSDs with μ–Λ relation constrained by Eq. (16). |
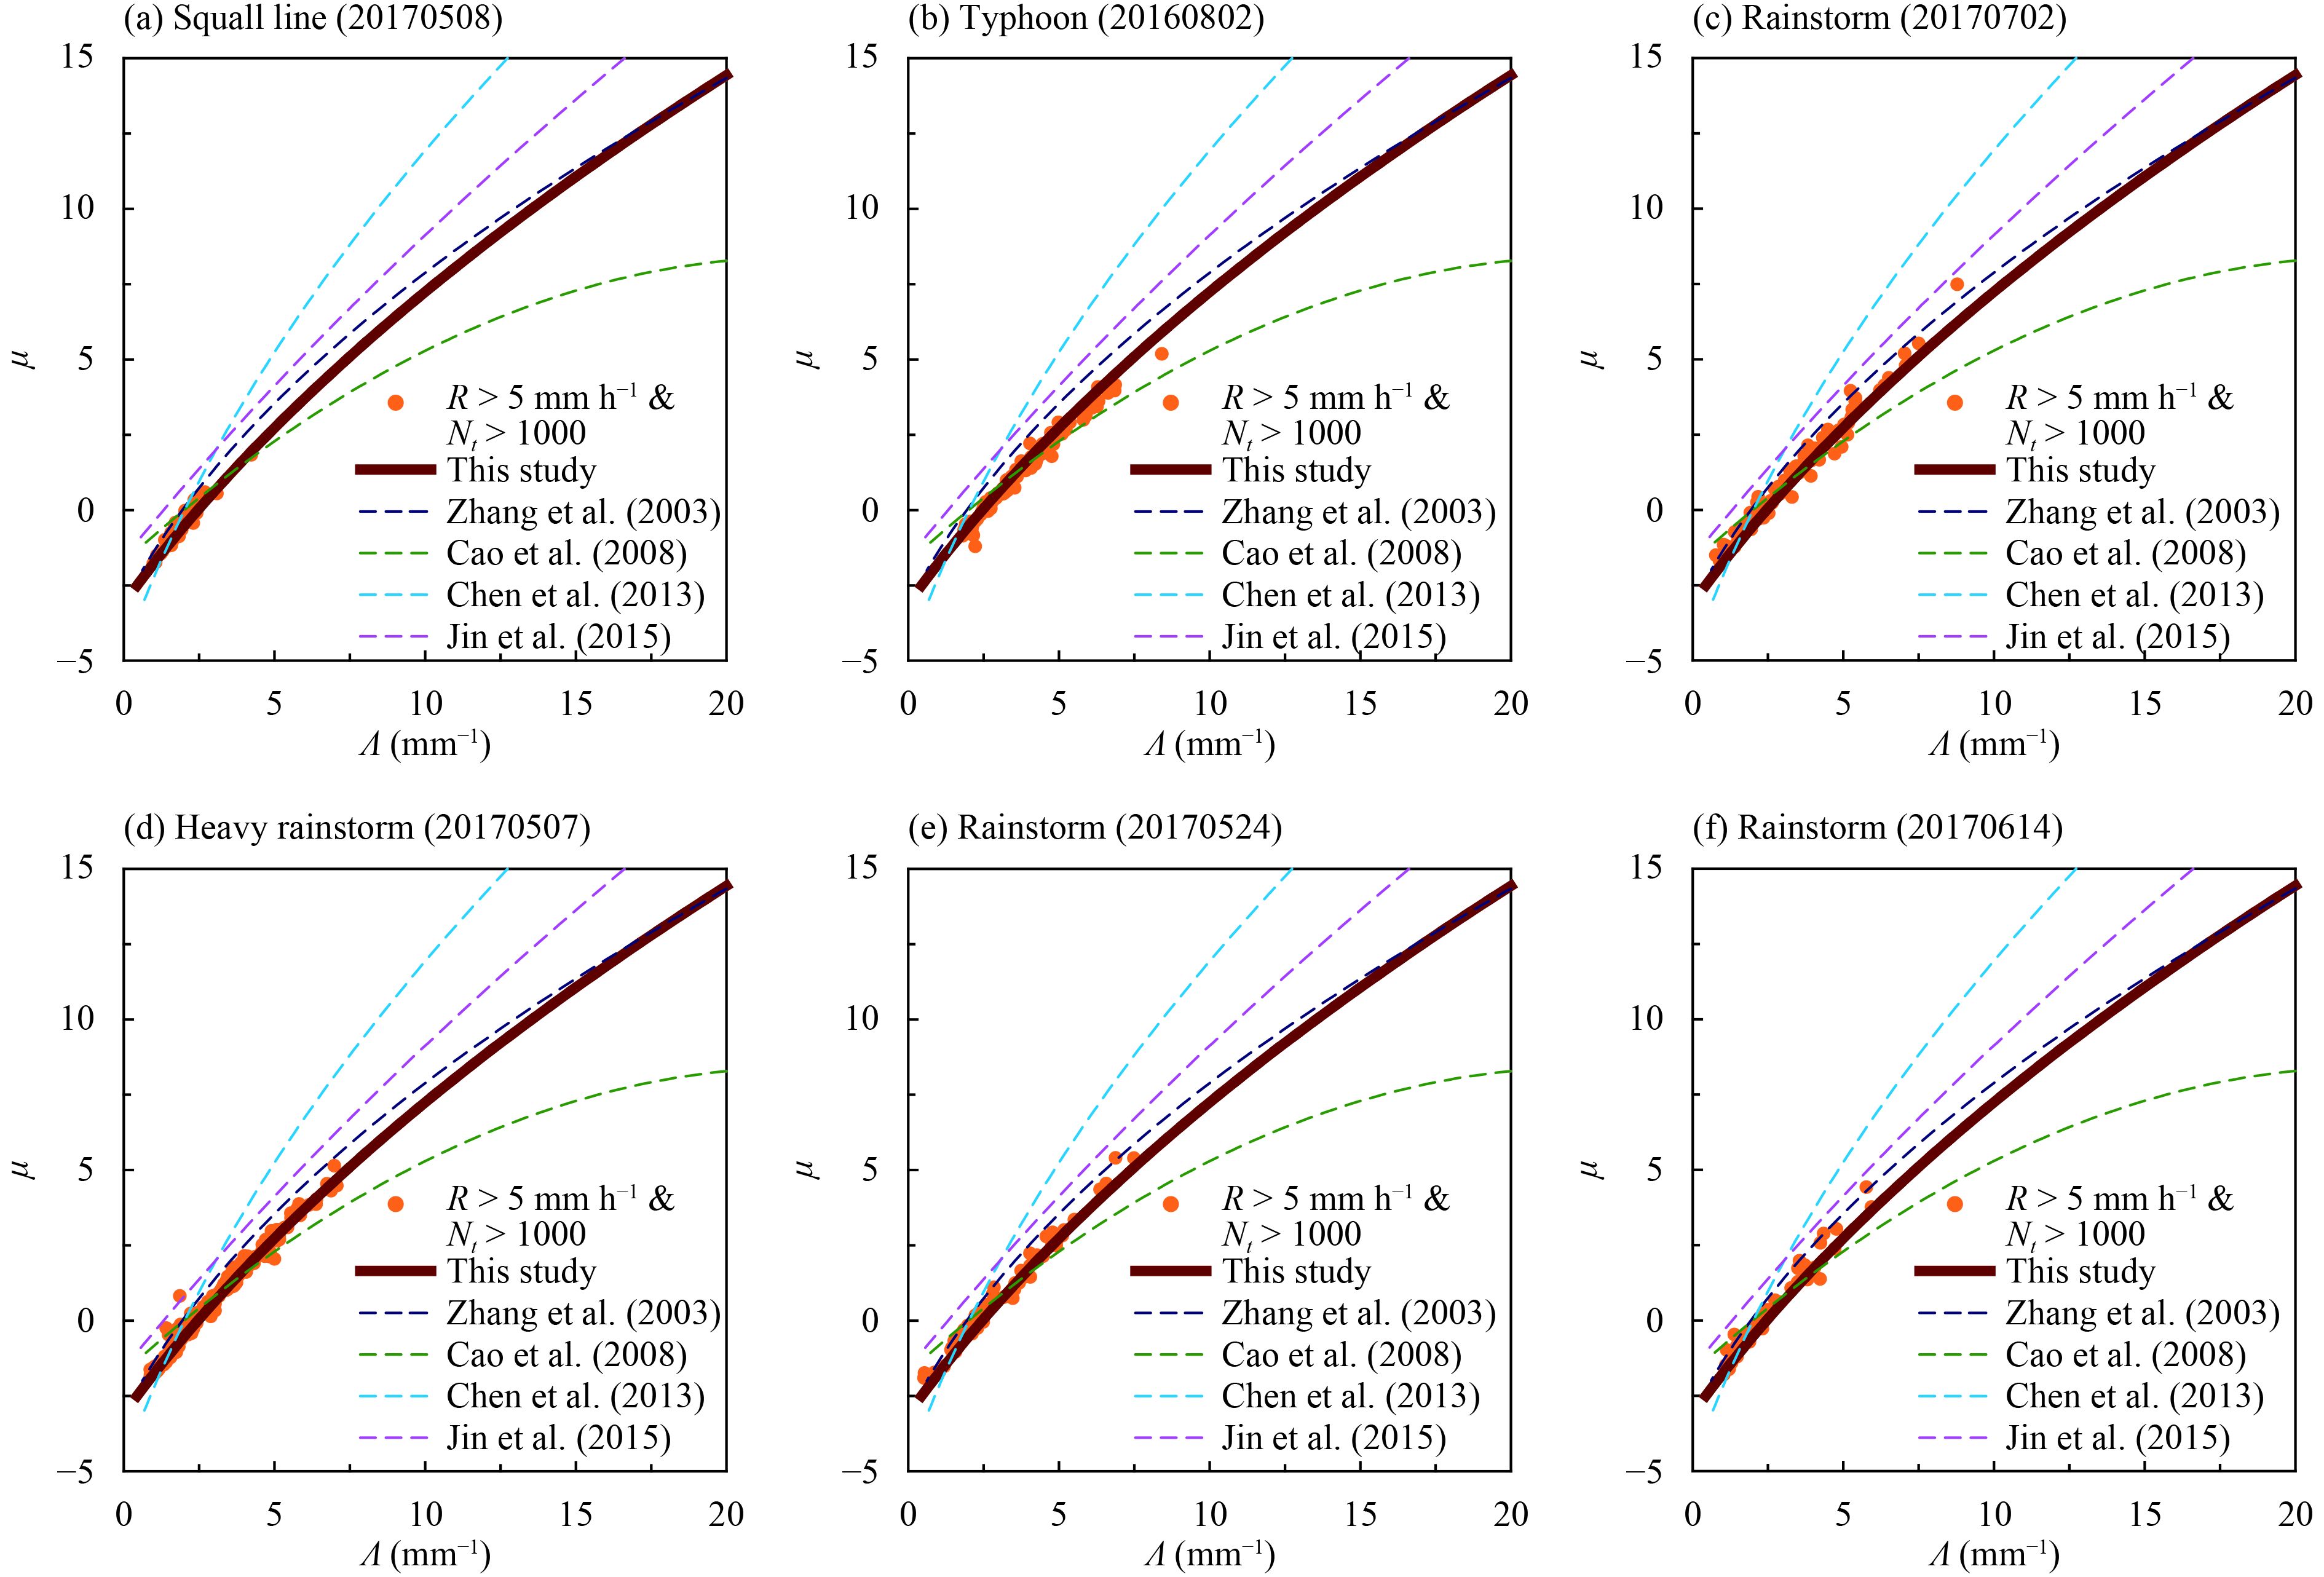
The observation results of six typical precipitation processes by 2DVDs are selected to further verify the applicability of the μ–Λ relationship in Eq. (16). The six precipitation processes are as follows: squall line precipitation on 8 May 2017 (Huizhou Longmen Station); heavy precipitation of Typhoon Nida on 2 August 2016 (Huizhou Longmen Station); rainstorm affected by subtropical high on 2 July 2017 (Shaoguan Xinfeng Station); abrupt heavy rainfall on 7 May 2017 (Qingyuan Fogang Station); rainstorm on 24 May 2017 (Guangzhou Maofengshan Station); and heavy rainfall on 14 June 2017 (Guangzhou Maofengshan Station). These six precipitation processes were observed at different sites with different weather background and precipitation types, showing good representation. The scattering of μ and Λ (after filtration) observed by the 2DVDs during the six precipitation processes are shown in Fig. 4. The results show that the μ–Λ relationship observed during the six precipitation processes is very close to the fitted curve of Eq. (16). This suggests that the μ–Λ relationship of Eq. (16) represents the intrinsic relation between μ and Λ in this area with high applicability, and can be used to construct the DSD parameters retrieval scheme for polarimetric radar based on the C-G method.
|
| Figure 4 Scatterplots of μ and Λ from 2DVDs observation results during six typical precipitation processes: (a) squall line precipitation on 8 May 2017 (Huizhou Longmen Station); (b) heavy precipitation of Typhoon Nida on 2 August 2016 (Huizhou Longmen Station); (c) rainstorm on 2 July 2017 (Shaoguan Xinfeng Station); (d) abrupt heavy rainfall on 7 May 2017 (Qingyuan Fogang Station); (e) rainstorm on 24 May 2017 (Guangzhou Maofengshan Station), and (f) heavy rainfall on 14 June 2017 (Guangzhou Maofengshan Station). The fitted curves are consistent with those in Fig. 2. |
By substituting Eq. (1) of the Γ DSD function into Eqs. (12) and (13), it can be deduced that ZDR is only related to μ and Λ, and is independent of N0. If the raindrop spectrum model and observation error are neglected, it can be concluded that the parameter ZDR is only related to Λ based on the μ–Λ relationship. At the same time, the combined parameter (ZHH/N0) is also determined by Λ. On these bases, the DSD parameters retrieved from polarimetric radar observations based on the C-G method can be constructed. The scheme has the following three steps:
(1) Obtain Λ through the measured ZDR;
(2) Calculate μ according to the Λ and μ–Λ relationship of Eq. (16);
(3) Use the retrieved μ and Λ as well as the N0/ZHH ratio to obtain N0.
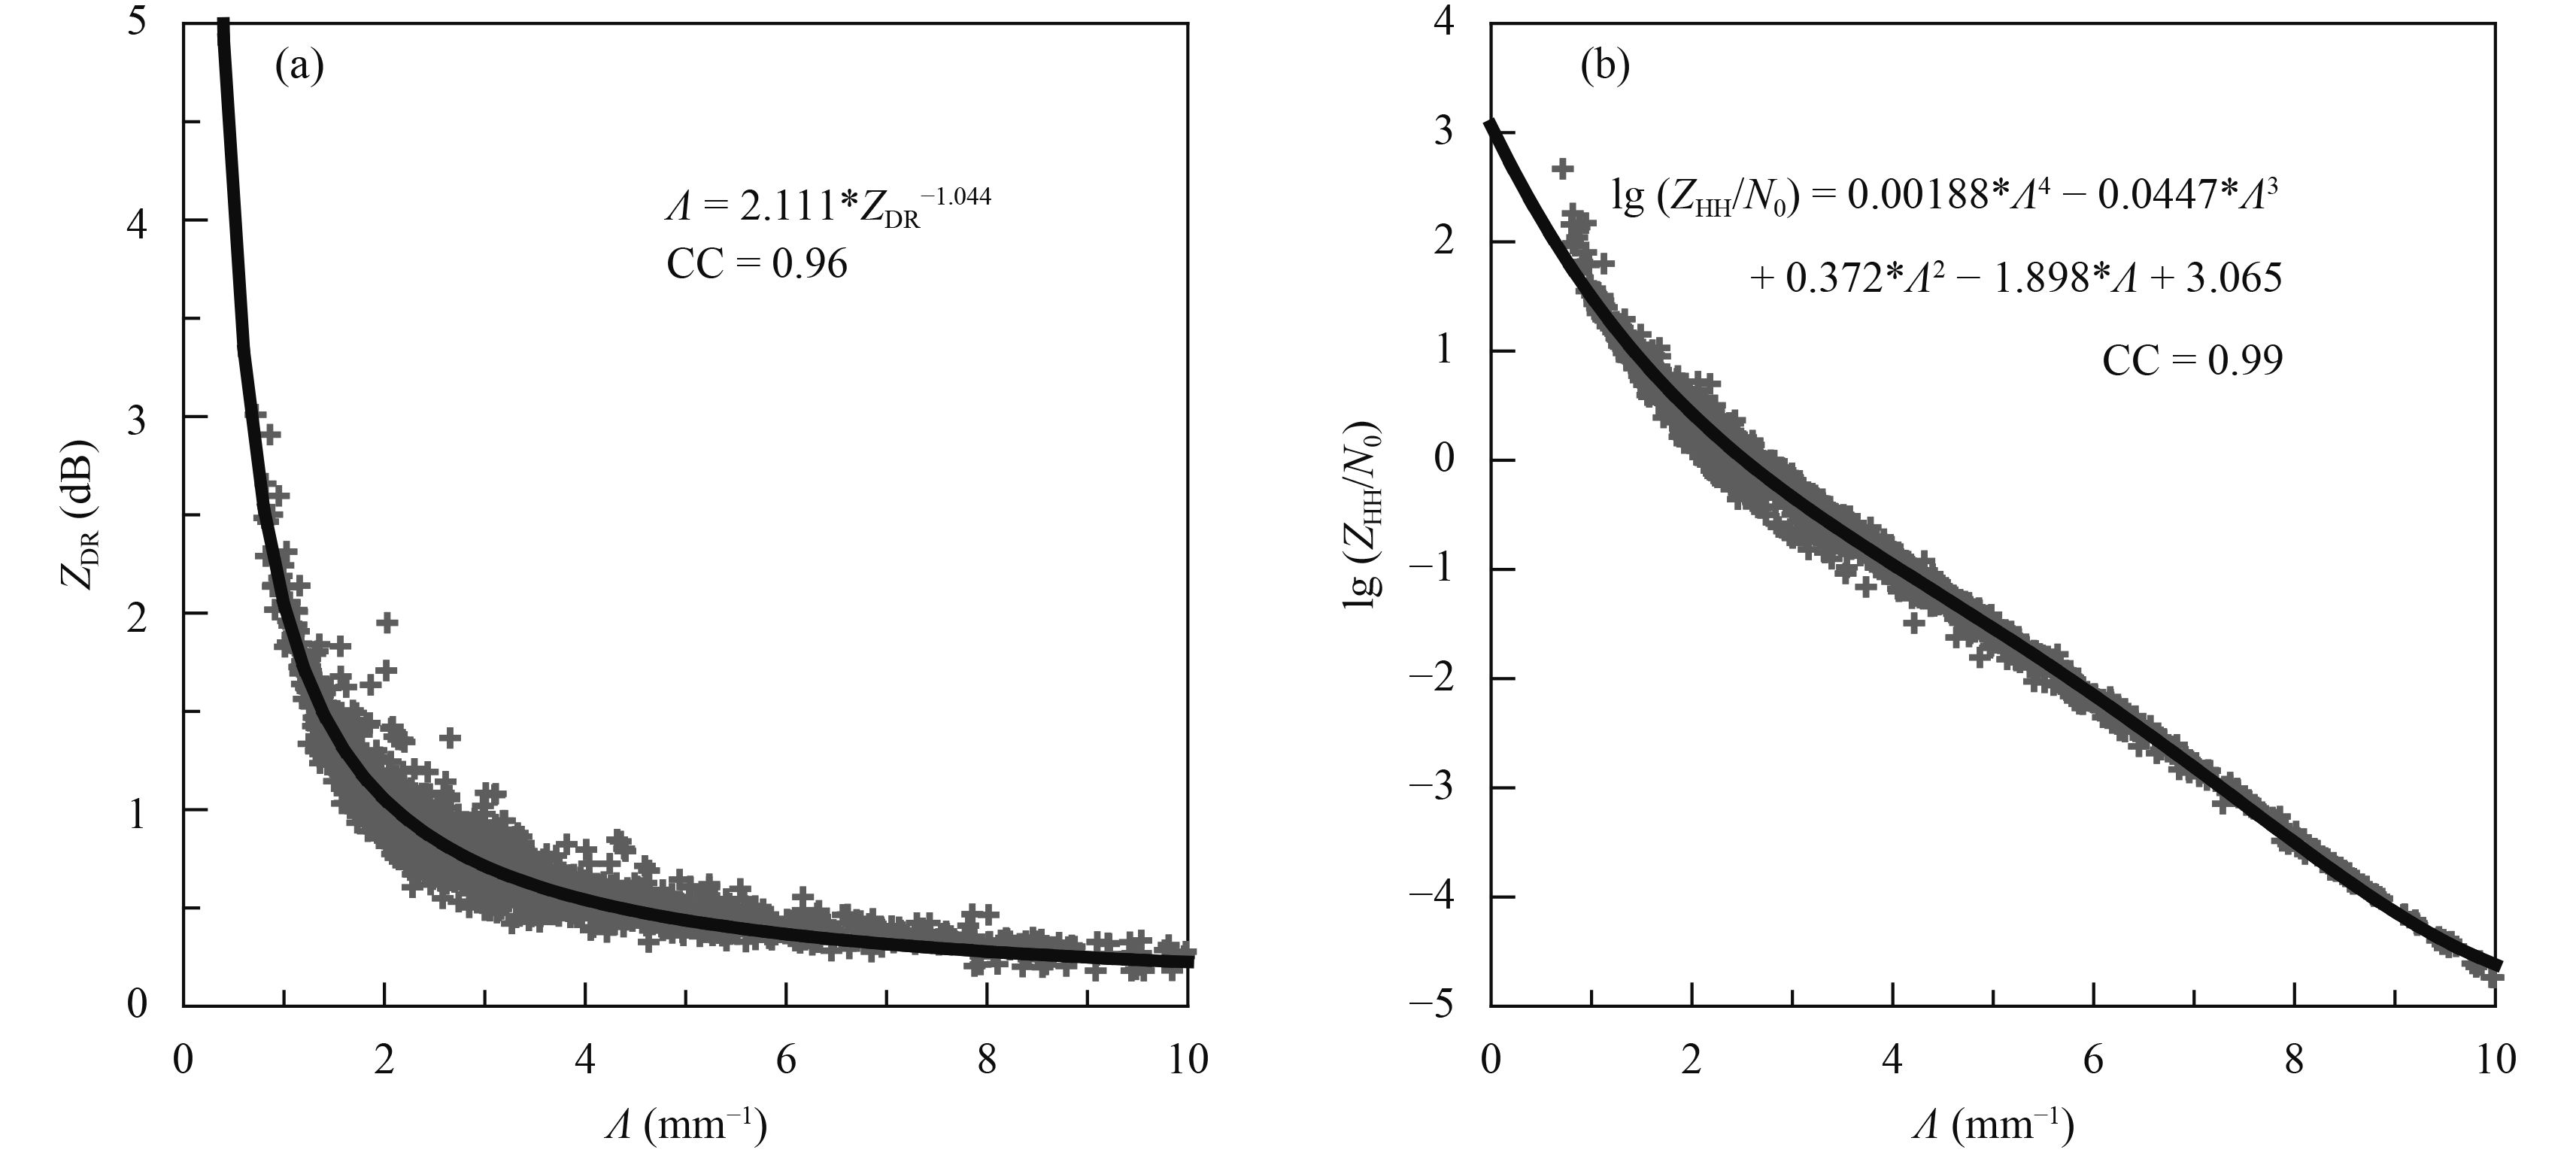
For ease of use, ZHH and ZDR of each DSD sample are simulated by the S-band polarimetric radar simulator. The scattering of the DSD parameter Λ and the simulated ZDR are shown in Fig. 5a. It can be seen that the smaller the Λ value, the greater the ZDR value. The correlation between Λ and ZDR can be better fitted by the power function with a CC as high as 0.96. The fitting formula is as follows
| $\varLambda {\rm{ = }}2.111 \times {{{Z}}_{\rm {DR}}}^{ - 1.044}.$ | (17) |
The scattering of the DSD parameter Λ and the combined parameter lg (ZHH/N0) are shown in Fig. 5b. The smaller the value of Λ, the greater the value of lg (ZHH/N0). The correlation between Λ and (ZHH/N0) can be better expressed by a polynomial with a CC as high as 0.99. The fitting formula is as follows
| ${N_0} = {Z_{\rm {HH}}} \times {10^{ - 0.00188{\varLambda ^4} + 0.0447{\varLambda ^3} - 0.372{\varLambda ^2} + 1.898\varLambda {\rm{ - 3}}.065}}.$ | (18) |
|
| Figure 5 Scatterplots of DSD parameters Λ with (a) ZDR, and (b) combined parameter lg (ZHH/N0). The heavy black lines indicate fitted curves of filtered samples. |
In order to verify the retrieval algorithm, we retrieve the DSDs from Guangzhou S-band polarimetric radar observations. The retrieved DSDs have been compared with 2DVD measurements at Guangzhou Maofengshan Station, which are supposed to be ture DSDs. The heavy rain processes on 24 May and 14 June 2017 are selected for the retrieval examination.
The Guangzhou Maofengshan Station is 534 m above sea level, located in the north east of Guangzhou radar. As the radar beams of 0.5-degree elevation of Guangzhou radar are affected by the terrain, the radar beams of 1.5-degree elevation are therefore used for the retrieval examination. The vertical height difference between the center position of the 1.5-degree elevation radar beams and the Maofengshan Station is about 400 m, which make the 2DVD observation time lag behind the Guangzou radar about 1 min. In order to reduce the sampling error, the radar detection data have been smoothed by five points.
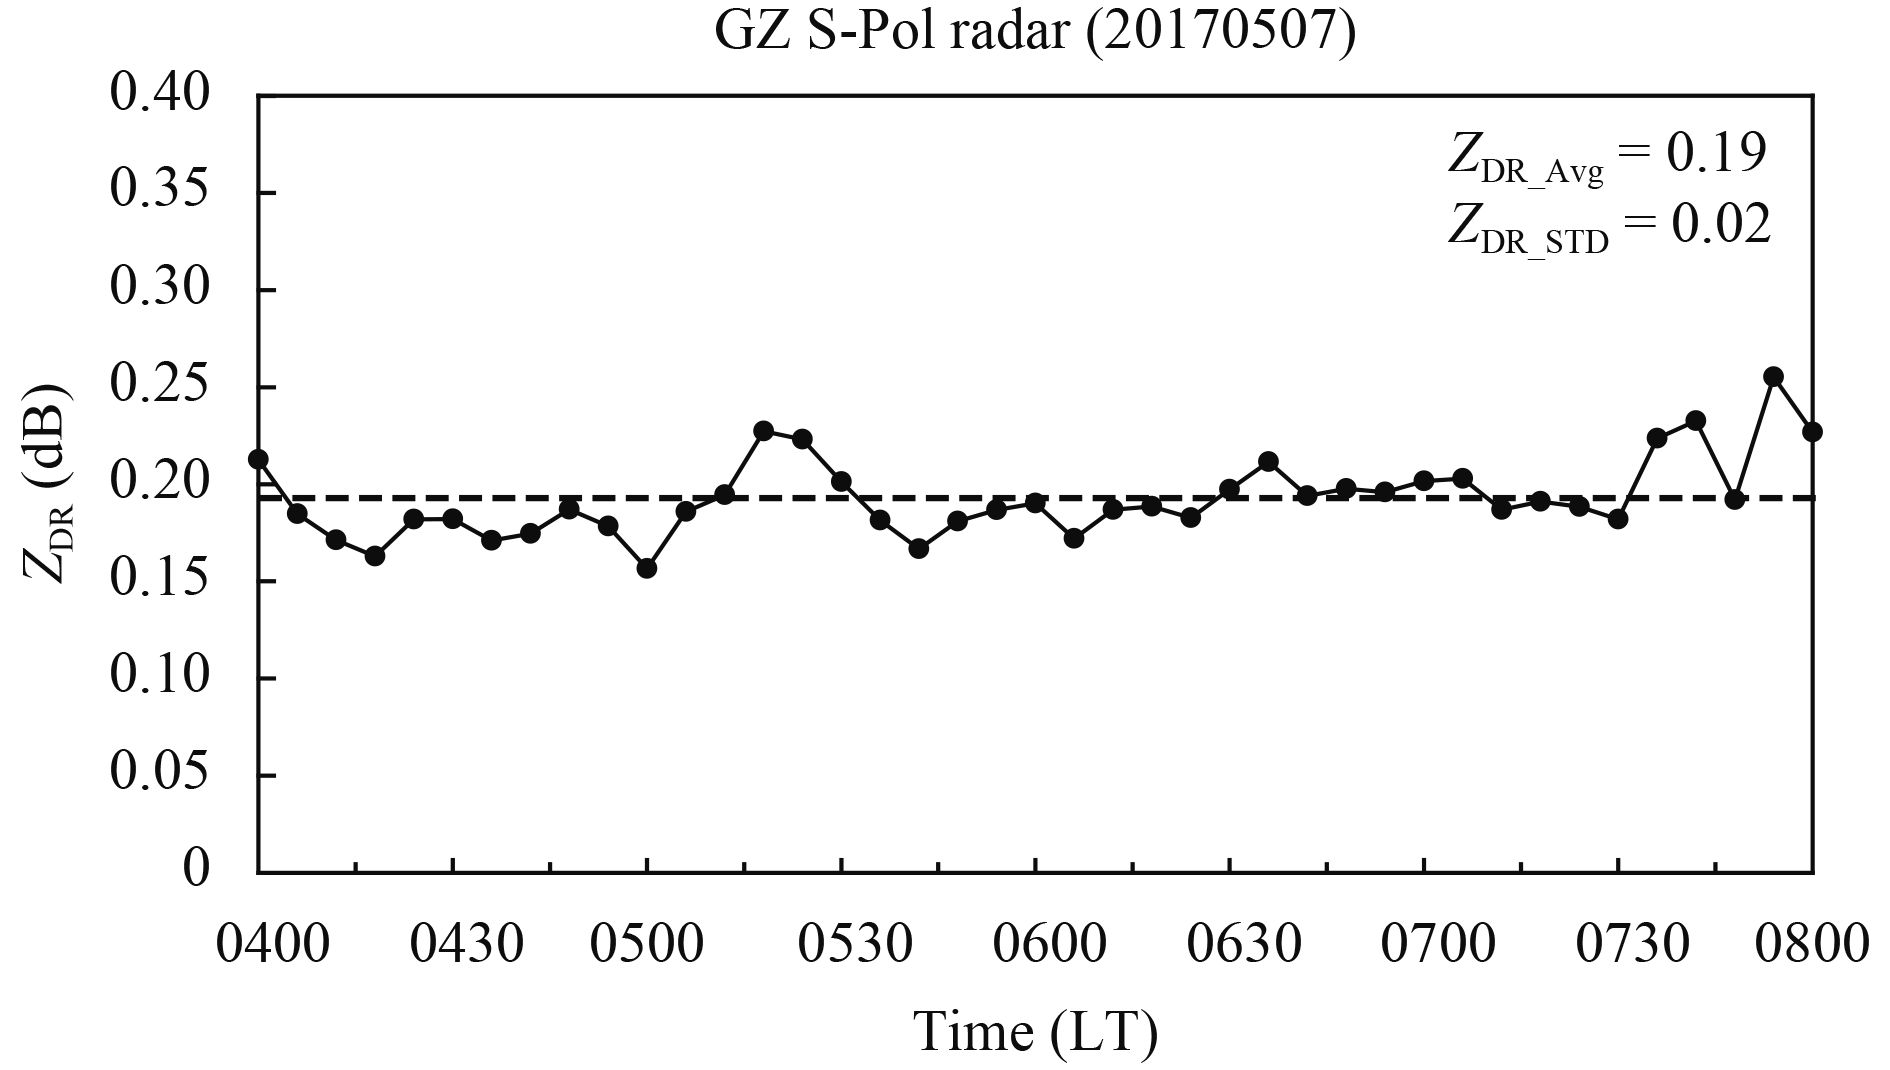
Due to the inconsistency between the horizontal and vertical channels of the polarimetric radar, the system deviation of ZDR will change with time. The micro-raindrop method is a good way to evaluate the system error of ZDR by using meteorological targets (Hu et al., 2014). Generally, small precipitation particles, such as drizzle, are nearly spherical, and the detected ZDR value of such meteorological targets is nearly zero. If a drizzle area can be determined, its ZDR value can be viewed as the system error of ZDR. To avoid the influence of ground clutter, the signal-to-noise ratio (SNR) and the zero-layer bright band, each assumed that the drizzle area shall meet the following conditions: initial range bin > 60 (250 m per range bin); vertical height corresponding to the final range bin H < 3 km, SNR > 20 dB, ZHH < 20 dBZ, and CC > 0.95. The micro-raindrop method is used to analyze the variation of system deviation of ZDR detected by the Guangzhou radar with time. The variation curves of ZDR system deviation are calculated, with all scanned data of the radar meeting the selected condition of the drizzle from 0400 to 0800 local time (LT) 7 May 2017 (Fig. 6). As shown in Fig. 6, the system error of ZDR is small, ranging from 0.15 to 0.30 dB and averaging 0.19 dB. In addition, the system error of ZDR slightly fluctuates with time, and the stability of the radar system is high. To avoid the system error, the ZDR value detected by Guangzhou radar should be reduced by a system error of 0.19 dB. To reduce the random fluctuations, a five-gate median average and a five-gate running mean are performed for ZHH and ZDR (Wang et al., 2016), respectively.
|
| Figure 6 Variation of system deviation of ZDR detected by the Guangzhou S-band polarimetric radar from 0400 to 0800 LT 7 May 2017. |
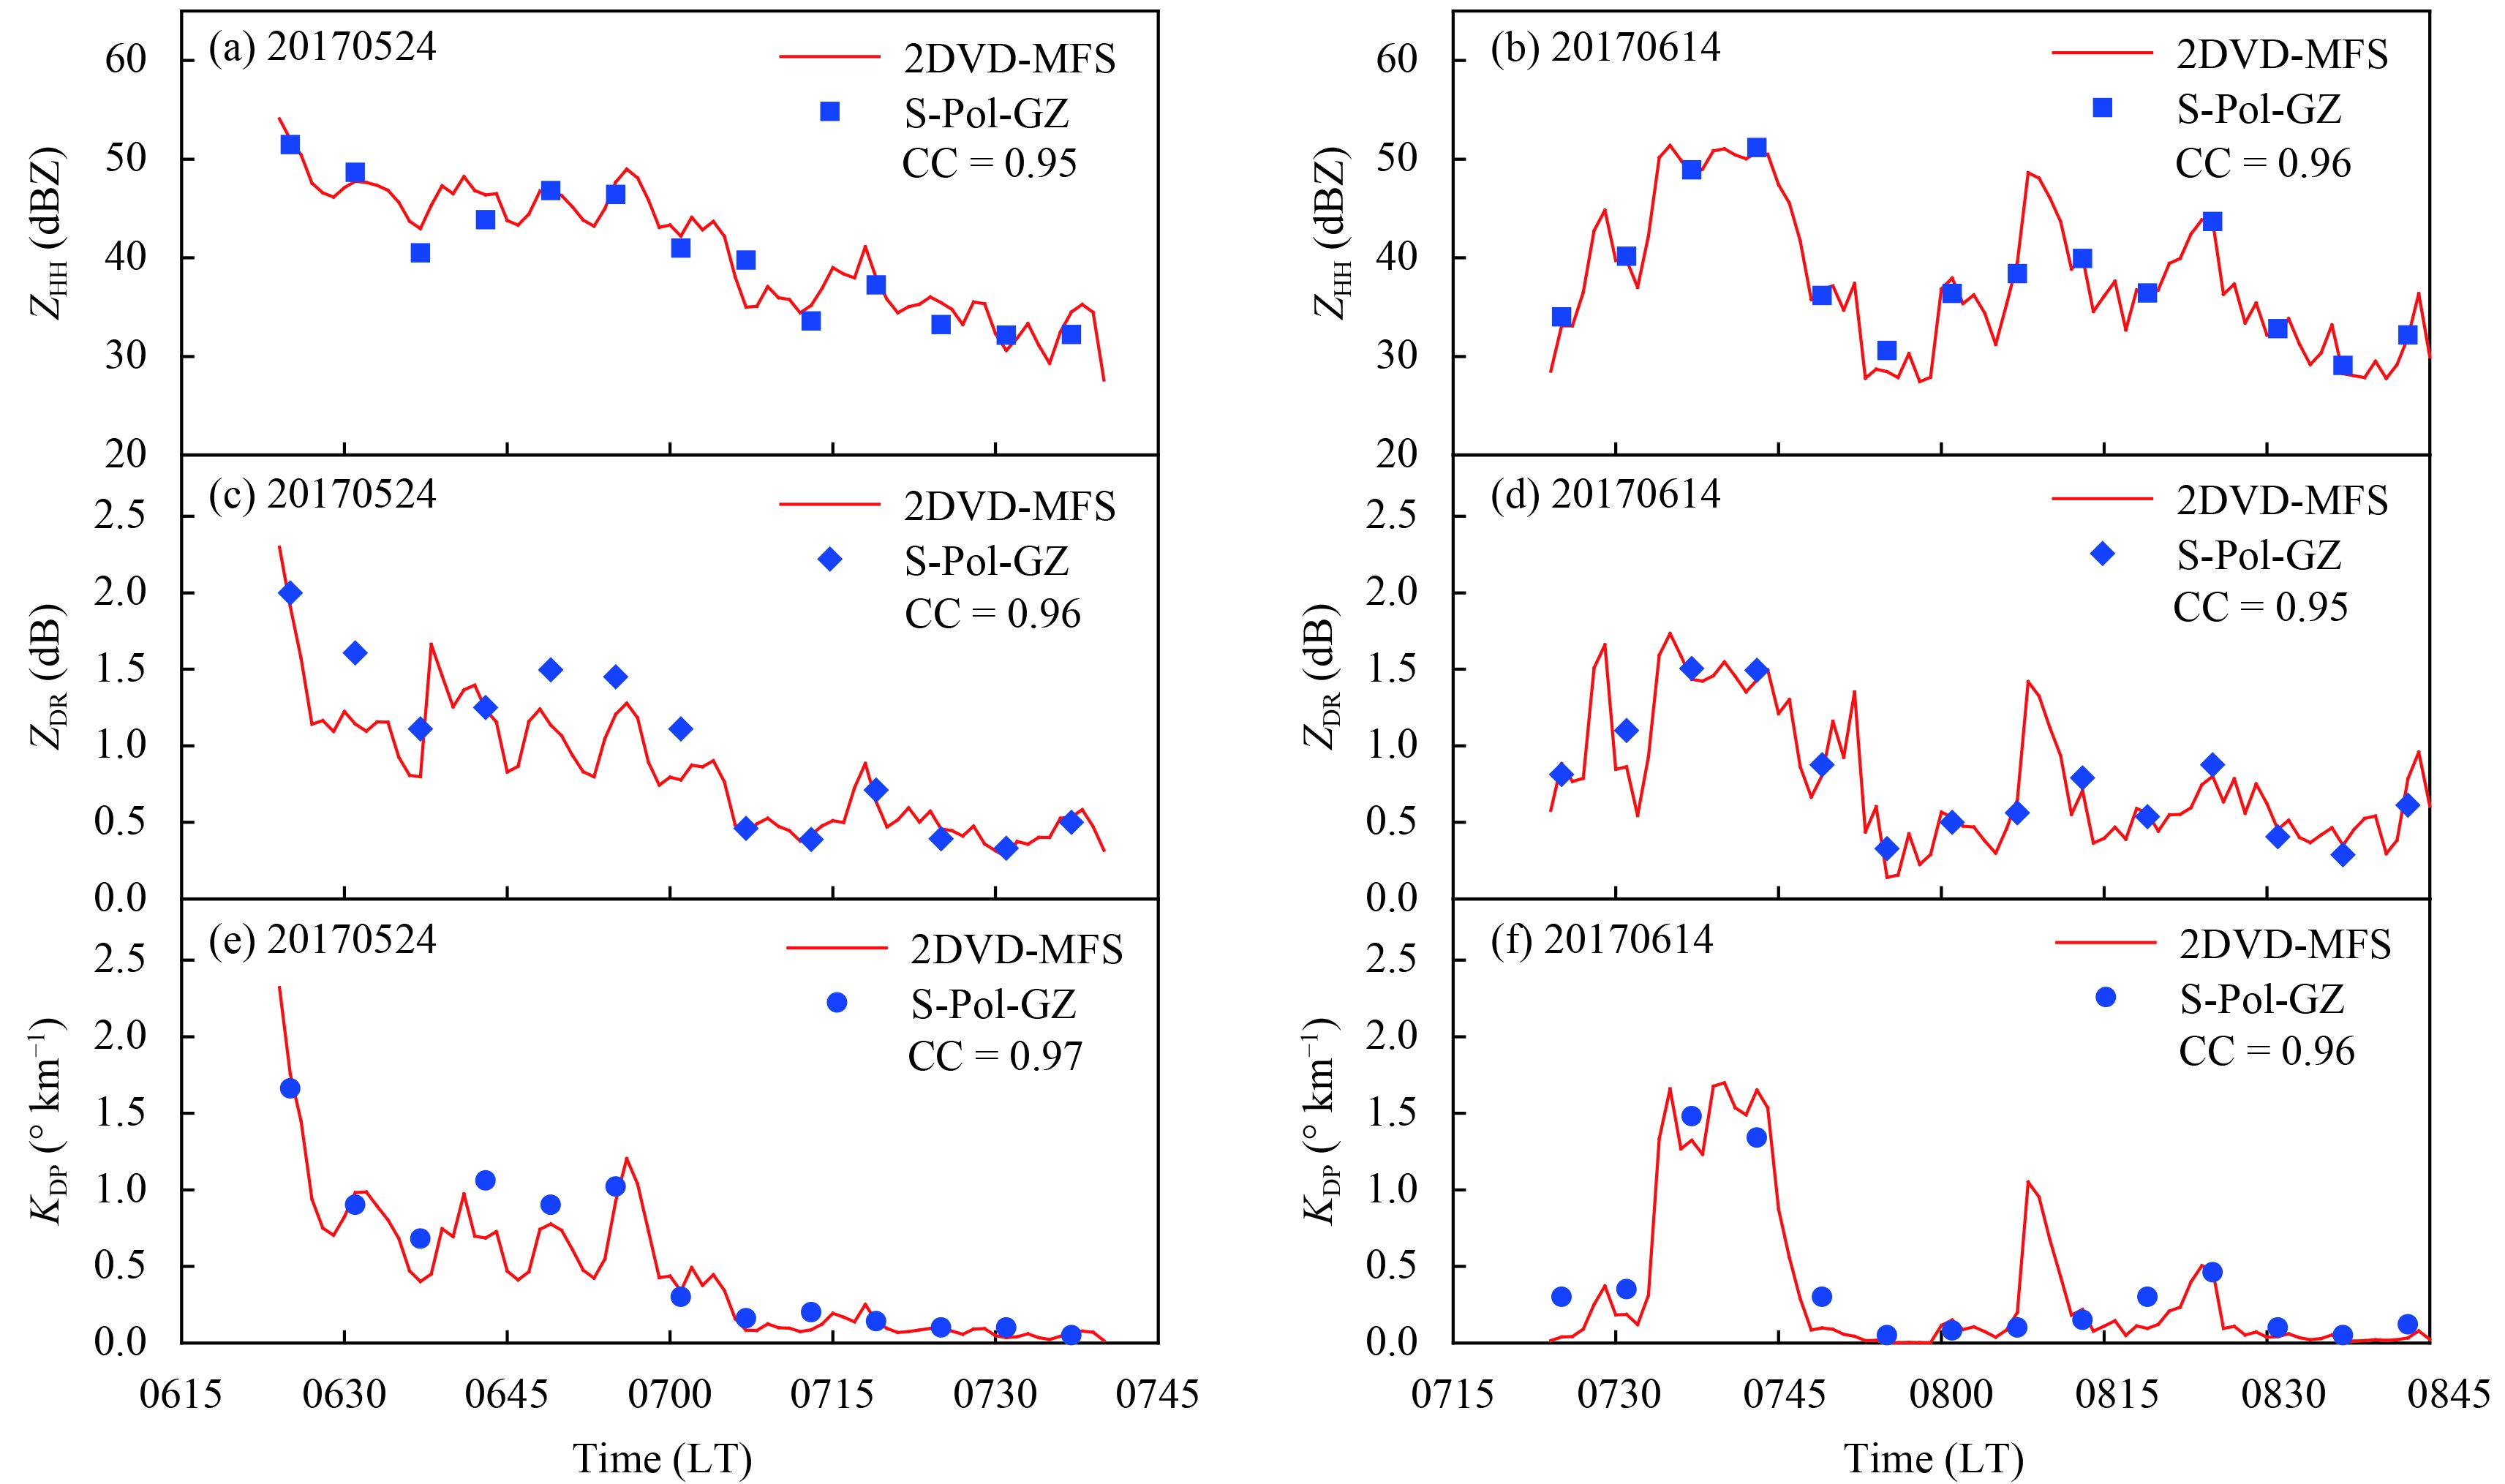
During the main precipitation periods of two selected rainstorms, the variations of ZHH, ZDR, and KDP simulated from 2DVD DSD measurements at Guangzhou Maofengshan Station are shown in Fig. 7, as well as space–time matching observations of Guangzhou radar (1-min delay). The comparison results show that the polarimetric radar parameters simulated by 2DVD DSD measurements are close to the observations of Guangzhou radar, both of which are in good agreement with time, and the correlation coefficients are higher than 0.95. This not only shows that the observation objects of the 2DVD at Maofengshan station are basically consistent with the Guangzhou radar 1.5-degree elevation radar beams, but also shows that the S-band polarimetric radar simulator used in this study has high reliability.
|
| Figure 7 Variations of ZHH, ZDR, and KDP simulated by Maofengshan 2DVD DSD measurements (red lines), and observed by Guangzhou S-band polarimetric radar (blue points) during the precipitation process on 24 May 2017 are shown in (a, c, e), respectively; those on 14 June 2017 are shown in (b, d, f), respectively. |
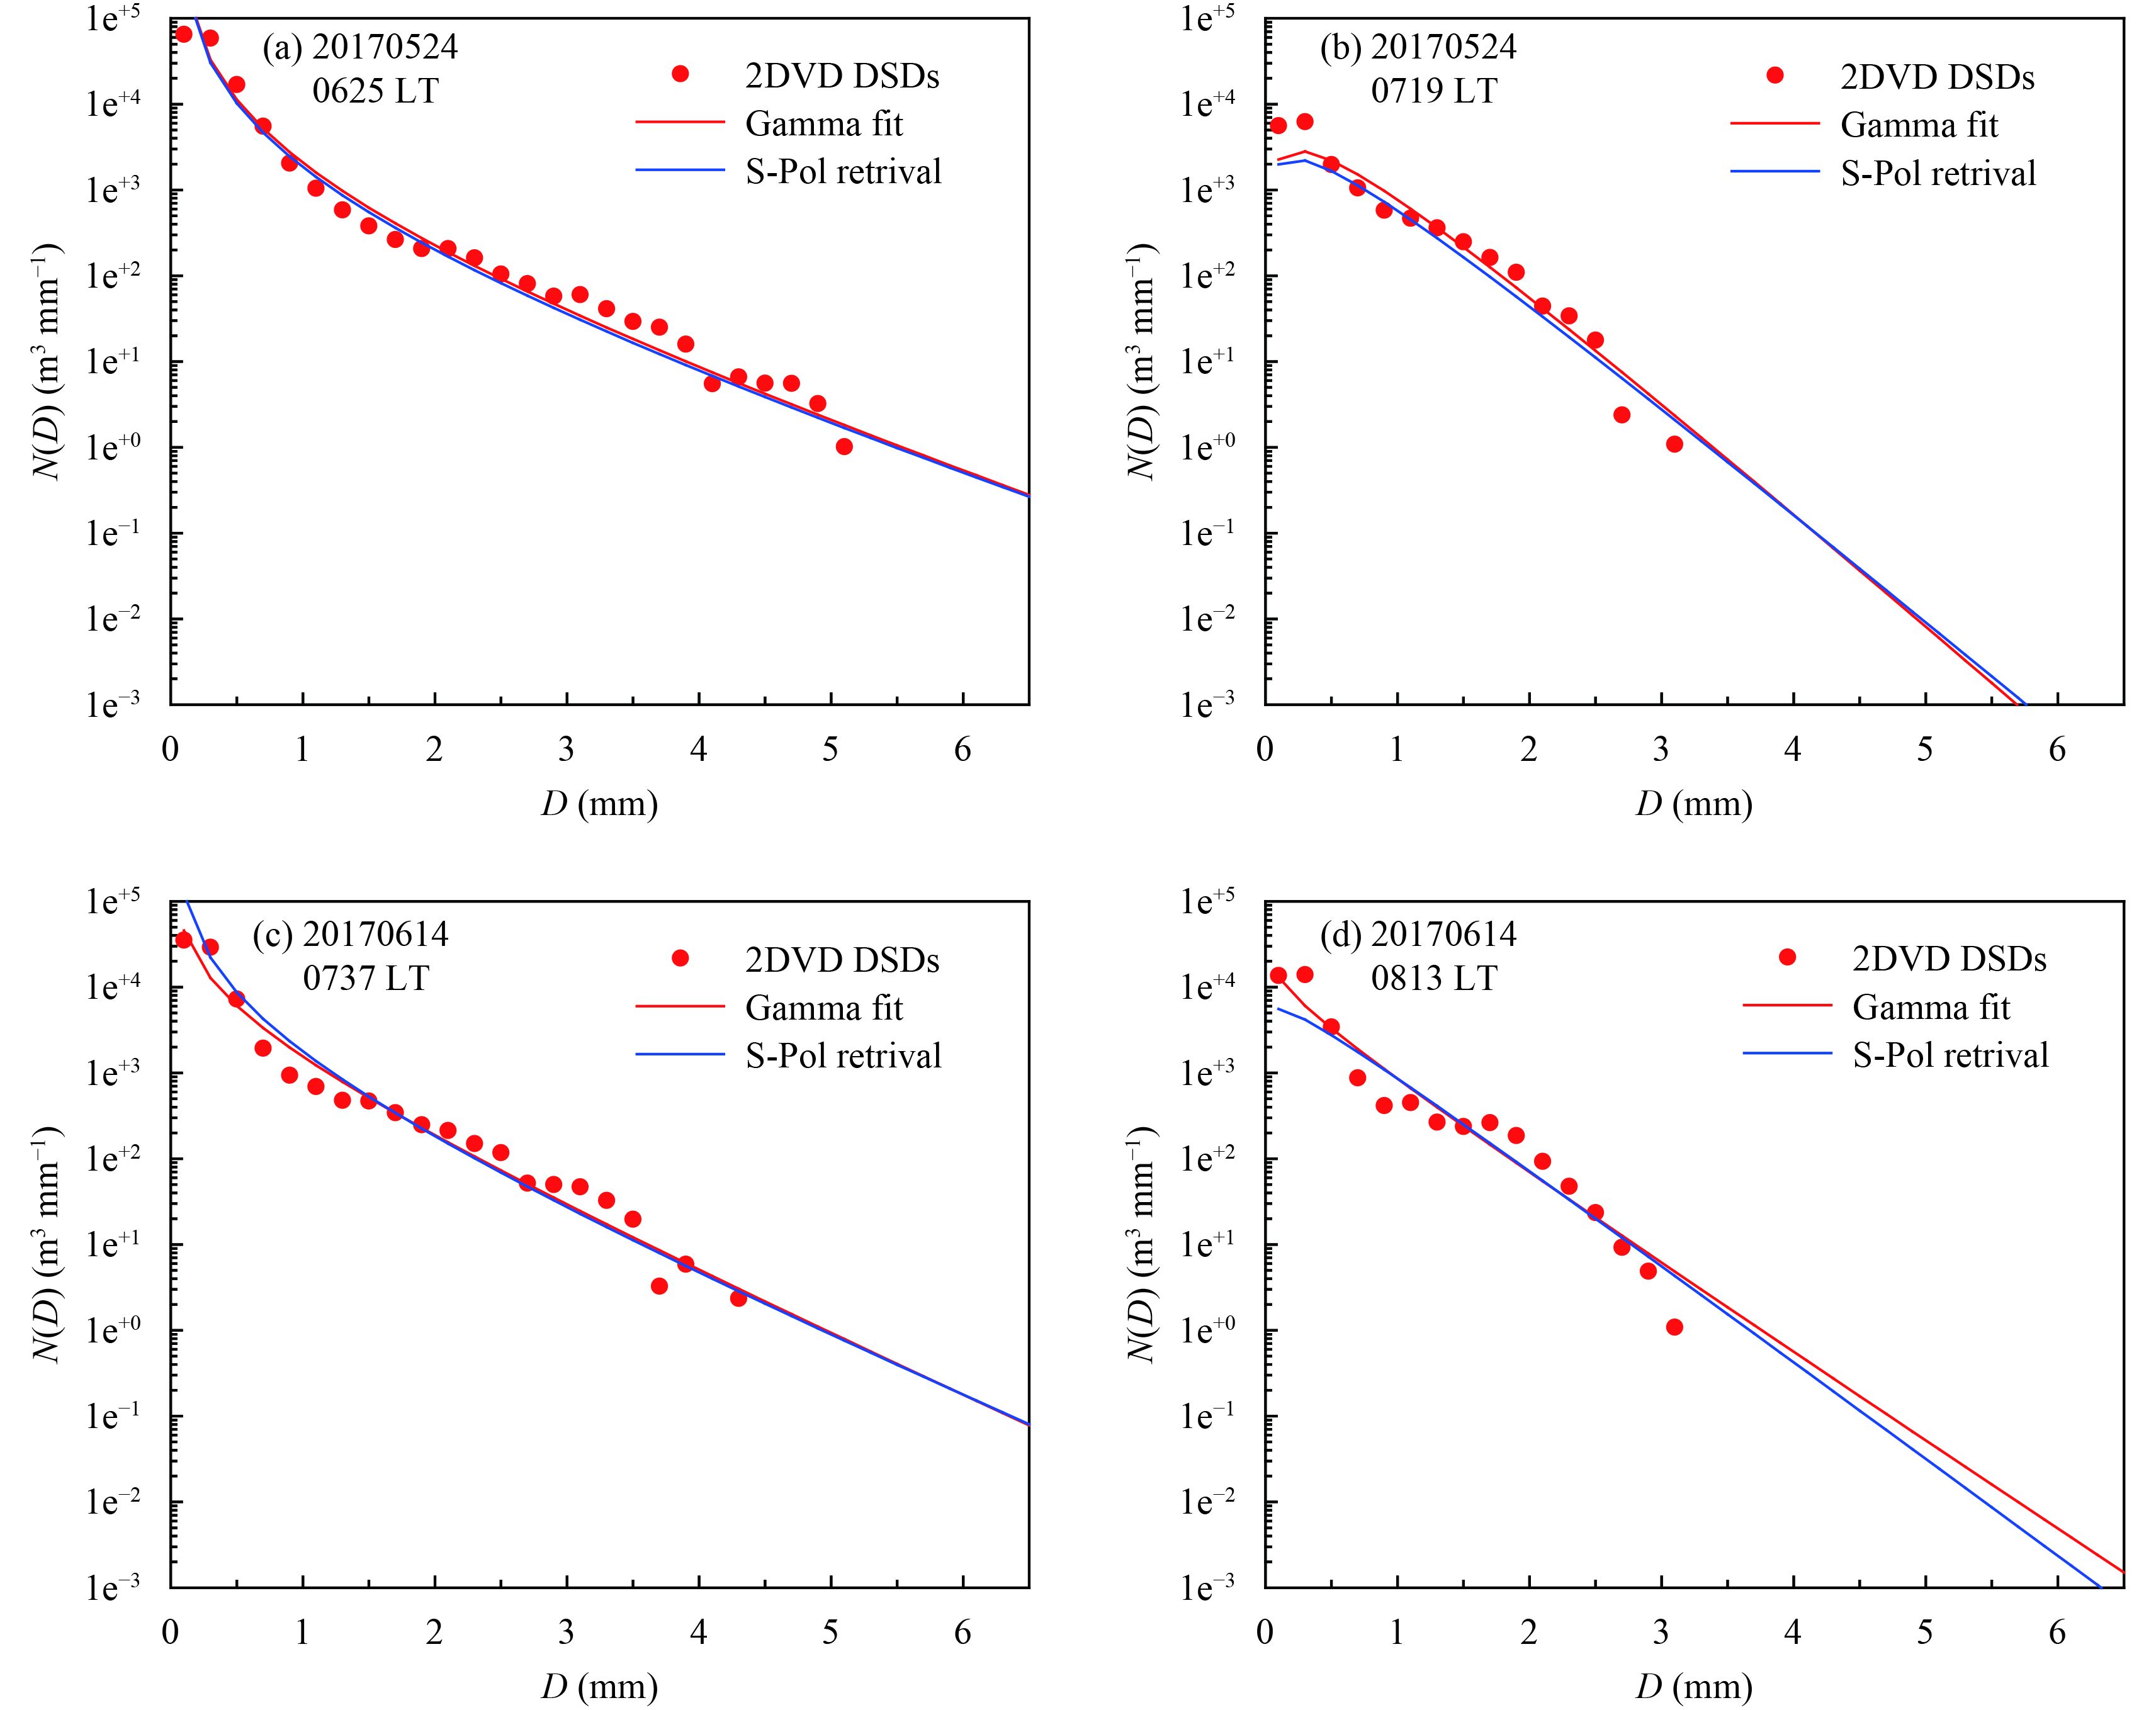
Two heavy precipitation and two ordinary precipitation moments are selected to retrieve DSD parameters and compare with 2DVD DSD measurements. In these four moments, the values of polarimetric radar parameters (ZHH and ZDR) observed by S-band radar are close to the simulated results based on 2DVD DSD measurements. The comparison results are shown in Fig. 8, and parameters of DSD and rain microphysics are shown in Table 2. As shown in Fig. 8, the fitted Γ function curves can well represent the DSD measurements, which indicates that the accuracies of the 2nd, 3rd, and 4th order moments method to solve Γ function parameters are high. Whether heavy precipitation or ordinary precipitation moments, the three parameters (N0, μ, and Λ) of Γ function retrieved from polarimetric radar observation are close to the results fitted by the 2DVD DSD measurements, and the retrieved Γ function curves are also consistent with the Γ function curves fitted by the 2DVD DSD measurements. The polarimetric radar parameter (ZHH and ZDR) from the S-band polarimetric radar simulator based on 2DVD DSD measurements and Guangzhou S-pol observations are nearly the same. The precipitation characteristic parameters (R, Dm, and Nw) calculated based on the retrieval results are basically consistent with the 2DVD observation results, and the relative errors are within 10%. This indicates that the DSD retrieved by the C-G method can well represent the corresponding DSD measurements when the ZHH and ZDR values observed by polarimetric radar are comparable to those simulated by the 2DVD DSD measurements.
|
| Figure 8 Comparison of DSDs between retrieval results from the Guangzhou polarimetric radar (blue curve) and the observation results from the Maofengshan 2DVD (red dots). The fitting results of the Γ function are shown by the red curve, and the precipitation moments are taken at (a) 0625 LT 24 May, (b) 0719 LT 24 May, (c) 0737 LT 14 June, and (d) 0813 LT 14 June 2017. |
| Time | Instrument | ZHH (dBZ) | ZDR (dB) | 1g N0 (mm–1 – μ m–3) | μ | Λ (mm–1) | R (mm h–1) | Dm (mm) | 1g Nw (m–3 mm–1) |
| 20170524 | 2DVD | 52.1 | 1.91 | 3.77 | –1.69 | 1.05 | 69.4 | 2.21 | 4.05 |
| 0625 LT | S-Pol | 51.5 | 2.00 | 3.71 | –1.73 | 1.02 | 63.4 (–9%) | 2.19 (–1%) | 4.02 (3%) |
| 20170524 | 2DVD | 38.0 | 0.63 | 4.27 | 0.77 | 3.18 | 10.4 | 1.50 | 4.01 |
| 0719 LT | S-Pol | 37.3 | 0.71 | 4.07 | 0.64 | 3.02 | 9.8 (6%) | 1.54 (3%) | 3.88 (–3%) |
| 20170614 | 2DVD | 48.5 | 1.43 | 3.84 | –0.88 | 1.50 | 49.9 | 2.09 | 4.00 |
| 0737 LT | S-Pol | 48.9 | 1.51 | 3.85 | –1.29 | 1.38 | 50.2 (1%) | 1.97 (–6%) | 4.12 (3%) |
| 20170614 | 2DVD | 40.0 | 0.71 | 3.94 | –0.28 | 2.32 | 17.4 | 1.61 | 4.01 |
| 0813 LT | S-Pol | 40.0 | 0.81 | 4.08 | 0.22 | 2.64 | 15.9 (–9%) | 1.60 (–1%) | 4.02 (0%) |
| Note: The percentage in parentheses is the relative error between the retrieval results of polarimetric radar and observation results of 2DVD. | |||||||||
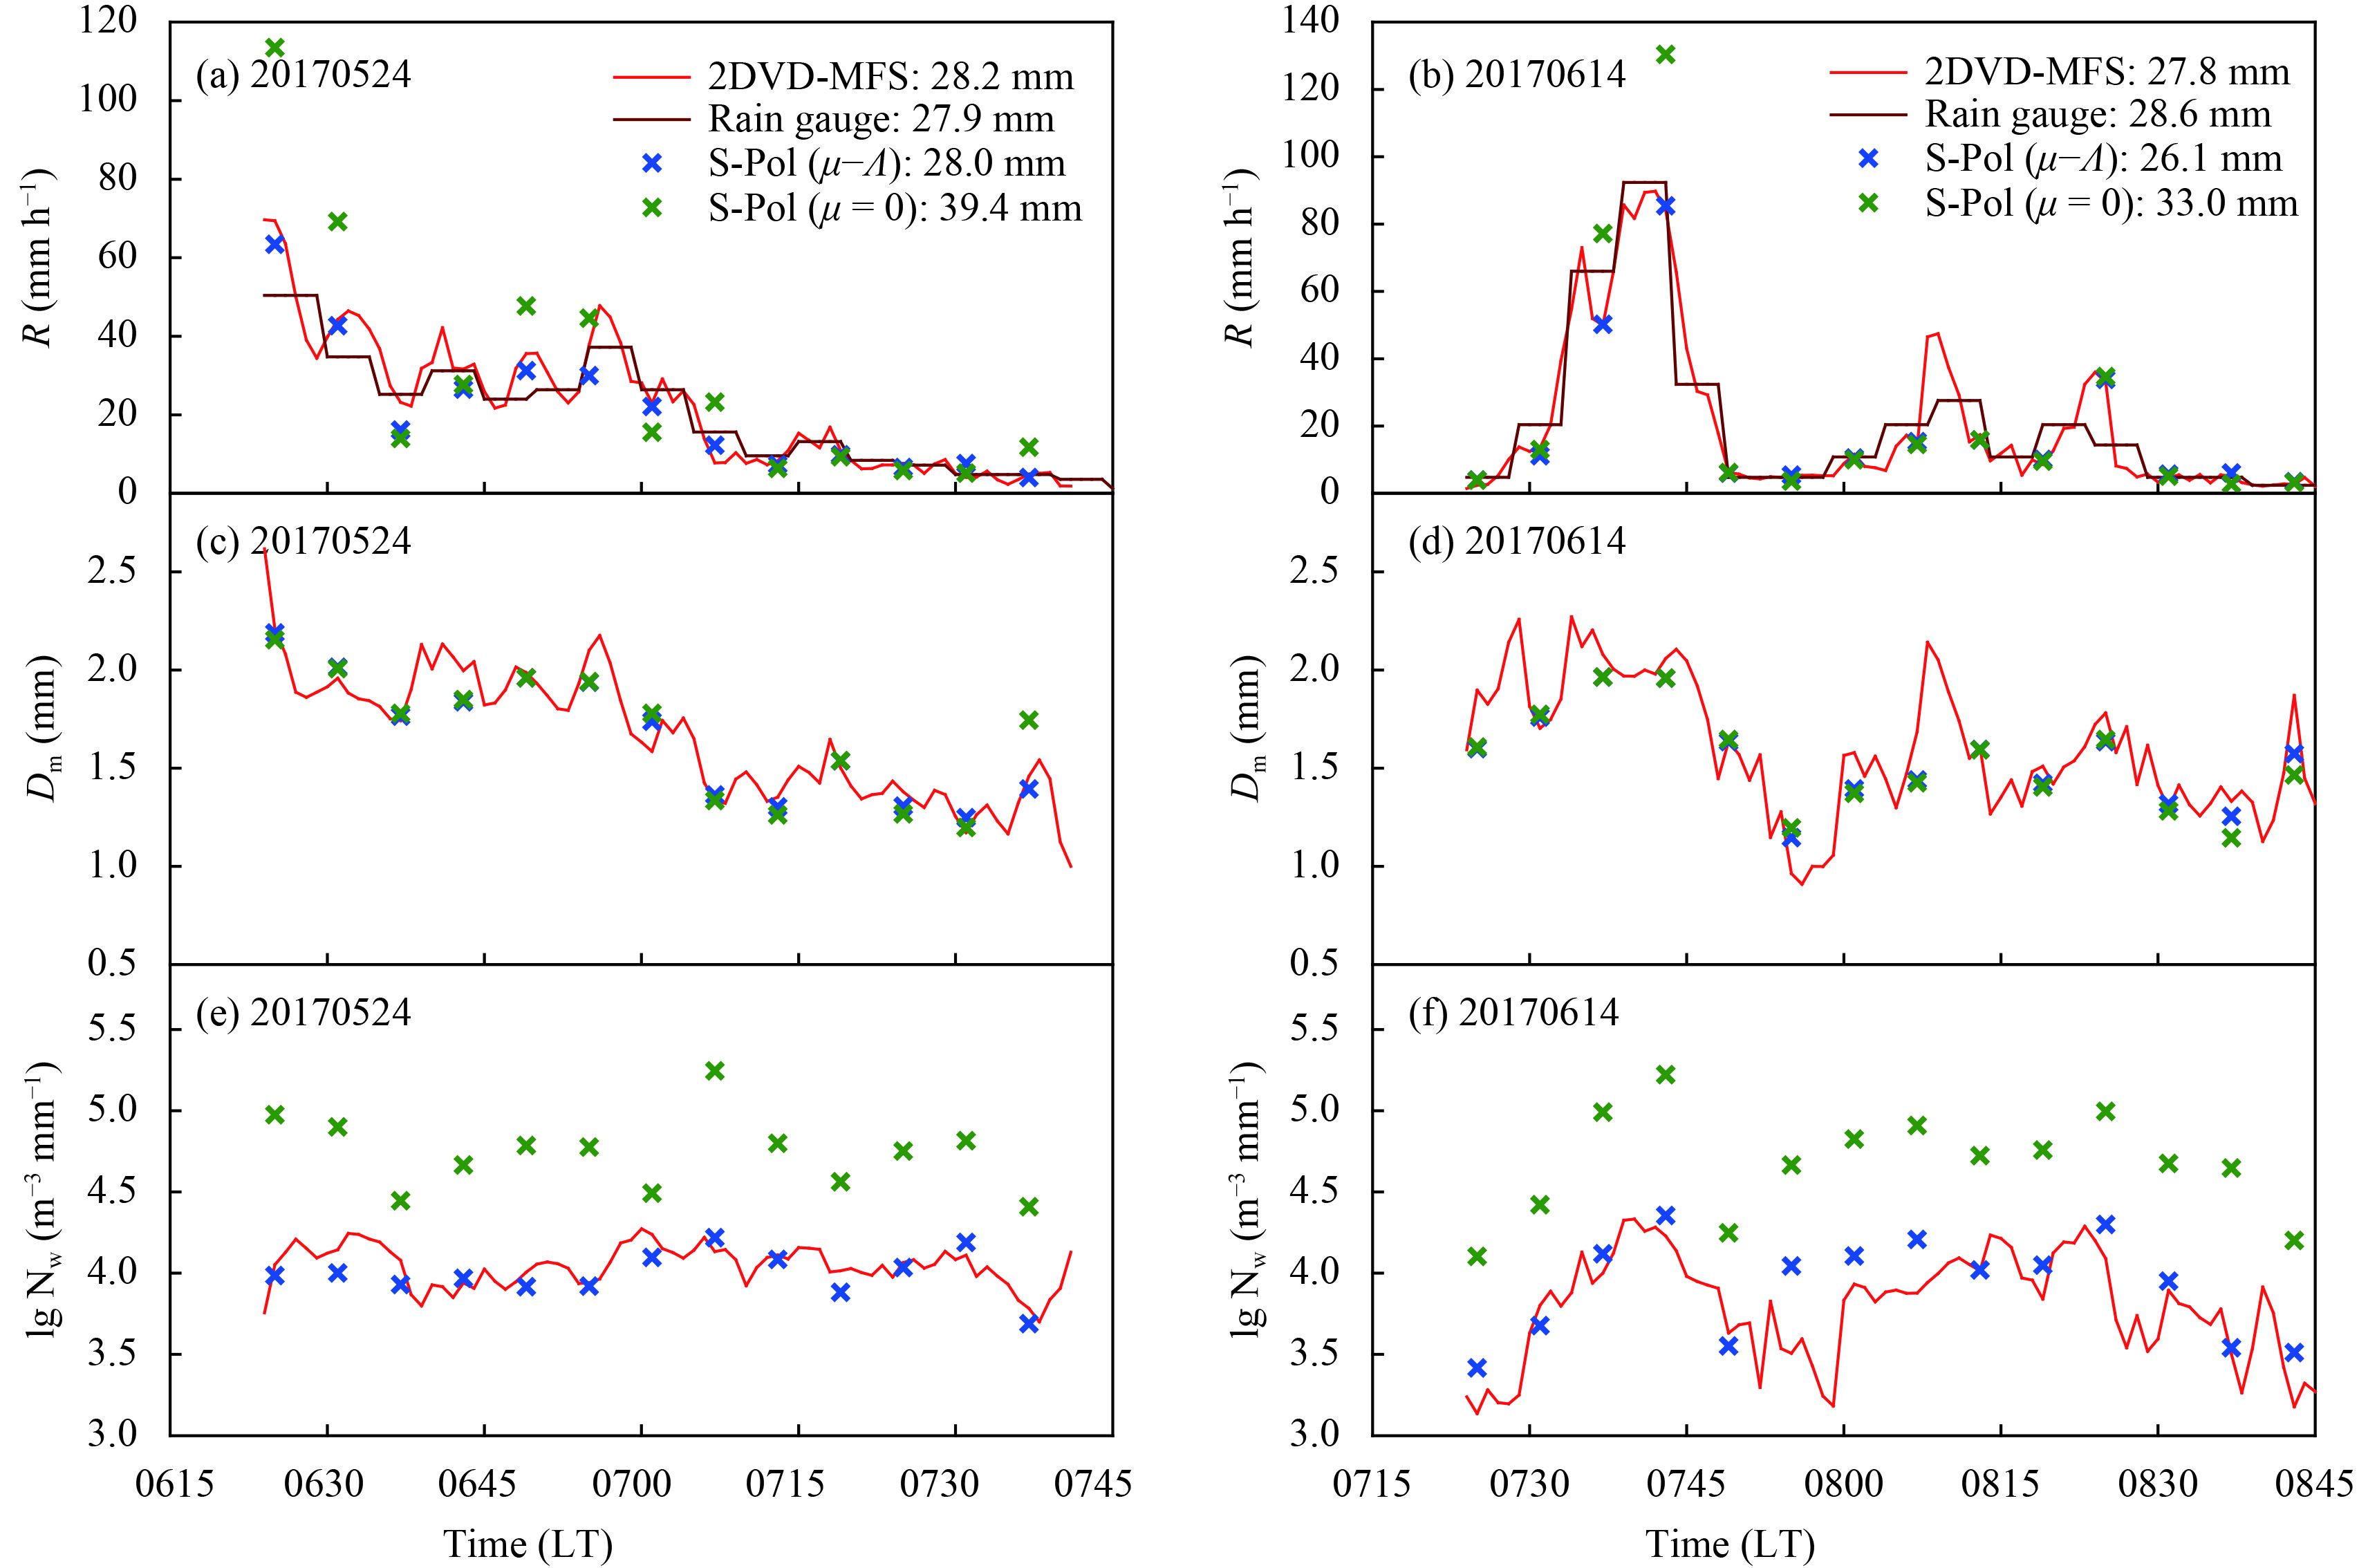
Variations of precipitation characteristic parameters (R, Dm, and Nw) observed by the Maofengshan 2DVD and retrieved by the Guangzhou polarimetric radar during two precipitation processes are shown in Fig. 9, along with 5-min precipitation observed by rain gauge at the Guangzhou Maofengshan Station. For comparative study, the DSD parameters are also retrieved with the exponential model (μ=0). Verifications enhanced by mean values, mean biases (MB), standard deviations (STD), and CC for precipitation process on 24 May 2017 and precipitation process on 14 June 2017 are shown in Table 3.
|
| Figure 9 Variations of precipitation characteristic parameters (R, Dm, and Nw) based on the Maofengshan 2DVD measurements (red line), rain gauge observations (dark red line), and retrievals of the Guangzhou polarimetric radar from μ–Λ relation (blue fork) and exponential model (green fork) during the precipitation process on 24 May 2017 are shown in (a, c, e), respectively; those on 14 June 2017 are shown in (b, d, f), respectivly. |
| 20170524 | 20170614 | ||||||
| R (mm h–1) | Dm (mm) | lg Nw | R (mm h–1) | Dm (mm) | lg Nw | ||
| 2DVD distrometer | |||||||
| Mean | 22.5 | 1.67 | 4.05 | 19.5 | 1.64 | 3.76 | |
| STD | 16.6 | 0.328 | 0.110 | 22.2 | 0.294 | 0.316 | |
| Rain guage | |||||||
| Mean | 21.2 | 20.3 | |||||
| Radar: μ–Λ | |||||||
| Mean | 21.5 | 1.66 | 3.99 | 18.8 | 1.55 | 3.93 | |
| MB | 1.0 | –0.014 | –0.054 | –0.7 | –0.093 | 0.158 | |
| STD | 16.6 | 0.306 | 0.133 | 22.4 | 0.225 | 0.304 | |
| CC | 0.97 | 0.96 | 0.81 | 0.99 | 0.90 | 0.85 | |
| Radar: μ = 0 | |||||||
| Mean | 30.3 | 1.68 | 4.74 | 23.6 | 1.53 | 3.92 | |
| MB | 7.8 | 0.003 | 0.693 | 4.1 | –0.108 | 0.158 | |
| STD | 30.5 | 0.310 | 0.223 | 35.2 | 0.246 | 0.304 | |
| CC | 0.89 | 0.92 | 0.34 | 0.98 | 0.85 | 0.84 | |
During the precipitation process on 24 May 2017, Dm significantly decreases with the decrease of rain rate while Nw slightly changes with the rain rate. During the precipitation process on 14 June 2017, the values of Dm and Nw are high for heavy rainfall and low for light rainfall. The Dm and Nw retrieved from Guangzhou polarimetric radar observations by using the C-G method can well reflect the above different characteristics of the two precipitation processes, which feature variation trends that are basically consistent with the observation result of the 2DVD. The Dm retrieved results from the exponential model can also reflect the trends of the two precipitation processes except for a few moments, but the Nw values are obviously higher than the 2DVD observations.
The Dm and Nw retrieved from Guangzhou polarimetric radar observations by using the C-G method can well reflect the trend characteristics of the two precipitation processes. The QPEs of polarimetric radar are very close to the 2DVD and rain gauge measurements, with relative errors of less than 10%. The correlation coefficients of Dm are both higher than 0.90, and higher than 0.80 for Nw. The mean biases of Dm and Nw are minor for both of the two processes. The standard deviation of 2DVD observation results and S-pol retrieved results are also nearly the same both for Dm and Nw when comparing the same process. Thus, the precipitation characteristic parameters (R, Dm, and Nw) observed by Maofengshan 2DVD and retrieved by Guangzhou polarimetric radar based on the C-G method have basically the same trends, the errors of accumulated precipitation are small and the mean values of Dm and Nw from retrieved DSDs are close to 2DVD measurements.
For the exponential model, the QPEs of polarimetric radar are higher than the 2DVD and rain gauge measurements. The Dm retrieved results from the exponential model can reflect the trends of the two precipitation processes except for a few moments, but the Nw values are obviously higher than 2DVD observations.
Assuming various bias errors in ZHH (± 1 dBZ) and ZDR (± 0.1 dB), several QPE experiments are carried out and summarized. As shown in Table 4, the C-G DSD retrieval method is sensitive to measurement errors. The mean of the QPE results in Table 4 indicates that averaging of statistical fluctuations in the ZHH andZDR measurements can cause a small overestimate of the rainfall (about 3%).
| 20170524 | 20170614 | ||||||
| ZHH – 1 dBZ | ZHH | ZHH + 1 dBZ | ZHH – 1 dBZ | ZHH | ZHH + 1 dBZ | ||
| ZDR – 0.1 dB | 26.7 | 33.6 | 42.3 | 24.3 | 30.6 | 38.6 | |
| ZDR | 22.2 | 28.0 | 34.8 | 20.7 | 26.1 | 32.8 | |
| ZDR + 0.1 dB | 18.9 | 23.8 | 30.0 | 18.2 | 22.9 | 28.8 | |
In general, the accuracy of DSD parameters retrieved from the C-G method in this study is high, which lays a good foundation for further application of polarimetric radar data in microphysical process analysis and numerical weather prediction models.
5 Conclusions and discussionIn this study, the μ–Λ relationship has been analyzed based on 2DVD measurements for the first time in southern China. A Γ function DSD parameters retrieval scheme for the Guangzhou S-band polarimetric radar is constructed based on the C-G method. In this scheme, the three parameters (N0, μ, and Λ) of the Γ DSD function are retrieved from ZHH and ZDR detected by polarimetric radar.
Based on the observation results of the 2DVD at Huizhou Longmen Station from May to September 2016, the μ–Λ relationship of this region is Λ = 0.0241μ2 + 0.867μ + 2.453. The fitted curves are close to those proposed by Zhang et al. (2003). During six typical precipitation processes, the scattering of μ–Λ observed is consistent with the fitted curve, indicating that the statistical μ–Λ relationship has good applicability in this area.
Two precipitation processes in May and June 2017 were selected to verify the retrieval algorithm, and the examination results were systematically analyzed and compared with the 2DVD DSD measurements at Guangzhou Maofengshan Station. The results show that the simulated ZHH and ZDR based on 2DVD DSD measurements agree well with the Guangzhou radar observations, and the correlation coefficients are higher than 0.95. The Γ DSD function retrieved from polarimetric radar observations are nearly those of the 2DVD, with basically the same variation trends of the precipitation parameters (R, Dm, and Nw). The correlation coefficients are higher than 0.90 for R and Dm, and higher than 0.80 for Nw, with relative errors of less than 10%.
Overall, the retrieval scheme of the DSD by the Guangzhou S-band polarimetric radar based on the C-G method has high precision, and organically combines the polarimetric radar observations and the microphysical parameters. In addition, it can improve the observation operator of the convection-resolved model for data assimilation, and provide a new choice for improving the precision of the QPE algorithm of polarimetric radars.
Nevertheless, the scheme still has some shortcomings and needs further improvement. First, the data quality control of polarimetric radar, especially the precision of ZDR, still needs to be further improved to obtain high-reliability observations, which is critical for the retrieval scheme. Second, the sampling error of 2DVD measurements and the representation of the Γ function have not been considered in this study, resulting in low retrieval precision in some cases. Cao et al. (2008) proposed a method of sorting and averaging based on two parameters (SATP), effectively reducing the sampling error, improving the fitting precision of the μ–Λ relationship and further improving the retrieval precision. Third, this study only deal with Guangzhou polarimetric radar in the flood season, and it is necessary to study other regions in the different seasons to improve the applicability of the retrieval scheme.
| Bao, X. W., D. Wu, X. T. Lei, et al., 2017: Improving the extreme rainfall forecast of Typhoon Morakot (2009) by assimilating radar data from Taiwan Island and mainland China. J. Meteor. Res., 31, 747–766. DOI:10.1007/s13351-017-6007-8 |
| Beard, K. V., V. N. Bringi, and M. Thurai, 2010: A new understanding of raindrop shape. Atmos. Res., 97, 396–415. DOI:10.1016/j.atmosres.2010.02.001 |
| Berne, A., and W. F. Krajewski, 2013: Radar for hydrology: Unfulfilled promise or unrecognized potential?. Adv. Water Res., 51, 357–366. DOI:10.1016/j.advwatres.2012.05.005 |
| Brandes, E. A., G. F. Zhang, and J. Vivekanandan, 2003: An evaluation of a drop distribution-based polarimetric radar rainfall estimator. J. Appl. Meteor., 42, 652–660. DOI:10.1175/1520-0450(2003)042<0652:AEOADD>2.0.CO;2 |
| Brandes, E. A., G. F. Zhang, and J. Vivekanandan, 2004a: Drop size distribution retrieval with polarimetric radar: Model and application. J. Appl. Meteor., 43, 461–475. DOI:10.1175/1520-0450(2004)043<0461:DSDRWP>2.0.CO;2 |
| Brandes, E. A., G. F. Zhang, and J. Vivekanandan, 2004b: Comparison of polarimetric radar drop size distribution retrieval algorithms. J. Atmos. Oceanic Technol., 21, 584–598. DOI:10.1175/1520-0426(2004)021<0584:COPRDS>2.0.CO;2 |
| Bringi, V. N., G. J. Huang, V. Chandrasekar, et al., 2002: A methodology for estimating the parameters of a gamma raindrop size distribution model from polarimetric radar data: Application to a squall-line event from the TRMM/Brazil campaign. J. Atmos. Oceanic Technol., 19, 633–645. DOI:10.1175/1520-0426(2002)019<0633:AMFETP>2.0.CO;2 |
| Bringi, V. N., V. Chandrasekar, J. Hubbert, et al., 2003: Raindrop size distribution in different climatic regimes from disdrometer and dual-polarized radar analysis. J Atmos. Sci., 60, 354–365. DOI:10.1175/1520-0469(2003)060<0354:RSDIDC>2.0.CO;2 |
| Brown, B. R., M. M. Bell, and A. J. Frambach, 2016: Validation of simulated hurricane drop size distributions using polarimetric radar. Geophys. Res. Lett., 43, 910–917. DOI:10.1002/2015GL067278 |
| Bruintjes, R. T., 1999: A review of cloud seeding experiments to enhance precipitation and some new prospects. Bull. Amer. Meteor. Soc., 80, 805–820. DOI:10.1175/1520-0477(1999)080<0805:AROCSE>2.0.CO;2 |
| Cao, Q., and G. F, Zhang, 2009: Errors in estimating raindrop size distribution parameters employing disdrometer and simulated raindrop spectra. J. Appl. Meteor. Climatol., 48, 406–425. DOI:10.1175/2008JAMC2026.1 |
| Cao, Q., G. F. Zhang, E. Brandes, et al., 2008: Analysis of video disdrometer and polarimetric radar data to characterize rain microphysics in Oklahoma. J. Appl. Meteor. Climatol., 47, 2238–2255. DOI:10.1175/2008JAMC1732.1 |
| Cao, Q., G. F. Zhang, E. A. Brandes, et al., 2010: Polarimetric radar rain estimation through retrieval of drop size distribution using a Bayesian approach. J. Appl. Meteor. Climatol., 49, 973–990. DOI:10.1175/2009JAMC2227.1 |
| Chang, W. Y., T. C. Chen Wang, and P. L. Lin, 2009: Characteristics of the raindrop size distribution and drop shape relation in typhoon systems in the western Pacific from the 2D Video Disdrometer and NCU C-band polarimetric radar. J. Atmos. Oceanic Technol., 26, 1973–1993. DOI:10.1175/2009JTECHA1236.1 |
| Chen, B. J., J. Yang, and J. P. Pu, 2013: Statistical characteristics of raindrop size distribution in the Meiyu season observed in eastern China. J. Meteor. Soc. Japan, 91, 215–227. DOI:10.2151/jmsj.2013-208 |
| Gao, W. H., C. H. Sui, T. C. Chen Wang, et al., 2011: An evaluation and improvement of microphysical parameterization from a two-moment cloud microphysics scheme and the Southwest Monsoon Experiment (SoWMEX)/Terrain-influenced Monsoon Rainfall Experiment (TiMREX) observations. J. Geophys. Res. Atmos., 116, D19101. DOI:10.1029/2011JD015718 |
| Gorgucci, E., V. Chandrasekar, V. N. Bringi, et al., 2002: Estimation of raindrop size distribution parameters from polarimetric radar measurements. J. Atmos. Sci., 59, 2373–2384. DOI:10.1175/1520-0469(2002)059<2373:EORSDP>2.0.CO;2 |
| Hu, Z. Q., L. P. Liu, and L. L. Wu, 2014: Comparison among several system biases calibration methods on C-band polarimetric radar. Plateau Meteor., 33, 221–231. DOI:10.7522/j.issn.1000-0534.2013.00134 |
| Jin, Q., Y. Yuan, H. J. Liu, et al., 2015: Analysis of microphysical characteristics of the raindrop spectrum over the area between the Yangtze River and the Huaihe River during summer. Acta Meteor. Sinica, 73, 778–288. DOI:10.11676/qxxb2015.036 |
| Jung, Y., G. F. Zhang, and M. Xue, 2008: Assimilation of simulated polarimetric radar data for a convective storm using the ensemble Kalman filter. Part I: Observation operators for reflectivity and polarimetric variables. Mon. Wea. Rev., 136, 2228–2245. DOI:10.1175/2007MWR2083.1 |
| Jung, Y., M. Xue, and G. F. Zhang, 2010: Simulations of polarimetric radar signatures of a supercell storm using a two-moment bulk microphysics scheme. J. Appl. Meteor. Climatol., 49, 146–163. DOI:10.1175/2009JAMC2178.1 |
| Kruger, A., and W. F. Krajewski, 2002: Two-dimensional video disdrometer: A description. J. Atmos. Oceanic Technol., 19, 602–617. DOI:10.1175/1520-0426(2002)019<0602:TDVDAD>2.0.CO;2 |
| Kumjian, M. R., and A. V. Ryzhkov, 2010: The impact of evaporation on polarimetric characteristics of rain: Theoretical model and practical implications. J. Appl. Meteor. Climatol., 49, 1247–1267. DOI:10.1175/2010JAMC2243.1 |
| Liu, L. P., R. S. Ge, and P. Y. Zhang, 2002: A study of method and accuracy of rainfall rate and liquid water content measurements by dual linear polarization Doppler radar. Chinese J. Atmos. Sci., 26, 709–720. DOI:10.3878/j.issn.1006-9895.2002.05.12 |
| Liu, X. C., T. C. Gao, L. Liu, et al., 2013: Advances in microphysical features and measurement techniques of raindrops. Adv. Earth Sci., 28, 1217–1226. |
| Luo, Y. L., R. H. Zhang, Q. L. Wan, et al., 2017: The Southern China monsoon rainfall experiment (SCMREX). Bull. Amer. Meteor. Soc., 98, 999–1013. DOI:10.1175/bams-d-15-00235.1 |
| Ma, H., Q. L. Wan, Z. T. Chen, et al., 2008: Improving rainfall estimation by radar based on Z–I relation and variation-calibration method . J. Trop. Meteor., 24, 546–549. DOI:10.3969/j.issn.1004-4965.2008.05.016 |
| Marshall, J. S., and W. M. Palmer, 1948: The distribution of raindrops with size. J. Atmos. Sci., 5, 165–166. DOI:10.1175/1520-0469(1948)005<0165:TDORWS>2.0.CO;2 |
| Marzuki, W. L. Randeu, T. Kozu, et al., 2013: Raindrop axis ratios, fall velocities and size distribution over Sumatra from 2D-Video Disdrometer measurement. Atmos. Res., 119, 23–37. DOI:10.1016/j.atmosres.2011.08.006 |
| Michaelides, S., 2008: Precipitation: Advances in Measurement, Estimation and Prediction. Springer Press, Berlin Heidelberg, 540 pp |
| Schönhuber, M., G. Lammer, and W. L. Randeu, 2007: One decade of imaging precipitation measurement by 2D-video-distrometer. Adv. Geosci., 10, 85–90. DOI:10.5194/adgeo-10-85-2007 |
| Seliga, T. A., and V. N. Bringi, 1976: Potential use of radar differential reflectivity measurements at orthogonal polarizations for measuring precipitation. J. Appl. Meteor., 15, 69–76. DOI:10.1175/1520-0450(1976)015<0069:PUORDR>2.0.CO;2 |
| Tang, Q., H. Xiao, C. W. Guo, et al., 2014: Characteristics of the raindrop size distributions and their retrieved polarimetric radar parameters in northern and southern China. Atmos. Res., 135–136, 59–75. DOI:10.1016/j.atmosres.2013.08.003 |
| Tokay, A., W. A. Petersen, P. Gatlin, et al., 2013: Comparison of raindrop size distribution measurements by collocated disdrometers. J. Atmos. Oceanic Technol., 30, 1672–1690. DOI:10.1175/JTECH-D-12-00163.1 |
| Ulbrich, C. W., 1983: Natural variations in the analytical form of the raindrop size distribution. J. Appl. Meteor., 22, 1764–1775. DOI:10.1175/1520-0450(1983)022<1764:NVITAF>2.0.CO;2 |
| Vivekanandan, J., G. F. Zhang, and E. Brandes, 2004: Polarimetric radar estimators based on a constrained Gamma drop size distribution model. J. Appl. Meteor., 43, 217–230. DOI:10.1175/1520-0450(2004)043<0217:PREBOA>2.0.CO;2 |
| Wang, H., Q. L. Wan, J. F. Yin, et al., 2016: Application of the dual-polarization radar data in numerical modeling studies: Construction of the simulator. Acta Meteor. Sinica, 74, 229–243. DOI:10.11676/qxxb2016.017 |
| Wang, M. J., K. Zhao, M. Xue, et al., 2016: Precipitation microphysics characteristics of a Typhoon Matmo (2014) rainband after landfall over eastern China based on polarimetric radar observations. J. Geophys. Res. Atmos., 121, 12415–12433. DOI:10.1002/2016JD025307 |
| Wen, L., K. Zhao, G. F. Zhang, et al., 2016: Statistical characteristics of raindrop size distributions observed in East China during the Asian summer monsoon season using 2-D video disdrometer and Micro Rain Radar data. J. Geophys. Res. Atmos., 121, 2265–2282. DOI:10.1002/2015JD024160 |
| Williams, C. R., V. N. Bringi, L. D. Carey, et al., 2014: Describing the shape of raindrop size distributions using uncorrelated raindrop mass spectrum parameters. J. Appl. Meteor. Climatol., 53, 1282–1296. DOI:10.1175/JAMC-D-13-076.1 |
| Zhang, G. F., 2016: Weather Radar Polarimetry. CPC Press, Boca Raton, 18 pp |
| Zhang, G. F., J. Vivekanandan, and E. A. Brandes, 2001: A method for estimating rain rate and drop size distribution from polarimetric radar measurements. IEEE Trans. Geosci. Remote Sens., 39, 830–841. DOI:10.1109/36.917906 |
| Zhang, G. F., J. Vivekanandan, E. A. Brandes, et al., 2003: The shape-slope relation in observed Gamma raindrop size distributions: Statistical error or useful information?. J. Atmos. Oceanic Technol., 20, 1106–1119. DOI:10.1175/1520-0426(2003)020<1106:TSRIOG>2.0.CO;2 |
| Zhang, G. F., J. Z. Sun, and E. A. Brandes, 2006: Improving parameterization of rain microphysics with disdrometer and radar observations. J. Atmos. Sci., 63, 1273–1290. DOI:10.1175/JAS3680.1 |
| Zhang, X. Z., J. M. Chen, and P. Zhao, 2015: Impacts of Doppler radar data assimilation on the simulation of severe heavy rainfall events. J. Appl. Meteor. Sci., 26, 555–566. DOI:10.11898/1001-7313.20150505 |
| Zhu, Y. Q., and Y. B. Liu, 2013: Advances in measurement techniques and statistics features of surface raindrop size distribution. Adv. Earth Sci., 28, 685–694. DOI:10.11867/j.issn.1001-8166.2013.06.0685 |
 2018, Vol. 32


