The Chinese Meteorological Society
Article Information
- BI, Yanmeng, Qian WANG, Zhongdong YANG, et al., 2018.
- Validation of Column-Averaged Dry-Air Mole Fraction of CO2 Retrieved from OCO-2 Using Ground-Based FTS Measurements . 2018.
- J. Meteor. Res., 32(3): 433-443
- http://dx.doi.org/10.1007/s13351-018-7118-6
Article History
- Received August 7, 2017
- in final form December 14, 2017
Carbon dioxide (CO2) is one of the major anthropogenic greenhouse gases in the atmosphere. Its concentration has increased from 280 parts per million (ppm) in the pre-industrial period to more than 400 ppm today, mainly caused by human activities such as fossil fuel burning and land use changes. CO2 sources and sinks can be inferred with some limitations due to the sparseness of ground-based measurements. In order to improve human knowledge about the temporal and spatial variability of CO2 on continental and global scales, the feasibility of space-based CO2 measurements for global and regional carbon cycle studies have been explored in recent years (Hammerling et al., 2012; Guo et al., 2013; Tadić et al., 2015, 2017).
Space-based CO2 measurements need to achieve a high accuracy and precision to quantify CO2 sources and sinks on global and regional scales and to characterize their variability on seasonal timescales. According to requirement studies, XCO2 precisions of 1–2 ppm are needed on regional scales to improve our knowledge of carbon cycle (Miller et al., 2007). Both thermal infrared and near-infrared (NIR) bands can be utilized for remote sensing of atmospheric CO2 concentrations. Because observations of NIR bands have a high sensitivity near the earth’s surface, where the carbon sources and sinks are located, several satellite missions such as Scanning Imaging Absorption Spectrometer for Atmospheric Chartography (SCIAMACHY), Orbiting Carbon Observatory-2 (OCO-2), Greenhouse gases Observing SATellite (GO-SAT), and the global carbon dioxide observation satellite (TanSat), detect reflected sunlight in the NIR wavelength range to obtain the column-averaged atmospheric CO2 dry-air mole fraction (XCO2). Similar in viewing geometry and spectral range to OCO-2, TanSat is a China earth observation mission designed for remote sensing of CO2 with a high-resolution CO2 grating spectroradiome-ter, which consists of two NIR CO2 bands at 1.61 and 2.06 μm and an O2 A-band at 0.76 μm. It partly avoids the polarization problem that occurs for OCO-2 when flying over oceans (Bi et al., 2014). TanSat was successfully launched on 21 December 2016 (UTC) into a 700-km sun-synchronous orbit.
For these space-based missions remotely sensing atmospheric CO2, it is essential to validate the accuracy and precision of XCO2 data. Persistent geographic XCO2 biases arising at regional to continental scales have to be identified and corrected because they have the largest impact on readings of CO2 surface fluxes (Miller et al., 2007). Therefore, to correctly understand and remove potential errors in XCO2, space-based XCO2 retrievals have to be compared with measurements from reliable ground-based solar-viewing NIR Fourier Transform Spectrome-ter (FTS) instruments. Analysis and validation of retrie-val algorithms for demonstrating space-based measurements has been the subject of several studies (Bösch et al., 2006; Yokota et al., 2009; O’Dell et al., 2012). After OCO-2 XCO2 has been available, the validation has been widely performed (Osterman et al., 2015a; Worden et al., 2017; Wunch et al., 2017). Wunch et al. (2017) verified the manually filtered target OCO-2 XCO2 and the bias-corrected nadir and glint XCO2 data from 2014 to 2016 at TCCON sites. They presented an excellent analysis of XCO2 estimates at global scales. But XCO2 in some areas such as China, Mexico, and Brazil still needs to be investigated. Worden et al. (2017) validated the OCO-2 XCO2 products of version 7.
The main aim of the present work is to validate OCO-2 XCO2 data, especially in the Beijing area. This site is located in a typical urban area, which has been absent from previous studies. The OCO-2 XCO2 is validated according to different modes, i.e., nadir, target, and glint. Our validation method is different with previous works. We compare OCO-2 XCO2 data products of version 7R with those retrieved from collocated FTS instruments within the Total Carbon Column Observing Network (TCCON) and from an FTS in Beijing. The method developed here can be directly used in the validation of TanSat products. Biases and precisions in XCO2 data products retrieved from these satellites are investigated so that they can be correctly treated in flux studies.
This paper is organized as follows. Section 2 provides a brief overview of the data used in this study. Section 3 describes the method used to validate the OCO-2 XCO2 data products. Section 4 presents the statistical results comparing OCO-2 XCO2 data products of three observational modes with TCCON. Section 5 offers discussion and concluding thoughts.
2 Overview of OCO-2, TCCON, and their XCO2 data productsIn this section, we present an overview of the OCO-2 project, observation modes, and their data products, as well as TCCON and its data products.
2.1 OCO-2OCO-2 is a NASA mission dedicated to measuring CO2 with high precision and accuracy, which is needed to correctly quantify CO2 sources and sinks on regional scales and to characterize their variability on seasonal timescales (Crisp et al., 2004; Crisp, 2015). Currently, it flies in the EOS Afternoon Constellation (A-Train) on a 705-km sun-synchronous orbit after its launch in 2014. OCO-2 carries only one instrument that incorporates three-band imaging grating spectrometers measuring sunlight scattered and reflected by the earth’s surface or atmosphere in the NIR spectral region. Its viewing modes are nadir, glint, and target performed in dayside. Its calibration modes are solar, lunar, and lamp, which is performed in nightside or while passing the North Pole. The OCO-2 spectrometers collect 8 contiguous soundings over their surface swath at a rate of 3 Hz, yielding footprints with a resolution of approximately 2 km along its ground track and a cross-track resolution of approximately 1 km at nadir.
XCO2 data products, which are retrieved from the measured spectra of two NIR bands at 1.61 and 2.06 μm and an O2 A-band at 0.76 μm with a full physics retrie-val algorithm, have been available since March 2015. One of the advantages of using XCO2 rather than absolute total number of CO2 molecules in the columnar atmosphere is that the impact of topographic variations on CO2 concentration is taken into account so that the data can be compared between different areas. In addition to the quantity of main interest, XCO2, a large number of other atmospheric physical variables such as temperature, aerosols, clouds, and surface albedo are retrieved simultaneously based on optimal estimation. This can be done because the OCO-2 spectra, with a resolving power of > 17,000 in O 2 A-band and > 20,000 in the two CO 2 bands, hold relatively high information content. For more details about the OCO-2 level 2 retrieval algorithms, major components of which include the forward model and the inverse method, please refer to O’Dell et al. (2012) and the OCO-2 data user guide (Osterman et al., 2015b).
There are two different XCO2 data products available from the OCO-2 data archive (http://disc.sci.gsfc.nasa.gov/OCO-2): version 7 and version 7R. Products of version 7R have calibration coefficients that are believed to be of higher quality and developed based on data over longer time periods. Therefore, we use the OCO-2 standard geolocated XCO2 of version 7R to study the accuracy and precision of space-based XCO2. This is different from Worden et al. (2017) who used the version 7 OCO-2 XCO2 measurements.
2.2 Ground-based FTS measurementsTCCON is a network of ground-based FTSs that record spectra of the sun in the NIR band (Wunch et al., 2011). From these spectra, accurate and precise column-averaged abundances of atmospheric constituents are retrieved, including CO2, CH4, CO, N2O, and other molecules that absorb in the NIR band. TCCON could provide an essential validation resource for space-based measurements of reflected sunlight in the NIR region, such as OCO-2, GOSAT, and SCIAMACHY, as well as TanSat. Most TCCON sites are equipped with the same high resolution FTS which views the solar disk covering a wide spectral range with a much higher spectral resolution of 0.02 cm–1 in the NIR bands than those of OCO-2. XCO2 products across all the TCCON stations are obtained by using the nonlinear least squares spectral fitting algorithm developed at the Jet Propulsion Laboratory (Wunch et al., 2011).
The advantages of ground-based FTSs are their insensitivity to aerosols and surface reflections. These advantages allow them to serve as the main validation resource for space-based measurements. The FTS CO2 measurements have been extensively investigated by many researchers. They found that the precision of FTS CO2 column was better than 0.2% under clear sky conditions, and the bias of FTS was continuously removed through a comparison between TCCON and other platforms (Wunch et al., 2010, 2011). By comparing with TCCON XCO2 at four sites, Reuter et al. (2011) investigated the accuracy and precision of SCIMACHY XCO2 retrieved with the Bremen Optimal Estimation differential optical absorption spectroscopy algorithm. For the validation of GOSAT products, TCCON datasets have also been extensively used to quantify the quality of XCO2 data (Griffith et al., 2010).
2.3 Ground-based FTS measurements in Beijing, ChinaAll the previous studies do not provide any XCO2 error properties in the area of China. There is, however, a demand for this information in China. Although OCO-2 performs target mode during its orbits over Shanghai, China, no ground FTS is deployed in Shanghai. Fortunately, an FTS at Beijing has been operated by the NSMC since March 2016. The measurements represent a geographically urban region with high CO2 emissions in China. This site is located at 40.05°N, 116.28°E and is about 20 km northeast of the city center of Beijing.
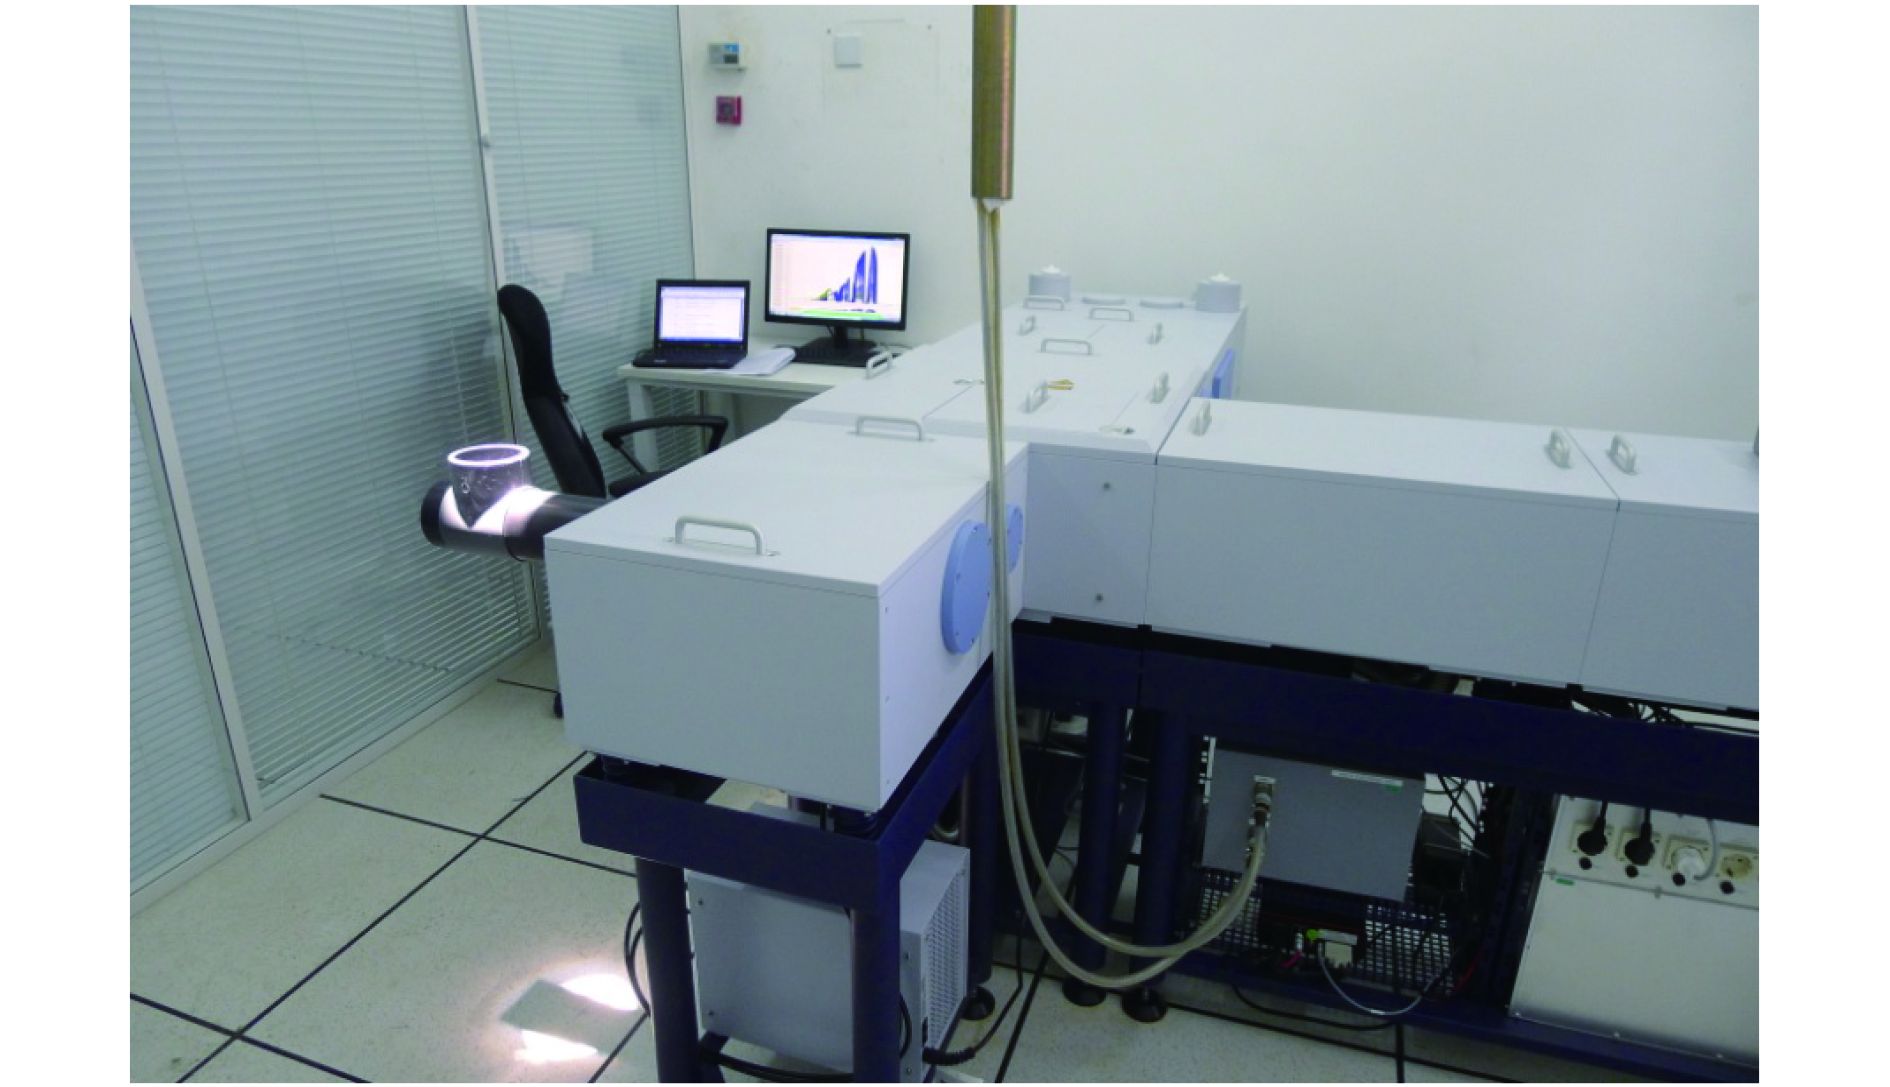
The measurements are acquired by an FTS 125HR instrument made by Bruker Optics GmbH (see Fig. 8). A high-precision camera-controlled solar tracker system is used to direct the solar beam into the FTS through a hole in the laboratory roof. The Optics User Software (OPUS version 7.5), a program provided by Bruker, is used to record the interferograms and calculate the spectra. For CO2 retrieval, the spectrometer here is optimized for measurements in the NIR spectral region. A CaF2 beamsplitter and room temperature InGaAs detector are able to cover the region from 4000 to 10,000 cm–1. The spectra are recorded with a 2.4-mrad field of view and a 45-cm maximum optical path difference (about 0.02 cm–1 spectral resolution), which are sufficient to resolve individual absorption lines in this region and optimal for a source photo noise limited detector in 6000–8000 cm–1 (Washenfelder et al., 2006; Wunch et al., 2011). To maintain stability of the optical alignment, laboratory room temperature is controlled be-tween 26 and 29°C, and internal pressure of the spectrometer is maintained at less than 2 hPa.
To compute the total column amount of the gases of interest from the spectra, a software package named PROFIT is used to compute the total column amount of CO2 from the spectra centered at 6228 and 6348 cm–1 (Hase et al., 2004). More details can be found in Hase et al. (2004). For CO2 retrieval, we assume that shapes of the gas profiles are known and we simply scale these priori profiles. The pressure, temperature, and water vapor profiles were obtained from Modern-Era Retrospective Reanalysis for Research and Application data provided by the NASA’s Global Modeling and Assimilation Office (Wargan and Coy, 2016), and interpolated in measurement time from six hourly data. Same as the TCCON procedure, the total CO2 column was calculated from two bands centered at 6228 and 6348 cm–1, while the total O2 column was analyzed from the band centered at 7882 cm–1.
3 Validation methodAs pointed out by Bösch and others, validations of XCO2 retrieved from satellite data are essential because clouds, aerosols, and the surface can introduce potential errors. In this work, we use a validation method similar to that of previous studies (Bösch et al., 2006; Griffith et al., 2010). The collocated FTS observations from the same bands are utilized as the ground truth of XCO2 to validate the space-based XCO2. We have assembled XCO2 retrieved from OCO-2 spectra according to nadir, target, and glint modes and from correlative ground-based FTS at up to eight TCCON sites.
XCO2 values retrieved from OCO-2 and ground-based FTS are not measured exactly at the same position. The first step in the validation procedure was therefore to select the OCO-2 orbits that just pass or point towards the TCCON sites. For the validation of SCIMACHY XCO2, Reuter et al. (2011) selected those pixels within a distance up to 350 km around an FTS site. For GOSAT XCO2, Morino et al. (2011) used GOSAT data within about a ±0.5–1.5° rectangular area centered at an FTS site. For OCO-2 XCO2, Wunch et al. (2017) chose a box centered on an FTS site that spans 5° in latitude and 10° in longitude. In this study, we generally select XCO2 of OCO-2 in nadir and glint modes that pass over TCCON stations within a distance range of ±1° latitude/longitude, which is a tight condition compared with those comparison criteria adopted by GOSAT, SCIMACHY, and OCO-2. Our strict criteria were obtained from range calculation (see Fig. 1). FTS can usually observe the atmosphere when the solar elevation angle is greater than a threshold, for example, angle of 15°. The top of atmosphere is assumed to be 30 km. Therefore, FTS can represent the mean concentration in about ±111 km, i.e., approximately ±1° latitude/longitude. Generally, when OCO-2 passes over this ±1° area, these measurements can be selected to compare with FTS results in our study.

|
| Figure 1 FTS viewing geometry for range estimation. |
The opportunities of overpasses just over a site in nadir or glint observing mode are very scarce due to the small field-of-view size of OCO-2. Hence, for some scenes, the distances have to be extended to ±2° to find suitable OCO-2 overpasses. However, if a TCCON site is selected as a target by OCO-2, distances of 0.5° are adequate because all of the OCO-2 observations point towards this site and the footprint size will not exceed a 10-km2 area even at large viewing angles (approximately 60°). OCO-2’s instrument collects up to 8 soundings along its ground cross-track swath (approximately 10 km) at 3.0 Hz, yielding 24 soundings per second and up to 390 soundings over each 1° latitude along its orbit track. In all observing modes, clouds in the atmosphere are the main reason for reducing the number of available CO2 measurements over sites. All the OCO-2 measurements located in the selected areas were averaged to result in an XCO2 value. The standard deviations (1σ) of these measurements were taken as the precision in OCO-2 XCO2.
Secondly, the difference regarding observing time should be taken into account for comparison between the ground-based measurements and the space-based measurements. TCCON data within ±30 min centered at the time of OCO-2 overpasses were averaged as the truth value of XCO2. These processes allow product comparisons between OCO-2 and TCCON. Biases in OCO-2 XCO2 can be calculated against the average of TCCON XCO2.
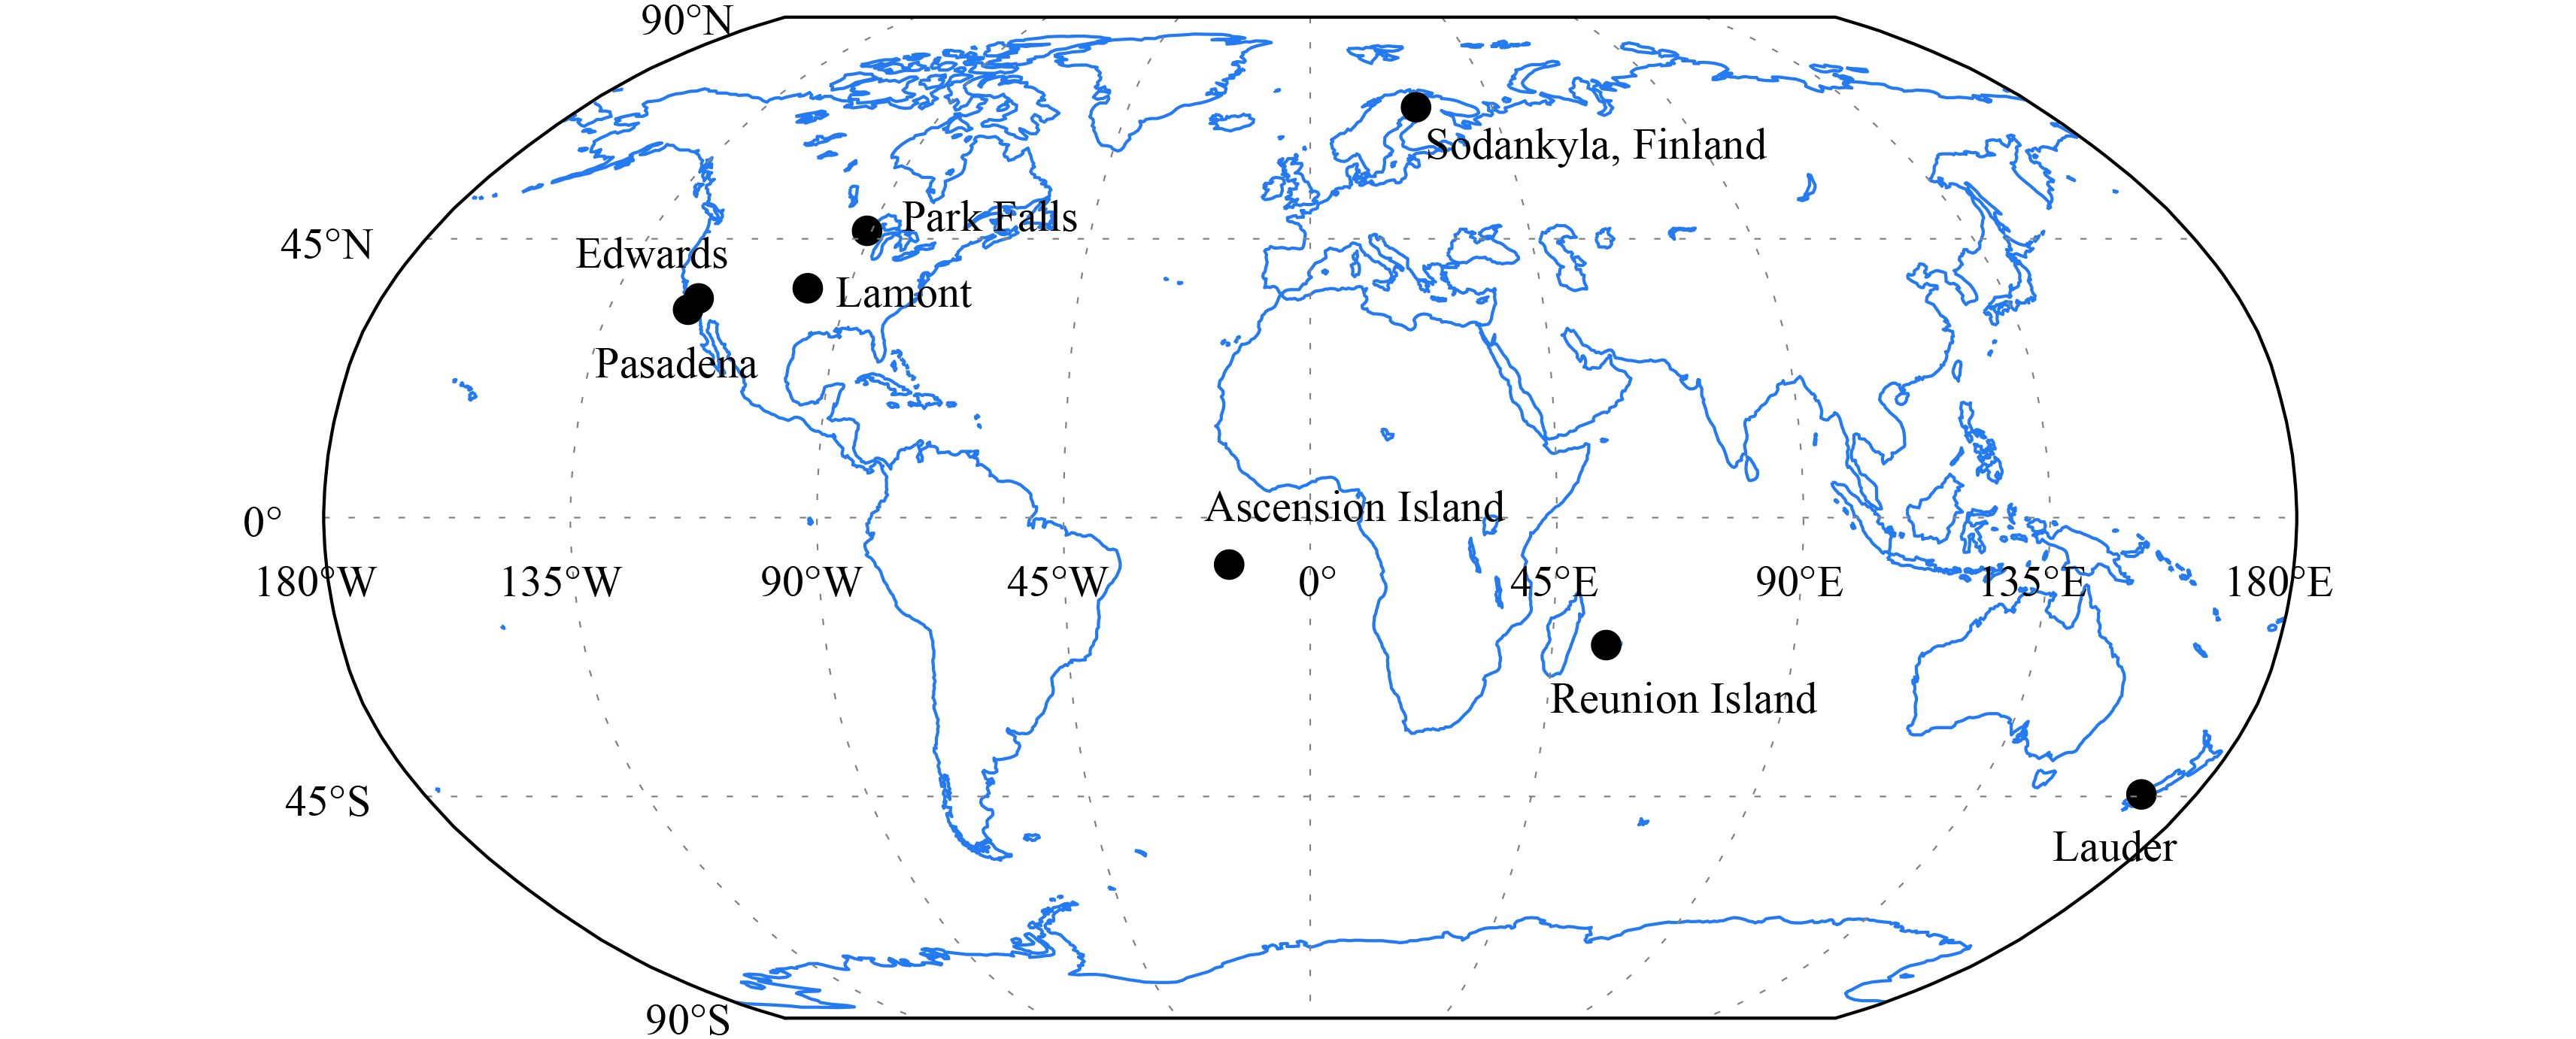
It should be noted that not all TCCON FTS XCO2 data were available and only the data from eight sites are available when this study was carried out. The available data was delayed by about six months. Figure 2 displays the distributions of TCCON sites used to validate OCO-2 XCO2. The detailed information of these TCCON sites is shown in Table 1.
|
| Figure 2 Distribution of TCCON sites used to validate OCO-2 XCO2 in this study. |
| Site | Lamont | Lauder | Park Falls | Sodankylä | Ascension Island | Edwards | Caltech/Pasadena | Reunion Island |
| Loc. (°) | 36.60N | 45.04S | 45.95N | 67.37N | 7.93S | 34.96N | 34.14N | 20.90S |
| 97.49W | 169.68E | 90.27W | 26.63E | 14.42W | 117.88W | 118.13W | 55.49E | |
| Alt. (m) | 320 | 370 | 442 | 188 | 32 | 700 | 230 | 87 |
We use the random error as precision, and bias error as accuracy. The uncertainty error in XCO2 with the FTS observation is about 0.8 ppm. For detailed comparison and analysis of TCCON FTS, please see Wunch et al. (2010) and Griffith et al. (2010). Here, the XCO2 from FTS is simply treated as the truth in the comparison. In the comparison, if the OCO-2 measurements have biases greater than 10 ppm as well as standard deviations larger than 15 ppm, they are treated as outliers and excluded from the comparison.
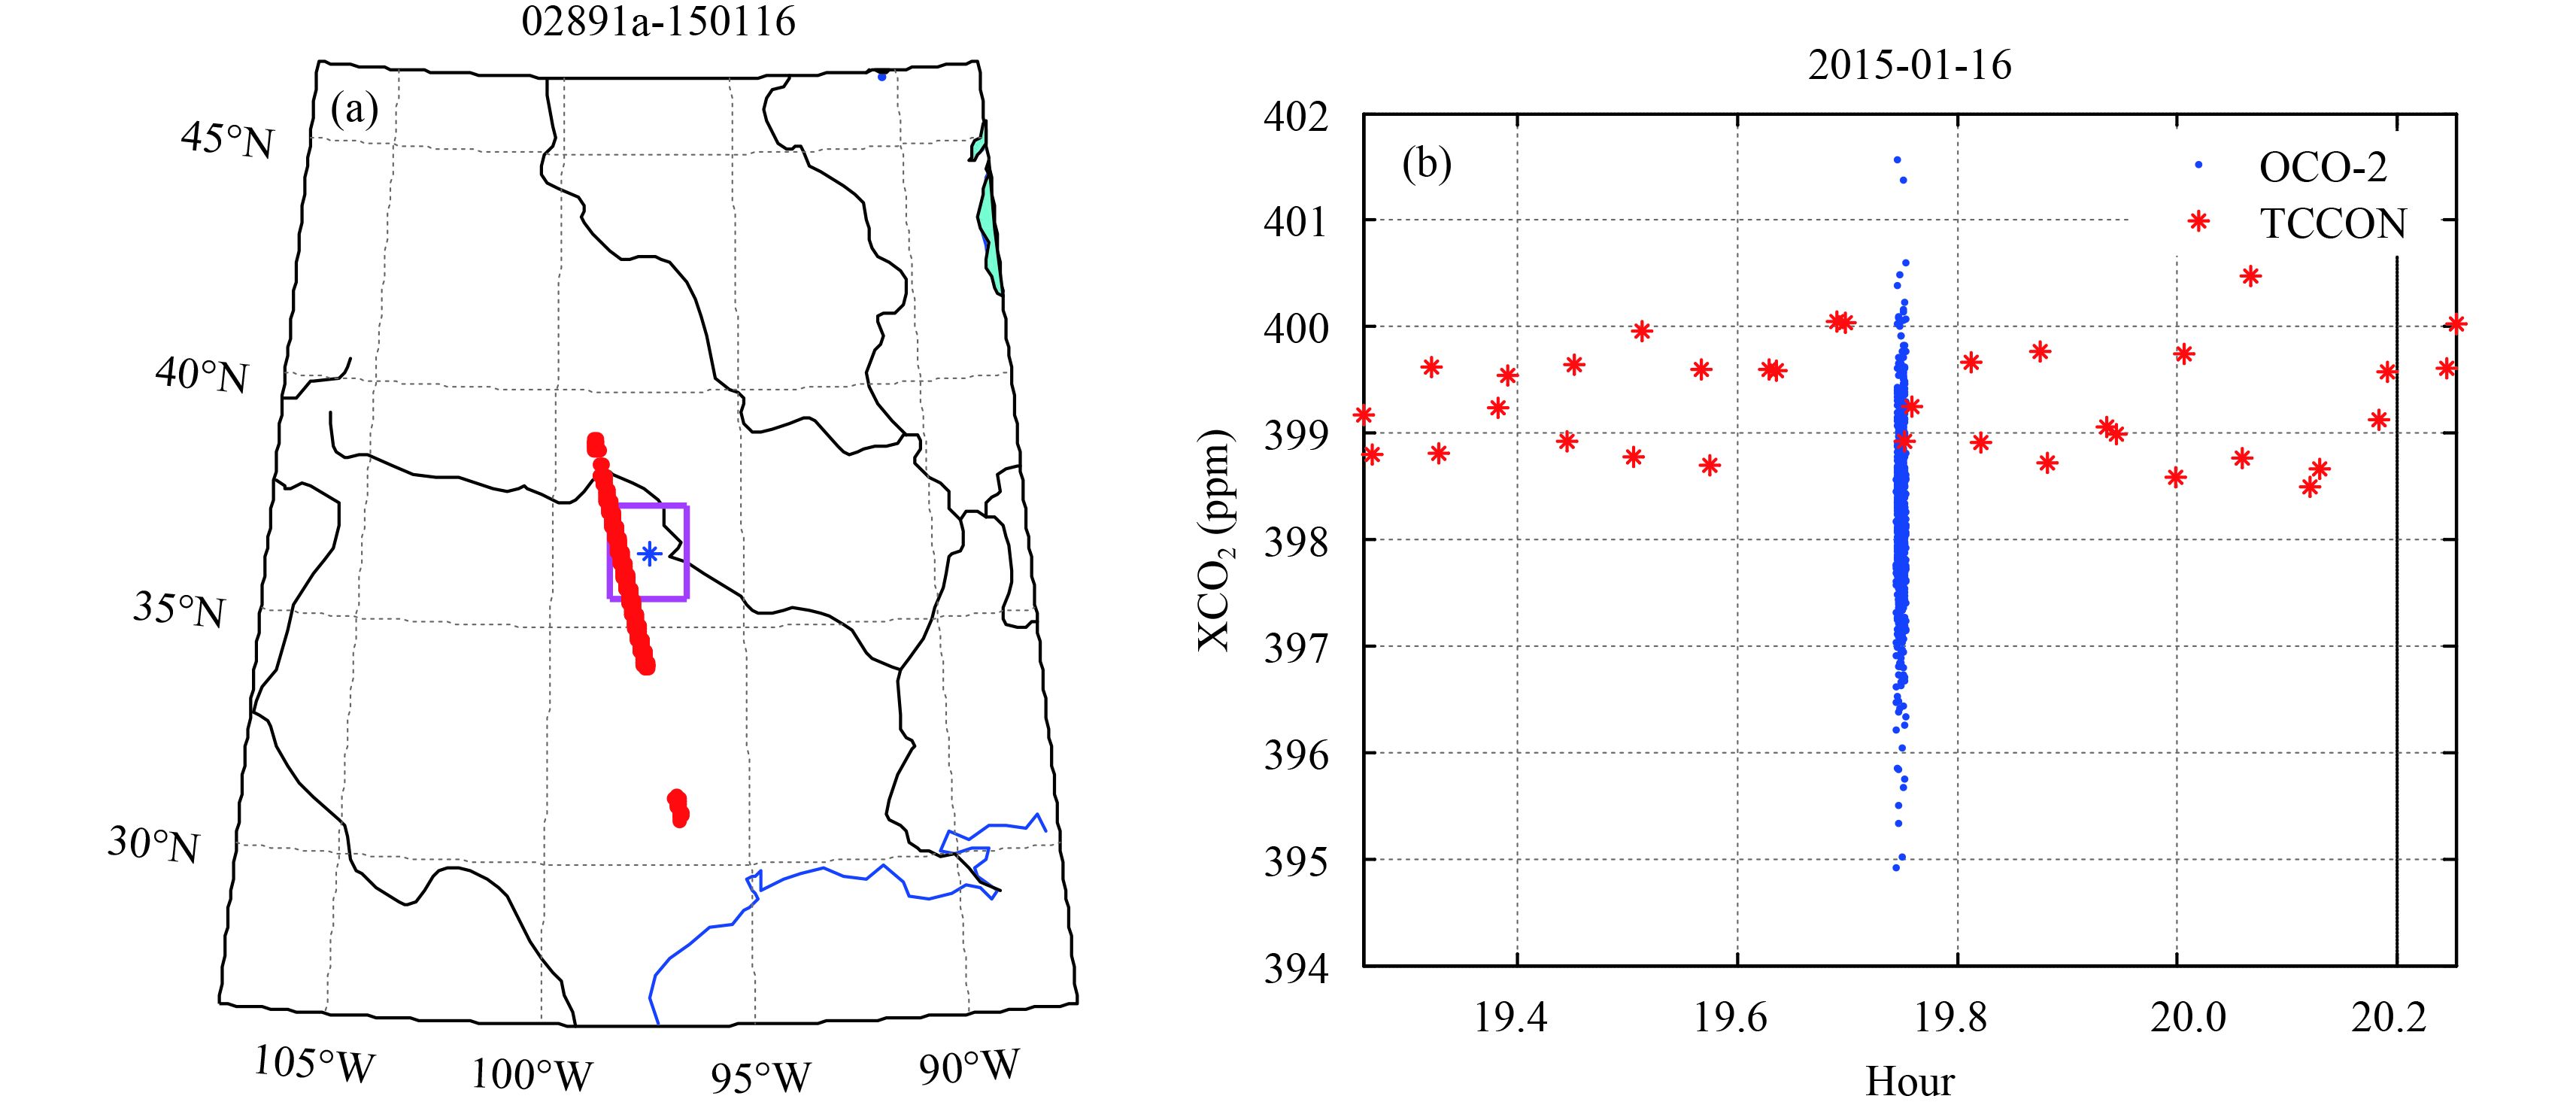
4 Results 4.1 Validation in nadir modeIn OCO-2’s nadir observing mode, we obtained about 1-4 overpasses suitable for comparison except at the Ascension site where no collocated data was found in the six months selected. A typical example of OCO-2’s orbit in nadir mode in the region of Lamont can be seen in Fig. 3. The region of ±1° centered at the Lamont site is represented by the rectangle where the OCO-2’s footprint of orbit 02891 passed on 16 January 2015. The length of time for OCO-2 passing the region is about 2 min. During this short period, there are only one or two FTS XCO2 measurements available that are approximately 399 ppm, because the time resolution of FTS is lower than that of OCO-2. As mentioned earlier, OCO-2 has a higher temporal resolution of 0.33 s and more spatial samplings in the region, which can both lead to the XCO2 measurement being greater than those of TCCON XCO2. In this case, there were approximately 20 times of OCO-2 data relative to TCCON data. The average of OCO-2 XCO2 was 398.22 ppm with a standard deviation of 0.85 ppm, showing a good quantitative agreement between OCO-2 and FTS at the Lamont site.
|
| Figure 3 (a) Map of the OCO-2 orbit (dotted line) in nadir mode in the region of Lamont (rectangle: 1° x 1°; asterisk: FTS position). (b) Time series of XCO2 retrieved from OCO-2 nadir measurements and FTS spectra at Lamont on 16 January 2015. |
In order to characterize the temporal variability of XCO2, Fig. 3 also shows the FTS XCO2 within ±0.5 h of the OCO-2 overpass time. During this 1-h period, FTS XCO2 varies with a range of about 2 ppm. The average and the standard deviation of FTS XCO2 are about 399.01 and 0.71 ppm, respectively, which demonstrates a minor variability of approximately 0.2% in XCO2 during this period.
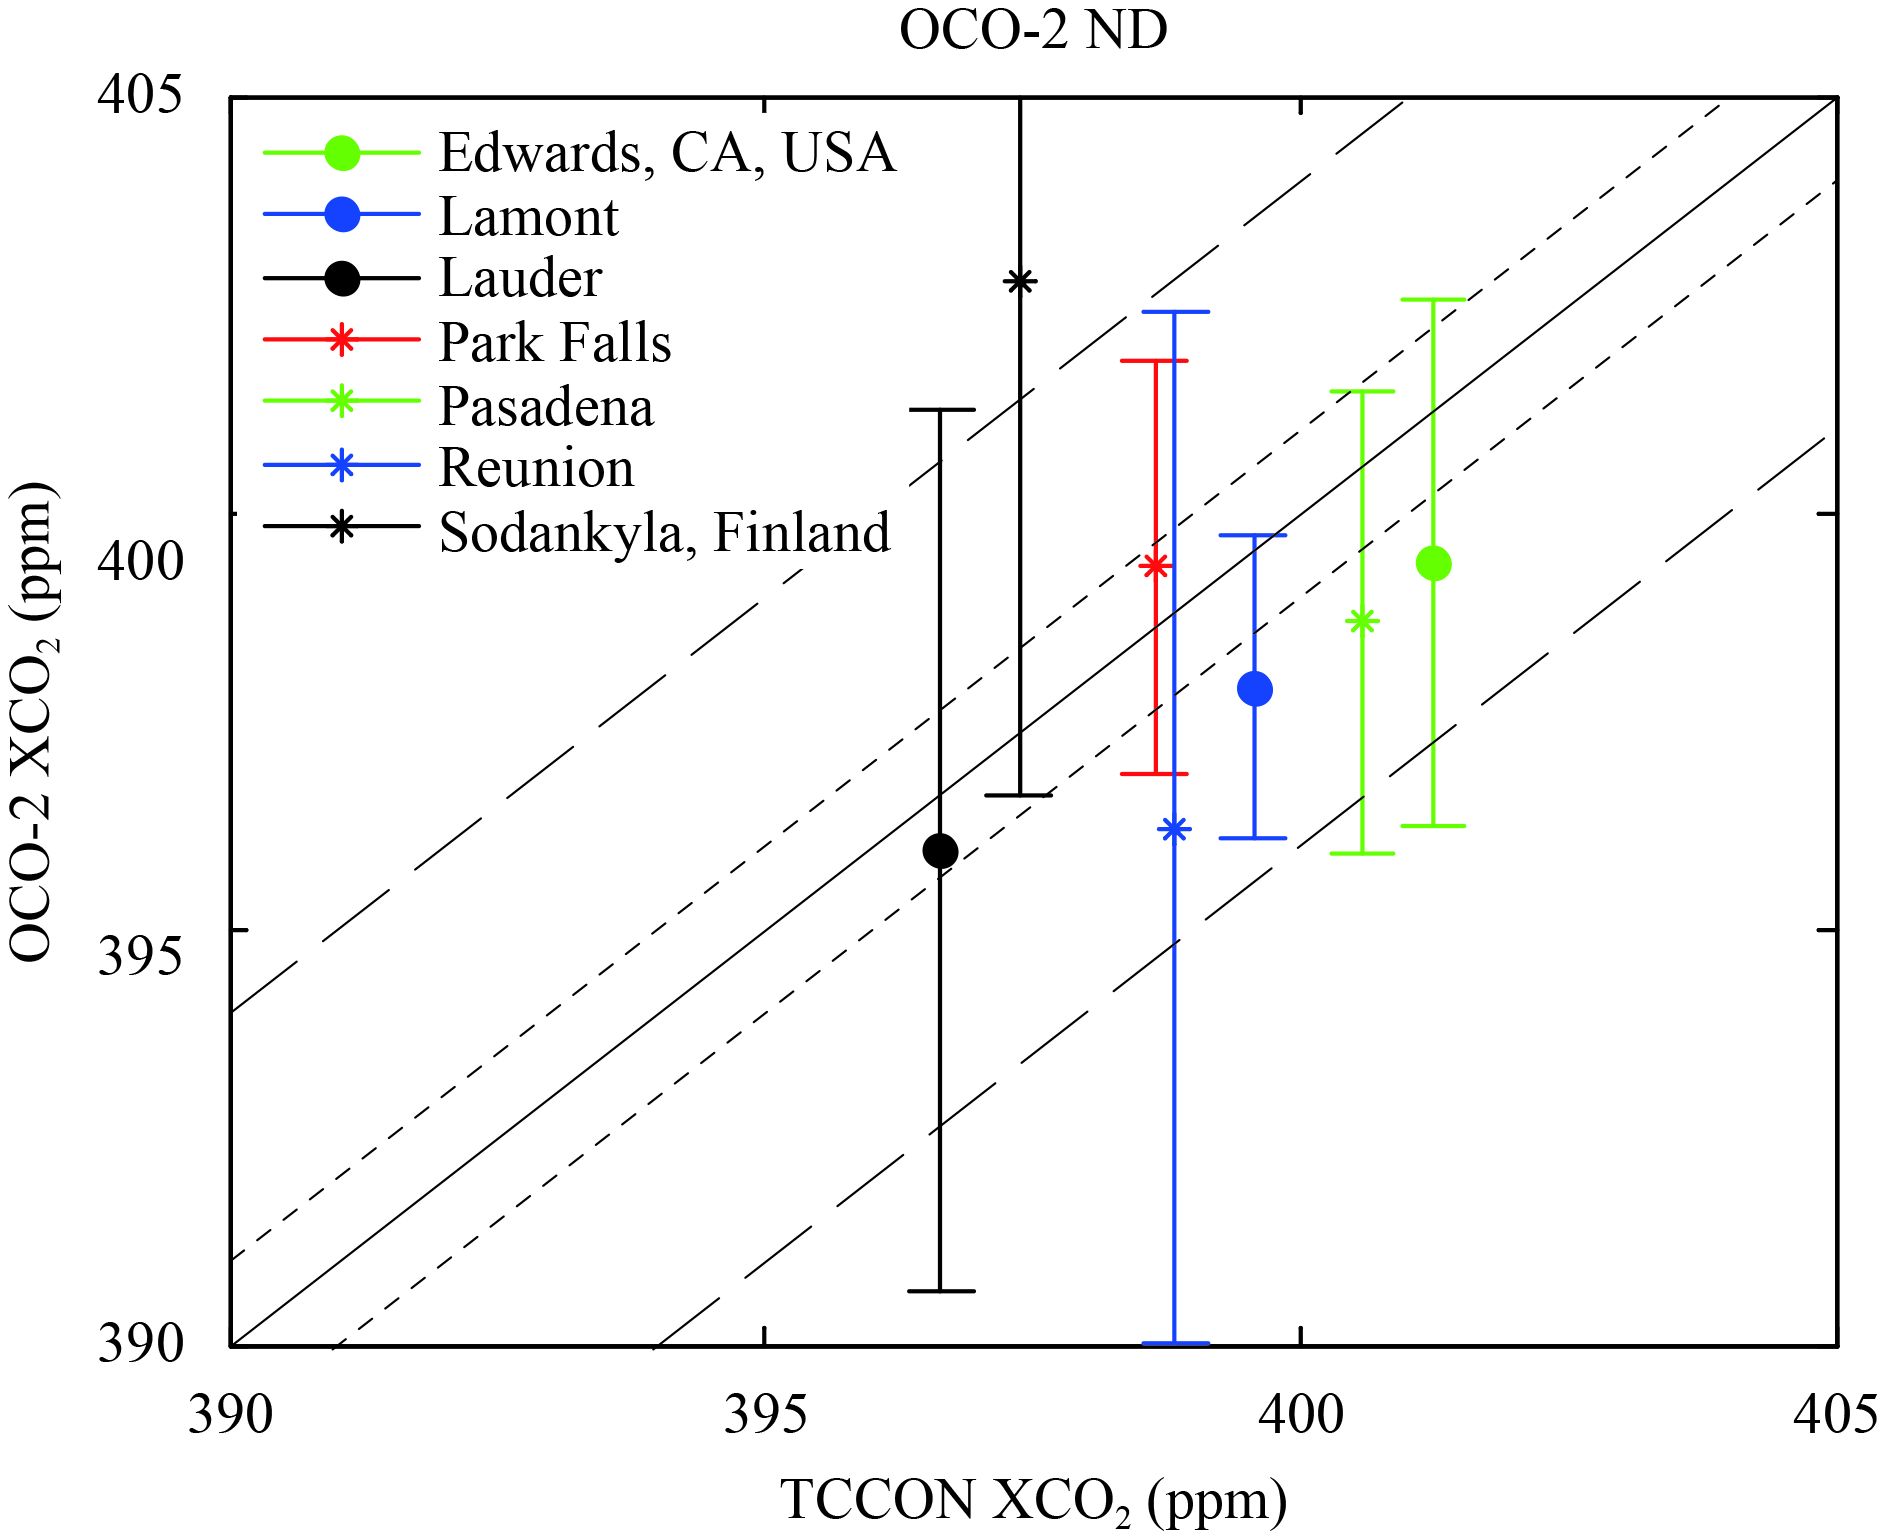
Figure 4 demonstrates all the comparisons of XCO2 products between OCO-2 and seven TCCON FTSs. The accuracy and precision in OCO-2 XCO2 are clearly different among these TCCON sites. The biases range from 1.2 to 3.5 ppm except at Sodankylä, Finland. Overall, OCO-2 XCO2 has a systematic negative bias at most of the TCCON sites except the sites of Park Falls and Sodankylä. The systematic biases may be attributed to the retrieval algorithm and need further investigation. Table 2 lists statistical results of the difference between OCO-2 and TCCON. Among all the selected TCCON sites, OCO-2 XCO2 at Lamont shows the best agreement with that of FTS. Errors in XCO2 at the Sodankylä site at latitude 67.37°N are very suspicious due to only one collocated data point.
|
| Figure 4 Comparison of XCO2 retrieved from OCO-2 in nadir mode and TCCON FTS from January to June 2015. The error bars show 1σprecision in OCO-2 XCO2. The short-dashed lines and the long-dashed lines represent 1 and 4 ppm, respectively. |
| Site | Num. of colloc. data | Bias (ppm) | 1σ (ppm) |
| Edwards | 3 | –1.87 | 3.16 |
| Lamont | 14 | –1.66 | 1.81 |
| Lauder | 6 | –0.71 | 5.31 |
| Pasadena | 8 | 0.70 | 2.50 |
| Park Falls | 12 | –1.89 | 2.77 |
| Reunion Island | 3 | –2.62 | 6.20 |
| Sodankylä | 3 | 5.39 | 6.17 |
|
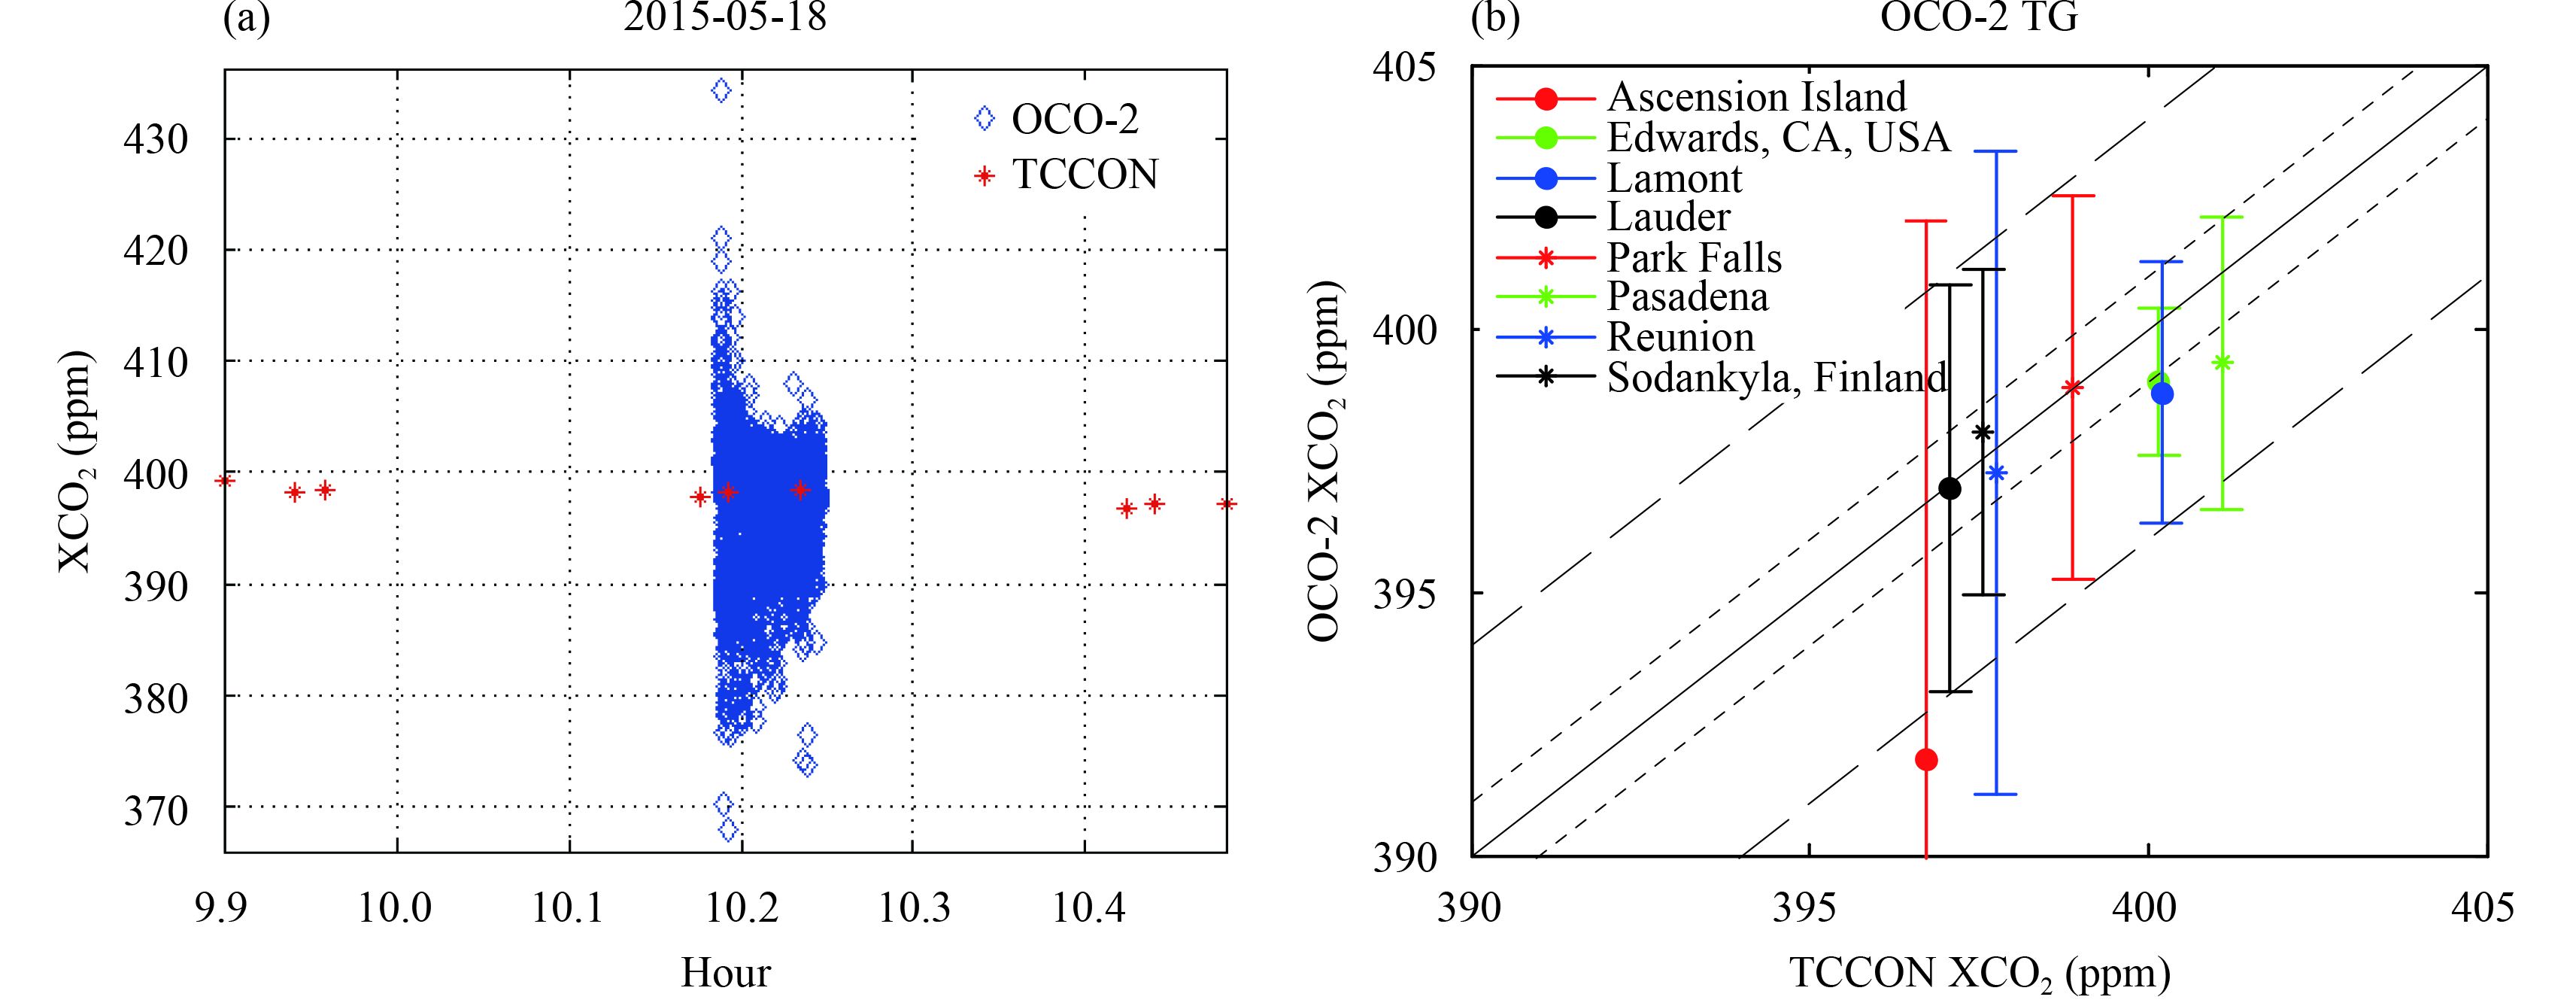
| Figure 5 (a) Number of XCO2 measurements retrieved from OCO-2 in target mode and FTS at the Reunion site on 18 May 2015. (b) Comparison of XCO2 retrieved from OCO-2 and TCCON FTS from January to June 2015. The error bars show 1σ precision in OCO-2 XCO2. The short-dashed lines and the long-dashed lines represent 1 and 4 ppm, respectively. |
| Site | Num. of colloc. data | Bias (ppm) | 1σ (ppm) |
| Ascension | 1 | –4.9 | 10.23 |
| Edwards | 5 | –1.16 | 1.39 |
| Lamont | 7 | –1.42 | 2.48 |
| Lauder | 4 | –0.12 | 3.86 |
| Park Falls | 4 | –0.02 | 3.63 |
| Pasadena | 6 | –1.74 | 2.78 |
| Reunion Island | 4 | –0.49 | 6.11 |
| Sodankylä | 2 | 0.48 | 3.09 |
Target mode is designed to observe specific surface targets when the satellite flies over these sites. If one site is selected as the target, this mode will provide a large number of measurements towards this site. Figure 5a illustrates the number of OCO-2 XCO2 measurements generated by using this mode at Reunion Island on 18 May 2015. It can be seen that there are a large number of XCO2 and a few FTS XCO2 measurements.
The number of collocated XCO2 data in this mode over TCCON sites should be obviously greater than that in nadir or glint mode. But at some sites, biases as large as 29 ppm in OCO-2 XCO2 have been found and treated as clear outliers such as days 25 and 137 in 2015 at the Lamont site. At Ascension Island, two overpasses of OCO-2 met the spatial and temporal coincidence criteria. But the one on 24 February 2015 was flagged due to larger biases and standard deviations. These data have been excluded from the comparison with TCCON FTS. Figure 5 presents the final comparisons of XCO2 retrieved from TCCON FTS and OCO-2 in target mode. For this case in Fig. 5a, FTS XCO2 at the Reunion site has minor variation during one hour, while OCO-2 XCO2 shows large variation. This site is a lower-latitude site located on small islands remote from large landmasses, but the topography significantly varies. The surface properties and elevations can introduce errors in the OCO-2 XCO2 retrieved from target mode (Wunch et al., 2017). In Fig. 5b, negative biases in OCO-2 XCO2 over most TCCON sites have been found. Table 3 gives the error statistics in XCO2 from OCO-2 in target mode. The negative biases range from –0.35 to –4.9 ppm.
4.3 Validation in glint modeThe very low albedo of ocean surfaces degrades precision in space-based measurements. Therefore, glint mode is designed to provide valuable measurements which can provide a much higher signal to noise ratio when OCO-2 flies over oceans. In this mode, the satellite instrument points towards the brightest region, where solar radiation is specularly reflected. Because this mode is continuously operated in one complete orbit, there are also large numbers of observations available over land.
|
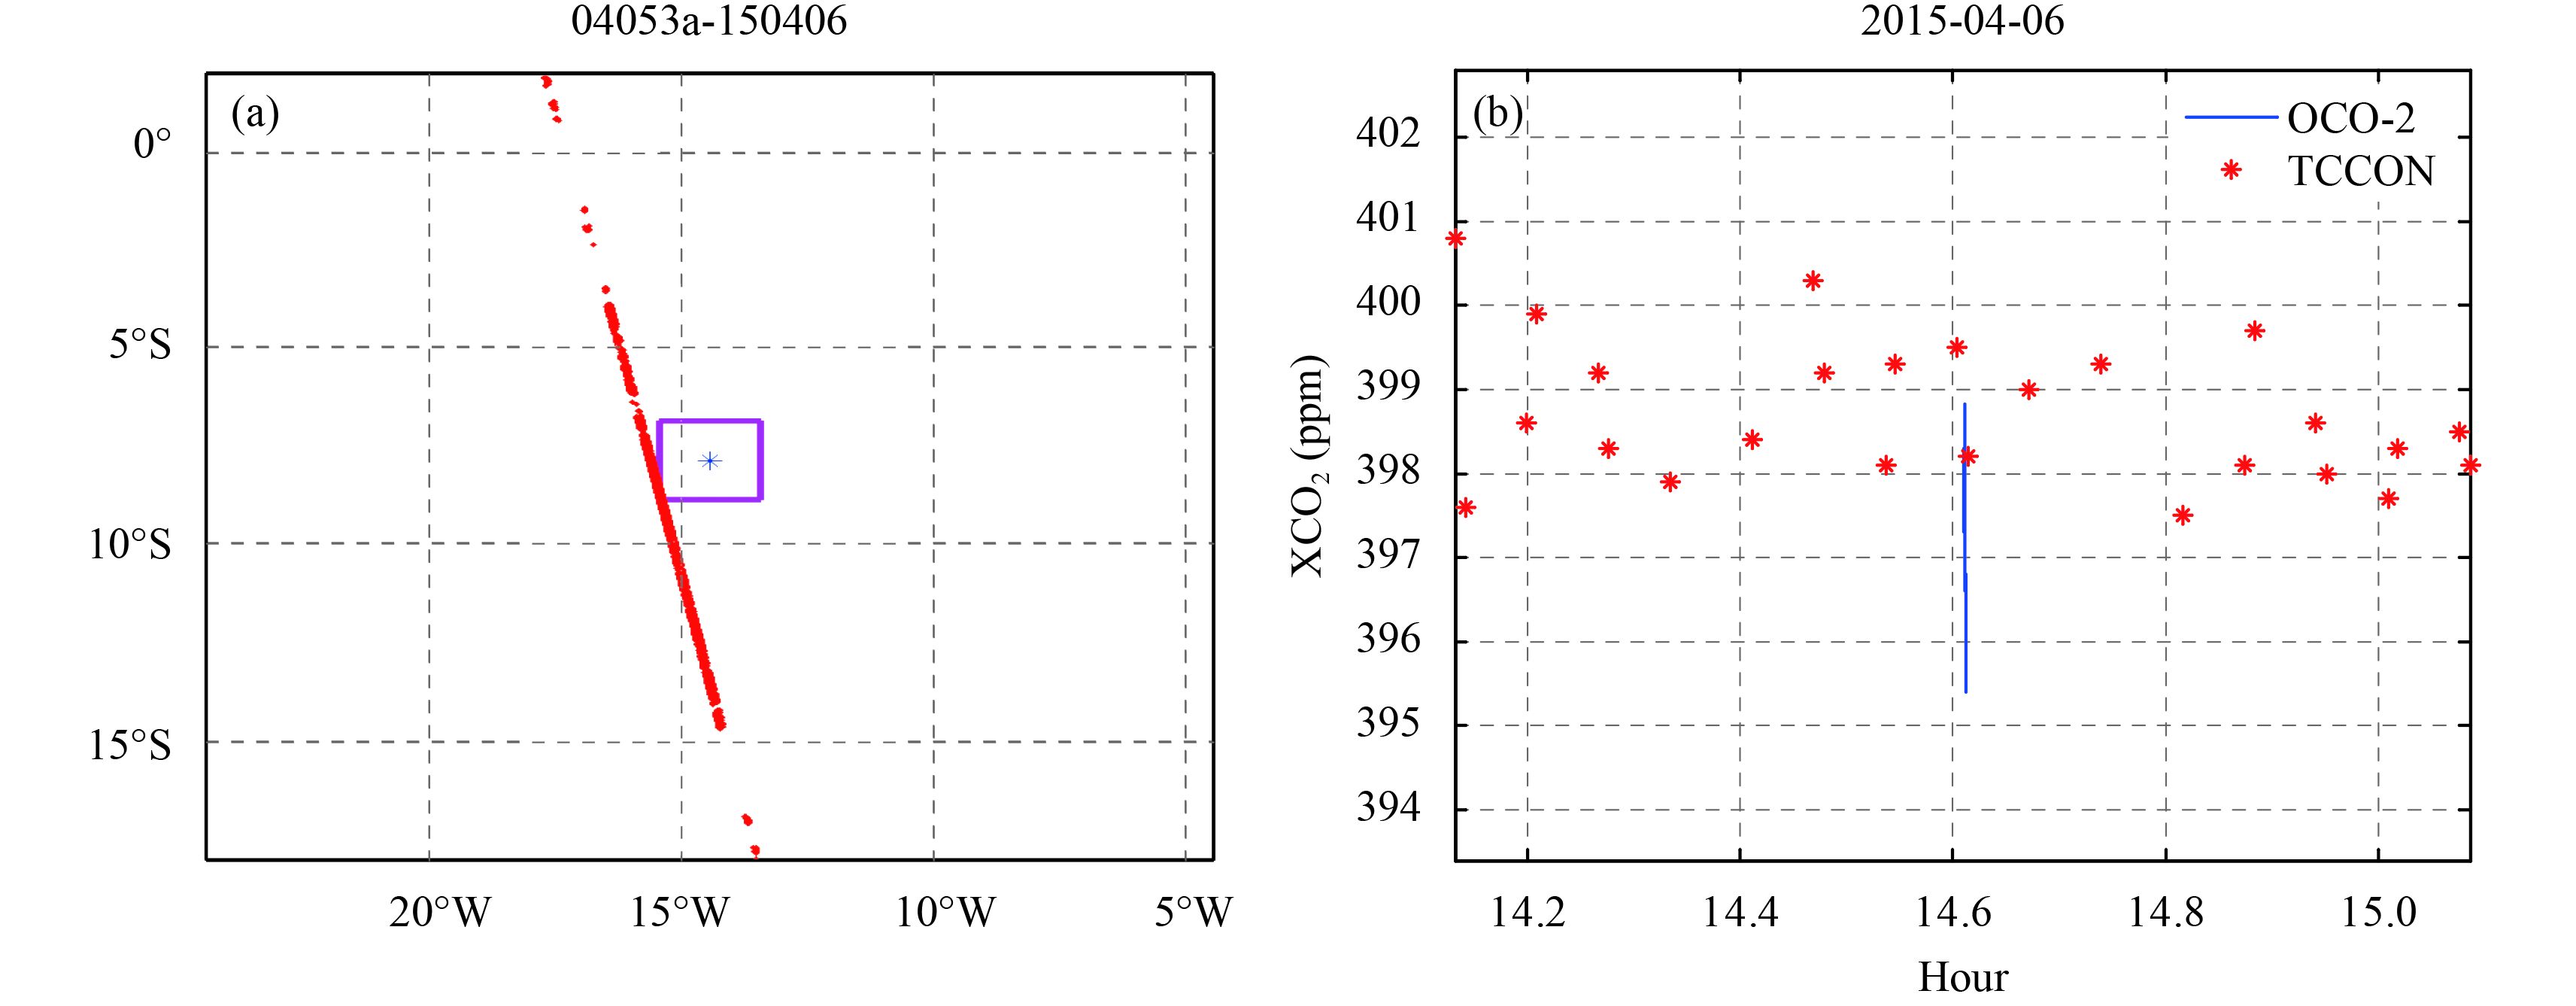
| Figure 6 (a) Map of the OCO-2’s orbit 04053 (dotted line) in glint mode in the region of Ascension Island on 6 April 2015 (rectangle: 1°×1°; asterisk: FTS position). (b) Time series of XCO2 retrieved from OCO-2 in glint mode and FTS at Ascension Island. |
Figure 6 displays an example of the spot measured by OCO-2 in glint mode in the vicinity of the Ascension Island site, as well as a time series plot of XCO2 retrieved from the measurements on 6 April 2015. It can be found from Fig. 6a that the OCO-2’s pixels on the ground just pass the edge of the region around the FTS site (shown by the asterisk). FTS XCO2 varies from 397.5 ppm to near 401 ppm, while OCO-2 XCO2 is below 399 ppm. The range of variation in XCO2 from OCO-2 is similar to that of FTS, which is about 4 ppm. The average of OCO-2 XCO2 variation is 1 ppm (approximately 0.25%), systematically lower than that of FTS XCO2.
|
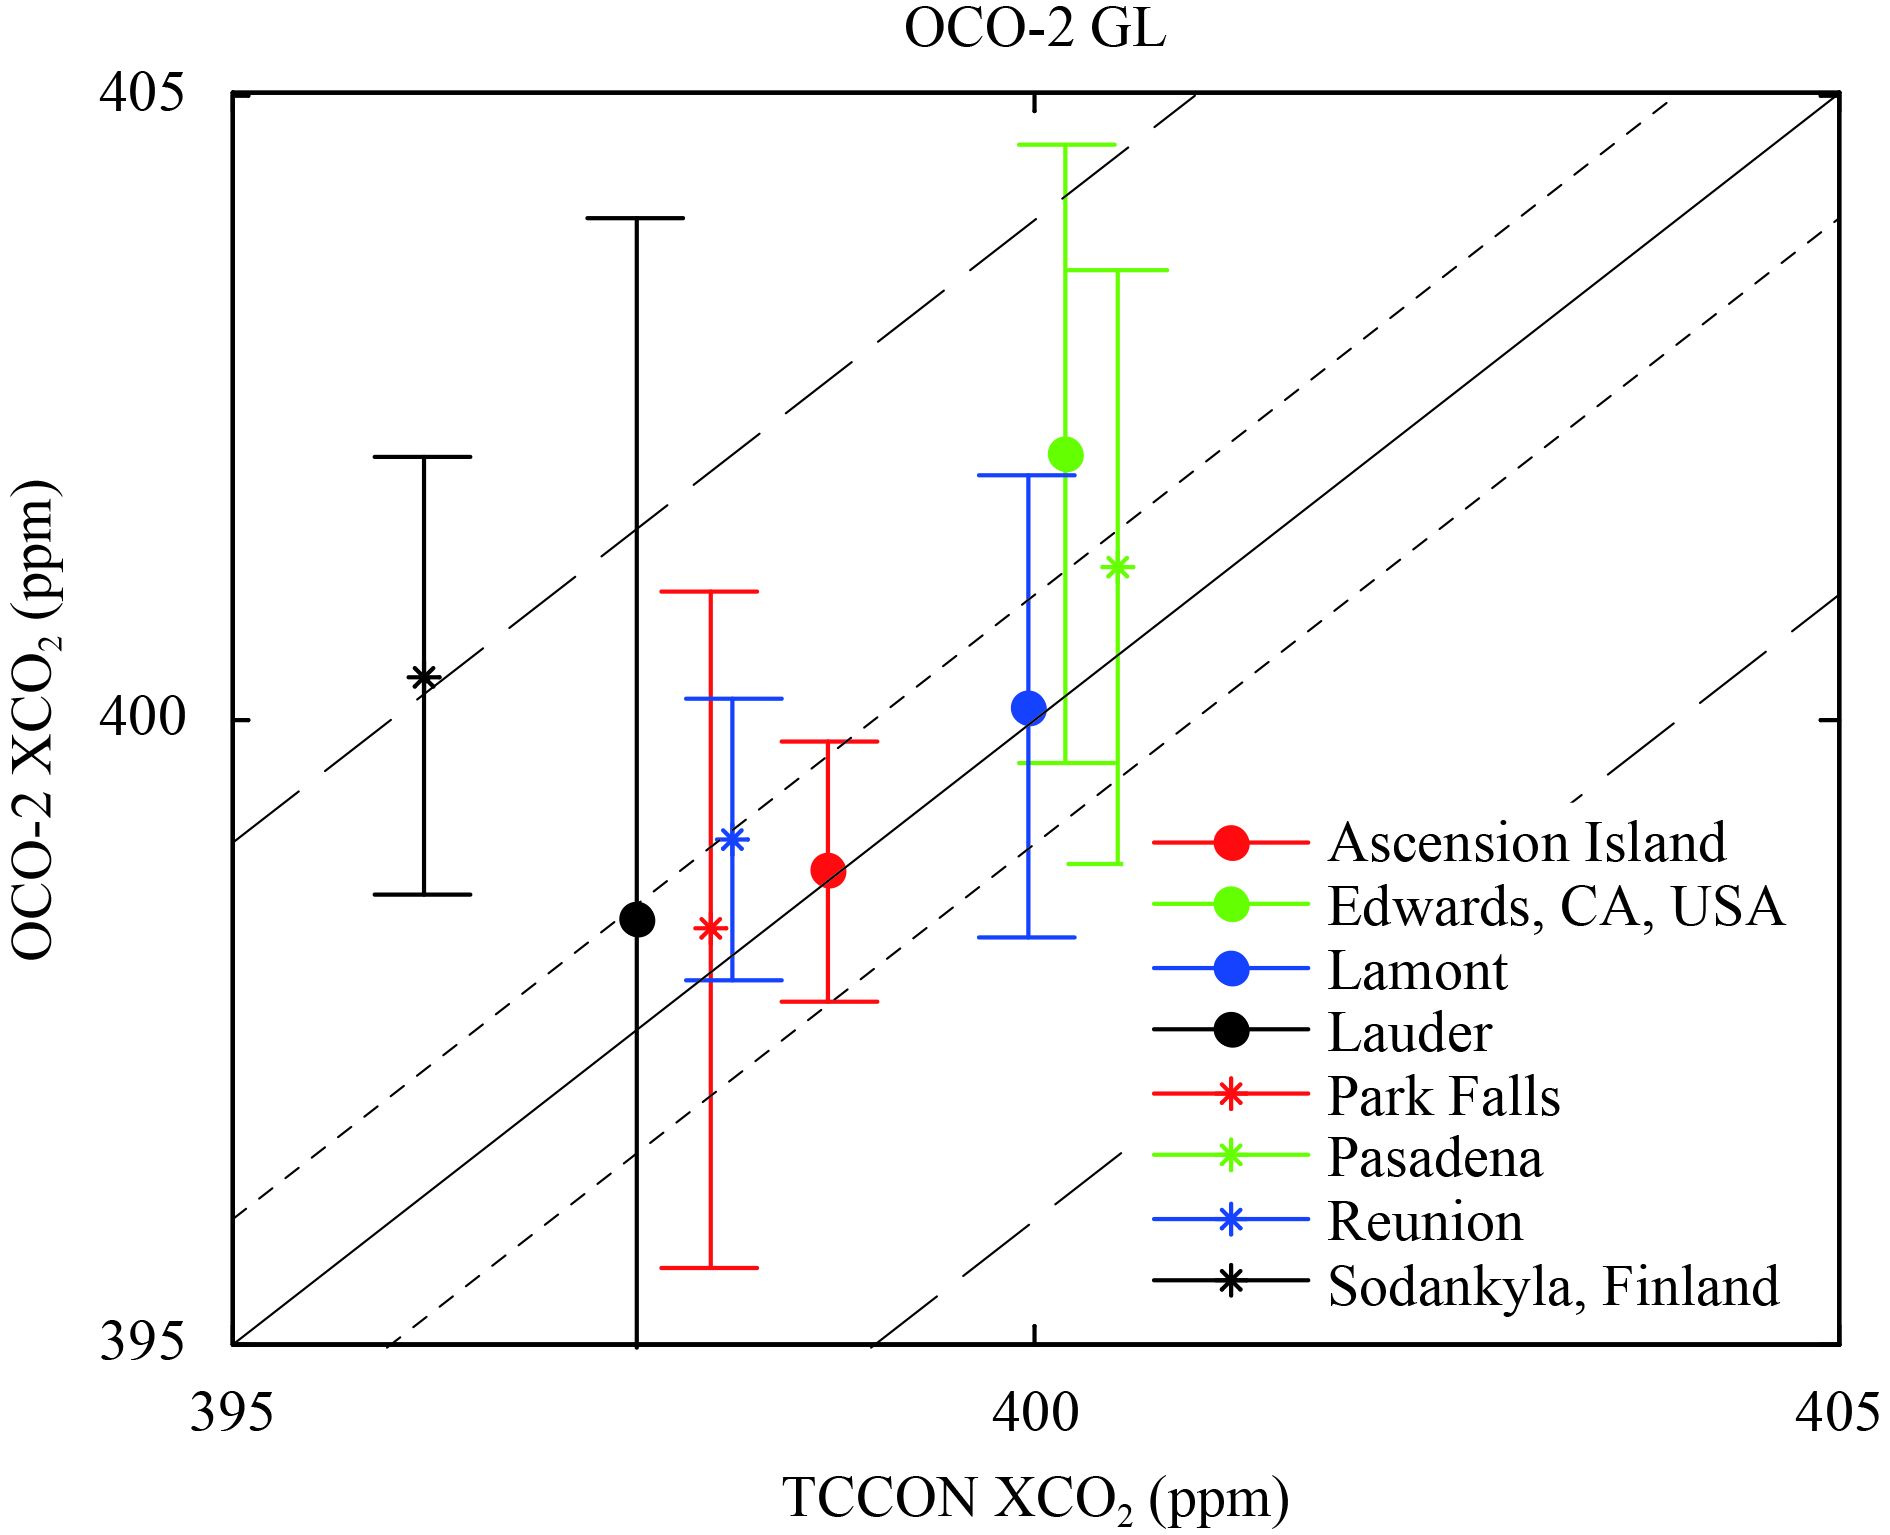
| Figure 7 Comparison of XCO2 retrieved from OCO-2 in glint mode and FTS from January to June 2015. The error bars show 1σ precision of OCO-2 XCO2. The short-dashed lines and the long-dashed lines represent 1 and 4 ppm, respectively. |
| Site | Num. of colloc. data | Bias (ppm) | 1σ (ppm) |
| Ascension | 4 | 0.06 | 1.05 |
| Edwards | 3 | 1.93 | 2.47 |
| Lamont | 14 | 0.14 | 1.85 |
| Lauder | 3 | 0.88 | 5.61 |
| Park Falls | 12 | 0.33 | 2.71 |
| Pasadena | 9 | 0.70 | 2.38 |
| Reunion Island | 8 | 0.90 | 1.13 |
| Sodankylä | 4 | 4.15 | 1.74 |
Figure 7 reports a comparison between XCO2 retrieved from OCO-2 and FTS XCO2 at all available TCCON sites from January to June 2015 when glint mode was used by OCO-2. All the compared XCO2 values retrieved from OCO-2 show good qualitative agreement with those of TCCON FTS. Overall, no obvious negative biases are found. Table 4 reports the statistics of errors in XCO2 retrieved from OCO-2 in glint mode. No biases larger than 4 ppm are found and most of the biases range from –2.58 to 1.82 ppm. Variability in precision in OCO-2 XCO 2 is about 0.2%–0.9%. The finding that OCO-2 XCO2 in glint mode over all the sites has much better agreement with TCCON XCO2 may imply that glint mode is suited for measuring atmospheric CO2 columns over not only ocean but also land.
Glint mode was originally designed to observe CO2 over oceans. The uniformity of oceanic surfaces results in specular reflection of sun light. Because the use of this mode covers a whole orbit, XCO2 can also be retrieved over land. We think that the better agreement between TCCON and OCO-2 in glint mode is probably attributed to the uniformity of the land surface where FTSs are located. To some extent, this uniformity of land surface can easily generate the reflections that deviate from the diffusion of Lambertian surfaces.
4.4 Validation with the FTS in BeijingThe FTS operates automatically every day, including tracking the sun, to record data. Figure 8 shows the photo of the FTS. The time series of FTS XCO2 in Beijing from April to August 2016 is shown in Fig. 9. The seasonal variation of FTS XCO2 can be clearly seen from these measurements. XCO2 decreased slowly from 405 ppm in April to about 395 ppm in August. The daily variation of FTS XCO2 is mostly below 1 ppm.
|
| Figure 8 Photo of a Bruker FTS 125HR in Beijing. |

|
| Figure 9 The time series of FTS XCO2 in Beijing from April to August 2016. |
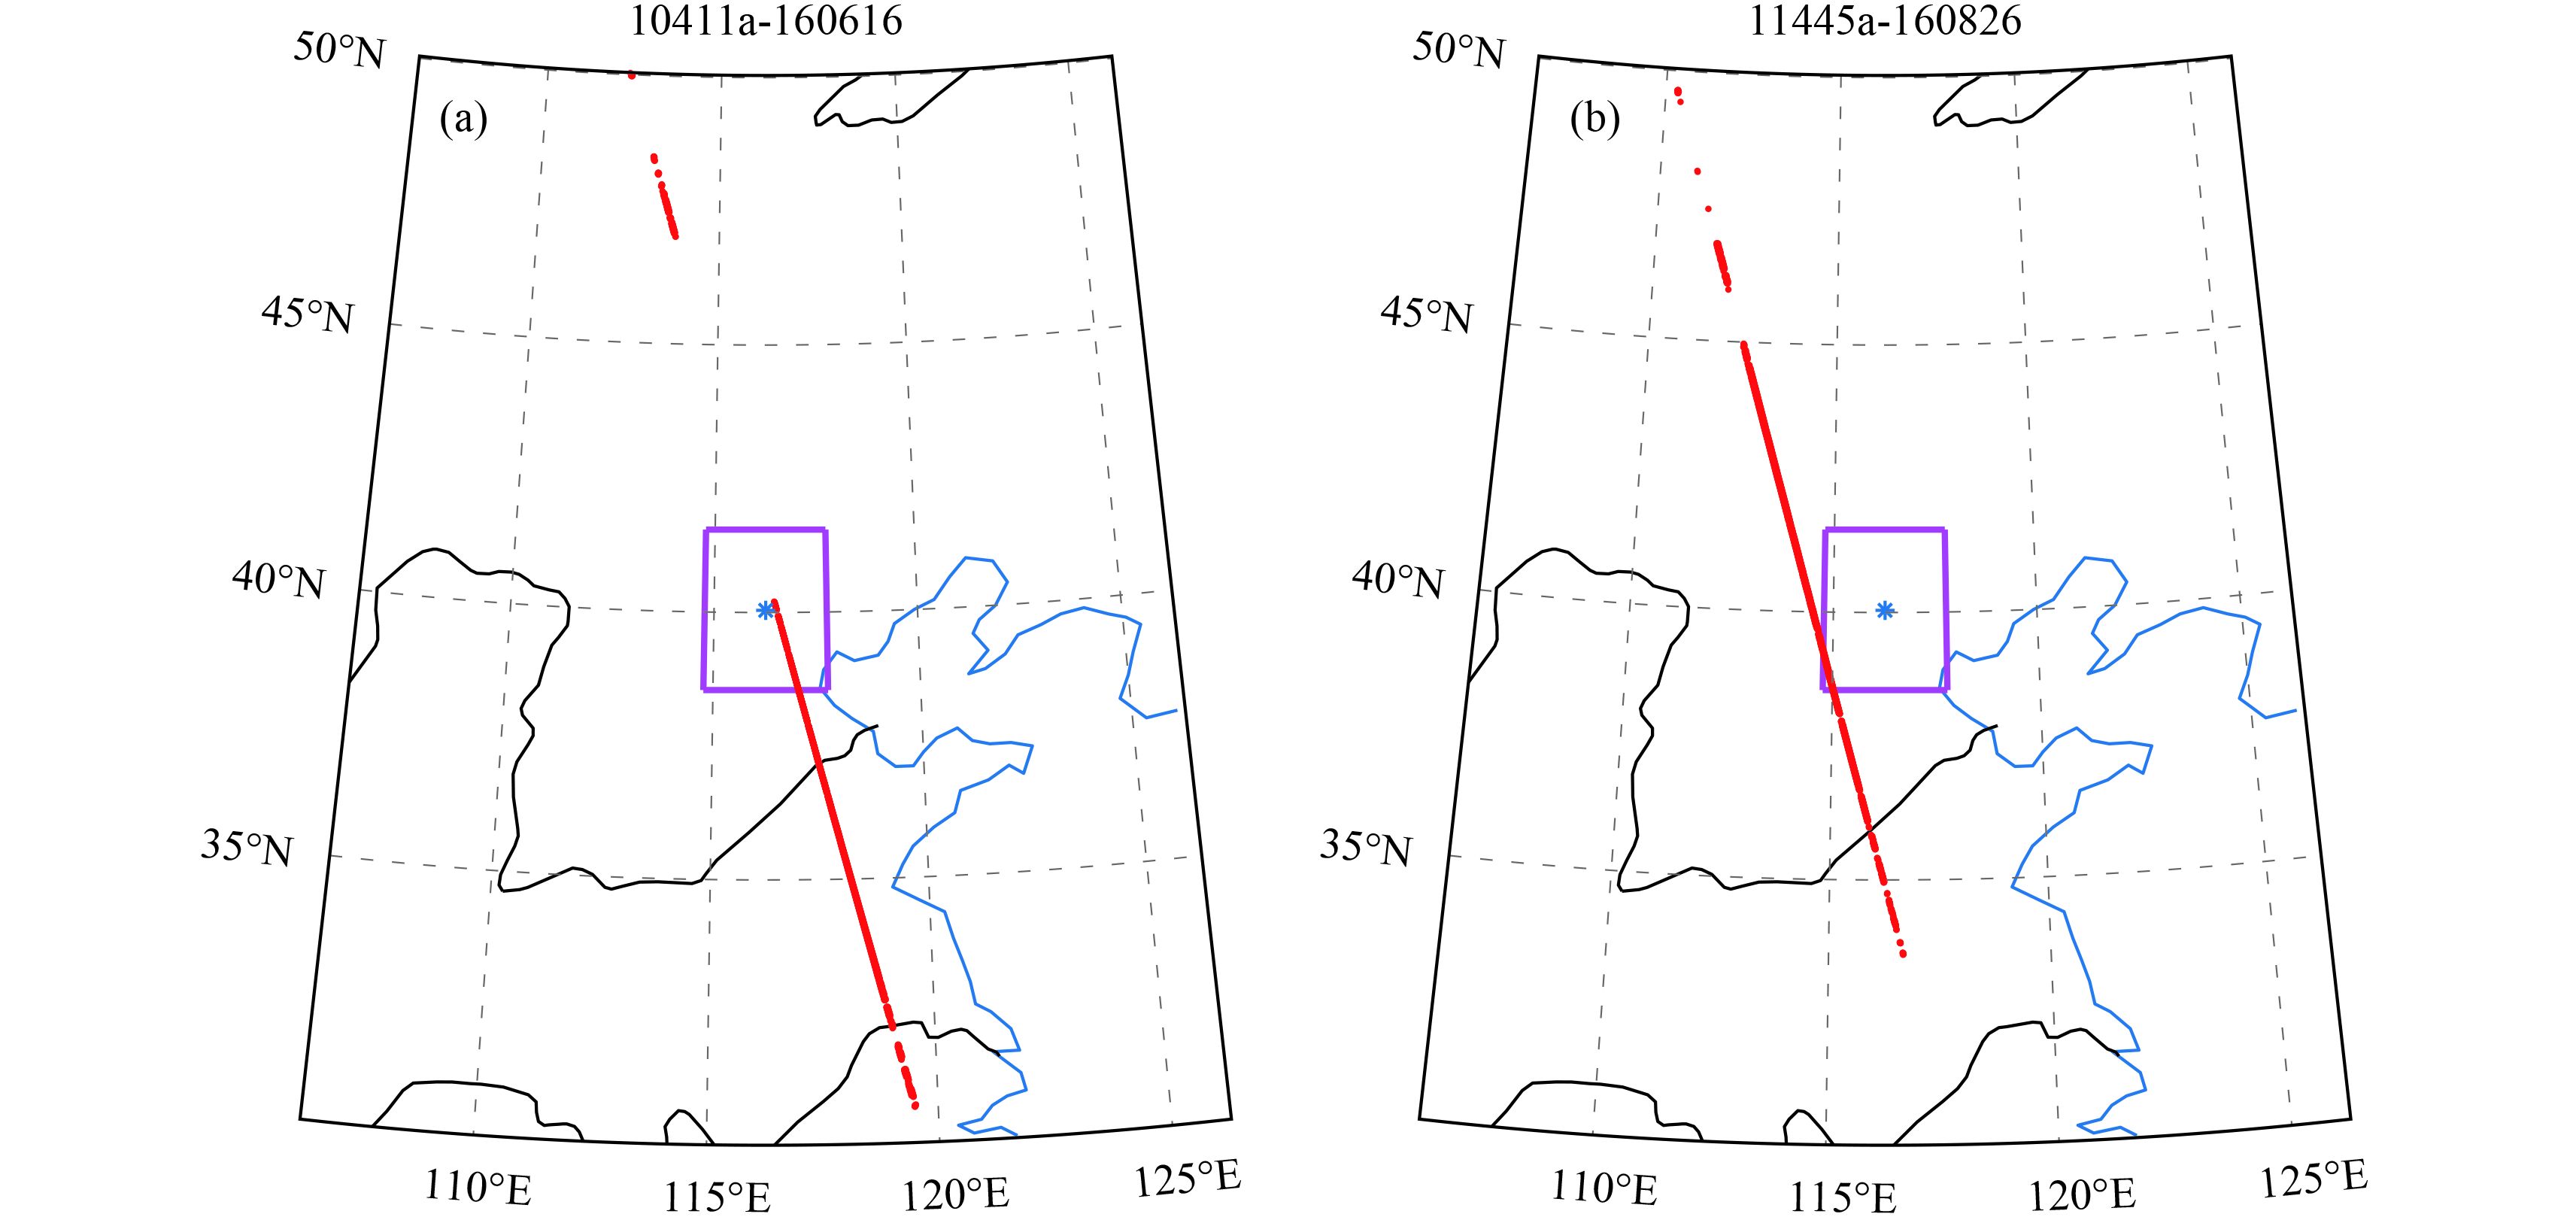
In total, we have found three overpasses over this site during 2016. Only nadir and glint modes were available to compare. These data are listed in Table 5. Large biases greater than 3 ppm can be found between OCO-2 XCO2 and FTS XCO2 on 6 May and 26 August. OCO-2 XCO2 agrees well with FTS XCO2 on 16 June. The large biases can be attributed to the large distance between FTS site and OCO-2 footprints. Due to the complexity of the urban environments in Beijing, including CO2 emissions and transport in the atmosphere, the CO2 in the Beijing area may have remarkable variations with location. Figure 10 shows the distance between FTS site and OCO-2 footprints in the comparison. On 26 August, the distance between them is much greater than that on 16 June. FTS measurements cannot reflect the real CO2 concentration over the OCO-2 footprints on 26 August. In the future, when more OCO-2 passes over this area, we plan to decease the distance between FTS and satellite footprints. In this region, more collocated data are needed to validate OCO-2 XCO2.
| Date (yy-mm-dd) | Mode | Num. of samples | Mean of OCO-2 (ppm) | Mean of FTS (ppm) | Bias (ppm) | 1σ of OCO-2 (ppm) |
| 2016-05-06 | Nadir | 4 | 405.05 | 401.60 | 3.45 | 2.39 |
| 2016-06-16 | Glint | 3 | 396.84 | 396.82 | 0.02 | 2.44 |
| 2016-08-26 | Glint | 3 | 397.70 | 394.13 | 3.57 | 1.60 |
|
| Figure 10 Map of the OCO-2’s orbit on (a) 16 June and (b) 26 August 2016 in the region of Beijing (rectangle: 1.5° × 1.5°; asterisk: FTS position). |
All current XCO2 retrievals from satellites have systematic biases. OCO-2 data have a successful bias-correction algorithm to generate bias-free products (Mankrake et al., 2015). While the agreement between OCO-2 and FTS measurements can be established from the nearly zero bias, the uncertainty remains large. In some cases, only 1‒3 measurements are used to derive uncertainty. The large uncertainty can be due to limited samples. For the purpose of XCO2 applications in carbon cycle analyses, we should understand the causes of discrepancies in XCO2 between OCO-2 and TCCON FTS. First, for space-based measurements in NIR bands, both spectral and radiometrical calibration parameters may potentially change after launch of the instrument. Their variation can bias the spectra used to retrieve XCO2. But the FTS measurements do not need radiometrical calibrations. Second, XCO2 uncertainties can be introduced by real changes in photon path length due to variations in scattering caused by the surface, aerosols, and clouds (Merrelli et al., 2015). Current retrieval methods cannot exactly calculate these impacts of scattering (Natraj et al., 2008). Thus, the large uncertainty in OCO-2 XCO2 may be originally induced by the thin cirrus, aerosols, and surface albedo (Worden et al., 2017). However, ground-based FTS measurements directly viewing the sun are insensitive to reflection caused by surface. Third, the retrieval methods used by the OCO-2 and FTS are different in many aspects, such as background parameters and averaging kernel. As many researchers have pointed out, these differences between the two measurement approaches must be taken into account when detailed error budgets are analyzed. Finally, FTS XCO2 is simply treated as the truth; in fact, the unknown drift (accuracy) in FTS at the time of comparison has to be taken into account (Wunch et al., 2011).
In conclusion, we have compared OCO-2 XCO2 data products with those retrieved from collocated ground-based solar-viewing TCCON FTS, especially in the Beijing area. Beijing site is located in a typical urban area, which has been absent from previous studies. The OCO-2 XCO2 is validated according to different modes, i.e., nadir, target, and glint. This new validation method is different from previous studies. Biases in the OCO-2 XCO2 retrievals have been investigated and the precisions have also been estimated. We have found that OCO-2 glint mode yields the best qualitative estimation among the three approaches to observing CO2 concentration. Overall, the glint observing mode results show no obvious negative biases in XCO2 retrieved from OCO-2. The standard deviations are appropriately on the order of 0.2%‒0.9% of current CO2 concentrations. This result implies that the concept that the glint observation has the brighter signal is appropriate for not only ocean but also land regions. In target and nadir modes, negative biases lower than TCCON FTS at most sites have been found. Additionally, standard deviations in these two modes are similar, i.e., larger than glint mode, when compared with TCCON FTS. These results provide useful information for XCO2 applications in the studies of the carbon cycle and carbon sources and sinks. Biases should be corrected before the measurements are assimilated into carbon cycle models.
This study shows important qualitative properties of XCO2 retrieved from satellites. A limitation of this study, however, is that collocated XCO2 in some TCCON sites and Beijing are inadequate to fully assess the quality of XCO2 in three modes due to the limited samples of measurements. It is very important to continue XCO2 validation against TCCON to assess data quality throughout the entire lifetime of CO2.
Acknowledgments. The OCO-2 data were produced by the OCO-2 project at the Jet Propulsion Laboratory, California Institute of Technology, and obtained from the OCO-2 data archive maintained at the NASA Goddard Earth Science Data and Information Services Center. TCCON data were obtained from the TCCON Data Archive, hosted by the Carbon Dioxide Information Analysis Center (CDIAC) before September 2017 and has now been transitioned to tccon.caltech.edu. We thank S. Arnold and D. Feist from the Max Planck Institute for Biogeochemistry in Jena, Germany, for helpful comments.
| Bi, Y. M., Z. D. Yang, S. Y. Gu, et al., 2014: Impacts of aerosol and albedo on TanSat CO2 retrieval using the near infrared CO2 bands. Proceedings Volume 9259, Remote Sensing of the Atmosphere, Clouds, and Precipitation V, 925915 (8 Nove-mber 2014), SPIE Asia–Pacific Remote Sensing Conference, Beijing, China, doi: 10.1117/12.2066123. |
| Bösch, H., G. C. Toon, B. Sen, et al., 2006: Space-based near-infrared CO2 measurements: Testing the Orbiting Carbon Observatory retrieval algorithm and validation concept using SCIAMACHY observations over Park Falls, Wisconsin . J. Geophys. Res., 111, D23302. DOI:10.1029/2006JD007080 |
| Crisp, D., 2015: Measuring atmospheric carbon dioxide from space with the Orbiting Carbon Observatory-2 (OCO-2). Proceedings Volume 9607, Earth Observing Systems XX, 960702 (8 September 2015), SPIE Optical Engineering + Applications Conference, San Diego, California, USA, doi: 10.1117/12.2187291. |
| Crisp, D., R. M. Atlas, F.-M. Breon, et al., 2004: The Orbiting Carbon Observatory (OCO) mission. Adv. Space Res., 34, 700–709. DOI:10.1016/j.asr.2003.08.062 |
| Griffith, D. W. T., Hurst, D. F., Jiménez, R., et al., 2010: Calibration of the Total Carbon Column Observing Network using aircraft profile data. Atmos. Meas. Tech., 3, 1351–1362. DOI:10.5194/amt-3-1351-2010 |
| Guo, L. J., L. P. Lei, and Z. C. Zeng, 2013: Spatiotemporal correlation analysis of satellite-observed CO2: Case studies in China and USA. 2013 IEEE International Geoscience and Remote Sensing Symposium, Melbourne, VIC, Australia, 21–26 July, IEEE, 1835–1838, doi: 10.1109/IGARSS.2013.6723158. |
| Hammerling, D. M., A. M. Michalak, C. O’Dell, et al., 2012: Global CO2 distributions over land from the Greenhouse Gases Observing Satellite (GOSAT) . Geophys. Res. Lett., 39, L08804. DOI:10.1029/2012GL051203 |
| Hase, F., J. W. Hannigan, M. T. Coffey, et al., 2004: Intercomparison of retrieval codes used for the analysis of high-resolution, ground-based FTIR measurements. J. Quant. Spectrosc. Radiat. Transf., 87, 25–52. DOI:10.1016/j.jqsrt.2003.12.008 |
| Mandrake, L., O’Dell, C. W., Wunch, et al., 2015: Orbiting Carbon Observatory-2 (OCO-2) Warn Level, Bias Correction, and Lite File Product Description, Tech. Rep., Jet Propulsion Laboratory, California Institute of Technology, Pasadena, CA, USA. 44 pp. Available at https://disc.gsfc.nasa.gov/information/documents?title=OCO-2%20Documents. Accessed on 10 December 2017. |
| Merrelli, A., R. Bennartz, C. W. O’Dell, et al., 2015: Estimating bias in the OCO-2 retrieval algorithm caused by 3-D radiation scattering from unresolved boundary layer clouds. Atmos. Meas. Tech., 8, 1641–1656. DOI:10.5194/amt-8-1641-2015 |
| Miller, C. E., D. Crisp, P. L. De Cola, et al., 2007: Precision requirements for space-based XCO2 data . J. Geophys. Res., 112, D10314. DOI:10.1029/2006JD007659 |
| Morino, I., O. Uchino, M. Inoue, et al., 2011: Preliminary validation of column-averaged volume mixing ratios of carbon dioxide and methane retrieved from GOSAT short-wavelength infrared spectra. Atmos. Meas. Tech., 4, 1061–1076. DOI:10.5194/amt-4-1061-2011 |
| Natraj, V., H. Boesch, R. J. D. Spurr, et al., 2008: Retrieval of XCO2 from simulated Orbiting Carbon Observatory measurements using the fast linearized R-2OS radiative transfer model . J. Geophys. Res., 113, D11212. DOI:10.1029/2007JD009017 |
| O’Dell, C. W., B. Connor, H. Bösch, et al., 2012: The ACOS CO2 retrieval algorithm—Part 1: Description and validation agai-nst synthetic observations . Atmos. Meas. Tech., 5, 99–121. DOI:10.5194/amt-5-99-2012 |
| Osterman G., B. Fisher, D. Wunch, et al., 2015a: OCO-2 observation and validation overview: Observations data modes and target observations taken during the first 15 months of operations. AGU Fall Meeting, San Franciso, 14–18 December. |
| Osterman, G., A. Eldering, C. Avis, et al., 2015b: Orbiting Carbon Observatory-2 (OCO-2) Data Product User’s Guide, Operational L1 and L2 Data Versions 7 and 7R. Tech. Rep., Jet Propulsion Laboratory, California Institute of Technology, Pasadena, CA, USA. 73 pp. Available at https://disc.gsfc. nasa.gov/information/documents?title=OCO-2%20Documents. Accessed on 10 December 2017. |
| Reuter, M., H. Bovensmann, M. Buchwitz, et al., 2011: Retrieval of atmospheric CO2 with enhanced accuracy and precision from SCIAMACHY: Validation with FTS measurements and comparison with model results . J. Geophys. Res., 116, D04301. DOI:10.1029/2010JD015047 |
| Tadić, J. M., X. Qiu, V. Yadav, et al., 2015: Mapping of satellite Earth observations using moving window block kriging. Geosci. Model Dev., 8, 3311–3319. DOI:10.5194/gmd-8-3311-2015 |
| Tadić J. M., X. M. Qiu, S. Miller, et al., 2017: Spatio-temporal approach to moving window block kriging of satellite data v1.0. Geosci. Model Dev., 10, 709–720. DOI:10.5194/gmd-10-709-2017 |
| Wargan, K., and L. Coy, 2016: Strengthening of the tropopause inversion layer during the 2009 sudden stratospheric warming: A MERRA-2 study. J. Atmos. Sci., 73, 1871–1887. DOI:10.1175/JAS-D-15-0333.1 |
| Washenfelder, R. A., G. C. Toon, J.-F. Blavier, et al., 2006: Carbon dioxide column abundances at the Wisconsin Tall Tower site. J. Geophys. Res., 111, D22305. DOI:10.1029/2006JD007154 |
| Worden, J. R., G. Doran, S. Kulawik, et al., 2017: Evaluation and attribution of OCO-2 XCO2 uncertainties . Atmos. Meas. Tech., 10, 2759–2771. DOI:10.5194/amt-10-2759-2017 |
| Wunch, D., G. C. Toon, P. O. Wennberg, et al., 2010: Calibration of the Total Carbon Column Observing Network using aircraft profile data. Atmos. Meas. Tech., 3, 1351–1362. DOI:10.5194/amt-3-1351-2010 |
| Wunch, D., G. C. Toon, J.-F. L. Blavier, et al., 2011: The Total Carbon Column Observing Network. Philos. Trans. Royal Soc. London A: Math., Phys. Eng. Sci., 369, 2087–2112. DOI:10.1098/rsta.2010.0240 |
| Wunch, D., P. O. Wennberg, G. Osterman, et al., 2017: Comparisons of the Orbiting Carbon Observatory-2 (OCO-2) XCO2 measurements with TCCON . Atmos. Meas. Tech., 10, 2209–2238. DOI:10.5194/amt-10-2209-2017 |
| Yokota, T., Y. Yoshida, N. Eguchi, et al., 2009: Global concentrations of CO2 and CH4 retrieved from GOSAT: First preliminary results . SOLA, 5, 160–163. DOI:10.2151/sola.2009-041 |
 2018, Vol. 32


