The Chinese Meteorological Society
Article Information
- Sun, Z. B., X. L. Zhang, X. J. Zhao, et al., 2018.
- Oscillation of Surface PM2.5 Concentration Resulting from an Alternation of Easterly and Southerly Winds in Beijing: Mechanisms and Implications . 2018.
- J. Meteor. Res., 32(2): 288-301
- http://dx.doi.org/10.1007/s13351-018-7064-3
Article History
- Received May 9, 2017
- in final form November 27, 2017
2. School of Atmospheric Sciences, Key Laboratory on Plateau Atmosphere and Environment of Sichuan Province, Chengdu University of Information Technology, Chengdu 610225;
3. Environment Meteorology Forecast Center of Beijing–Tianjin–Hebei, Beijing 100089;
4. Key Laboratory of Middle Atmosphere and Global Environment Observation, Institute of Atmospheric Physics, Chinese Academy of Sciences, Beijing 100029;
5. College of Earth Sciences, University of Chinese Academy of Sciences, Beijing 100049
Beijing is located in the north of the North China Plain, one of the most heavily polluted regions in the world (He et al., 2001; Duan et al., 2006; Song et al., 2007; Liu et al., 2013; Huang et al., 2014; Liu et al., 2014; Sun et al., 2014; Wang et al., 2014; Liu and Wang, 2015; Song et al., 2015). The harm caused to human health by air pollution in Beijing has attracted much attention in recent years (Hou et al., 2012, 2016; Sun et al., 2013; Gao et al., 2015). Beijing is surrounded on three sides by mountains and the local weather and air pollution are closely related to the atmospheric flow field. The thermal and dynamic effects of southerly winds on air pollution in Beijing are widely recognized. Water vapor and pollutants in the upstream regions are transported by southerly winds into Beijing, where they converge. Warm advection associated with southerly winds in fall and winter promotes the development of a temperature inversion, resulting in a more stable atmosphere that does not favor the dispersion of pollutants. When southerly winds are dominant on the North China Plain, air pollutants can be transported to Beijing along the Taihang Mountains from the south and central Hebei Province. Stagnant warm air in front of the mountains favors the accumulation of air pollutants and water vapor and thus the formation of large areas of haze and fog. A pollution belt from the southwest to the northeast, including Handan, Xingtai, Shijiazhuang, Baoding,and Beijing, forms as a result of the blocking effects of the mountains and the downward motion of air on their lee slopes, which prevents the dispersion of air pollutants. Air pollution in Beijing is intensified by the weak convergence that results from southerly winds. Turbulence below the polluted layer decreases when heavy air pollution occurs because radiative feedback from the pollutants cools the polluted layer, but heats the layer above it. The atmosphere becomes more stable and the mixing height decreases, both of which favor the accumulation of pollutants (Liu et al., 2009; Fu et al., 2014; Jiang et al., 2015; Wang et al., 2015; Zheng et al., 2015; Li et al., 2016).
Wind shear has important effects on air pollution (Cai et al., 2017). When easterly winds dominate in Beijing, there is an upward flow of air due to the blocking effect of the mountains to the west of Beijing. The height and strength of the upward motion depend on the depth and wind speed profile of the easterly winds and there is a significant effect on the concentration of pollutants in the boundary layer (Sun et al., 2016).
Episodes of heavy air pollution often occur in Beijing during the winter months (Quan et al., 2011, 2014; Wang, 2014). There have been few reported studies of the relation between air pollution and easterly winds (Sun, 2005). Compared with other wind systems, easterly winds show a number of important features: (1) the occurrence of easterly winds is sporadic; (2) the thermal-dynamic conditions of the atmosphere are closely related to the speed, vertical structure, and depth of the easterly winds; and (3) heavy pollution is often associated with the alternation of easterly and southerly winds.
A typical example of the alternation of easterly and southerly winds occurred on the North China Plain from 16 to 19 November 2016, characterized by an oscillation of PM2.5 concentrations. We explored this event in detail using ground measurements of air pollution and model simulations. The objective of this study was to show how easterly and southerly winds affect the formation of regional haze and the potential differences in the formation mechanisms associated with these two wind systems. The results will further our understanding of the variability of air quality and improve air quality forecasting.
2 Data and methodology 2.1 DataHourly PM2.5 concentrations at about 250 weather stations in the Beijing–Tianjin–Hebei (Jing–Jin–Ji) region of the North China Plain are available from the websites of the Environmental Protection Department, including 35 stations in Beijing and 12 national control stations (http://zx.bjmemc.com.cn, http://121.28.49.85:8080/, http://air.tjemc.org.cn/). Surface PM2.5 mass concentrations are measured by the tapered element oscillating microbalance method and the measurements have been calibrated and quality controlled according to the Chinese environmental protection standard HJ 618-2011.
The aerosol profile at Shangzhuang (40°5′45″N, 116°13′33″E) in Beijing was determined by using a Mini Micro Pulse LiDAR (Mini-MPL) instrument (Sigma Space, Lanham, MD, USA). The Mini-MPL instrument can detect various atmospheric features (e.g.,the height of the planetary boundary layer, cloud heights and cloud bases) with built-in algorithms and displays them in two different plots. The software continuously displays a single vertical aerosol profile of the data and a time sequence plot. This allows the user to view both the real-time atmospheric structure and the temporal and spatial trends in aerosol and cloud structure. The algorithms, features, and plots of the Mini-MPL are all fully configurable. The LiDAR works at 532 nm and has a pulse frequency of 2500 Hz and an energy of 3–4 μJ. The vertical variation in the aerosol concentration is represented by the normalized relative backscatter (NRB) profile recorded by the Mini-MPL. The NRB profile is a data product derived from the raw signal after applying instrument-specific calibrations and therefore provides measurements of the atmosphere that are independent of the instrument used. The NRB data are used in various detection algorithms for atmospheric features.
A 12-channel (5 water vapor channels and 7 oxygen channels) microwave radiometer (Radiometrics, Romeoville, IL, USA) was used to measure the amount of water vapor in the atmosphere and the temperature profile. The microwave radiometer is installed in the Beijing Observatory (39.93°N, 116.28°E) and is calibrated every three months. The wind profiles, including the wind speed and direction between 100 and 5000 m, are measured at the same station by a wind profiler. The wind profiler radar is produced by the Second Research Institute of China Aerospace Science and Industry Corporation and gives a set of profile data every 6 min at a detection height of about 12–16 km.
Surface meteorological observations and sounding data from meteorological stations were used to analyze the atmospheric circulation and weather situation. There are more than 300 automatic weather stations in the Jing–Jin–Ji region.
2.2 RMAPS-Chem modelThe Rapid-Refresh Multi-Scale Analysis and Prediction System-Chemical (RMAPS-Chem) air quality and haze/fog model simulation system was used to simulate the spatiotemporal structure and evolution of the PM2.5 concentration and meteorological conditions during this pollution episode. This system is based on the Weather Research and Forecasting-Chem (WRF-Chem) simulation coupled with RMAPS. The meteorological initial and boundary conditions for driving the WRF-Chem model were from the operational RMAPS model output with a 9-km resolution. The meteorological physical parameterization schemes included a single-layer urban canopy model, the Noah land surface model, the Yonsai University planetary boundary layer model, the Grell–Devenyi ensemble convection, Thompson microphysics, and the rapid radiative transfer model longwave radiation and Goddard shortwave radiation. The CBMZ (Carbon Bond Mechanism Version Z) chemical mechanism was selected because it includes more comprehensive reactions and alterable scenarios. The MOSAIC (Model for Simulating Aerosol Interactions) aerosol mechanism was used with four size bins. Anthropogenic emission data were from the MEIC (Multi-resolution Emission Inventory for China) (2012) inventory (resolution 0.1° × 0.1°), with values extrapolated to 3- and 9-km grids. There were 38 vertical sigma levels and more than 12 levers within the boundary layer. Figure 1 shows the model simulation area with two domains and topographic characteristics. The outer domain has a resolution of 9 km and an inner domain of 3 km covering the Jing–Jin–Ji region was initiated at 1200 UTC 13 November 2016.

|
| Figure 1 Locations of (a) measuring stations for PM2.5 concentration and (b) weather stations. (c) Domain of RMAPS-Chem and the topographic height. |
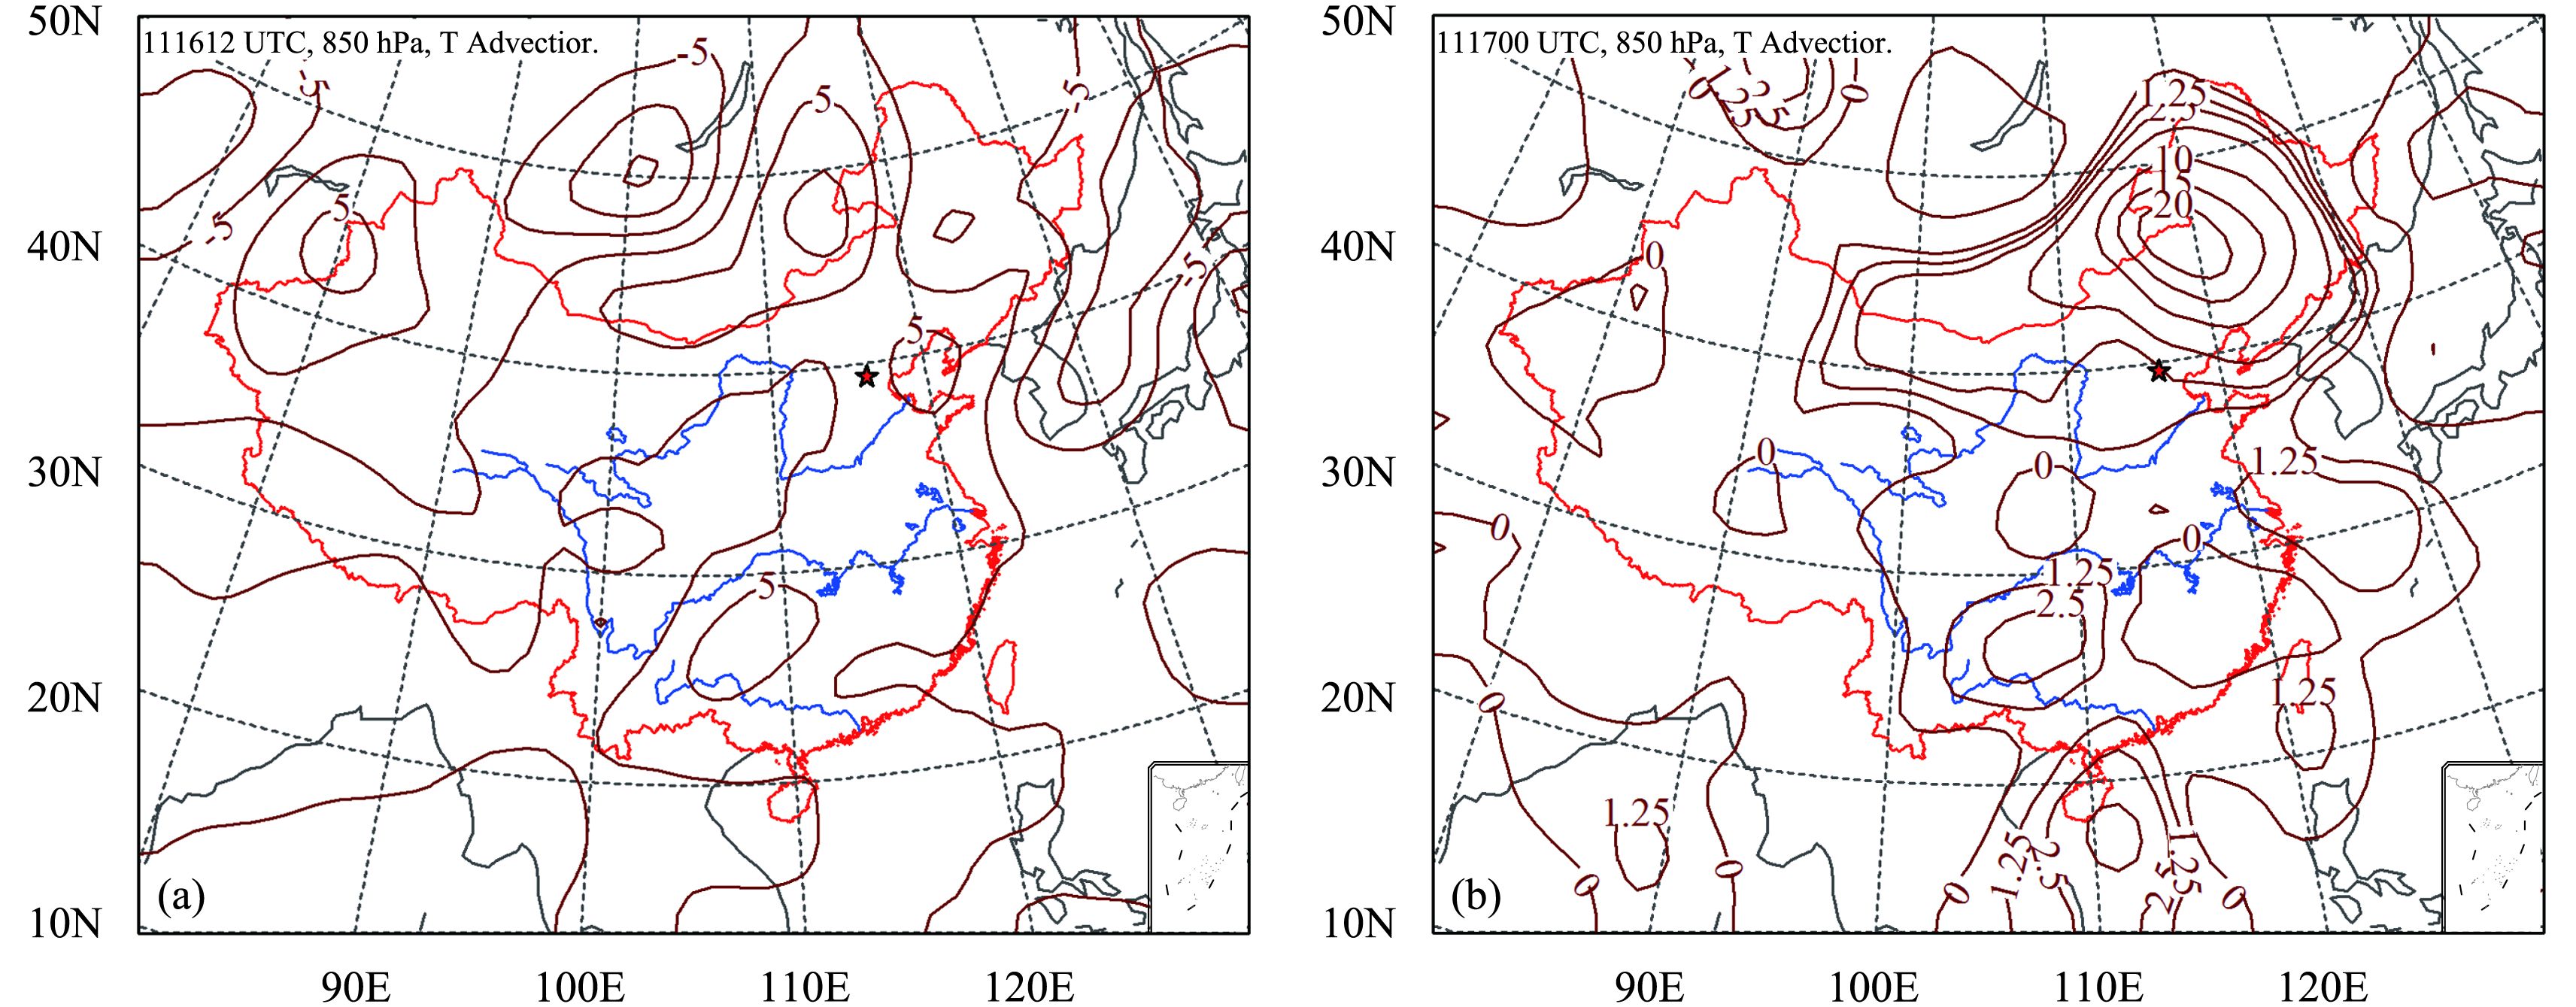
Figure 2 shows the sea surface pressure field during the pollution episode. An area of high pressure occurred east of Lake Baikal. A weak pressure field dominated over Beijing from the night of 15 November to the first half of the night of 16 November. The high pressure area moved southeast after midnight on 16 November and Beijing was then located in the south of the area of high pressure and easterly winds predominated. The high moved east to the Bohai Sea on the afternoon of 17 November and Beijing was again controlled by a weak pressure field. Beijing was affected by low pressure from the Hetao region until the morning of 19 November. Beijing was influenced by cold air from the north on 19 November. The zonal flow was dominant at 500 hPa during this period. The air temperature at 850 hPa decreased due to the influence of weak northerly winds during the night of 16 November. Warm advection was dominant at the upper levels of the atmosphere after November 17 (Fig. 3).

|
| Figure 2 Sea surface pressure field at 0000 UTC (a) 16 November, (b) 17 November, (c) 18 November,and (d) 19 November 2016 (star symbol represents the location of Beijing). |
|
| Figure 3 Temperature advection field on (a) 16 November and (b) 17 November 2016 (star symbol represents the location of Beijing). |
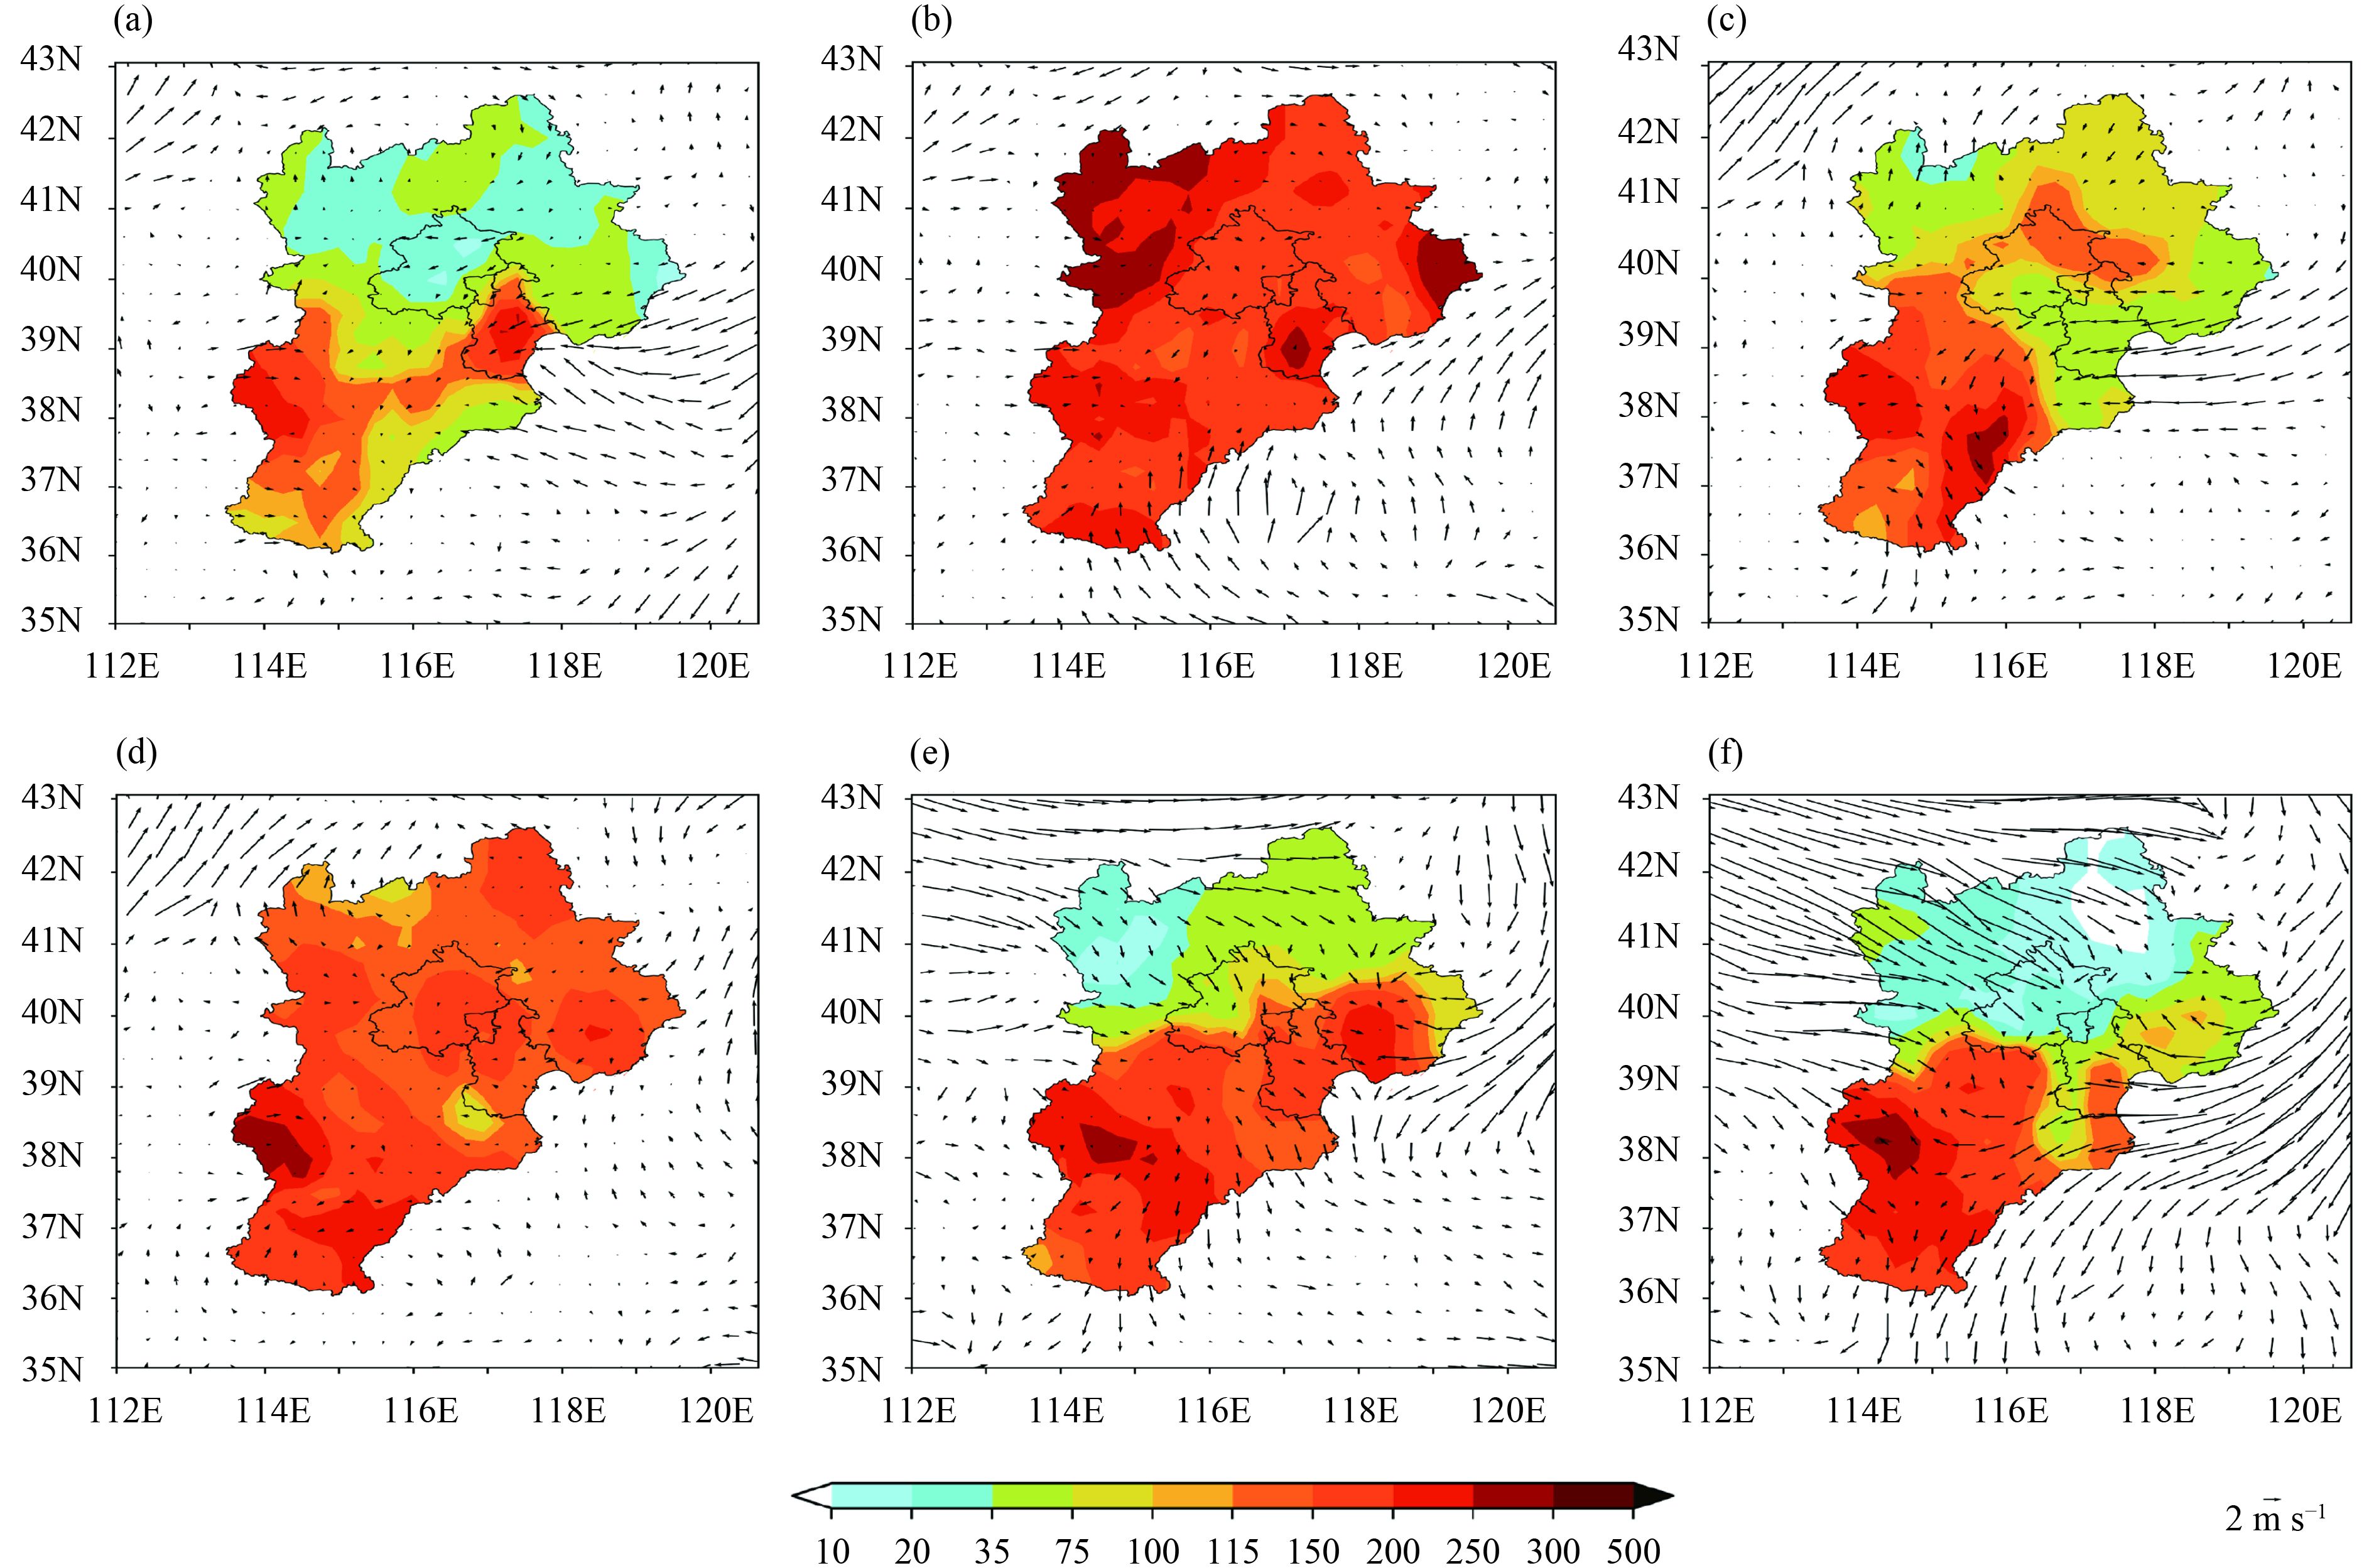
Figure 4 shows the temporal evolution of the PM2.5 concentration distributions in the Jing–Jin–Ji region and the corresponding observed surface wind field. We used the inverse distance weighting method to interpolate the PM2.5 concentrations and the variational method to interpolate the meteorological data. By introducing accuracy and smoothness into a cost function of the gridded field, the optimum objective analysis results were obtained by solving the minimum value of the cost function (Liu, 2013). High PM2.5 concentrations ( > 150 μg m −3) were first observed south of Hebei Province and in Tianjin at 0000 UTC 15 November (Fig. 4a). The southerly wind speed increased on 15 November in the south of Hebei Province, which transported the air pollutants northward and increased the PM2.5 concentration in Beijing. A weak pressure field controlled the Jing–Jin–Ji region from the night of 15 to the morning of 16 November (Fig. 4b) and the surface wind speed was very low, mostly < 1 m s −1. A large spread of heavy PM2.5 pollution occurred across the Jing–Jin–Ji region and the PM2.5 concentration was > 50 μg m −3 in major parts of the region. The heavy pollution continued until the morning of 17 November. Beijing and Tianjin were then located south of the eastward-moving area of the high pressure, and the PM2.5 concentration decreased over this region; it decreased to < 100 μg m −3 in Tianjin, eastern Heibei, and central and southern Beijing as a result of the easterly winds (Fig. 4c). The speed of the easterly wind decreased during the evening of 17 November and an area of weak low pressure dominated over the Jing–Jin–Ji. A stable boundary layer was generated and maintained. The PM2.5 concentrations increased again and a regional heavy pollution event occurred (Fig. 4d). The northerly wind speed increased due to the southeastward movement of a cold high from Northwest China to the Jing–Jin–Ji region from the morning of 19 November. The advection and vertical diffusion of air pollutants were increased and the heavy pollution episode ended from north to south then (Figs. 4e, f).
|
| Figure 4 Temporal evolution of PM2.5 concentration (μg m−3) and observed surface winds in the Jing–Jin–Ji region from 15 to 19 November 2016. (a) 0000 UTC 15; (b) 0000 UTC 16; (c) 0000 UTC 17; (d) 0000 UTC 18; (e) 0000 UTC 19; and (f) 0600 UTC 19 November 2016. |
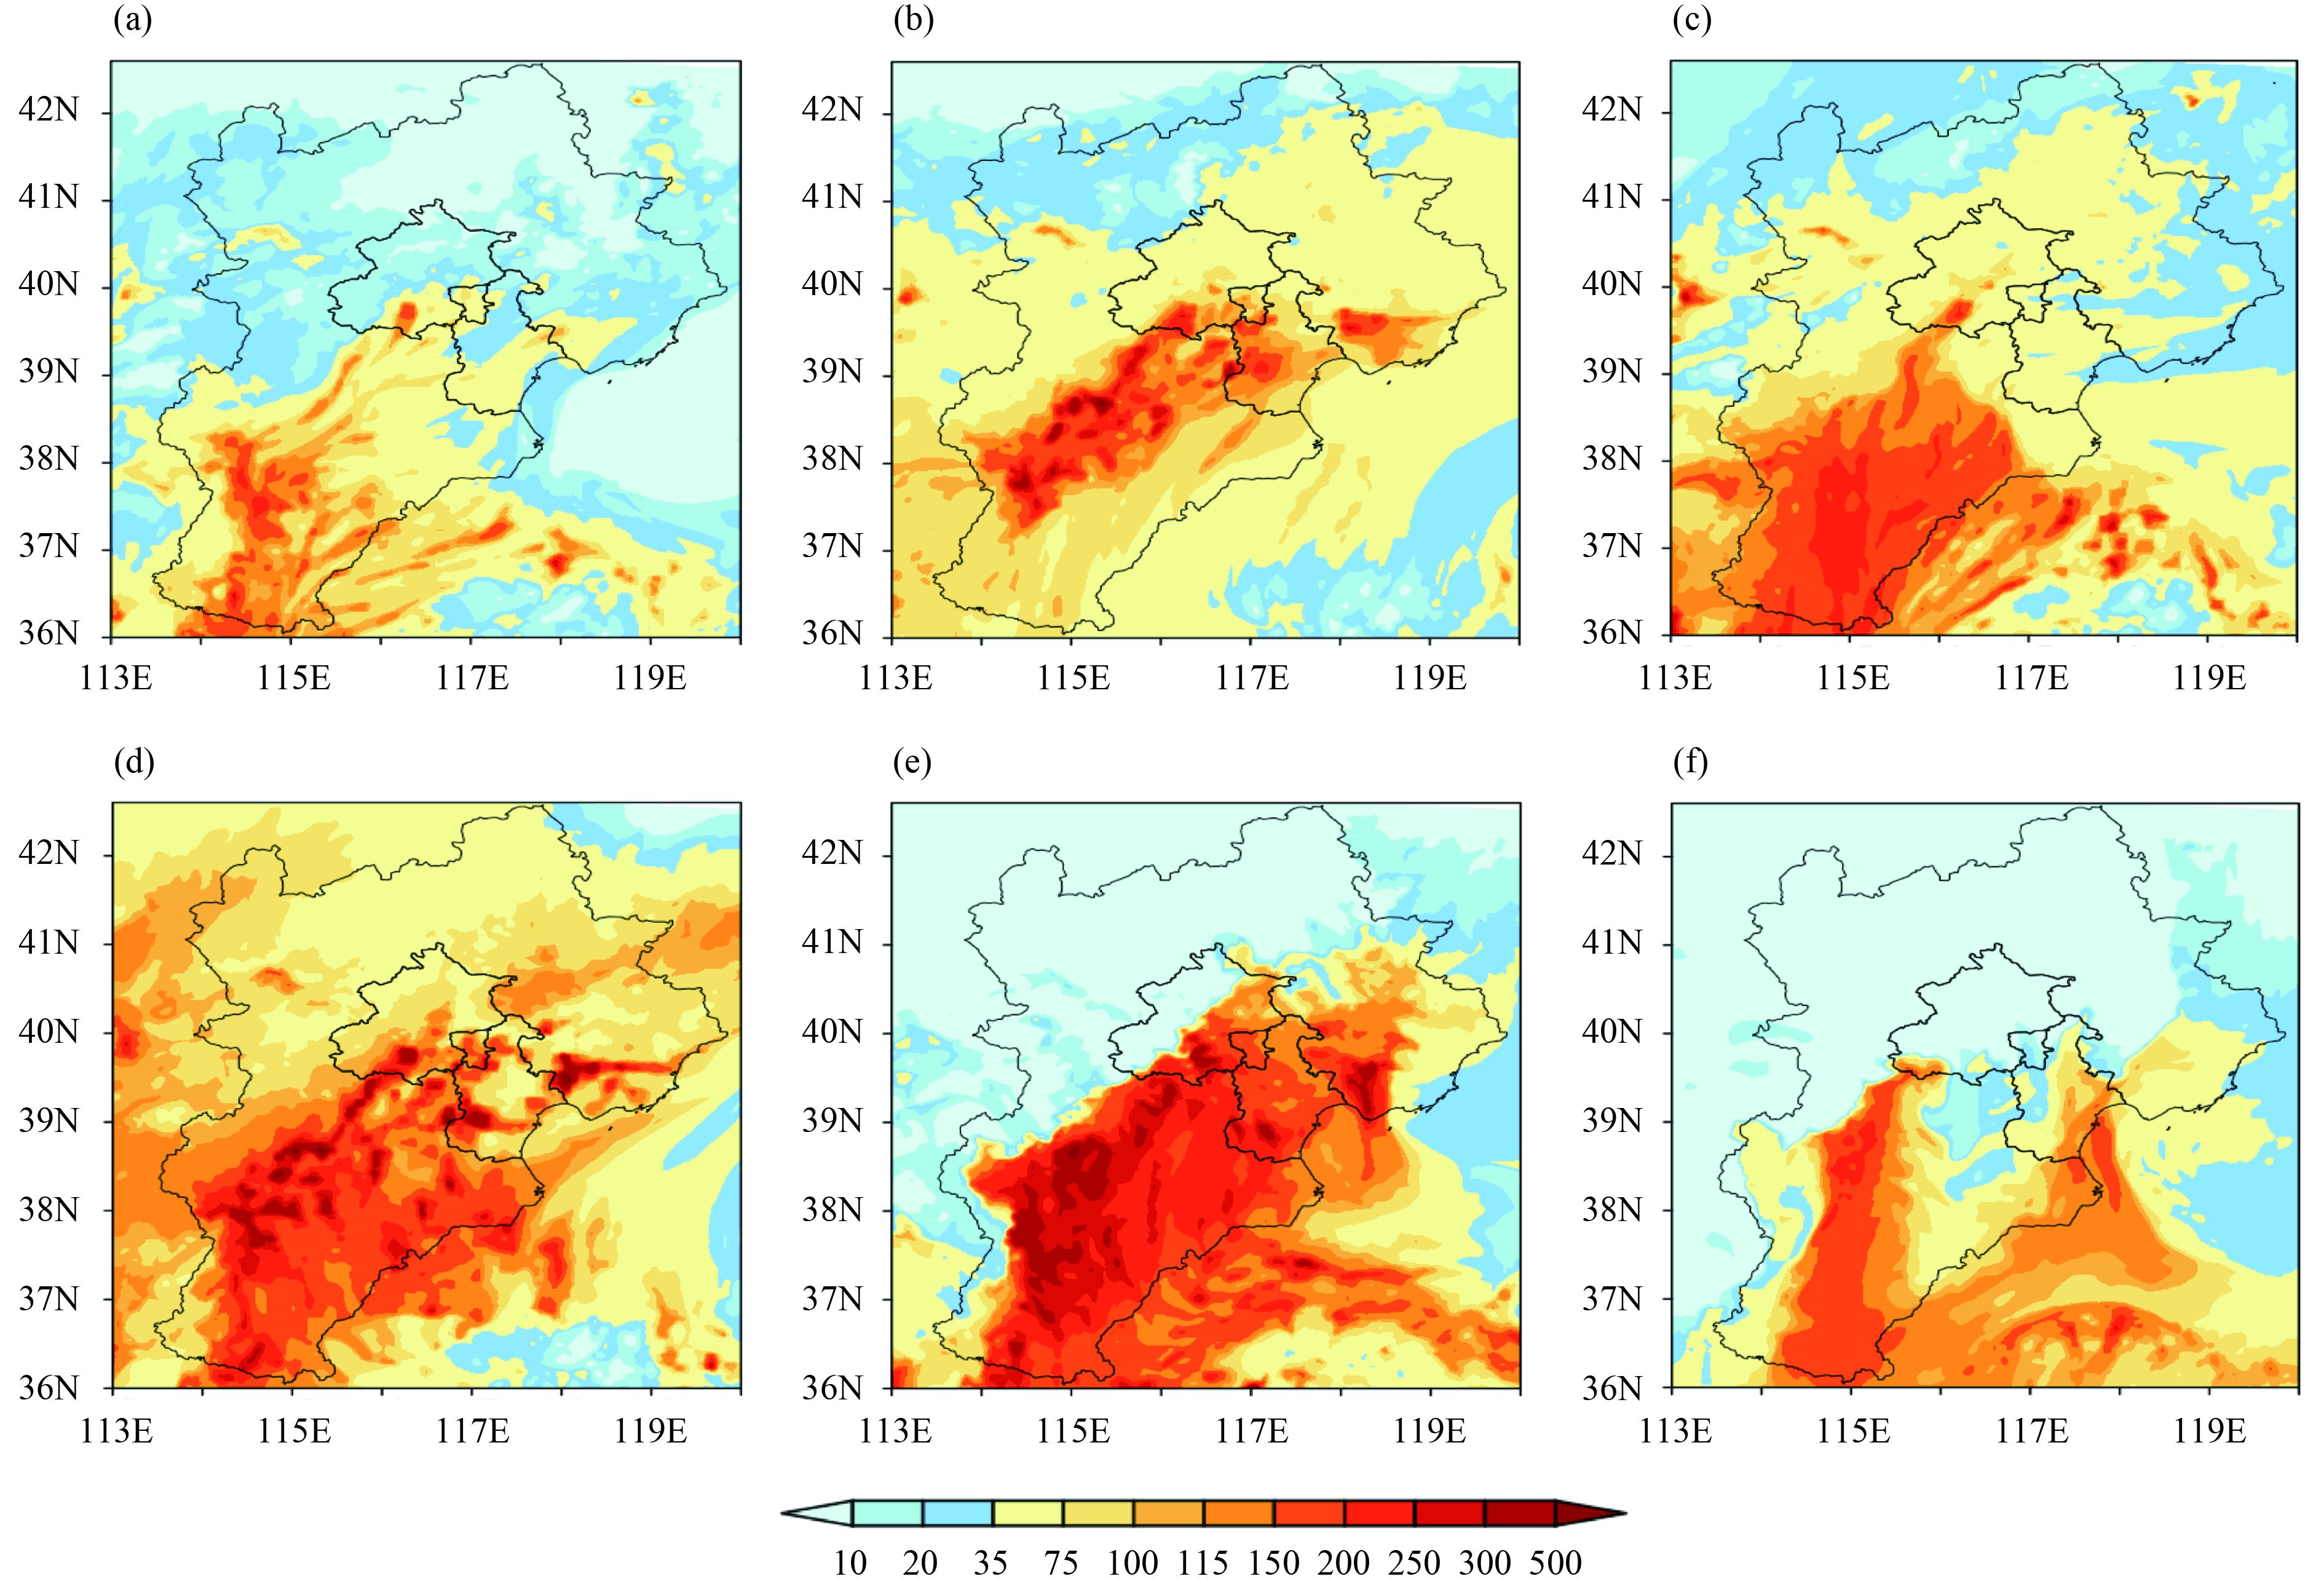
Figure 5 shows the simulated temporal evolution of PM2.5 concentration distributions in the Jing–Jin–Ji region. The results bear a high spatial similarity to Fig. 4, but the PM2.5 concentrations are lower in northern Hebei and Beijing. Figure 5c shows that the PM2.5 concentration decreased in northeastern Hebei, Tianjin, and Beijing, as a result of lifting and dilution of the pollutants by clean sea air masses, which is consistent with observations.
|
| Figure 5 Modeled temporal evolution of spatial PM2.5 (μg m−3) in the Jing–Jin–Ji region from 15 to 19 November 2016. (a) 0000 UTC 15; (b) 0000 UTC 16; (c) 0000 UTC 17; (d) 0000 UTC 18; (e) 0000 UTC 19; and (f) 0600 UTC 19 November 2016. |
According to the temporal variability of the hourly PM2.5 concentration in Beijing (Fig. 6a), this pollution episode can be separated into six phases. Weather factors such as relative humidity and wind speed and direction showed corresponding variations, indicating a close relationship between the weather and PM2.5 concentration. The PM2.5 concentration is the mean of 12 sites in Beijing and the meteorological site is Beijing Observatory.
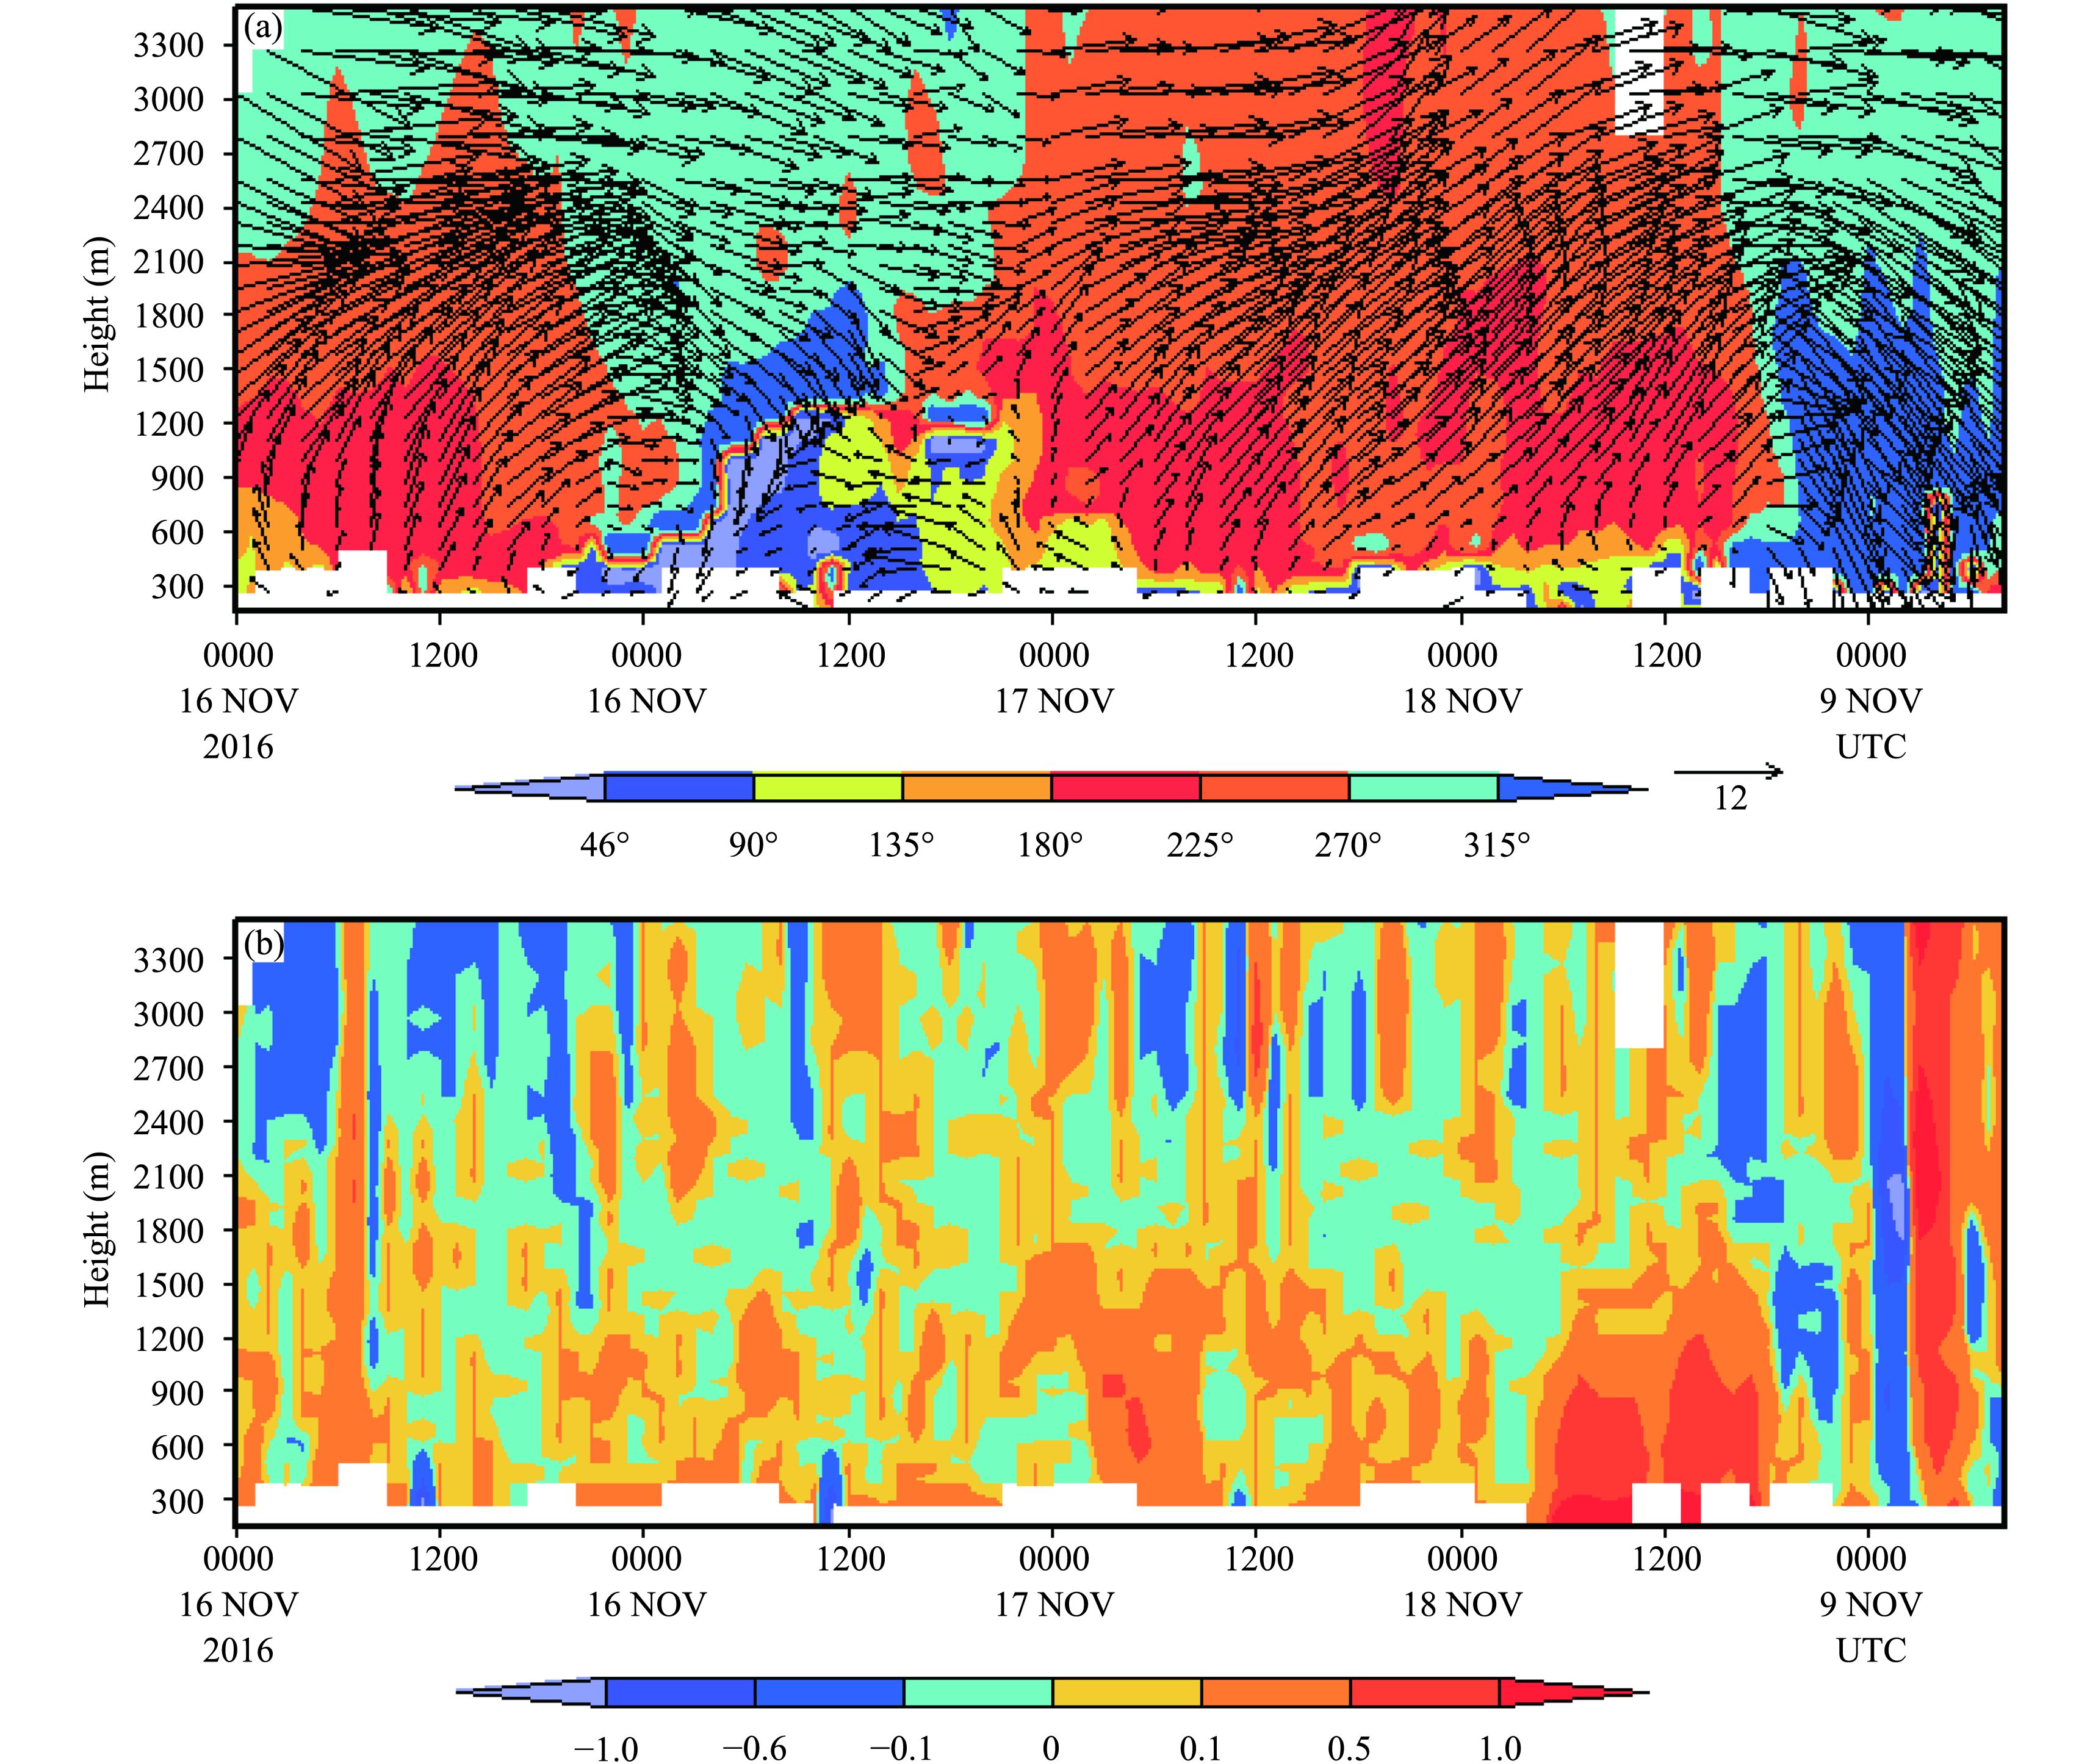
1) Phase 1. The PM2.5 concentration increased gradually from 20 to 127 μg m−3 at 1600 UTC 15 November. The increase in PM2.5 concentrations was probably associated with the long-range transport of air pollution by southerly winds (Fig. 4b), especially in the early stages. The predominant wind was southerly wind from the surface to the upper layers of the atmosphere ( < 2400 m).
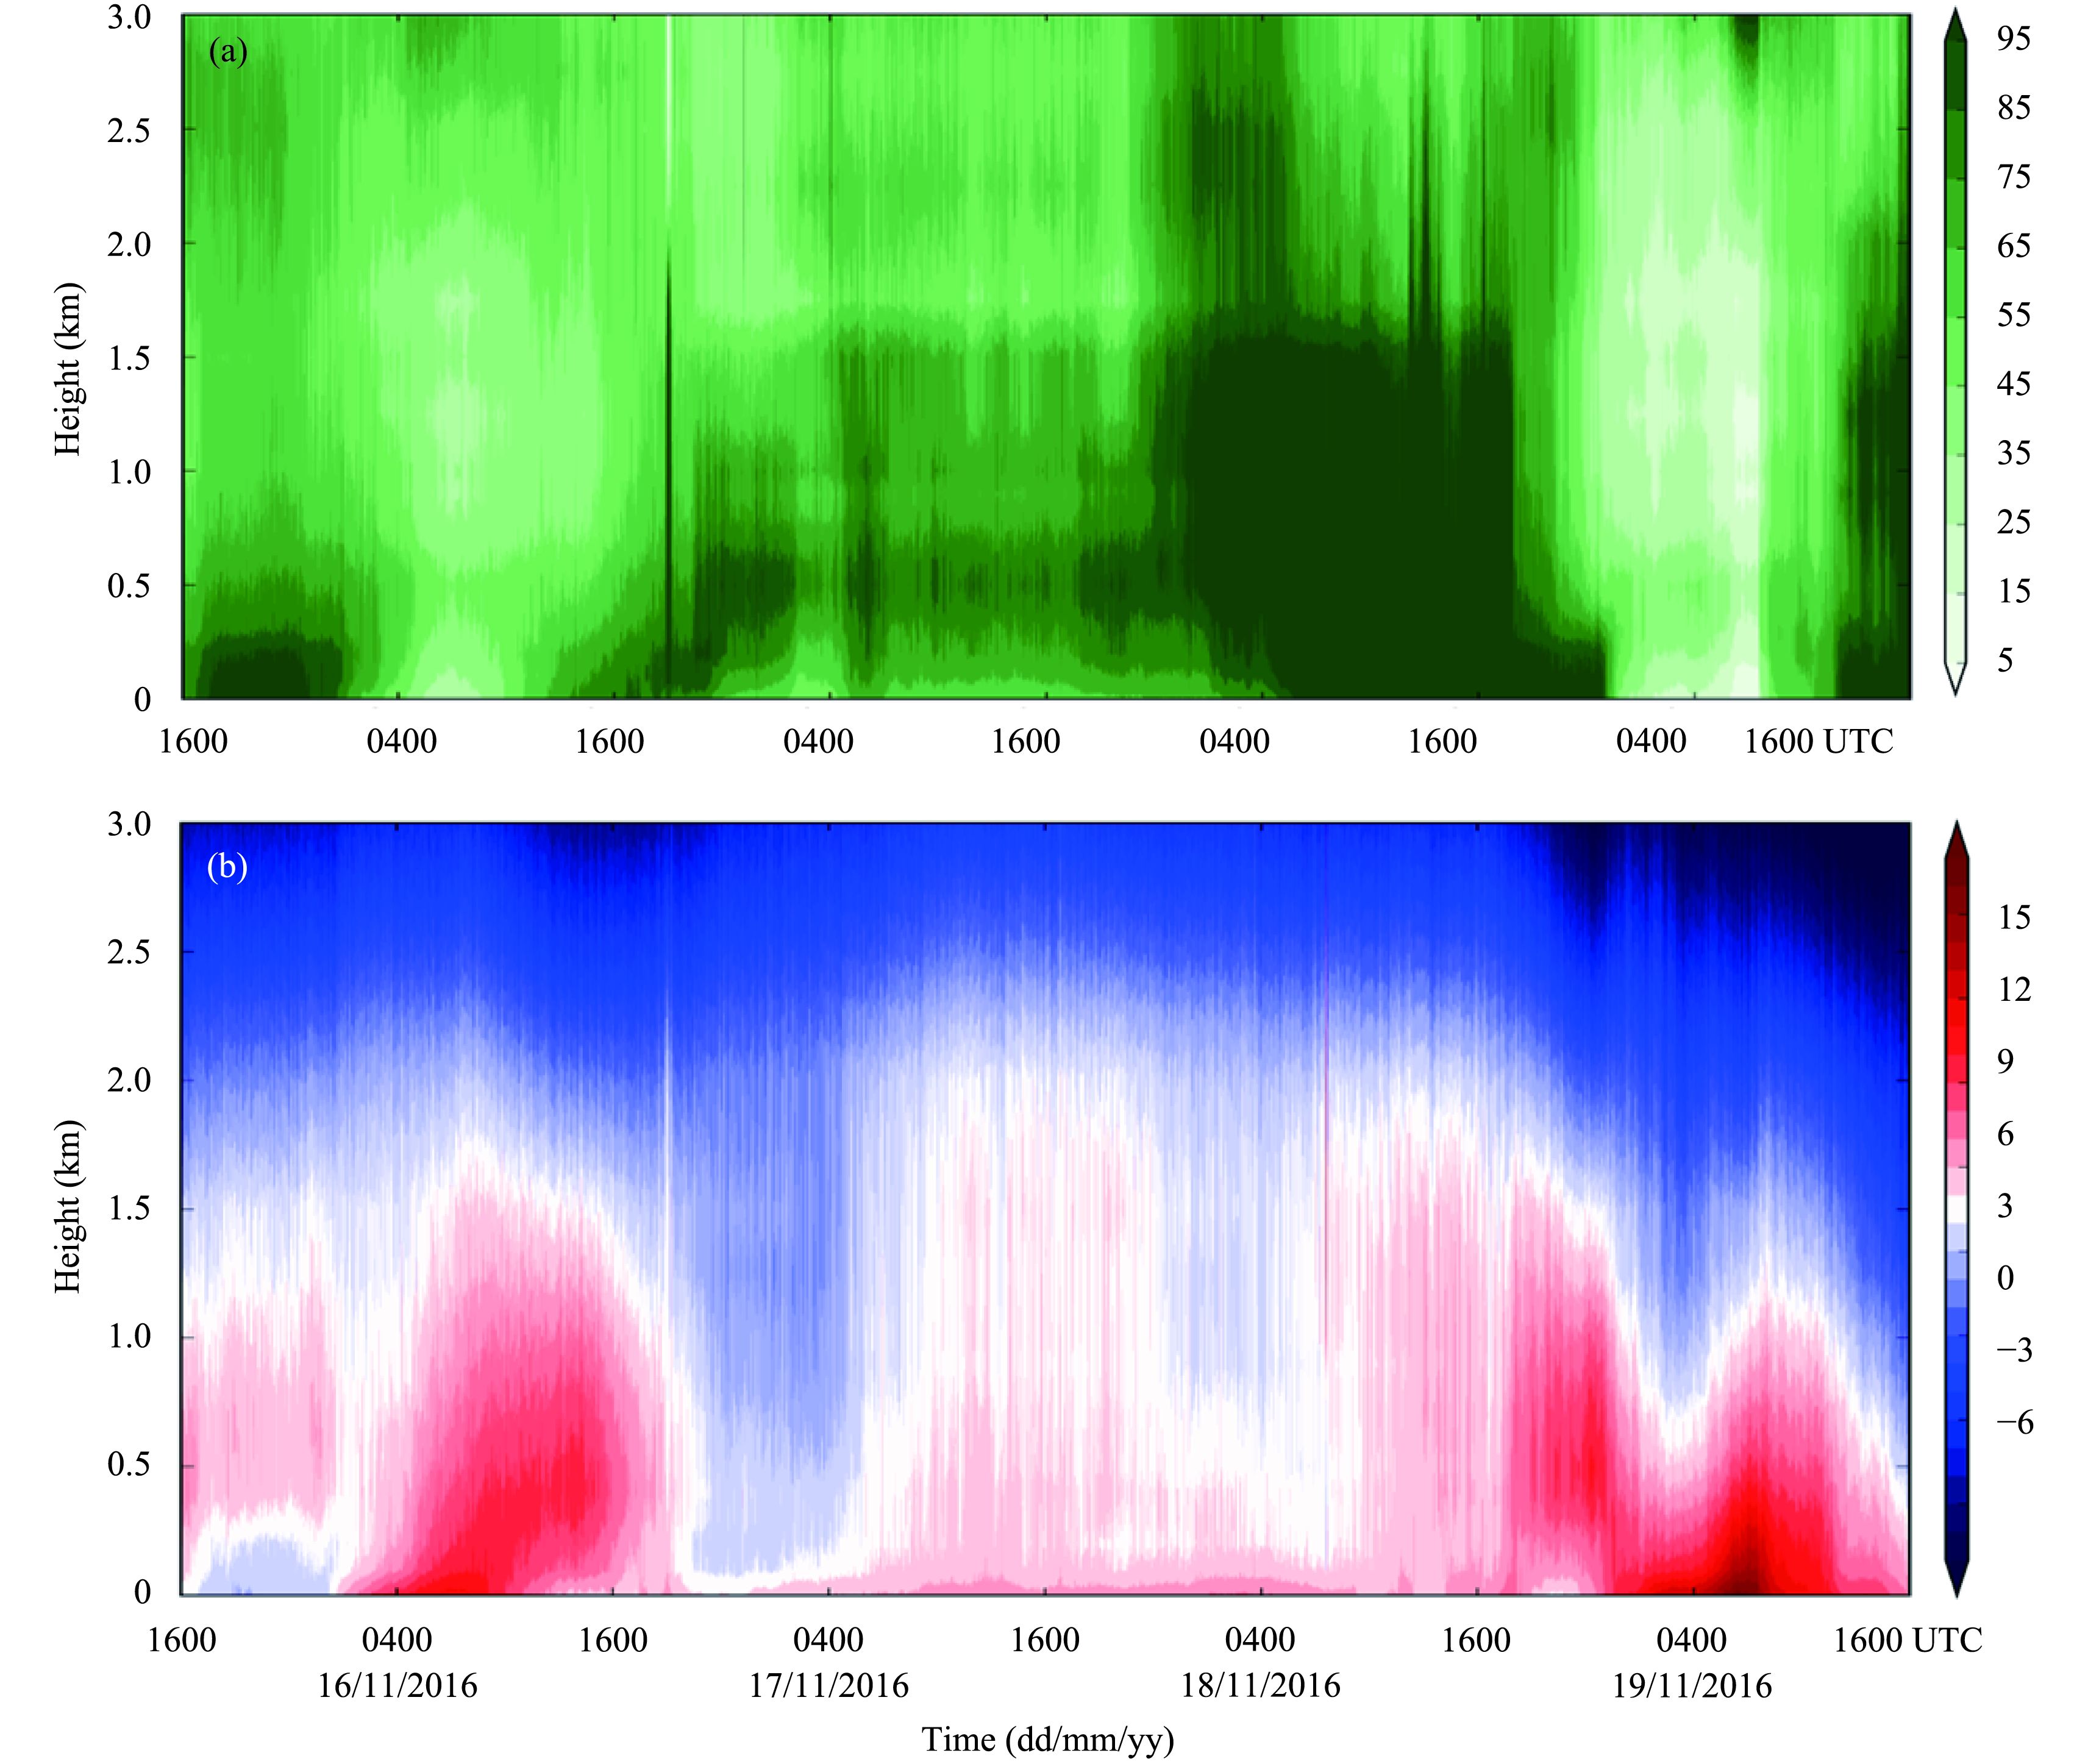
2) Phase 2. The PM2.5 concentration decreased to 71 μg m−3 within 6 h and remained stable until 0900 UTC 16 November. A southerly wind dominated in the upper layers, accompanied by a weak easterly wind at the surface in the early stages (Fig. 7a) and within the boundary layer (Fig. 7a). The NRB values from the aerosol LiDAR also decreased (Fig. 8). This wind profile probably favored the diffusion of aerosols into the upper layer (Sun et al., 2016). The relative humidity decreased dramatically, both at the surface and in the boundary layer (Fig. 9a), which did not favor the growth of particles (Fig. 6c).
3) Phase 3. The PM2.5 concentrations increased significantly within 8 h and reached 154 μg m−3 at 1800 UTC 16 November. Particles mainly accumulated in the layer below 1500 m, as shown by LiDAR NRB profile (Fig. 8). The prevailing surface wind was similar to that in phase 2, i.e., easterly winds dominated below 1200 m (Fig. 7a). Northerly winds dominated in the upper layers and easterly winds with decreasing height. These meteorological structures resulted in a weak downward motion that did not reach the ground. The capacity of the atmosphere to disperse the pollution decreased and the concentrations of pollutants rapidly increased, in agreement with the theoretical and practical case study of Sun et al. (2016). The relative humidity increased significantly and there was a temperature inversion at 1000 m (Figs. 6c, 9), in good agreement with the increase in PM2.5 concentrations.
4) Phase 4. The PM2.5 concentrations decreased substantially to 82 μg m−3 at 6 h later and remained stable until 0600 UTC 17 November. Easterly winds were dominant in the lower layer ( < 1000 m) of the atmosphere, but the winds in the upper layer returned to a southerly direction and there was a relatively strong upward motion of air produced by the easterly winds ( Fig. 7b), which was favorable for the diffusion of surface particles into the upper layer. The NRB values decreased significantly at the surface because the vertical uplift caused by the strong easterly winds raised the surface pollutants into the troposphere. This is supported by the increased NRB values within the layer (800–1300 m) at 2000 UTC 16 to 0600 UTC 17 November (Fig. 8). The inversion layer was destroyed during this period (Fig. 9b).
5) Phase 5. The PM2.5 concentrations increased gradually from 0600 UTC 17 November and reached a maximum of 223 μg m−3 at 0700 UTC 18 November. High PM2.5 concentrations were maintained for >10 h until 2200 UTC 18 November. During this phase, regional transport within the boundary layer played an important part in increasing the PM 2.5 concentrations (Zheng et al., 2015). Although the near-surface wind was still a weak easterly wind, a clear southerly wind appeared above 300–2000 m during this period (Fig. 7a) and upward motion occurred below 2000 m (Fig. 7b). This suggested that a large amount of pollutants and water vapor could be transported to Beijing from the upstream high concentration area in central and southern Hebei Province. The relative humidity gradually increased both at the surface and within the boundary layer, while the surface pressure decreased (Fig. 6c). The temperature inversion layer was clear and strengthened further several hours before 2200 UTC 8 November (Fig. 9b). There were two high peak values of the NRB in the vertical profile: one near the surface and the other at about 1000 m (Fig. 8). These typical features of regional transport were also reported by Zhao et al. (2013).
6) Phase 6. The PM2.5 concentration decreased dramatically and the pollution episode ended when the prevailing winds changed to northerly winds on 19 November. Figure 10 shows a conceptual graph of the wind field (at different heights) and trends in PM2.5 concentration.

|
| Figure 6 (a) Hourly PM2.5 concentrations, (b) surface wind speeds and direction,and (c) pressure and relative humidity in Beijing city during the pollution episode. |
|
| Figure 7 Temporal evolution of (a) the wind profile (arrows; shading denotes wind direction) and (b) the vertical velocity (m s−1). |

|
| Figure 8 Temporal evolution of the NRB recorded by the Mini-MPL. |
|
| Figure 9 Time evolution of (a) the vertical structure from the relative humidity (%) measured by the ground-based microwave radiometer and (b) the temperature (°C) at Beijing Observatory. |

|
| Figure 10 Conceptual graph of wind field (upper panel) and surface PM2.5 concentration (lower panel) in the six different phases. |
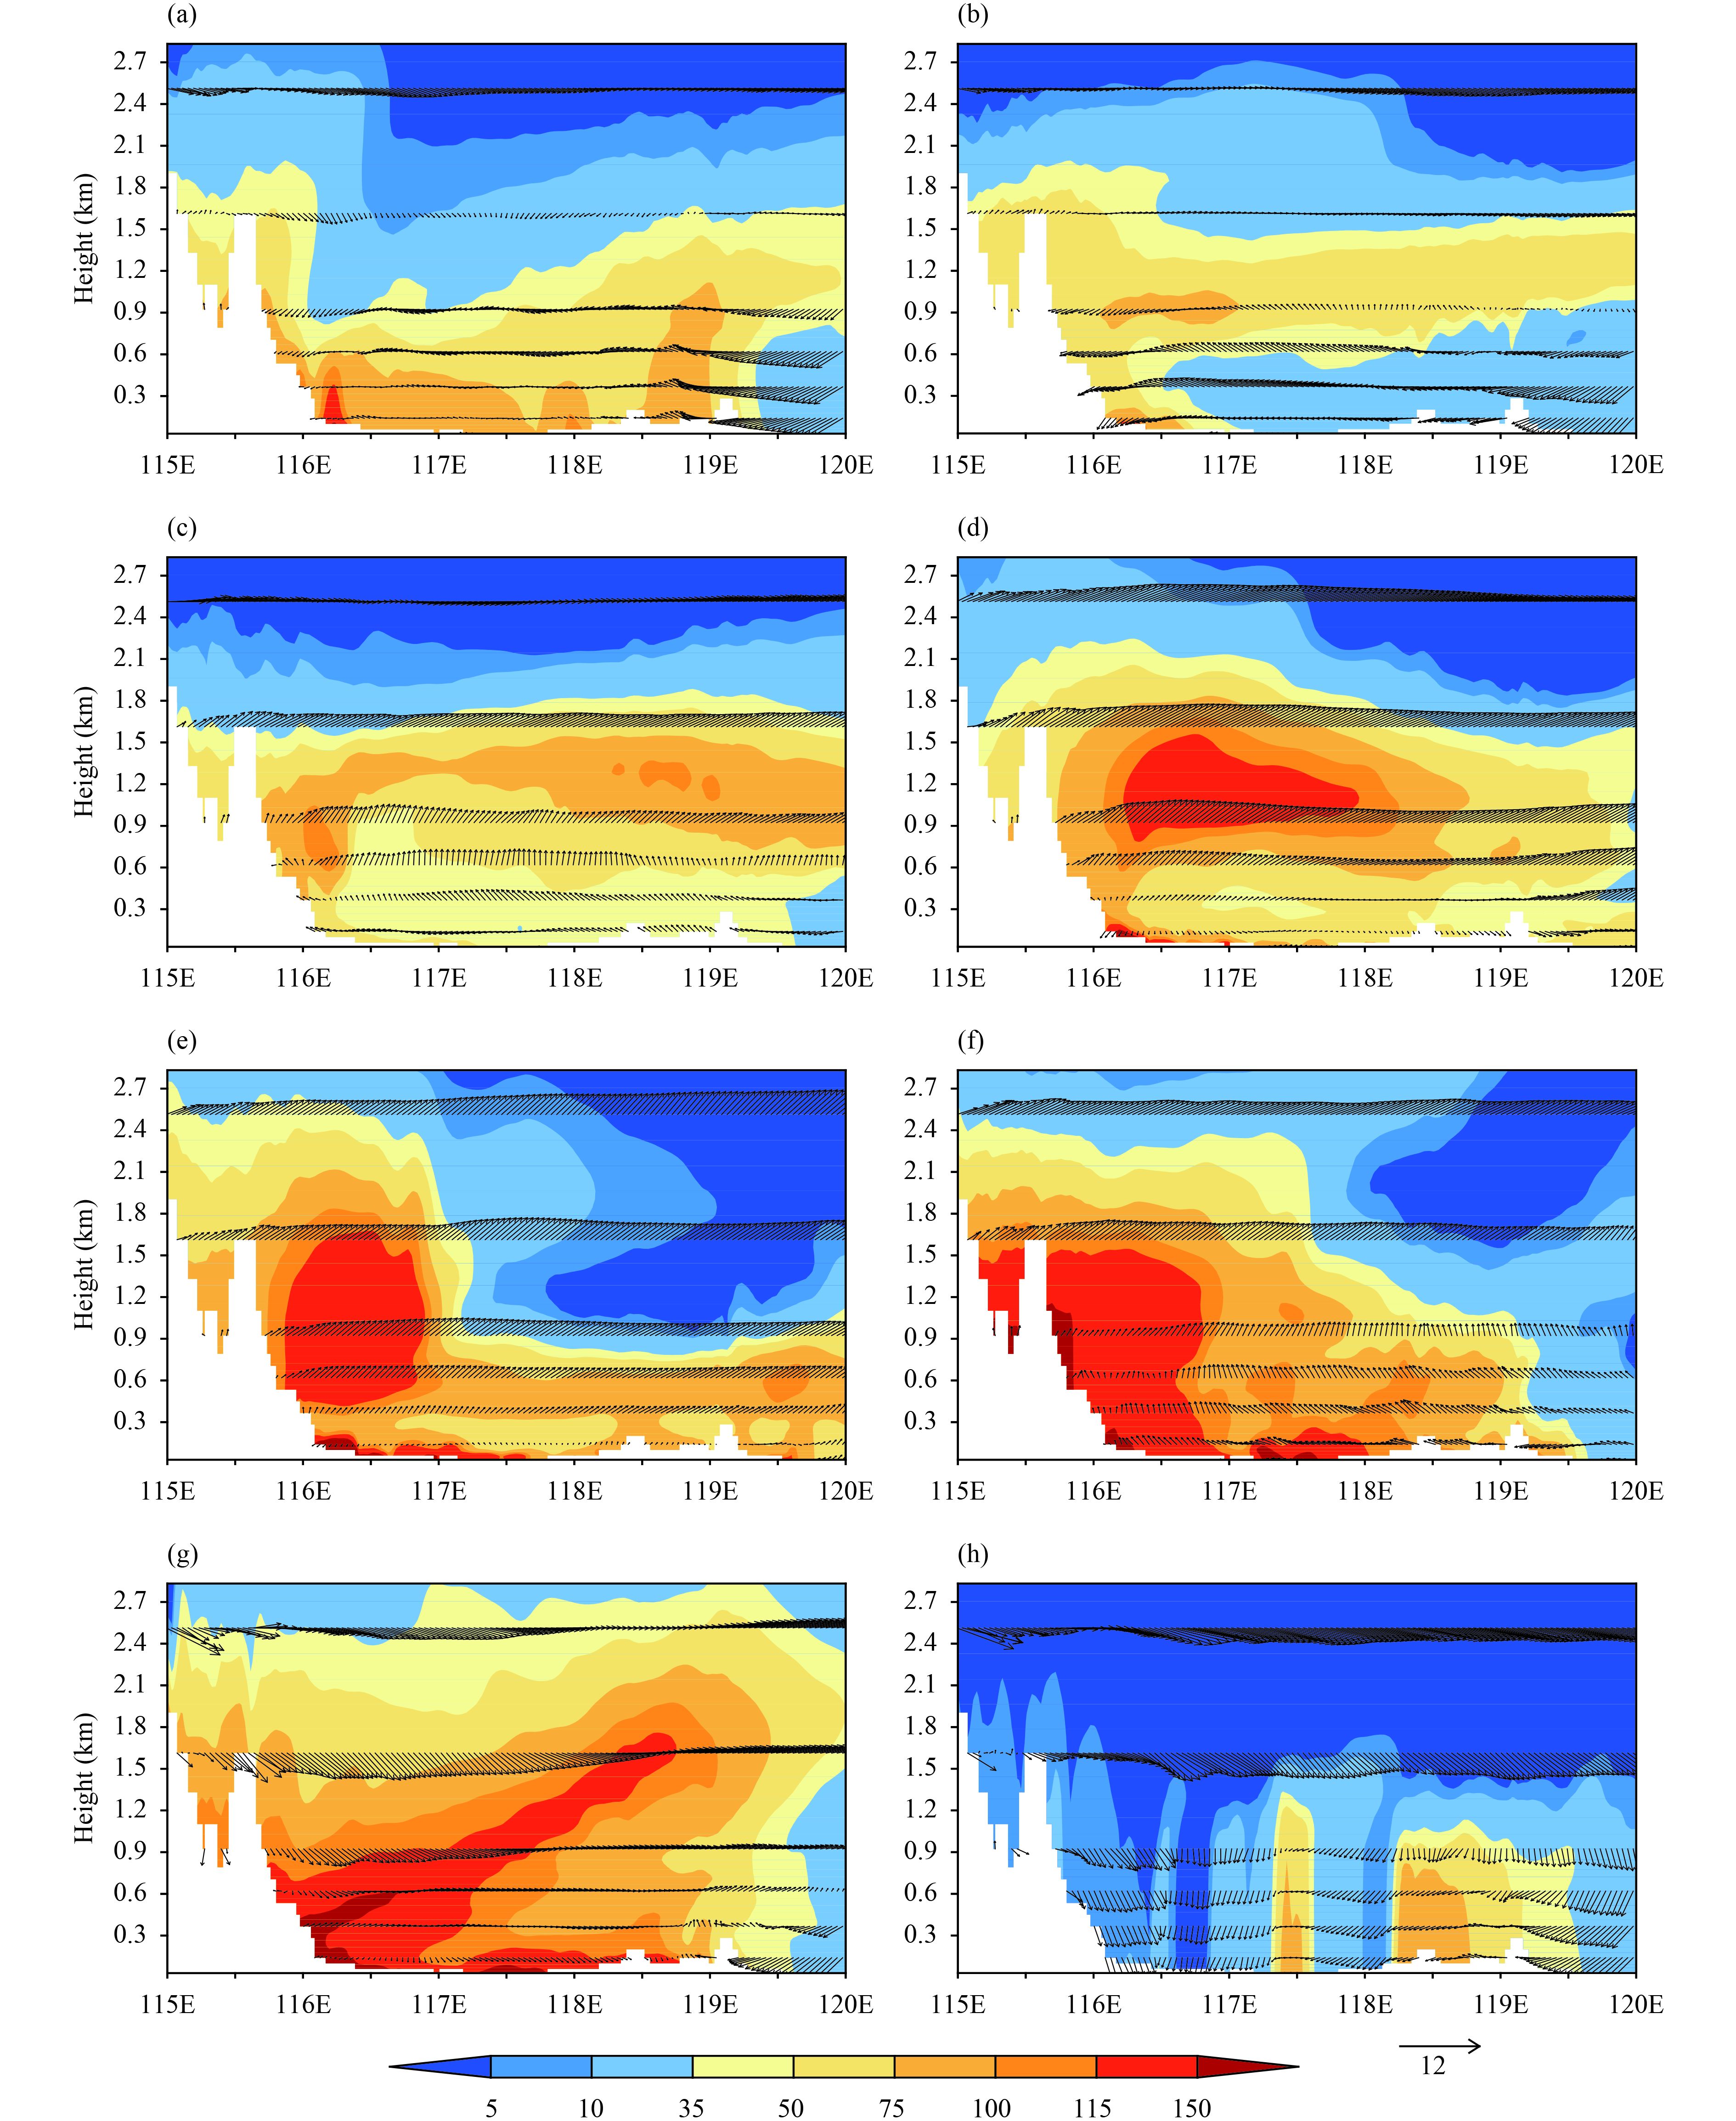
Figure 11 shows the temporal evolution of PM2.5 concentrations and the vertical structure of winds simulated by the RMAPS-Chem model. The PM2.5 concentration in Beijing was high below 1.5 km at 1000 UTC 16 November (Fig. 11a) and an easterly wind appeared in eastern Beijing below 1 km and moved westward during the night of 16 November. Dynamic convergence was enhanced in front of the easterly wind and the near-ground PM2.5 concentration therefore increased (Fig. 11b). After the passage of the easterly wind, the near-ground PM2.5 pollution was lifted into the upper atmosphere and its concentration decreased (Figs. 11c, d). The speed of the easterly wind decreased and the southerly wind strengthened, which increased the transport of PM2.5 from southern Beijing. The PM2.5 concentration in Beijing below 2 km increased again, especially along the Taihang Mountains (Figs. 11e, f). The height of the mixing layer decreased late on 18 November, indicating that particles in the upper atmosphere were compressed again at near-surface levels (Fig. 11g). With the invasion of cold air and increasing northerly winds after 19 November, the ability of the atmosphere to disperse pollutants increased, leading to a rapid decrease in the PM2.5 concentration. The pollutants were cleared away from the surface to the upper layer (Fig. 11h).
The evolution of pollution derived from the model was in good agreement with the surface observations and the data in the vertical direction, although the former revealed more detailed spatial structures. Dilution by clean air masses from the sea is also important. Beijing is dominated by clean easterly winds below 900 m, so horizontal transport may not be important below 900 m. However, the higher concentrations of pollutants in the upper atmosphere are not all a result of upward movement; the atmosphere above 900 m is dominated by southerly winds and the higher pollutant concentrations are from both upward transport and horizontal transport from the south.
|
| Figure 11 Vertical sections of PM2.5 concentration (μg m−3) and the wind field along west–east spatial profiles at 39.8°N across Beijing from the RMAPS-Chem simulation at (a) 1000 UTC 16, (b) 2000 UTC 16, (c) 0600 UTC 17, (d) 1600 UTC 17, (e) 0200 UTC 18, (f) 1200 UTC 18, (g) 2200 UTC 18, and (h) 0800 UTC 19 November. |
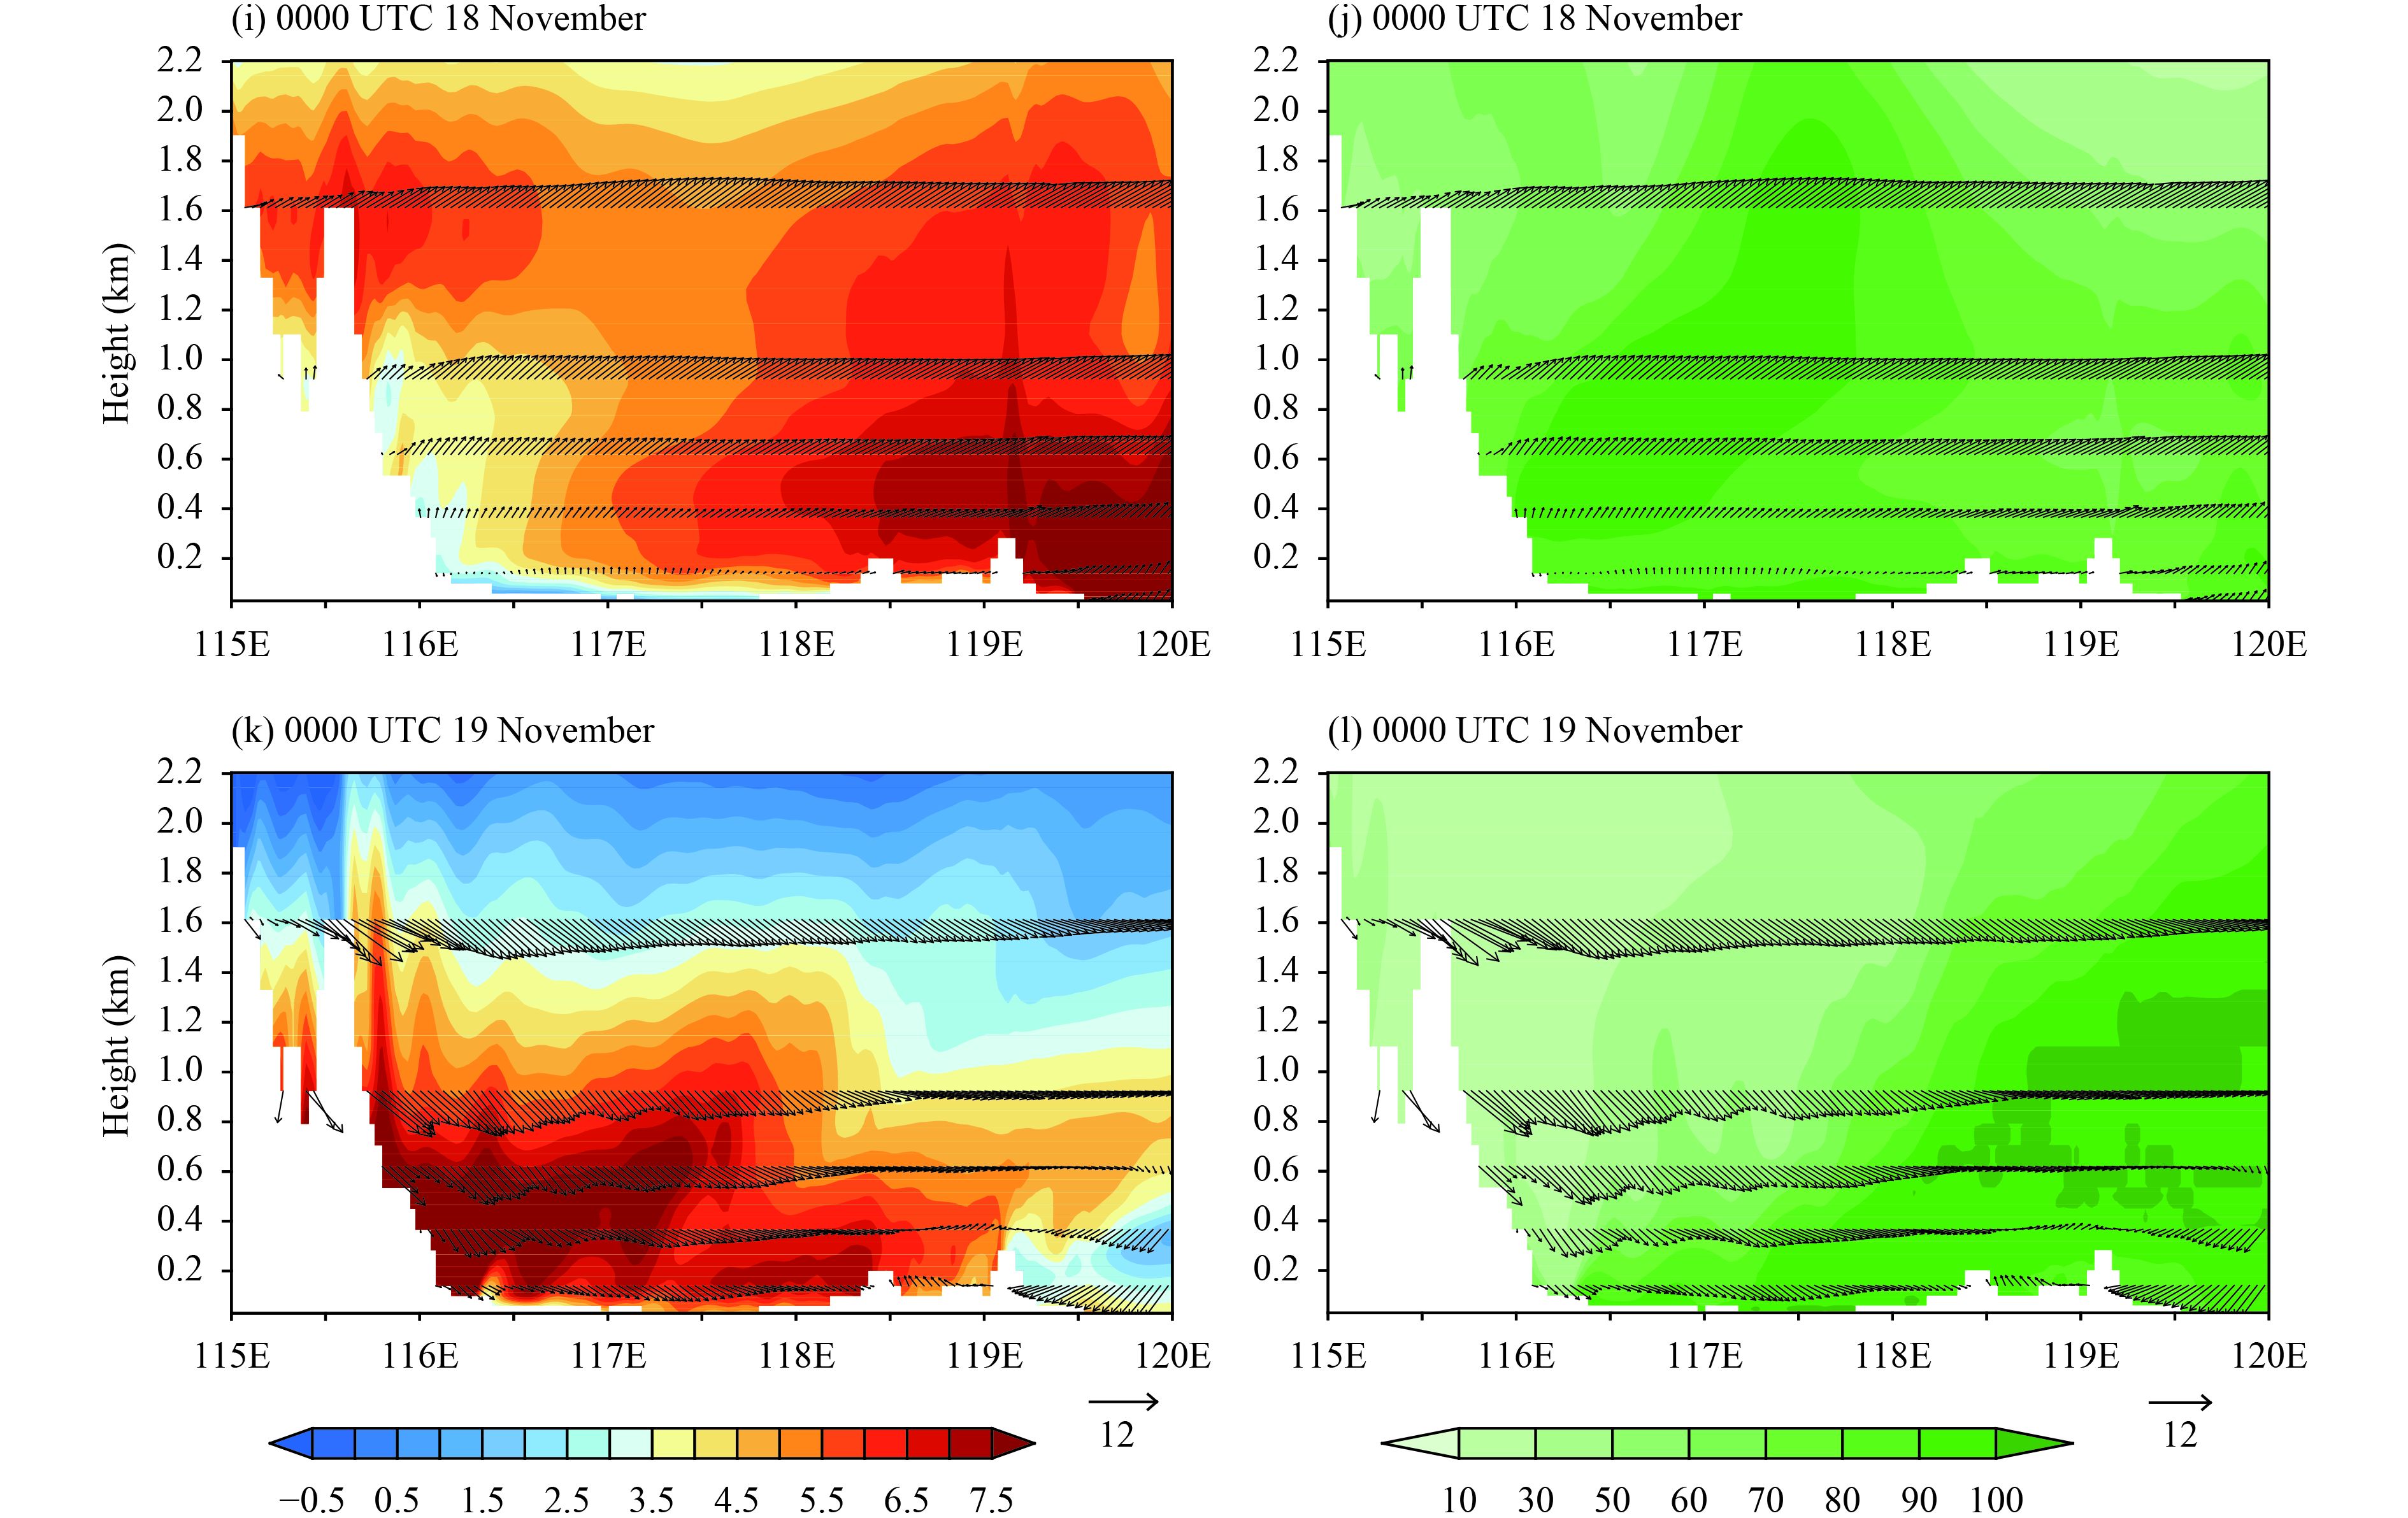
Figure 12 shows the model simulation of the vertical profiles of atmospheric temperature and relative humidity. There was a multi-layer inversion in the temperature profile and the atmosphere over Beijing was stable at 0000 UTC (Fig 12a). The multi-layer inversion structure was damaged by the easterly wind (Fig. 12c) and there was no significant inversion at 1200 UTC. Warm air rose across the mountains and moved eastward to the plain. This brought warm surface air to the upper levels of the atmosphere and formed a warm tongue from the mountains to the plain at a height of 1.2–1.4 km at 2000 UTC (Fig. 12e). The warm tongue blocked the PM2.5 pollution below 1.4 km. The PM2.5 concentration was lower near the surface than in the upper atmosphere on the morning of 17 November (Fig. 11c). The dynamic and thermal structures were very different from those seen earlier. The multi-layer inversion structure was re-established and further strengthened by warm advection from 17 November until early morning on 19 November (Figs. 12g, i, k). The relative humidity in the boundary layer was low, but was nearly saturated in the atmosphere above 1 km, which favored the formation of low clouds (Fig. 12h). The temperature of the top of the low clouds decreased as a result of longwave radiation at the top of the low clouds. An inversion structure was established because the easterly winds transported the warm air layer above the cloud top. The boundary layer was later mainly affected by southerly winds and the stability of the atmosphere increased.
|
| Figure 12 (Continued). |
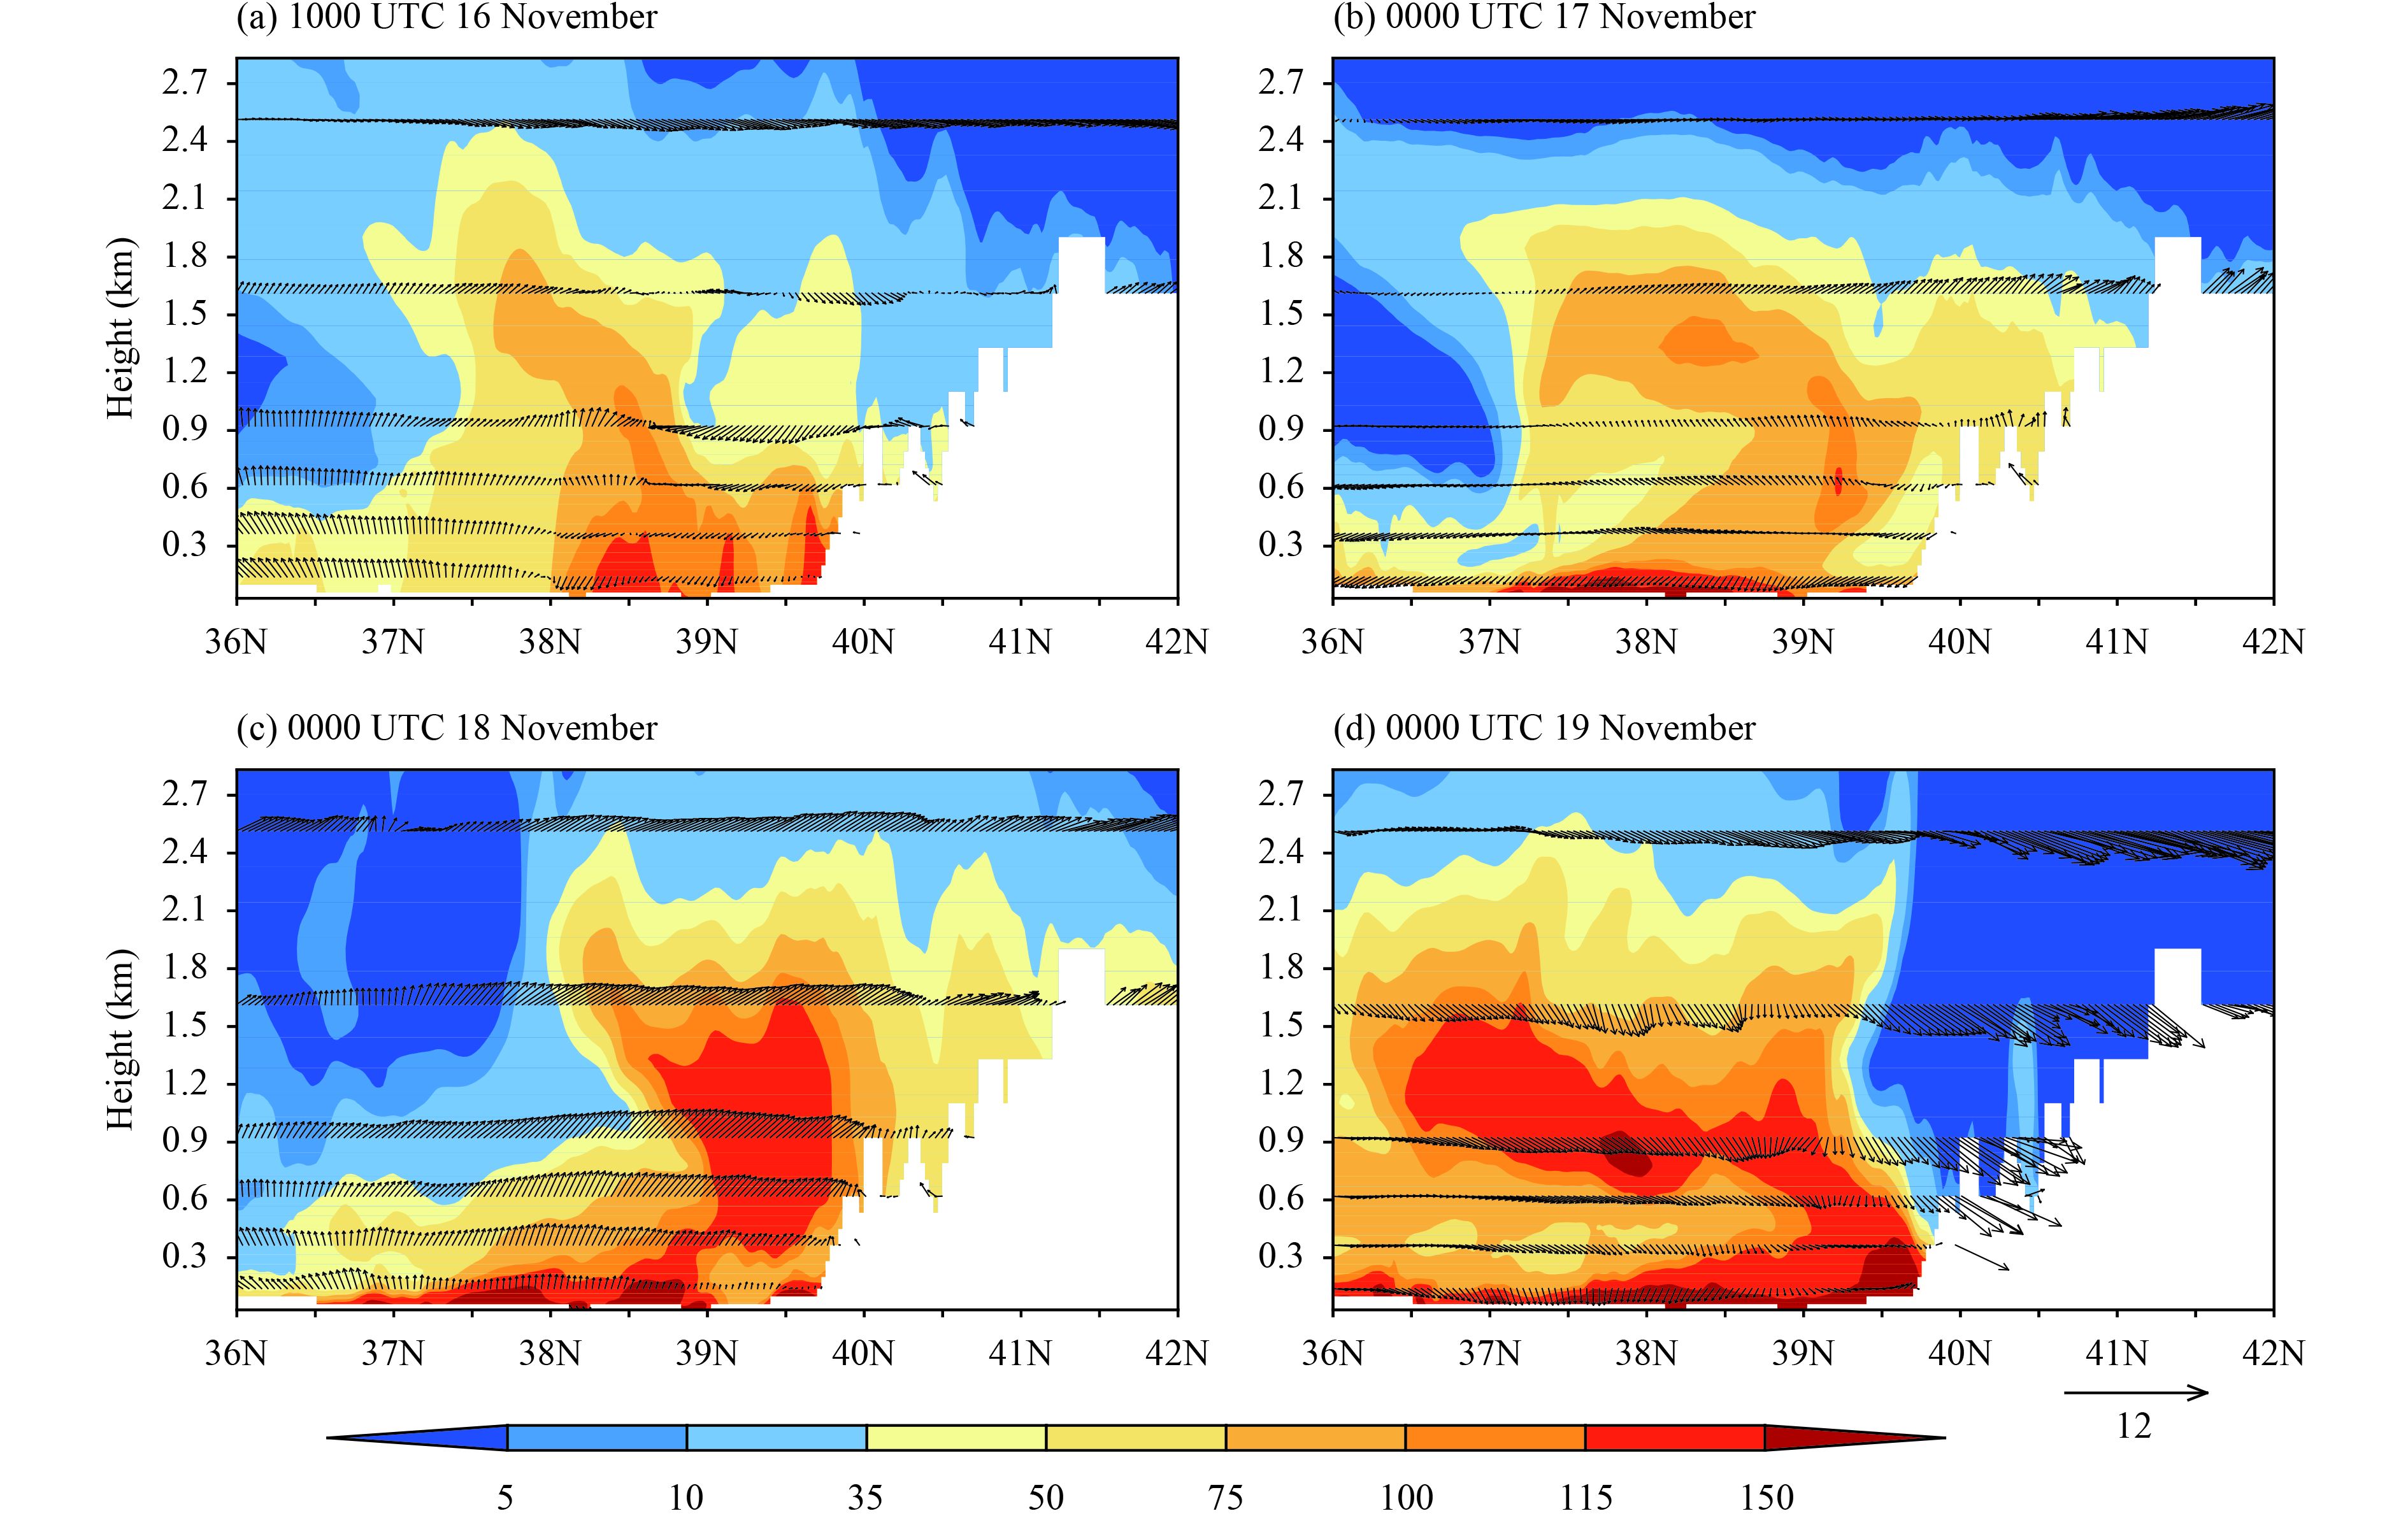
It can be seen from the south–north sections in Fig. 13 that there were two high-pollution zones in Beijing and Hebei, but the positions of these two zones of severe pollution did not coincide. The higher pollutant zone was observed at 1000 and 0000 UTC (Figs. 13a, b). The PM2.5 concentration was affected by uplift and the scavenging was low in the central Beijing and northern Hebei Province. The concentration of pollutants in southern Hebei was high. When the easterly wind weakened and the southerly wind increased, the southerly wind speed was lower near the mountain side due to the effects of the terrain, but was large away from the mountain. If only the v wind shear in the x direction was considered, positive vorticity formed at different heights and convergence occurred. Polluted air transported to the upper levels of the atmosphere tended to approach the Taihang Mountains. Therefore, a center of high concentration of PM2.5 formed at the heights of 300–1500 m. With the continued influence of the southerly wind, the high-pollution zone originally seen in southern Hebei also moved to Beijing. Figure 10 shows that at the same time the pollutants were conveyed toward Beijing at heights of 900–1500 m at 0000 UTC November 18 (Fig. 13c) and the layer of high PM2.5 concentrations became thicker. Under the impact of the southerly wind, the polluted air mass rose over the Yanshan Mountains north of Beijing and penetrated into the northern mountains of Hebei Province. The upper-level polluted air was mixed with the lower-level air. With the movement of cold air to Beijing, the PM2.5 pollution was transported northwestward and there was a highly polluted zone at heights of 900–1500 m at 0000 UTC 19 November (Fig. 13d). The upstream pollutants moved forward with the cold air to Beijing. When the northerly winds increased and continued for some time, the pollutant zone and the local pollutants that had accumulated in the Beijing area were transported downstream and the episode of heavy pollution ended.
|
| Figure 13 Vertical sections of PM2.5 concentration (μg m−3) and wind fields south–north across 116.0°E over Beijing from the RMAPS-Chem simulation. |
A heavy pollution episode was studied by using a combination of surface observations and model simulations. The main conclusions are as follows.
(1) Easterly winds in Beijing are favorable for the dispersion of surface PM2.5. Three factors affect the dispersion of pollutants: the strength and height of upward motion produced by the easterly winds; the initial height of the upward motion—a lower initial height of upward motion means stronger dilution by the easterly winds; and the dilution of pollutants by easterly winds from the clean ocean air masses.
(2) The easterly winds first destroyed the temperature inversion and then transported both the polluted and warm air into the upper atmosphere where the inversion layer was re-established. The inversion was enhanced by the southerly winds and the pollution was heavier than before.
(3) A vortex was established as a result of the dynamic effects of the southerly winds, which produced convergence along the Taihang Mountains. The air pollutants in southern and central Hebei Province were transported to Beijing at both the lower and upper levels of the atmosphere. The original inversion was enhanced by the thermal effects of the southerly winds and a more stable boundary layer was maintained.
(4) When the southerly winds persistently impacted the Jing–Jin–Ji region, the layer of pollution became deeper, with some polluted air crossing the Yanshan Mountains and moving into more northern mountainous regions.
| Cai, W. J., K. Li, H. Liao, et al., 2017: Weather conditions conducive to Beijing severe haze more frequent under climate change. Nature Climate Change, 7, 257–262. DOI:10.1038/nclimate3249 |
| Duan, F. K., K. B. He, Y. L. Ma, et al., 2006: Concentration and chemical characteristics of PM2.5 in Beijing, China: 2001–2002 . Sci. Total Environ., 355, 264–275. DOI:10.1016/j.scitotenv.2005.03.001 |
| Fu, G. Q., W. Y. Xu, R. F. Rong, et al., 2014: The distribution and trends of fog and haze in the North China Plain over the past 30 years. Atmos. Chem. Phys. Discuss., 14, 16123–16149. DOI:10.5194/acpd-14-16123-2014 |
| Gao, M., S. K. Guttikunda, G. R. Carmichael, et al., 2015: Health impacts and economic losses assessment of the 2013 severe haze event in Beijing area. Sci. Total Environ., 511, 553–561. DOI:10.1016/j.scitotenv.2015.01.005 |
| He, K. B., F. M. Yang, Y. L. Ma, et al., 2001: The characteristics of PM2.5 in Beijing, China . Atmos. Environ., 35, 4959–4970. DOI:10.1016/S1352-2310(01)00301-6 |
| Hong, C. P., Q. Zhang, K. B. He, et al., 2017: Variations of China’s emission estimates: Response to uncertainties in energy statistics. Atmos. Chem. Phys., 17, 1227–1239. DOI:10.5194/acp-17-1227-2017 |
| Hou, Q., X. Q. An, Y. Wang, et al., 2012: An assessment of China’s PM10-related health economic losses in 2009 . Sci. Total Environ., 435-436, 61–65. DOI:10.1016/j.scitotenv.2012.06.094 |
| Hou, Q., X. Q. An, T. Yan, et al., 2016: Assessment of resident’s exposure level and health economic costs of PM10 in Beijing from 2008 to 2012 . Sci. Total Environ., 563–564, 557–565. DOI:10.1016/j.scitotenv.2016.03.215 |
| Huang, R. J., Y. L. Zhang, C. Bozzetti, et al., 2014: High secondary aerosol contribution to particulate pollution during haze events in China. Nature, 514, 218–222. DOI:10.1038/nature13774 |
| Jiang, C., H. Wang, T. Zhao, et al., 2015: Modeling study of PM2.5 pollutant transport across cities in China’s Jing–Jin–Ji region during a severe haze episode in December 2013 . Atmos. Chem. Phys., 15, 5803–5814. DOI:10.5194/acpd-15-3745-2015 |
| Li, Y. R., C. X. Ye, J. Liu, et al., 2016: Observation of regional air pollutant transport between the megacity Beijing and the North China Plain. Atmos. Chem. Phys., 16, 14265–14283. DOI:10.5194/acp-16-14265-2016 |
| Liu, C. H., Y. Cao, and J. L. Fu, 2013: An objective analysis algorithm based on the variational method. Acta Meteor. Sinica, 71, 1172–1182. DOI:10.11676/qxxb2013.091 |
| Liu, L. L., and L. L. Wang, 2015: Characteristics of winter heavy pollution episodes and meteorological causes and structures of boundary layer in Tianjin. Climatic Environ. Res., 20, 129–140. DOI:10.3878/j.issn.1006-9585.2014.14096 |
| Liu, S. H., Z. X. Liu, J. Li, et al., 2009: Numerical simulation for the coupling effect of local atmospheric circulations over the area of Beijing, Tianjin, and Hebei Province. Sci. China Earth Sci., 52, 382–392. DOI:10.1007/s11430-009-0030-2 |
| Liu, X. G., J. Li, Y. Qu, et al., 2013: Formation and evolution mechanism of regional haze: A case study in the megacity Beijing, China. Atmos. Chem. Phys., 13, 4501–4514. DOI:10.5194/acpd-12-16259-2012 |
| Liu, Z. R., B. Hu, Q. Liu, et al., 2014: Source apportionment of urban fine particle number concentration during summertime in Beijing. Atmos. Environ., 96, 359–369. DOI:10.1016/j.atmosenv.2014.06.055 |
| Quan, J., Q. Zhang, H. He, et al., 2011: Analysis of the formation of fog and haze in North China Plain (NCP). Atmos. Chem. Phys. Discuss., 11, 11911–11937. DOI:10.5194/acp-11-8205-2011 |
| Quan, J. N., X. X. Tie, Q. Zhang, et al., 2014: Characteristics of heavy aerosol pollution during the 2012–2013 winter in Beijing, China. Atmos. Environ., 88, 83–89. DOI:10.1016/j.atmosenv.2014.01.058 |
| Song, C., P. Tao, and L. Yao, 2015: Analysis of the characteristics and evolution modes of PM2.5 pollution episodes in Beijing, China during 2013 . Int. J. Environ. Res. Publ. Health, 12, 1099–1111. DOI:10.3390/ijerph120201099 |
| Song, Y., X. Y. Tang, S. D. Xie, et al., 2007: Source apportionment of PM2.5 in Beijing in 2004 . J. Hazard. Mater., 146, 124–130. DOI:10.1016/j.jhazmat.2006.11.058 |
| Sun, J. S., 2005: The effects of vertical distribution of the lower level flow on precipitation location. Plateau Meteor., 24, 62–69. DOI:10.3321/j.issn:1000-0534.2005.01.010 |
| Sun, Y. L., Q. Jiang, Z. F. Wang, et al., 2014: Investigation of the sources and evolution processes of severe haze pollution in Beijing in January 2013. J. Geophys. Res., 119, 4380–4398. DOI:10.1002/2014JD021641 |
| Sun, Z. B., X. Q. An, Y. Tao, et al., 2013: Assessment of population exposure to PM10 for respiratory disease in Lanzhou (China) and its health-related economic costs based on GIS . BMC Public Health, 13, 891. DOI:10.1186/1471-2458-13-891 |
| Sun, Z. B., X. N. Liao, Z. S. Wang, et al., 2016: Scavenging effect of Rime and east wind on PM2.5 under air heavy pollution in Beijing . Environ. Sci., 37, 3679–3685. DOI:10.13227/j.hjkx.2016.10.001 |
| Wang, L. L., N. Zhang, Z. R. Liu, et al., 2014: The influence of climate factors, meteorological conditions, and boundary-layer structure on severe haze pollution in the Beijing–Tianjin– Hebei region during January 2013. Adv. Meteor., 2014, 14. DOI:10.1155/2014/685971 |
| Wang, L. T., Z. Wei, J. Yang, et al., 2014: The 2013 severe haze over southern Hebei, China: Model evaluation, source apportionment, and policy implications. Atmos. Chem. Phys., 14, 3151–3173. DOI:10.5194/acpd-13-28395-2013 |
| Wang, H., G. Y. Shi, X. Y. Zhang, et al., 2015: Mesoscale modelling study of the interactions between aerosols and PBL meteorology during a haze episode in China Jing–Jin–Ji and its near surrounding region. Part 2: Aerosols’ radiative feedback effects. Atmos. Chem. Phys., 15, 3277–3287. DOI:10.5194/acpd-14-28269-2014 |
| Zhao, X. J., P. S. Zhao, J. Xu, et al., 2013: Analysis of a winter regional haze event and its formation mechanism in the North China Plain. Atmos. Chem. Phys., 13, 5685–5696. DOI:10.5194/acpd-13-903-2013 |
| Zheng, G. J., F. K. Duan, H. Su, et al., 2015: Exploring the severe winter haze in Beijing: The impact of synoptic weather, regional transport and heterogeneous reactions. Atmos. Chem. Phys., 15, 2969–2983. DOI:10.5194/acpd-14-17907-2014 |
 2018, Vol. 32


