The Chinese Meteorological Society
Article Information
- ZHAN, Mingjin, Xiucang LI, Hemin SUN, et al., 2018.
- Changes in Extreme Maximum Temperature Events and Population Exposure in China under Global Warming Scenarios of 1.5 and 2.0°C: Analysis Using the Regional Climate Model COSMO-CLM. 2018.
- J. Meteor. Res., 32(1): 99-112
- http://dx.doi.org/10.1007/s13351-018-7016-y
Article History
- Received February 4, 2017
- in final form September 17, 2017
2. University of Chinese Academy of Sciences, Beijing 100049;
3. Collaborative Innovation Center on Forecast and Evaluation of Meteorological Disasters/School of Geography and Remote Sensing, Nanjing University of Information Science & Technology, Nanjing 210044;
4. National Climate Center, China Meteorological Administration, Beijing 100081;
5. Jiangxi Provincial Climate Center, Nanchang 330046
An increase in the global mean surface temperature has been observed over recent centuries. Between 1986 and 2005, the global mean surface temperature rose > 0.61°C above pre-industrial levels (1850–1900) ( IPCC, 2013). Under this trend of global warming, extreme events such as heat waves have changed in terms of their frequency, intensity, range of impact, and duration (IPCC, 2012). On December 12, 2015, the Paris Agreement was negotiated by representatives of 195 countries at the 21st Conference of the Parties of the UNFCCC in Paris and was adopted by consensus. The stated aim of the Paris Agreement (UNFCCC, 2015) is: “holding the increase in the global average temperature to well below 2.0°C above pre-industrial levels and to pursue efforts to limit the temperature increase to 1.5°C above pre-industrial levels, recognizing that this would significantly reduce the risks and impacts of climate change.” The adoption of the Paris Agreement reflects the historic importance of the global cooperation pledged to address future climate change.
The characteristics of extreme maximum temperatures and extreme maximum temperature events (EMTEs) have changed both globally and in China with global warming. Since the middle of the 20th century, there has probably been an increasing trend in the frequency of heat waves in Europe, Australia, and across much of Asia. There is medium-level confidence in this trend globally due to a lack of studies over Africa and South America (Vose et al., 2005; Hansen et al., 2006; Perkins et al., 2012; IPCC, 2013). The latest HadGHCND (Hadley Centre Global Historical Climatology Network Daily) database indicates that global trends in observed heat waves are increasing in intensity, frequency, and duration (Perkins et al., 2012). In different regions of the world, the maximum temperature has shown a significant upward trend since the latter part of the 20th century (Kothawale and Kumar, 2005; Homar et al., 2010; Kousari et al., 2013; Kruger and Sekele, 2013). Globally, 41.0% of the land area has experienced a significant increase in the annual occurrence of warm days (annual count of days when TX > 90th percentile) and 28.8% of the land area has experienced an increase in the duration of warm spells ( Alexander et al., 2006).
For most of China, the trend of an increase in air temperature has been increasing more rapidly since the 1980s (Shi et al., 2003). From a regional perspective, the characteristics of high temperatures are complex. Both the number of days and the intensities of EMTEs have increased significantly over the southeastern coast and northern areas of China, with a dramatically increasing trend since the 1990s. However, significant negative trends have been detected in the lower reaches of the Yellow River and to the north of the Yangtze River (Ding et al., 2007; Xu et al., 2009; Ding et al., 2010). Overall, significant positive trends in the frequencies of EMTEs are observed in most of China.
Changes in EMTEs are an important aspect of climate change because their effects on natural ecosystems and human society can be more profound than the mean change in temperature (Karl and Easterling, 1999; Easterling et al., 2000; Upperman et al., 2015). EMTEs have affected many parts of the world in recent years. Such events are the most prominent cause of weather-related human mortality in the USA (National Center for Health Statistics, 2007; National Weather Service, 2009) and are responsible for more deaths annually than hurricanes, lightning, tornadoes, floods, and earthquakes combined (Greene et al., 2011). Record-breaking EMTEs occurred in Europe in the summer of 2003 and it has been suggested that they were responsible for an estimated 40,000 deaths across the central and western parts of the continent (Valleron and Boumendil, 2004). A large-scale EMTE persisted across China in 2013. During this event, 57, 49, and 47 hot days (daily maximum temperature ≥ 35°C) were recorded in Changsha, Chongqing, and Hangzhou, respectively, with highest daily temperatures of 38.2, 40.9, and 40.5°C, respectively. This 2013 EMTE cost 83.56 billion RMB in direct economic losses nationwide (China Meteorological Administration, 2013). Following this historic heat wave disaster in 2013, public concern has led to an increase in research into EMTEs. To mitigate the negative impacts of EMTEs, we should not focus solely on the past, but also pay attention to future climate change and its impacts.
Climate models, including both global climate models (GCMs) and regional climate models (RCMs), are widely used as basic tools for past climate simulations and future climate projections. On a global scale, the Inter-Sectoral Impact Model Intercomparison Project has performed a series of climate change impact studies driven by GCMs (Dankers et al., 2013; Davie et al., 2013; Ito et al., 2016). The resolution of GCMs on the regional scale is too low to support studies of the impact of climate change. Statistical downscaling can be used to improve the resolution of GCMs, but physical mechanisms and dynamic processes are ignored. Based on dynamical downscaling, RCMs are better for capturing extremes at high resolution in regions of complex topography and land surface processes. The COSMO-CLM (COnsortium for Small-scale MOdeling in CLimate Mode or CCLM) regional climate model is developed from the local model of the German Meteorological Office and has been used for simulations of temperature and rainfall in some Chinese regions, such as the Tarim River, the Yangtze River, the Huaihe River, and the Pearl River basins (Gemmer et al., 2008; Tan et al., 2012; Cao et al., 2013; Fischer et al., 2013; Wang et al., 2013). In this study, we used the projected daily maximum temperature data in China under the representative concentration pathway (RCP) 2.6 and 4.5 scenarios from the CCLM for 1961–2100.
Research on extreme climate events has developed from value analysis at a single site (Wang and Yang, 2007; Zhang et al., 2008) to related investigations of intensity, impact range, and duration (Jing et al., 2016; Zhai et al., 2017). Based on the intensity–area–duration (IAD) method, Zhai et al. (2017) developed an approach for identifying a regional extreme event and analyzing its coverage and duration. Using daily precipitation data from 771 stations from 1960 to 2014, Jing et al. (2016) produced distribution patterns of the trend of change in regional extreme precipitation events in China and discussed the exposure of the population and economy to these events.
This study projects the changes of EMTEs (frequency, intensity, and impact area) in China under global warming scenarios of 1.5 and 2.0°C based on the CCLM outputs. Combined with demographic data from 2010, we assess population exposure to EMTEs in China in a warming world. The main target of this study is to project the influence and characteristics of EMTEs under the 1.5 and 2.0°C global warming scenarios and to provide evidence of the impacts expected from an extra increase of 0.5°C to support policy-makers in the development of strategies for climate change mitigation.
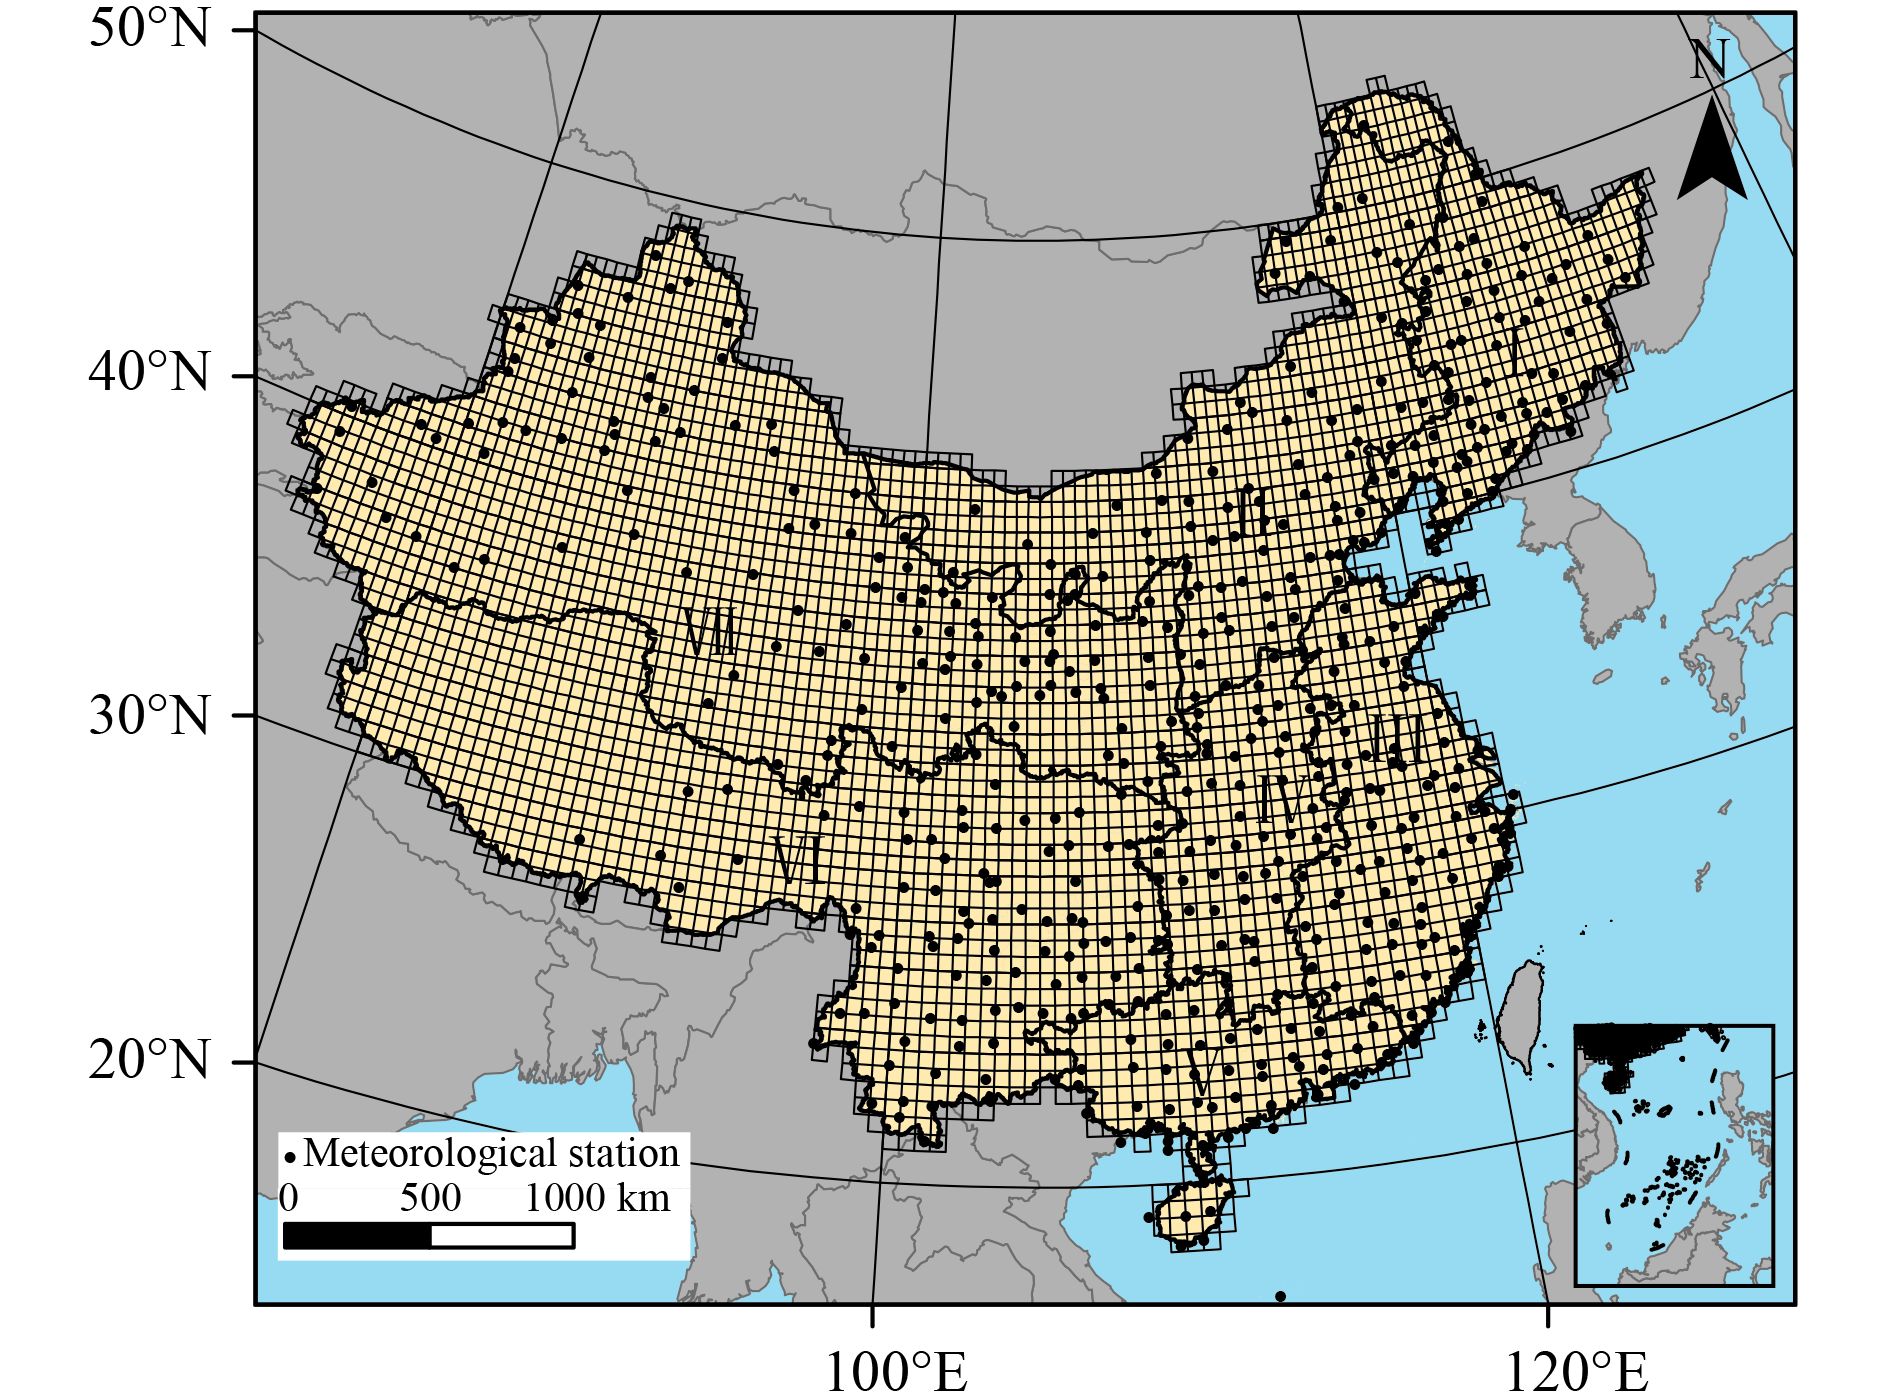
2 Data 2.1 Observed dataThe National Meteorological Information Center of the China Meteorological Administration issues quality-controlled daily maximum temperature datasets. These datasets cover 756 meteorological stations throughout China and are available from January 1, 1961 to December 31, 2015 (Fig. 1). The rate of missing daily maximum temperature data in these datasets is < 0.25% annually and therefore the datasets can be used to reflect the spatiotemporal distribution of the daily maximum temperature in China.
|
| Figure 1 Spatial distribution of meteorological stations and the CCLM grid in China. |
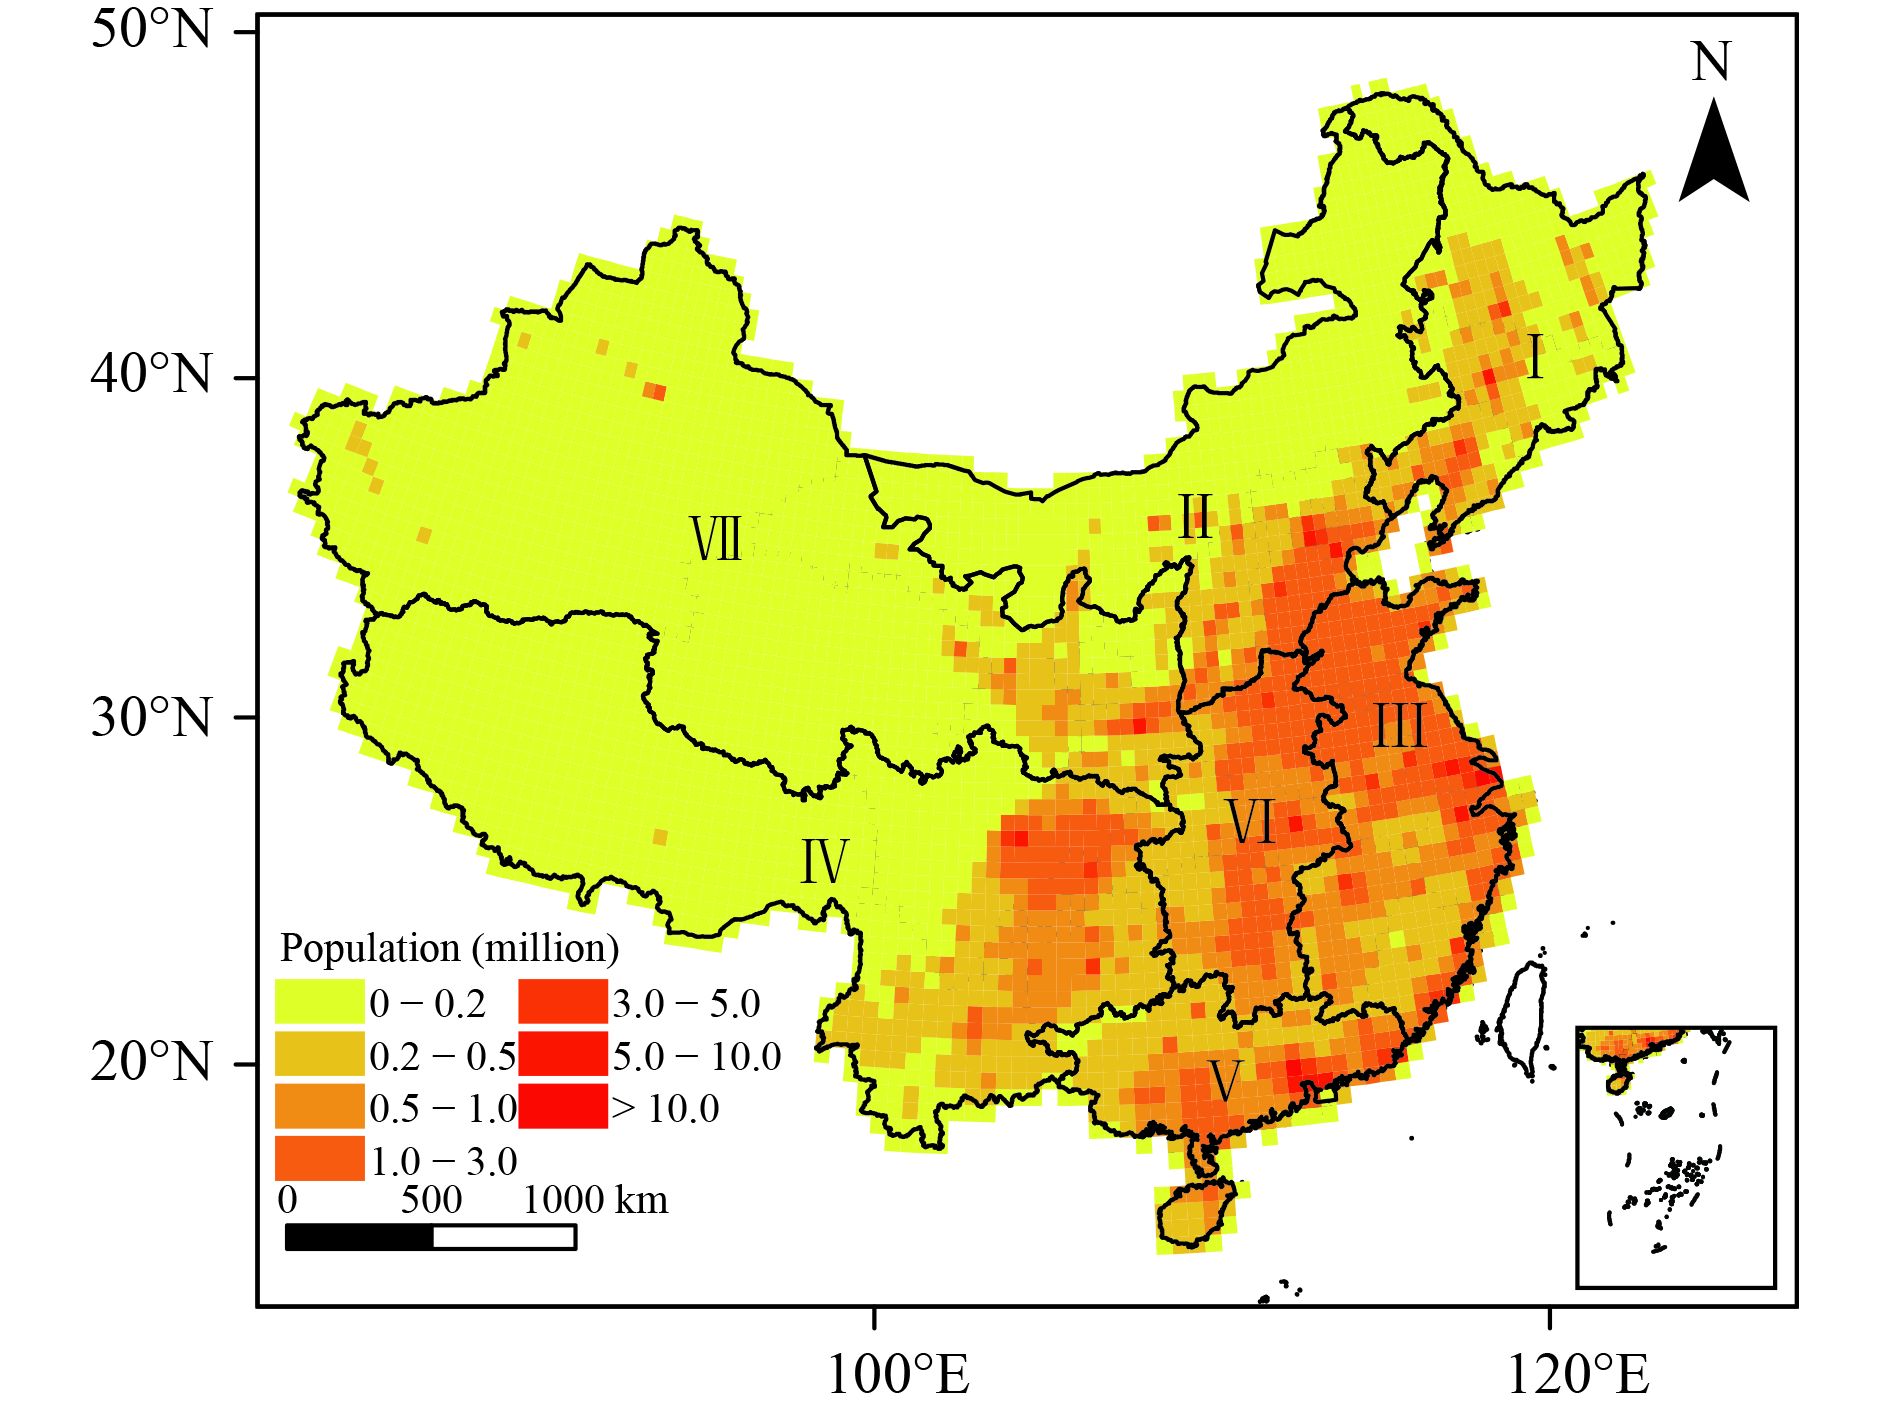
To study the exposure of the population of China to EMTEs, the country was divided into seven geographical areas: I, Northeast China; II, North China; III, East China; IV, central China; V, South China; VI, Southwest China; and VII, Northwest China (Fig. 2). Population distribution data were obtained from the Sixth Nationwide Population Census (National Bureau of Statistics of the People’s Republic of China, 2010). The population of China is mainly concentrated in four of our seven geographical areas: North China (the Beijing–Tianjin–Hebei metropolitan region); central China (the Yangtze River Delta urban agglomeration); South China (the Pearl River Delta urban agglomeration); and Southwest China (the Chongqing–Sichuan region). The population density is lower in Northeast and Northwest China (Fig. 2).
|
| Figure 2 Spatial distribution of the population in different regions of China in 2010. |
The CCLM regional climate model is the climate version of the operational weather forecasting model of the COSMO (http://cosmo-model.org), which has been adapted and developed as a tool to project future changes in climate parameters (Burkhard et al., 2008; Cao et al., 2013; Fischer et al., 2013; Huang et al., 2015; Su et al., 2016). The CCLM is a non-hydrostatic regional climate model (Steppeler et al., 2003) intended for spatial resolutions on meso-β and meso-γ scales, where non-hydrostatic effects begin to have an important role in the evolution of atmospheric flows. It is a dynamic regional climate model based on primitive thermohydrodynamic equations used to describe the atmospheric circulation at resolutions of 1–50 km (Huang et al., 2017a).
Daily maximum temperature data from the CCLM model were obtained from the Potsdam Institute for Climate Impact Research in Germany. With a spatial resolution of 0.44°, the CCLM output was transferred to a regular 0.5° resolution grid using a bilinear interpolation method (Huang et al., 2015), which generated a total of 4063 grids covering China. Changes in the characteristics of EMTEs under global warming scenarios of 1.5 and 2.0°C (relative to pre-industrial levels) were analyzed by comparing them with the reference period of 1986–2005.
2.3 Validation of CCLMThe simulation capability of the CCLM model in terms of the daily maximum temperature in China from 1986 to 2005 can be assessed by comparing Figs. 3, 4.
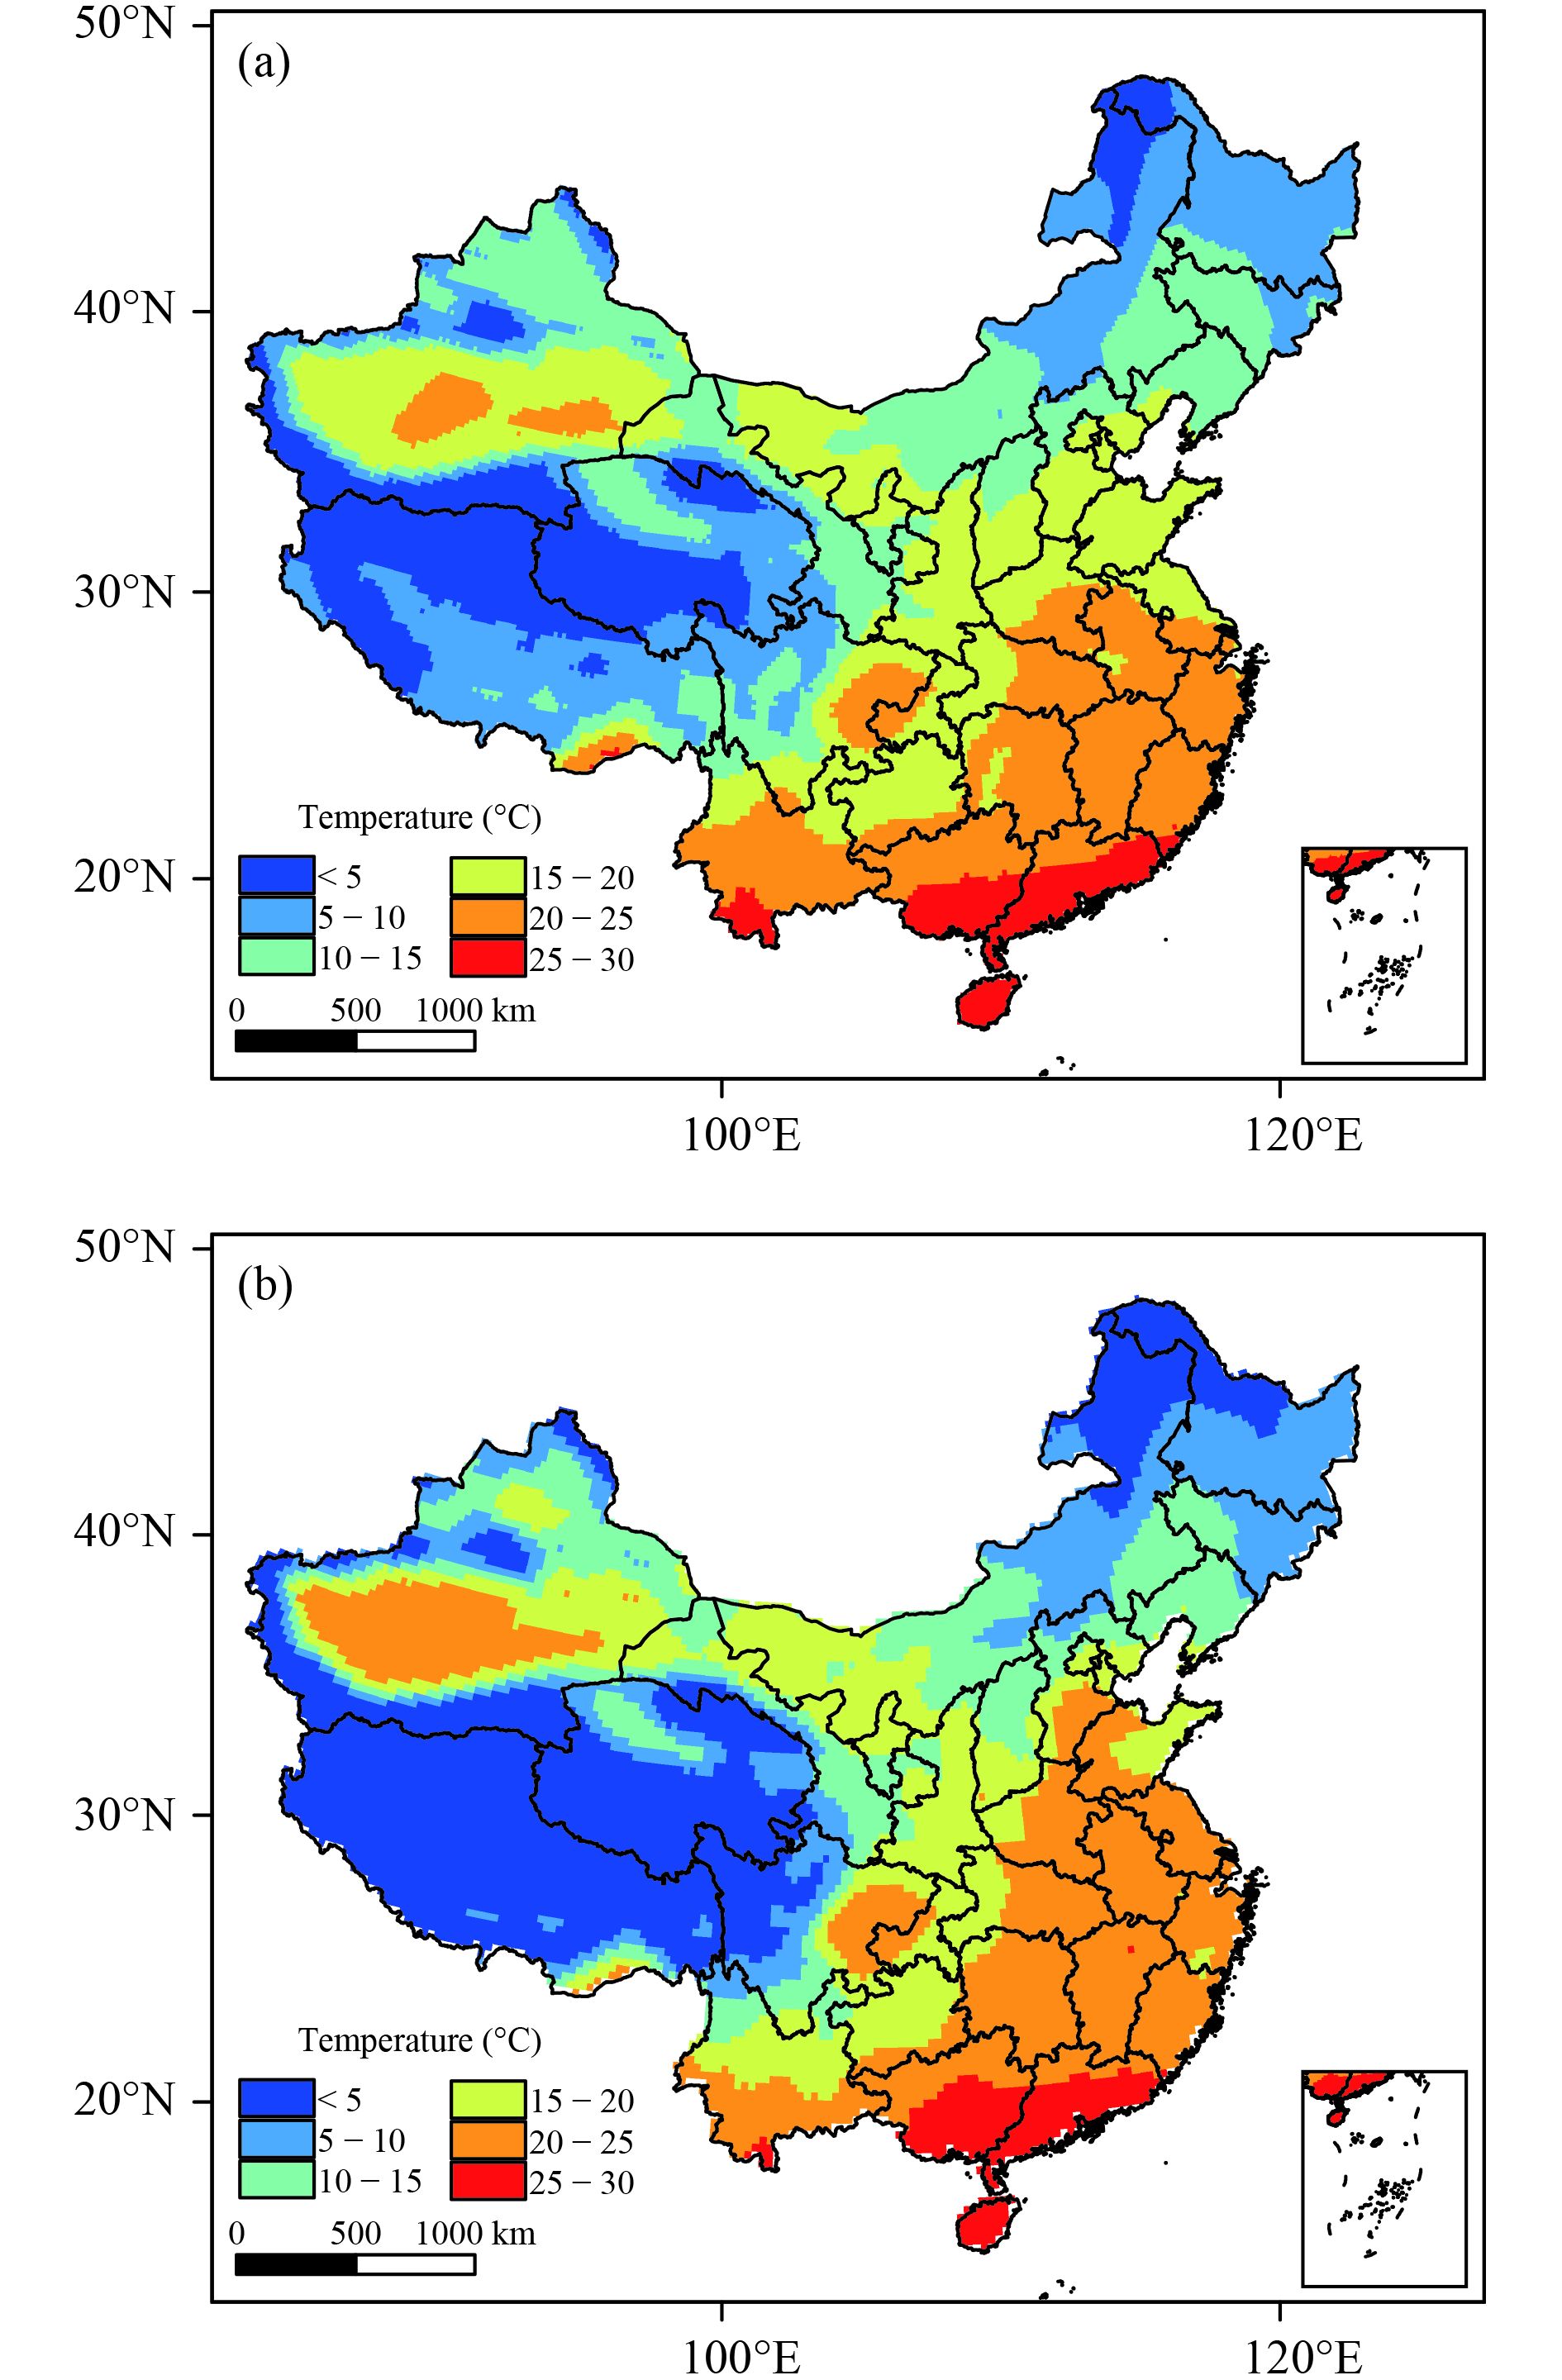
Figure 3 shows the spatial distribution of the observed and simulated daily maximum temperature in China. Figures 3a and 3b show that the daily maximum temperature in East China decreases from south to north, whereas in West China it decreases from north to south as a result of complex terrain effects. Both the large-value centers—located mainly in the southern coastal region (Guangdong and Hainan provinces and Guangxi Region), the southwestern region (Sichuan Province), and the northwestern region (Xinjiang Region)—and low-value centers—located mainly in the northeast (Heilongjiang Province) and southwest (Sichuan and Qinghai provinces)—are simulated very well. The spatial correlation coefficient between the observed and simulated temperatures is 0.90 (significant at the 5% level). Therefore, it is clear that the CCLM is able to capture well the spatial distribution of the daily maximum temperature in China.
|
| Figure 3 Spatial distributions of annual mean daily maximum temperature in China (1986–2005): (a) observed and (b) simulated. |
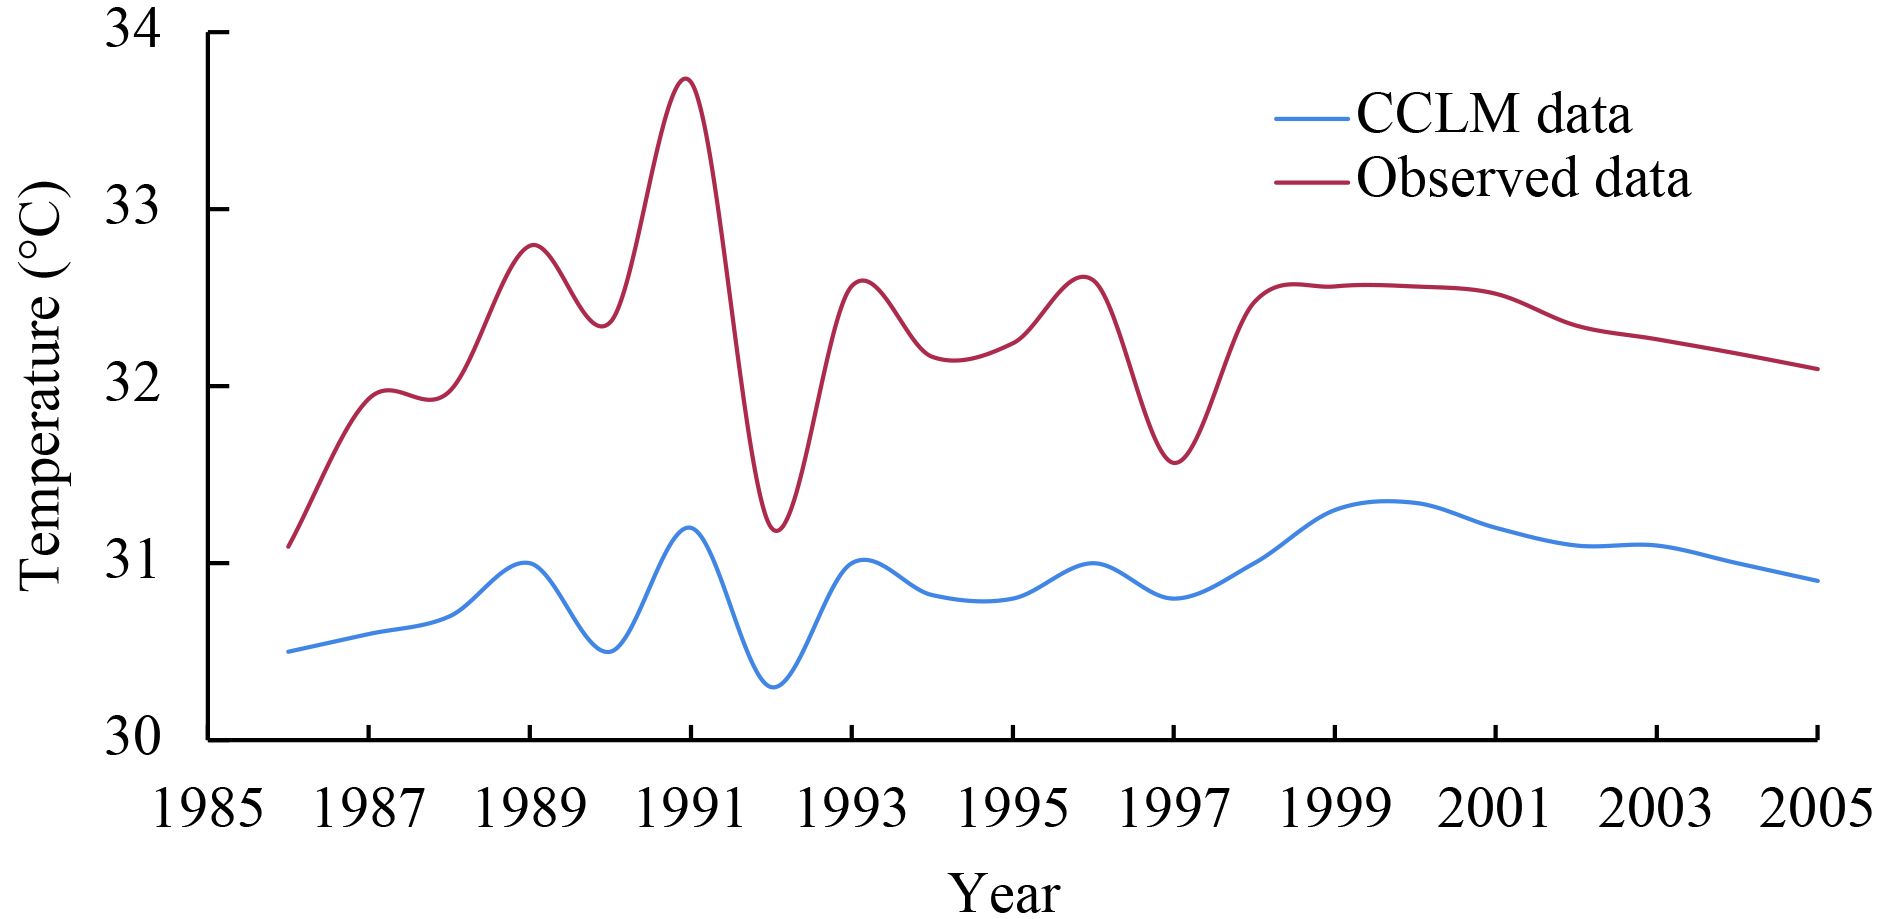
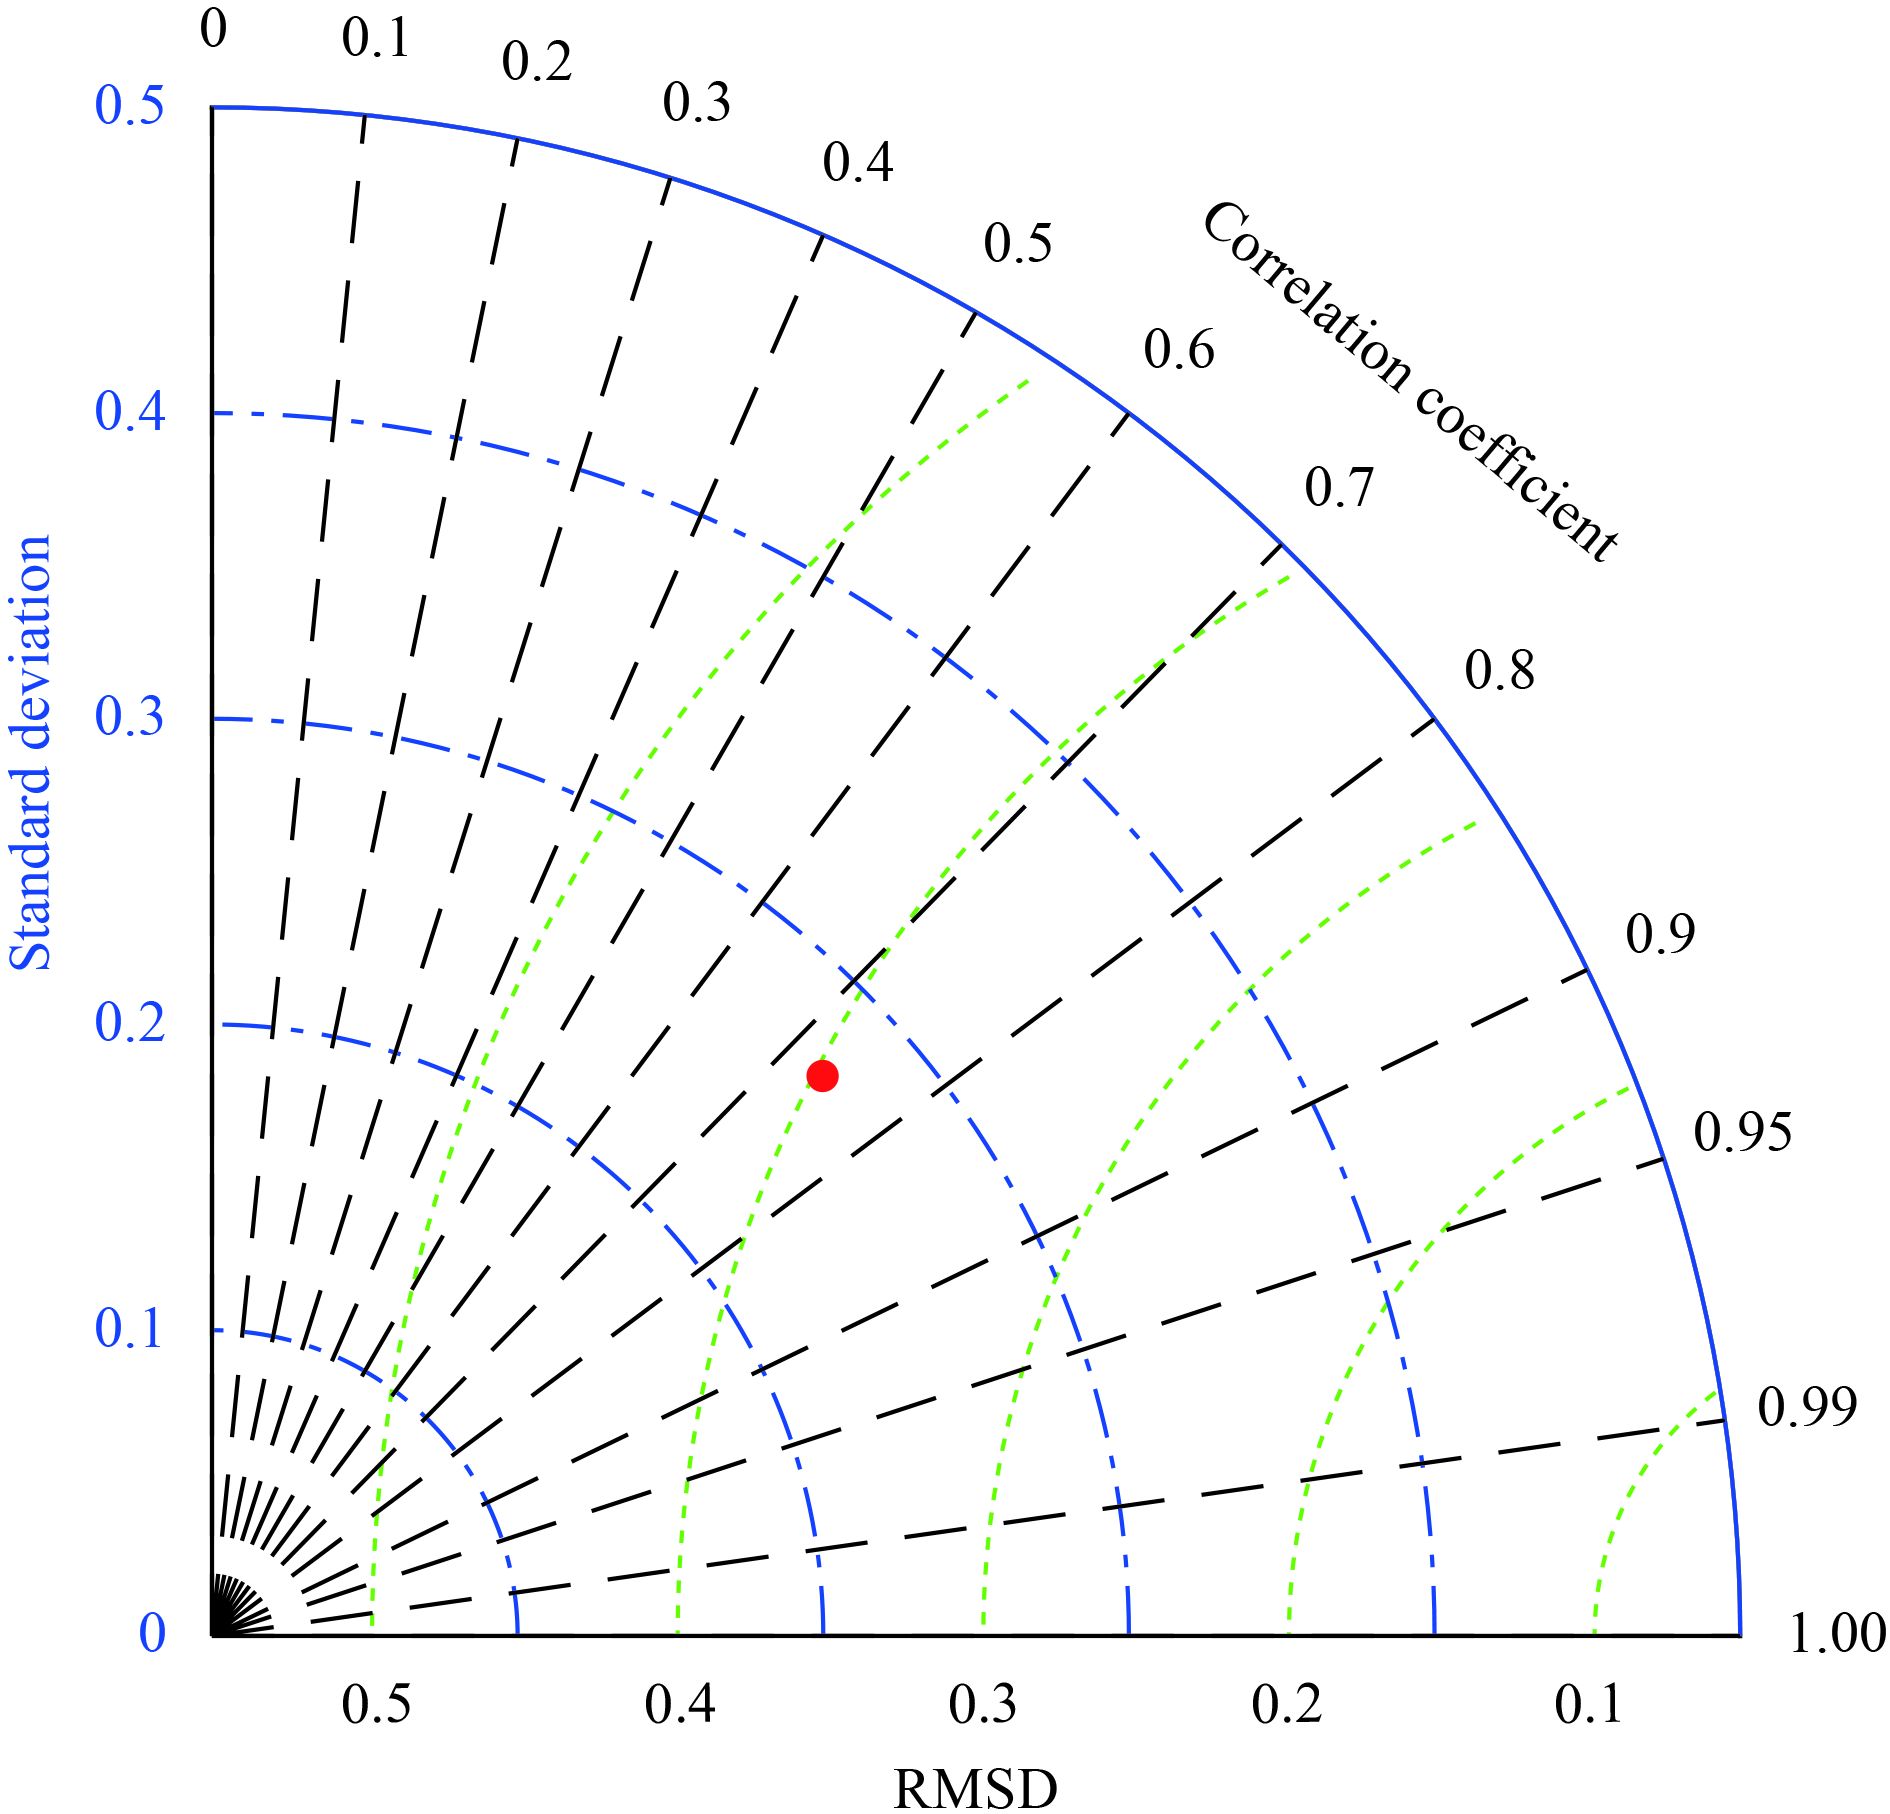
Figure 4 shows the temporal variation of the observed and CCLM annual maximum temperature data from 1986 to 2005. In general, the CCLM data are systemically lower than the observed data, although both time series show similar increasing trends. The rates of increase of the observed and simulated data are 0.16 and 0.28°C decade–1, respectively (significant at the 5% level). Based on a Taylor diagram (Taylor, 2001) (Fig. 5), the correlation coefficient is 0.73 and the root-mean-square deviation (RMSD) is 0.39. The CCLM is capable of simulating the daily maximum temperature at the station level for 1986–2005, indicating that the simulation data are suitable for the analysis of the spatiotemporal variation of EMTEs.
|
| Figure 4 Temporal variation of annual mean daily maximum temperature in China (1986–2005). |
|
| Figure 5 Taylor diagram of the annual maximum temperature for the CCLM model. |
Extreme temperature events are often described by different standards. In China, it is common for a daily maximum temperature of 35°C to be considered as an extreme high temperature (Zhang et al., 2004). However, considering the large area of Northeast China and the impact of extreme temperatures on human health, a temperature of 30°C is selected as the threshold for EMTEs in this study (Vescovi et al., 2009).
In most previous studies, the characteristics of EMTEs were analyzed at the station or grid scale (Zhou and Ren, 2011; Qin et al., 2015) and did not consider the temporal and spatial continuity of EMTEs. In this study, the EMTEs were identified by using the IAD method (Andreadis et al., 2005; Sheffield et al., 2009), taking the intensity, coverage, and duration (1, 3, and 5 days) of the high temperature events into account. This method has been successfully applied in analyses of drought and extreme precipitation events in China (Chen et al., 2016; Jing et al., 2016; Huang et al., 2017b; Zhai et al., 2017).
The principle of the IAD method is to identify the grids that neighbor the maximum high temperature center and then to cluster the grids with temperatures ≥ 30°C into an event. The coverage is determined by the summation of all grids and the intensity is determined by the average temperature of all grids included in one event (Fig. 6). For example, Fig. 6a shows two EMTEs in area: event 1 is in the blue grid and event 2 is in the red grid. From the IAD curve for event 1 (dotted blue line), we find that the impact area of event 1 is 4 × 10⁴ km2, the intensity is 33.5°C (the average of the four grids), and the maximum intensity is 38°C. The highest intensity in a contiguous impact area is presented by the IAD envelope curve (Fig. 6d, solid black line). Although the IAD curve can be used to compare EMTEs of different intensities and areas, the IAD envelope curve identifies the highest intensity at each contiguous impact area for the entire study period. Further details about IAD method can be found in Zhai et al. (2017).

|
| Figure 6 Constructions of the IAD curve and IAD envelope curve. |
The global temperatures observed during 1986–2005 were 0.61°C higher than pre-industrial levels (1850– 1900) (IPCC, 2013). Therefore, to reach an increase in global temperatures of 1.5 and 2.0°C, temperatures have to increase by a further 0.89 and 1.39°C, respectively. RCP 2.6 refers to mitigation scenarios intended to restrict the increase in the global mean temperature to 1.5°C during the 21st century. RCP4.5 is a scenario that stabilizes radiative forcing at 4.5 W m–2 by 2100, limiting the increase in global mean temperature to 2.0°C (Rogelj et al., 2011; Thomson et al., 2011; Van Vuuren et al., 2011).
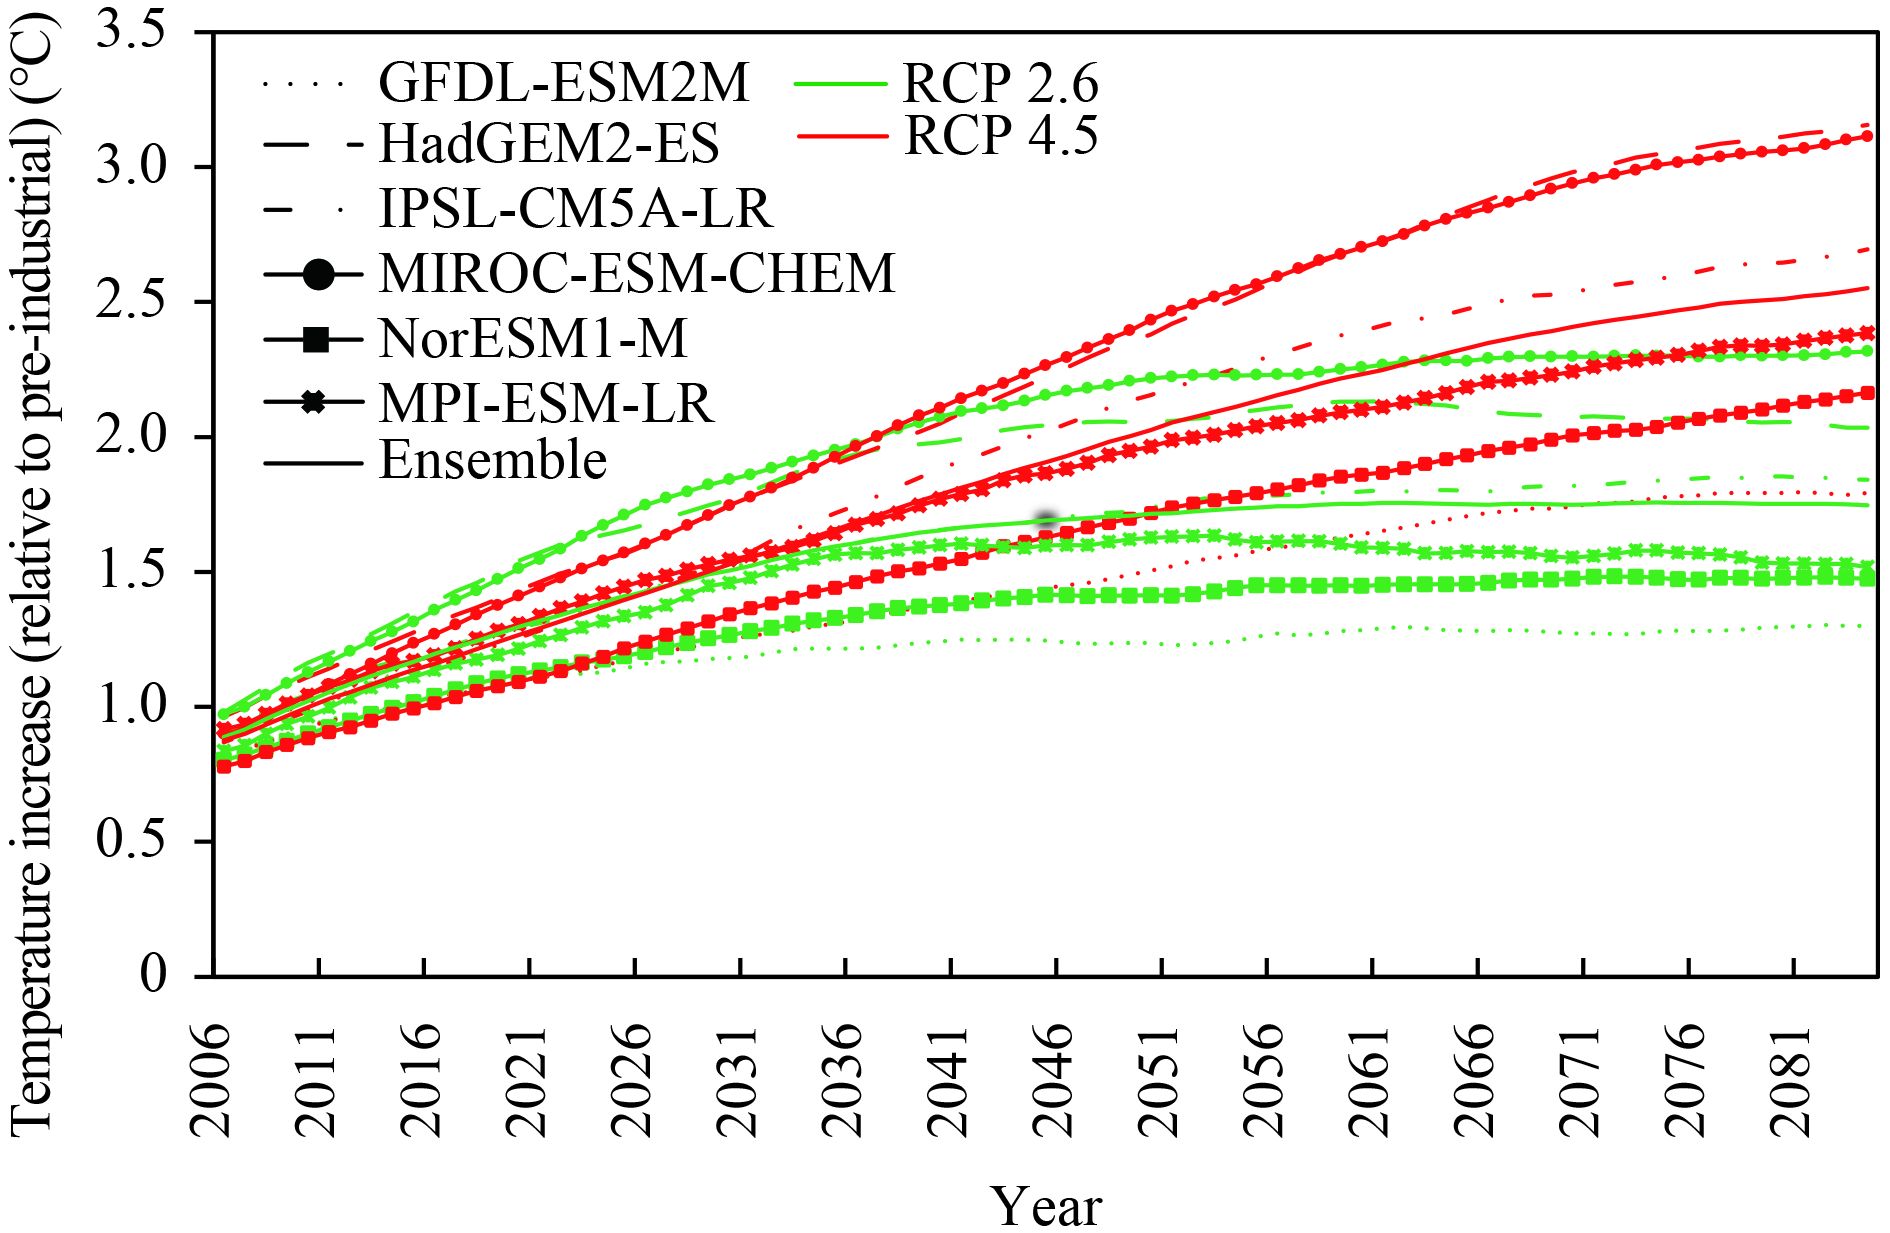
Because the results obtained from a single climate model may have large uncertainties, this study used six GCMs (Geophysical Fluid Dynamics Laboratory (GFDL), Hadley Centre Model (HAD), Institute Pierre-Simon Laplace (IPSL), Japan Agency for Marine-Earth Science and Technology, Atmosphere and Ocean Research Institute (MIROC), Norwegian Climate Centre (Nor), and Max Planck Institute for Meteorology (MPI-ESM-LR)) to determine when the global mean temperature will be 1.5 and 2.0ºC warmer. The ensemble data in Fig. 7 suggest that the global mean temperature will surpass the 1.5°C threshold after 2030 under RCP2.6. Under RCP4.5, however, the ensemble data suggest that the global mean temperature will exceed the 2.0°C warming threshold after 2049. Considering the comparatively stable climate condition, a 20-yr running average of 2030 (2020–39) and 2049 (2040–59) are set as the 1.5 and 2.0ºC warming periods, respectively (Frieler et al., 2016; Warszawski et al., 2014).
|
| Figure 7 Mean global surface temperature (2006–2100) relative to the pre-industrial period projected by ensembles of GCMs. |
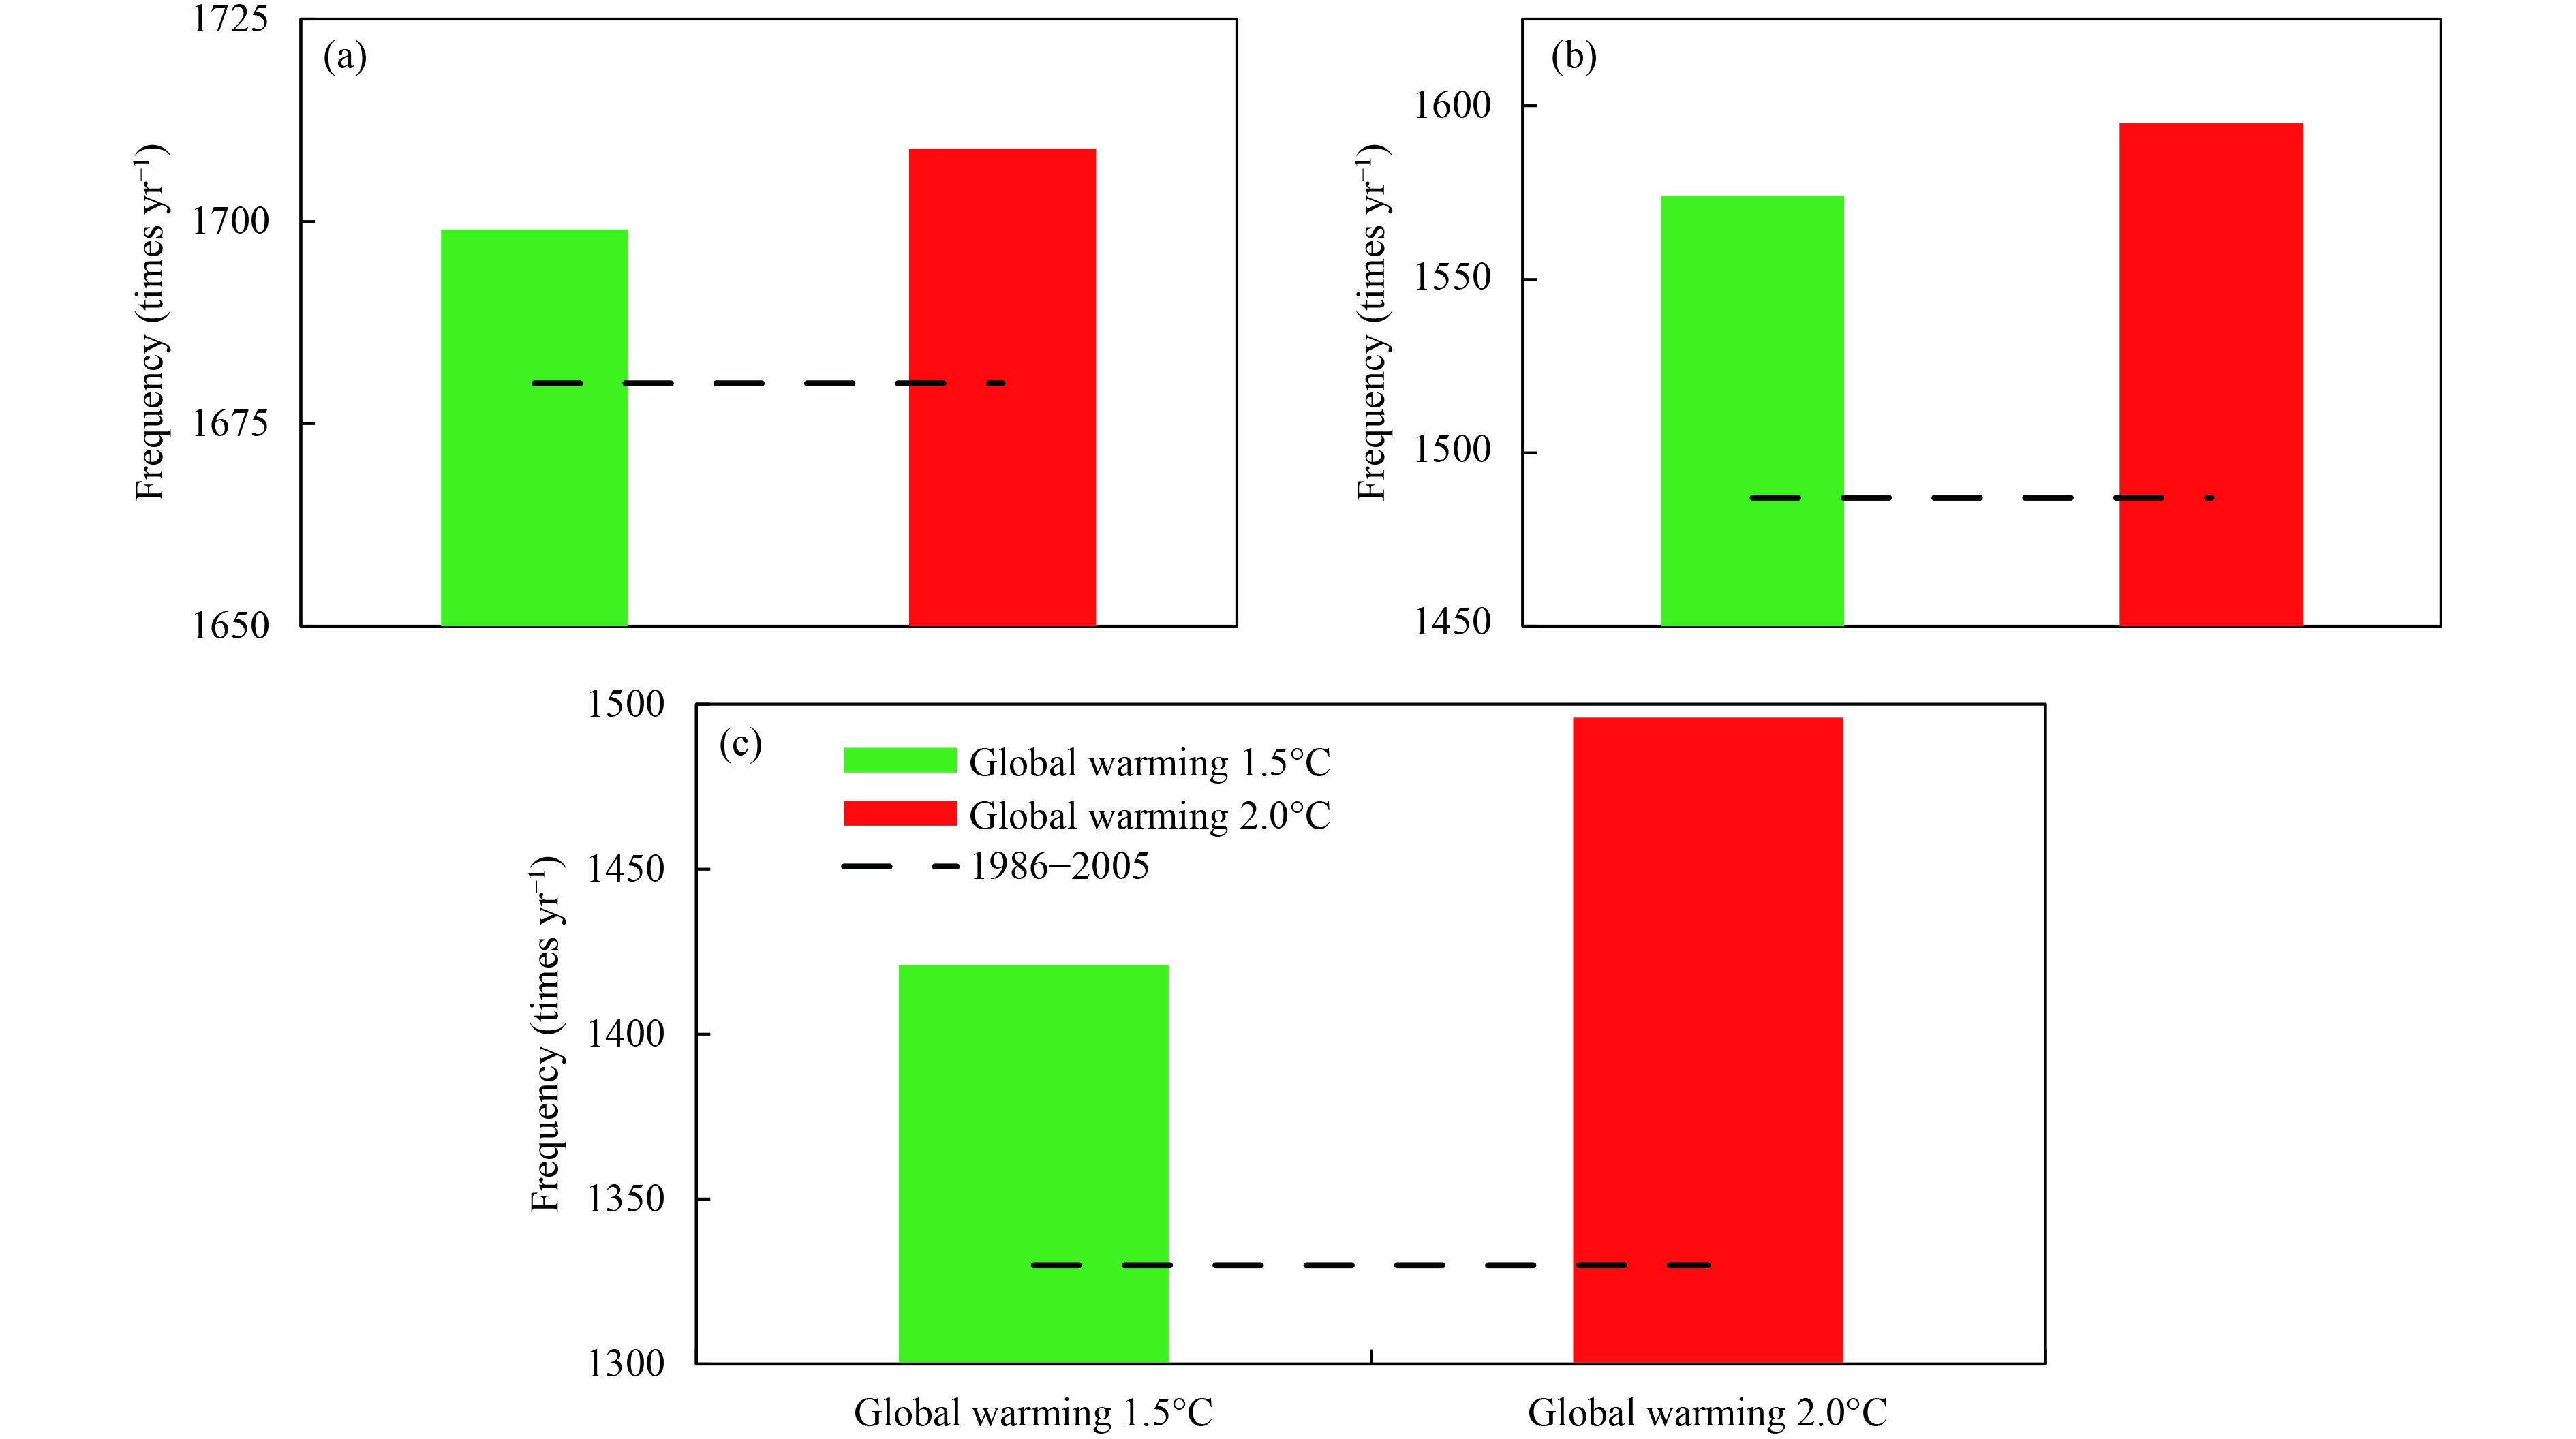
Figure 8 shows the projected frequencies of EMTEs under scenarios of 1.5 and 2.0°C warming. Relative to the reference period (1680 times yr–1), the frequency of 1-day events for 1.5°C warming is 1699 times yr–1, an increase of 1.13%; under 2.0°C warming, the frequency increases by 1.73% to 1709 times yr–1. Under global warming scenarios of 1.5 and 2.0°C, the frequency of 3-day events increases by 3.83% (1547 times yr–1) and 6.55% (1595 times yr–1), respectively, relative to the reference period, and the frequency of 5-day events increases by 6.84% (1421 times yr–1) and 12.48% (1496 times yr–1), respectively. Based on Student’s t-test, the increase in frequency relative to the reference period is significant under 2.0°C warming (p ≤ 0.05), but not significant under 1.5°C warming. Global warming of 2.0°C shows an even greater increase than global warming of 1.5°C and the frequency of 5-day events shows the greatest increase. Therefore, a warmer world will mean that EMTEs will become more frequent and of increased duration.
|
| Figure 8 Frequency of EMTEs under 1.5 and 2.0°C global warming. Duration of EMTEs: (a) 1 day, (b) 3 days, and (c) 5 days. |
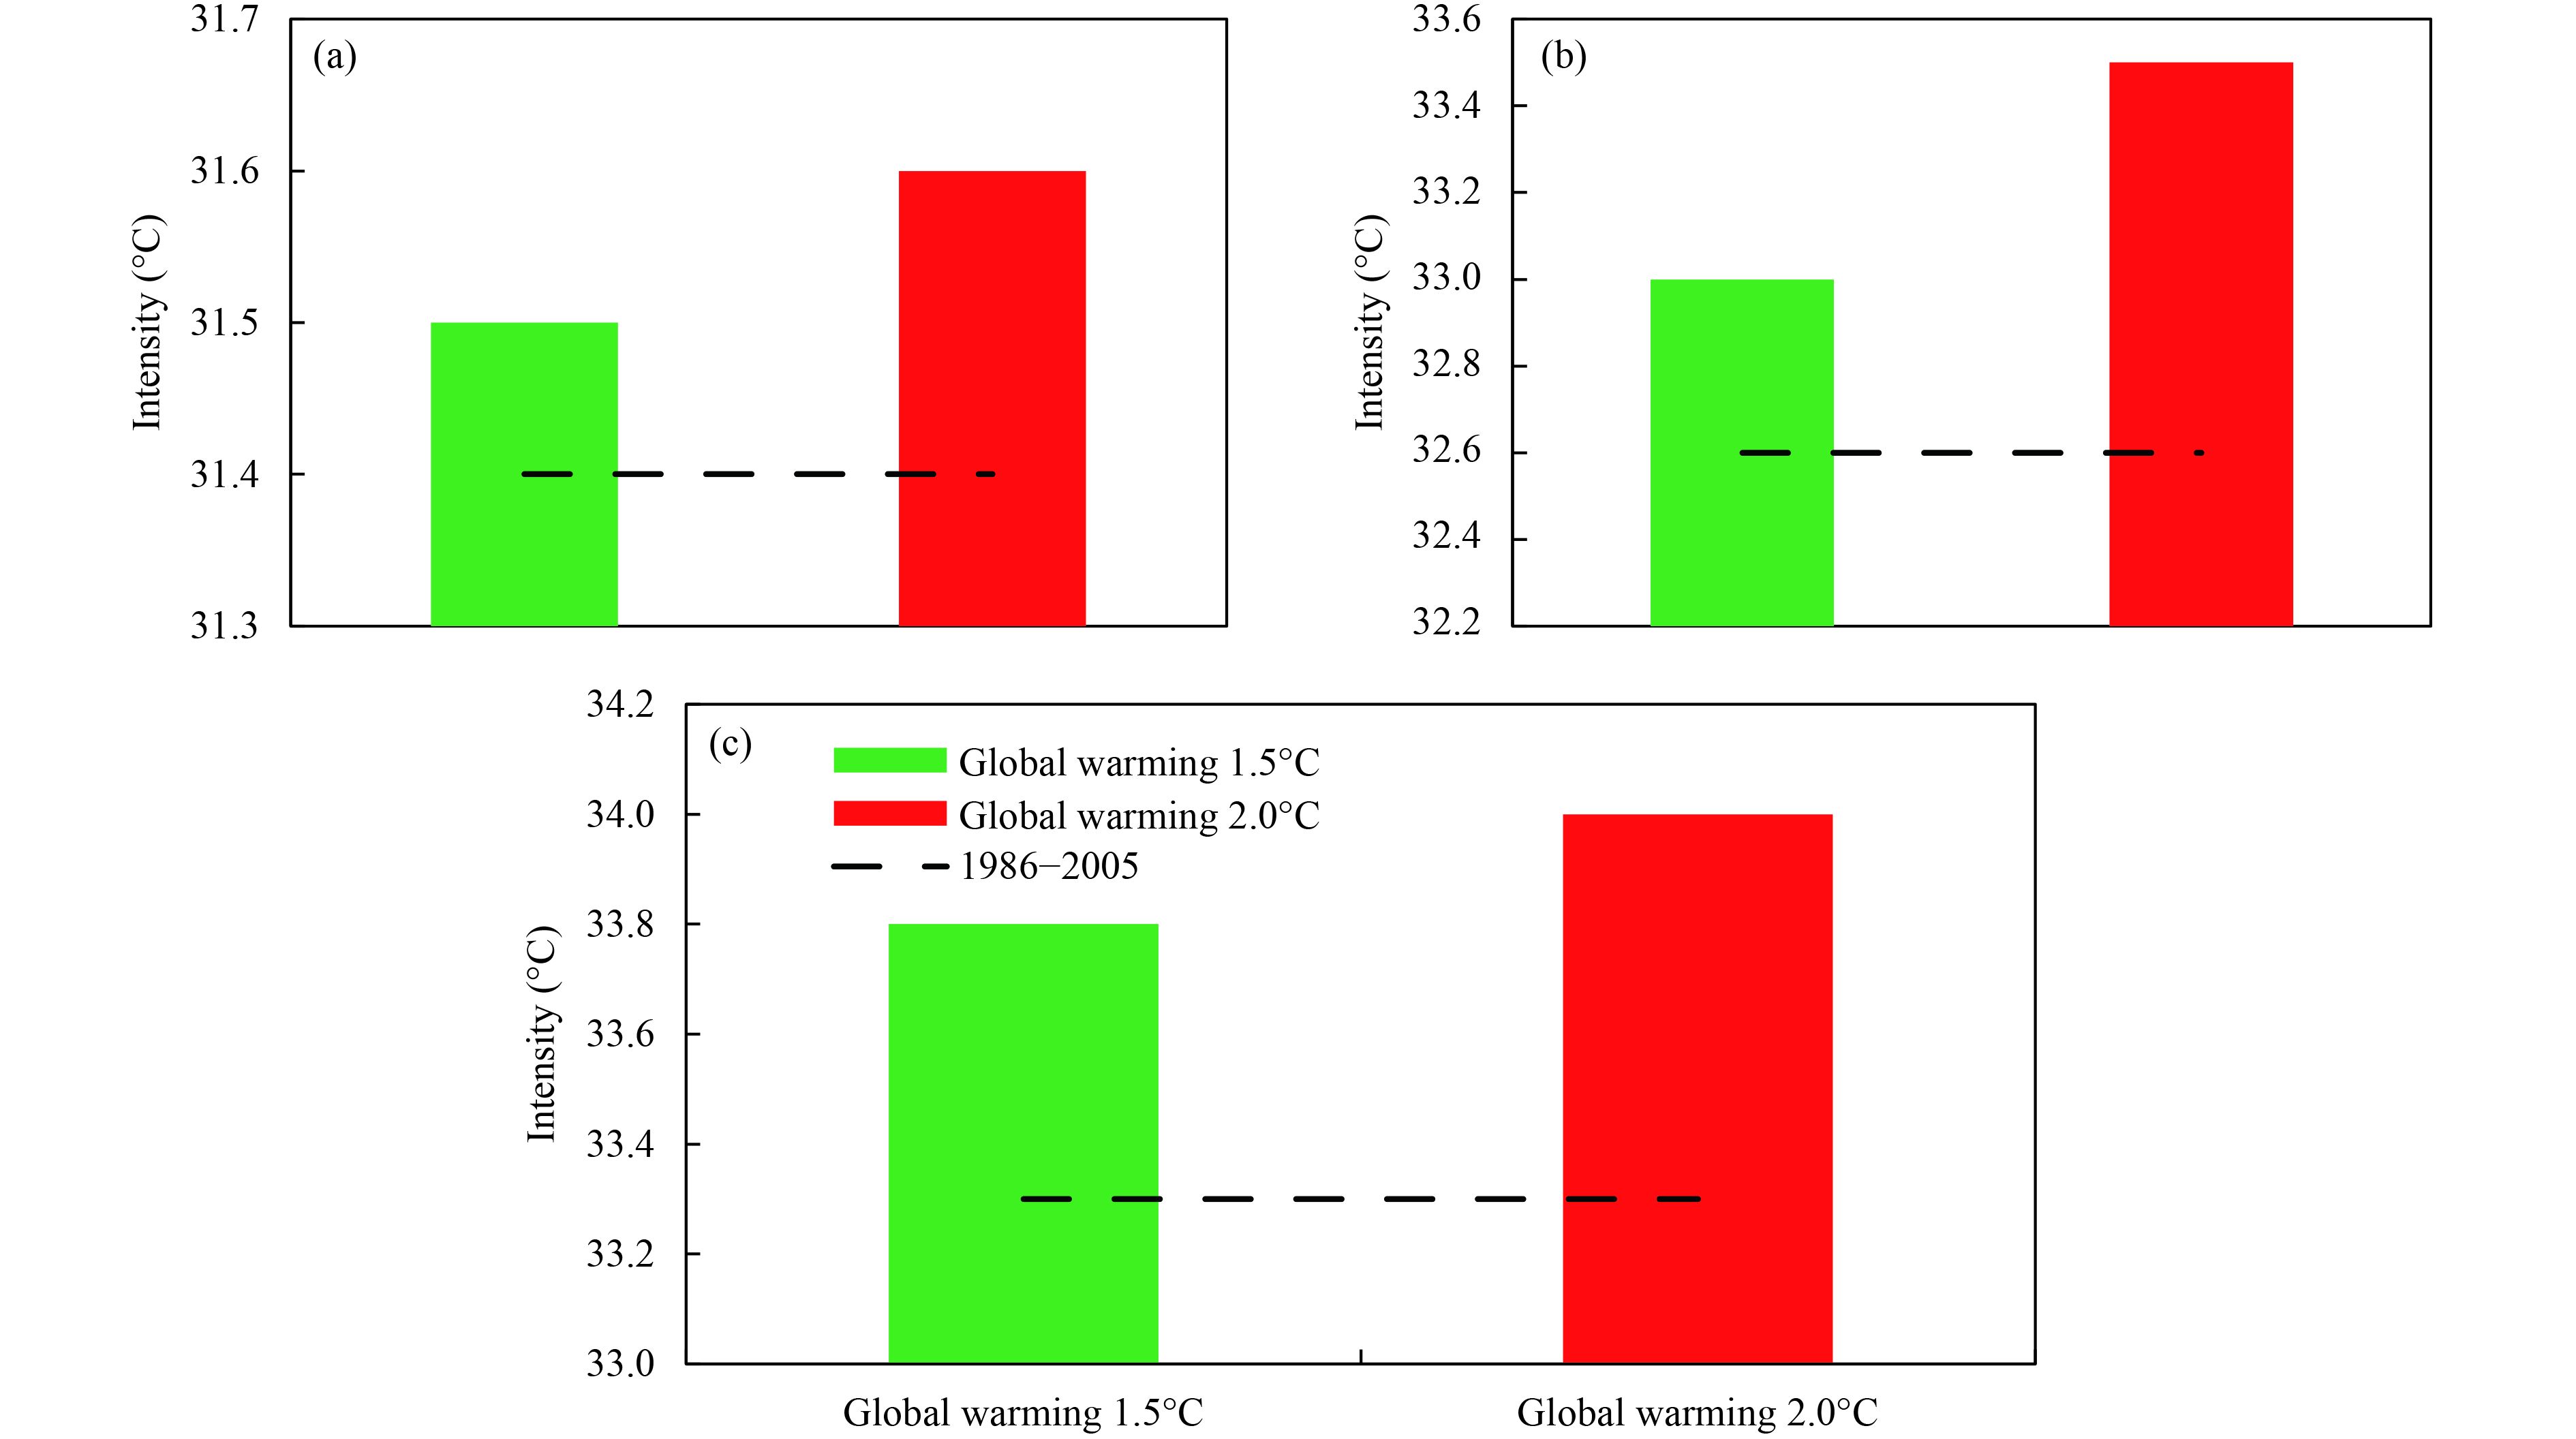
Figure 9 shows the projected changes in the intensity of EMTEs. The average intensity of 1-day EMTEs is 31.4°C (reference period), 31.5°C (1.5°C warming), and 31.6°C (2.0°C warming)—that is, increases of 0.32% and 0.64%, respectively, for the warming scenarios. The average intensity of 3-day EMTEs is 32.6°C (reference period), with increases of 1.23% (33.0°C) and 2.76% (33.5°C) for global warming of 1.5 and 2.0°C, respectively. The average intensity of 5-day EMTEs is 33.3, 33.8, and 34.0°C for the reference period and the 1.5 and 2.0°C warming scenarios, respectively. The increases relative to the reference period for the 1.5 and 2°C warming scenarios are 1.5% and 2.1%, respectively. Irrespective of duration, the intensity increases significantly under both warming scenarios (p ≤ 0.05). Compared with 1.5°C warming, the intensities of EMTEs will increase by 0.32%–1.51% under 2.0°C warming. In general, the intensity of EMTEs will become stronger in a warmer world.
|
| Figure 9 As in Fig. 8, but for intensity of EMTEs. |
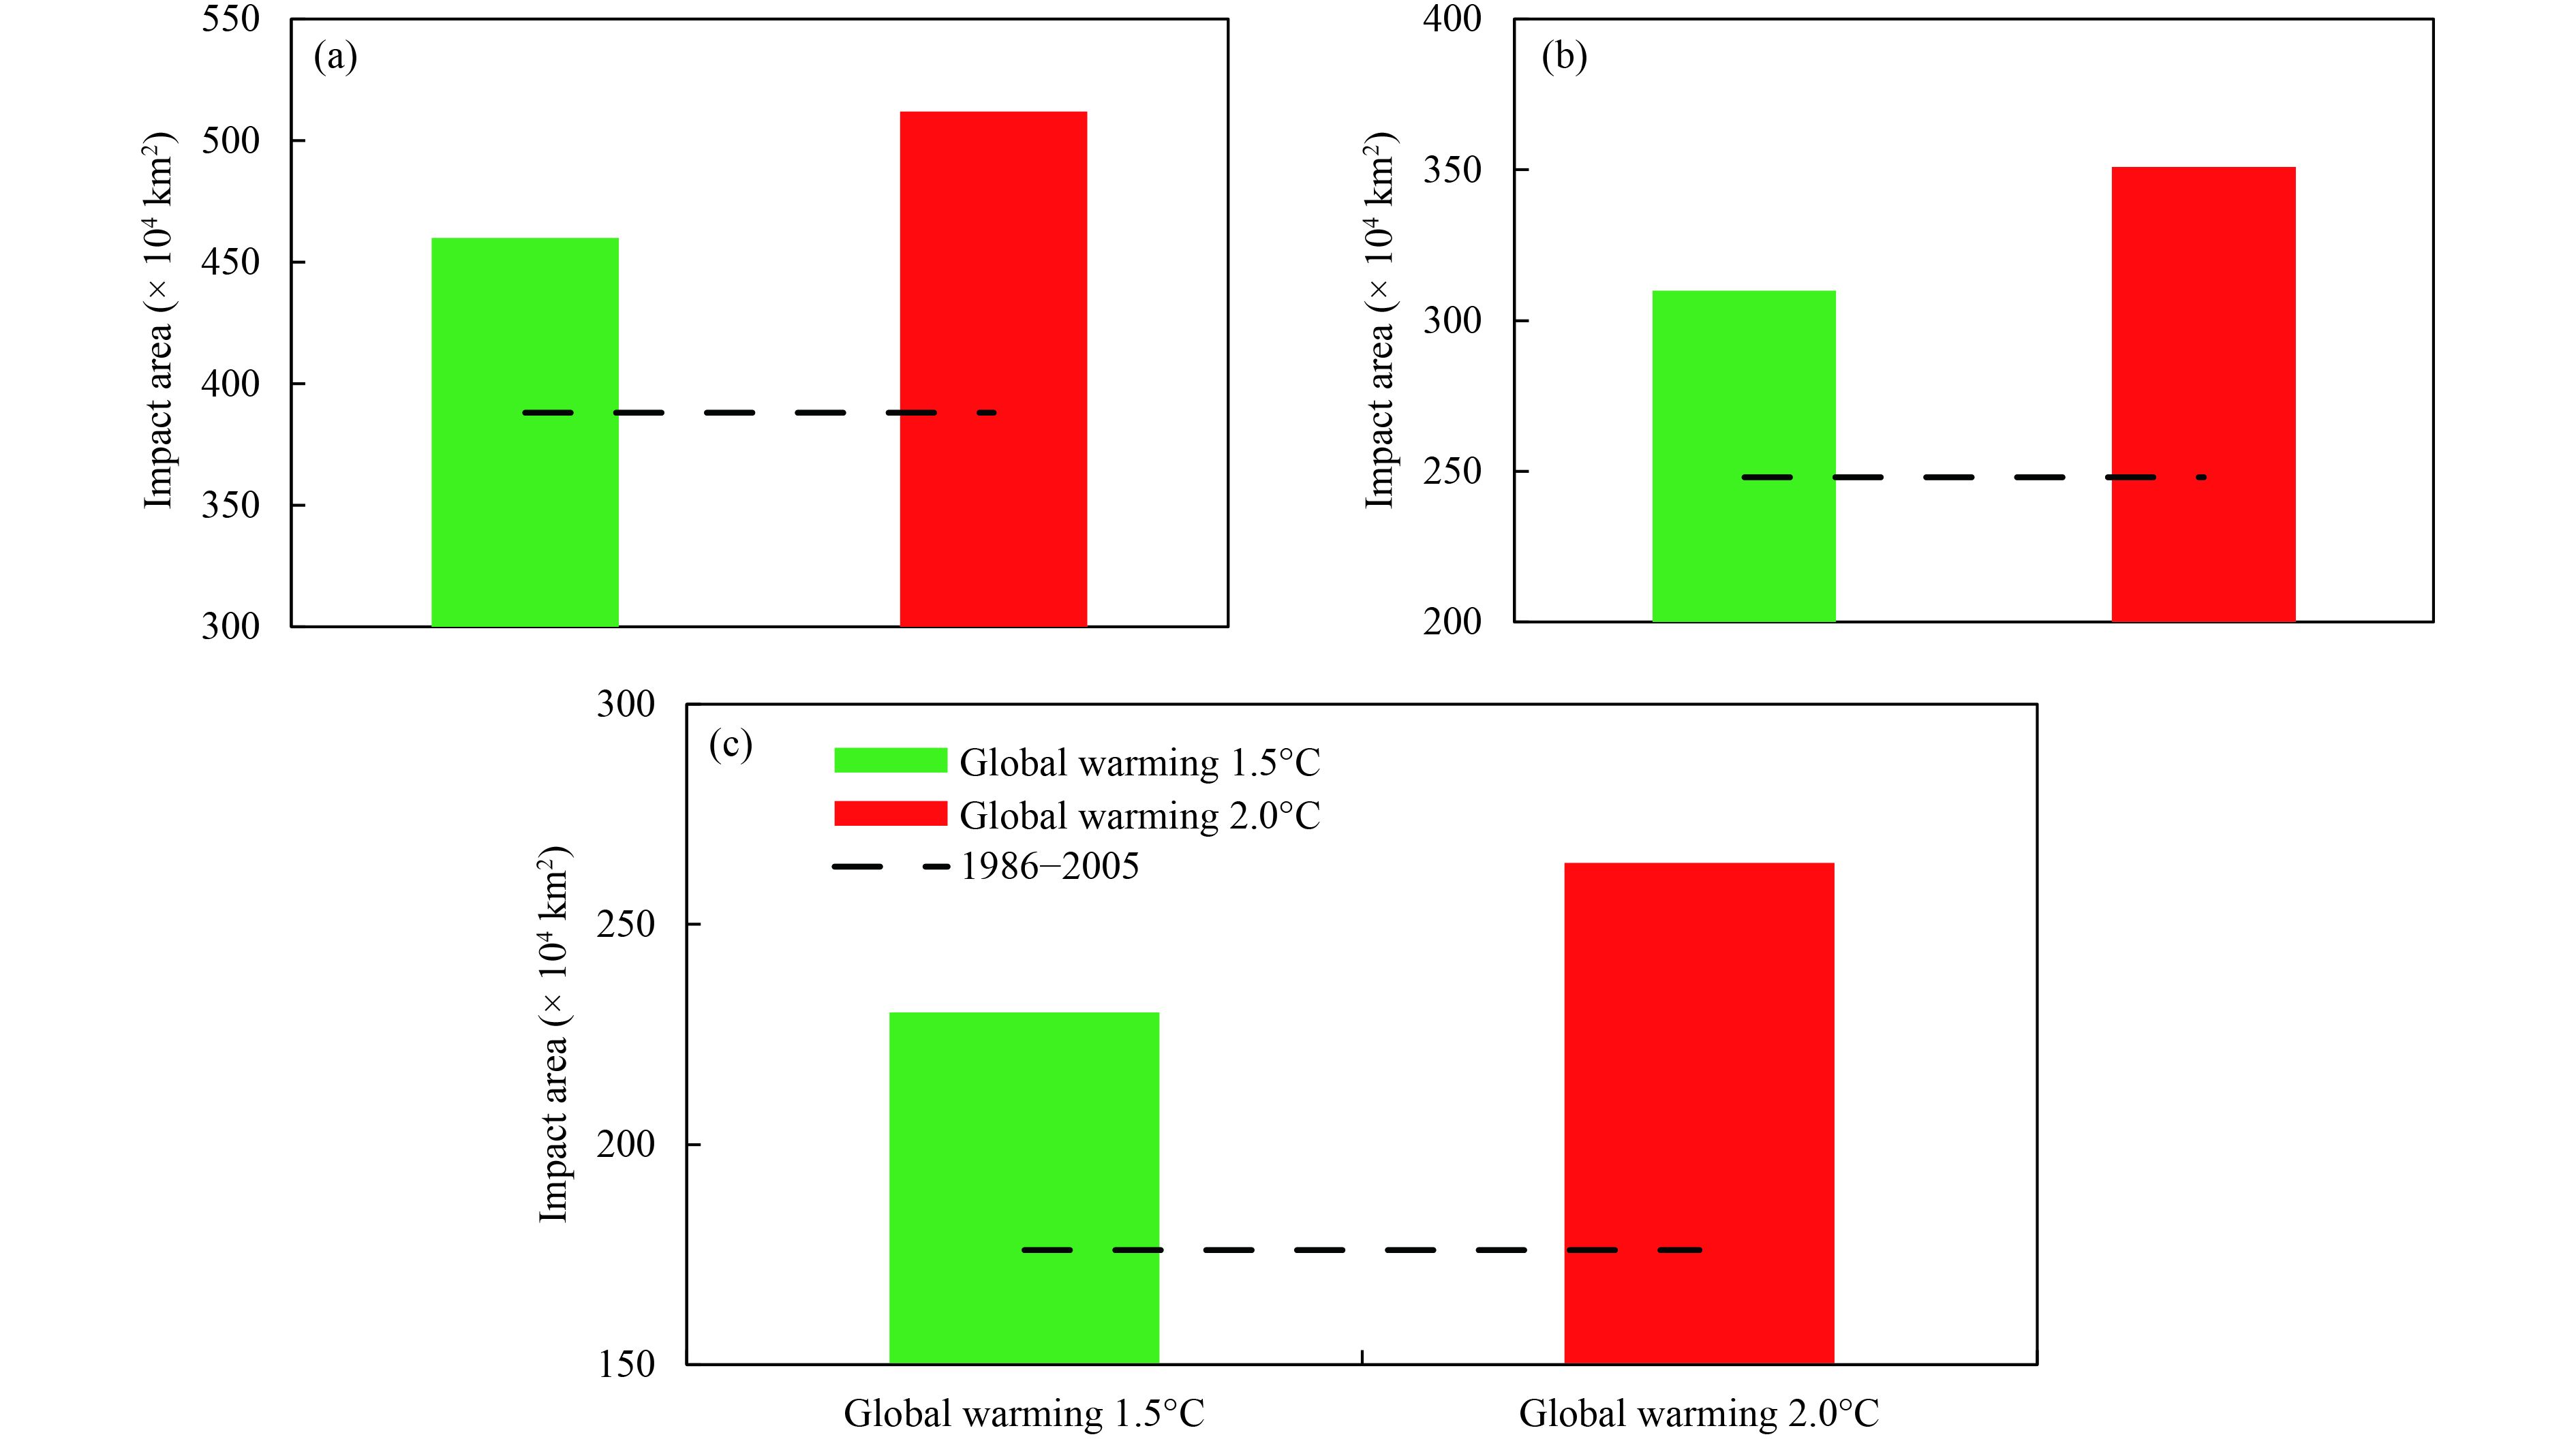
Figure 10 shows the changes in the projected annual coverage of EMTEs. The area of annual coverage of 1-day EMTEs is 4.60 × 10⁶ km2 for global warming of 1.5°C and 5.12 × 10⁶ km2 for 2.0°C, increases of 15.98% and 31.96%, respectively, relative to the reference period (3.88 × 10⁶ km2). For 3-day EMTEs, the area of annual coverage is 3.10 × 10⁶ km2 for 1.5°C global warming and 3.51 × 10⁶ km2 for 2.0°C, increases of 25% and 41.53%, respectively, relative to the reference period (2.48 × 10⁶ km2). For 5-day EMTEs, the area of annual coverage is 2.30 × 10⁶ km2 for 1.5°C global warming and 2.64 × 10⁶ km2 for 2.0°C warming, increases of 30.68% and 50.00%, respectively, relative to the reference period (1.76 × 10⁶ km2). The increase in coverage is significant (p ≤ 0.05) under both warming scenarios.
Compared with 1.5°C warming, the coverage of EMTEs will increase significantly by 13.22%–23.07% under 2.0°C warming (p ≤ 0.05). The coverage of EMTEs is largest under 2.0°C warming. It is worth noting that the rates of increase of 3- and 5-day events under 1.5 and 2.0°C warming are greater than the rate of increase of 1-day events and that the rate of increase of 5-day events is the largest. This means that longer duration EMTEs might account for a greater proportion of the overall coverage in a warmer future.
|
| Figure 10 As in Fig. 8, but for annual coverage of EMTEs. |
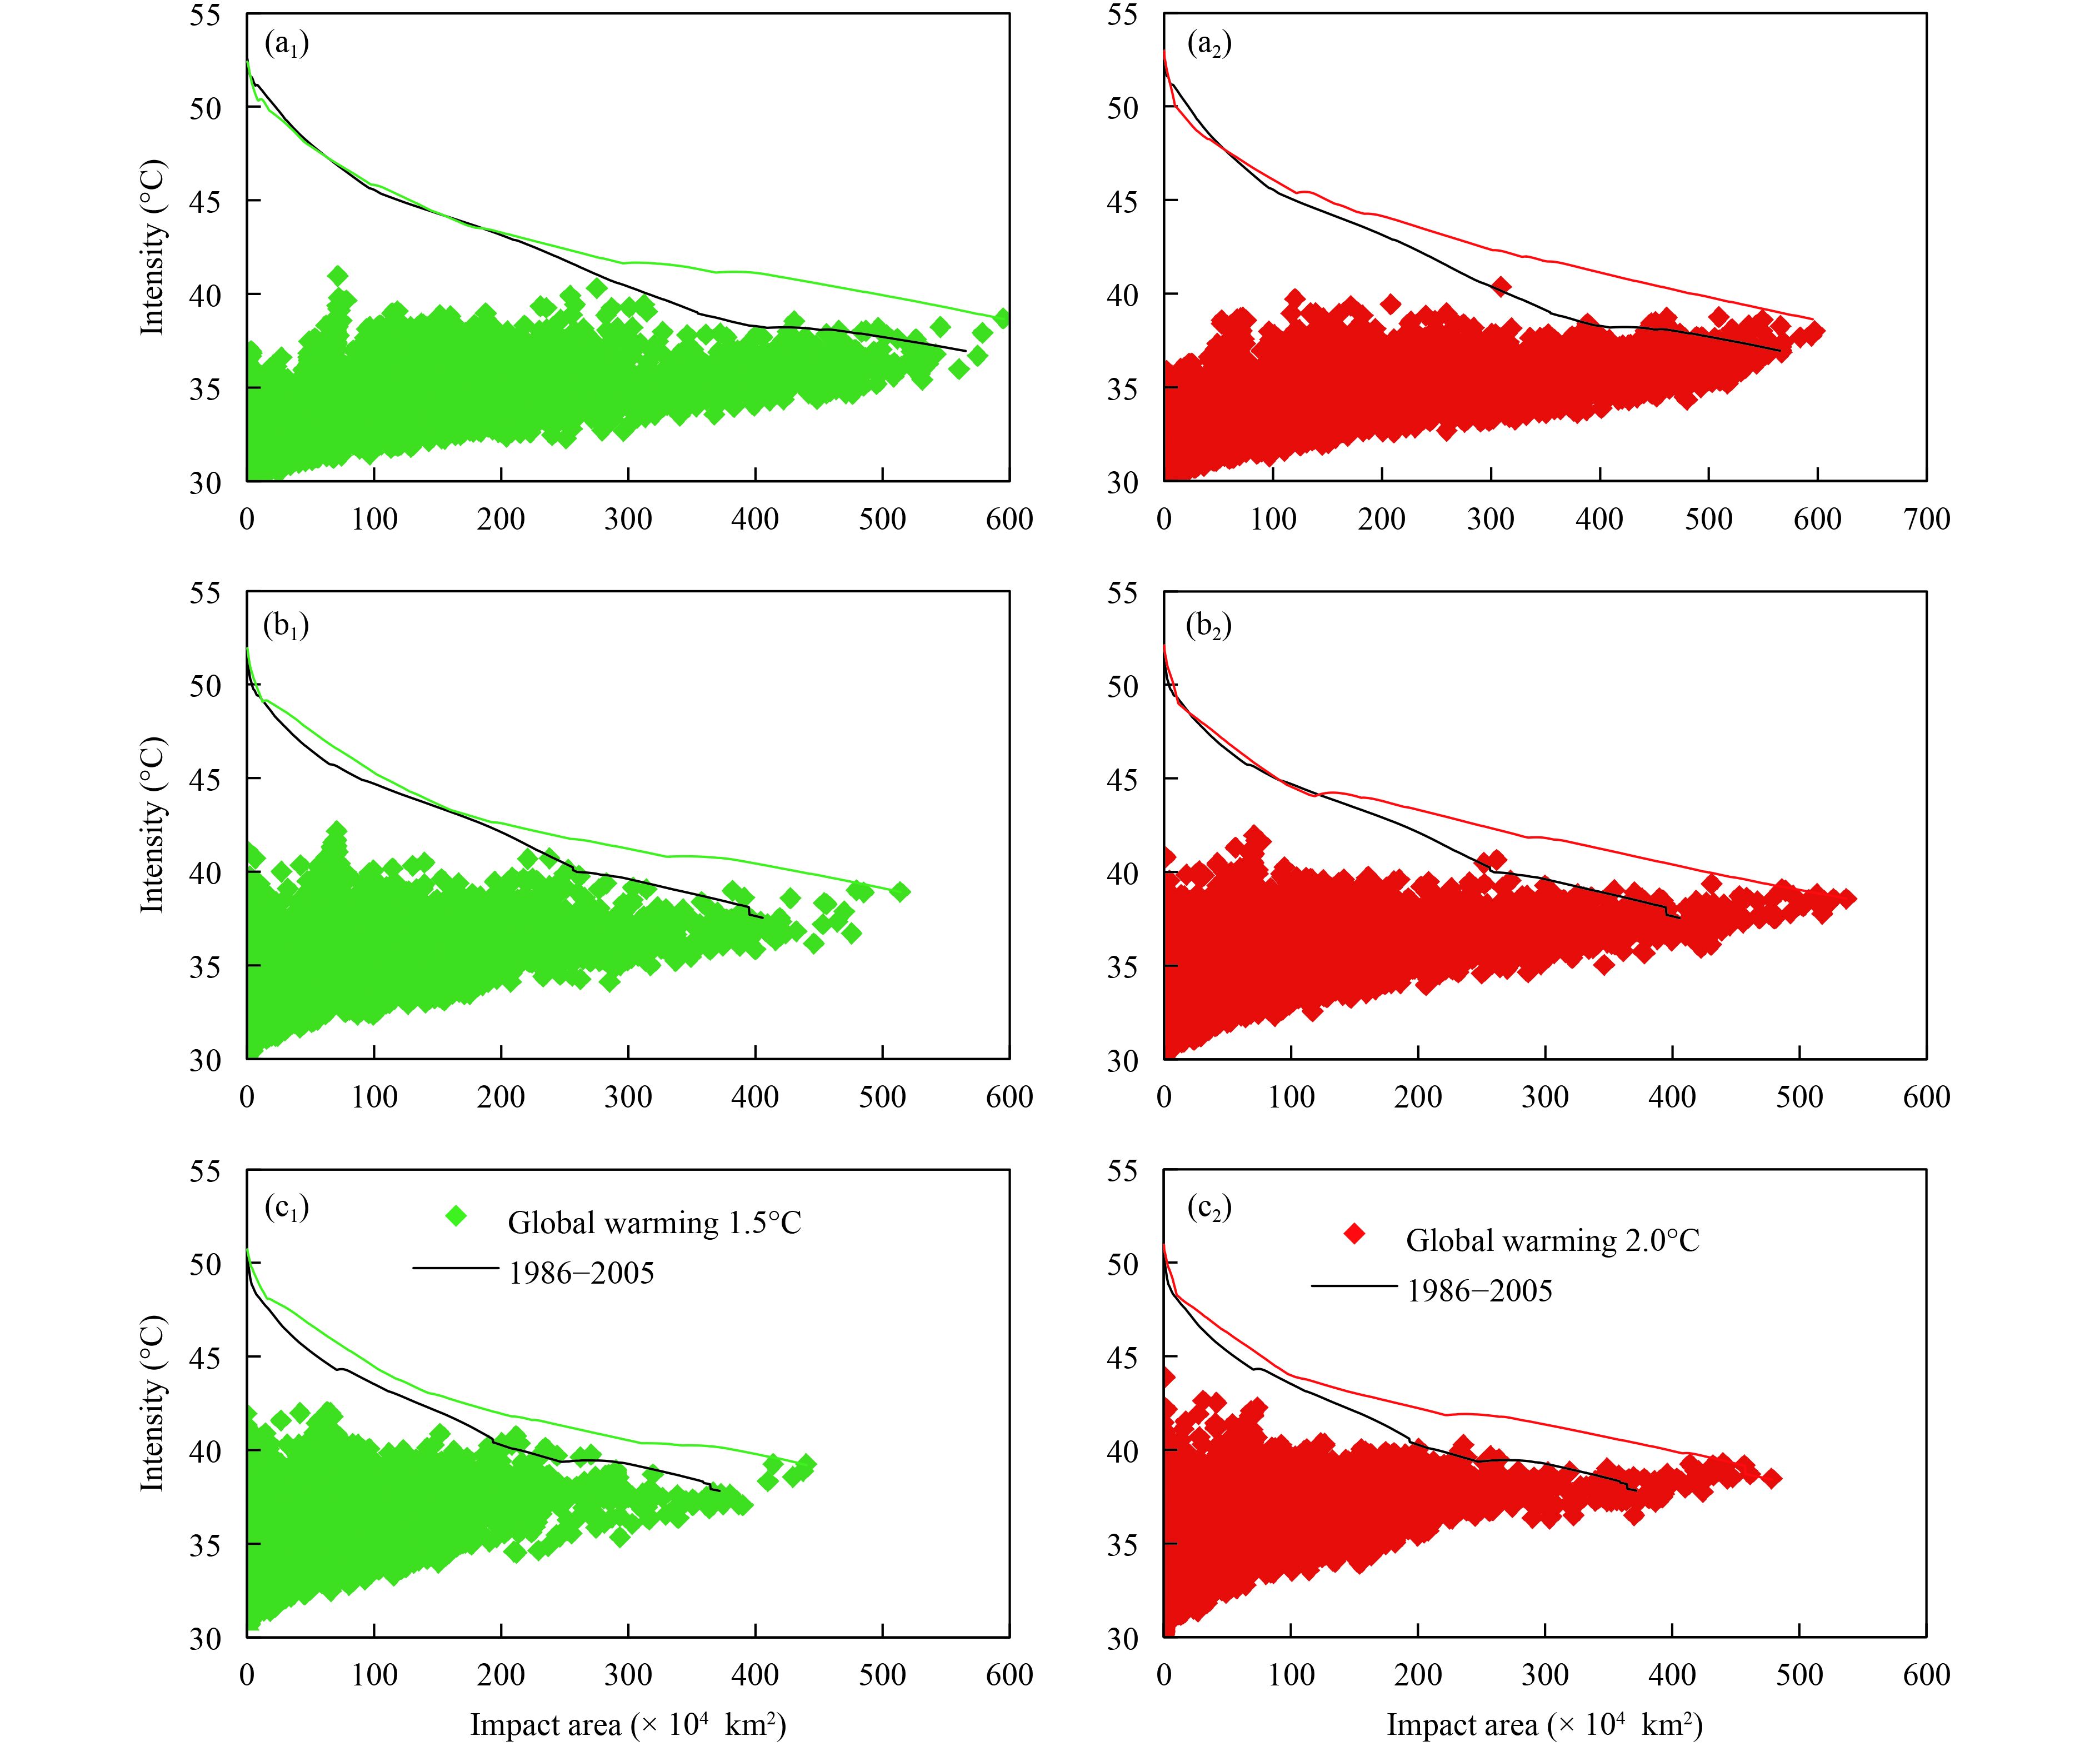
The envelopes shown in Fig. 11 represent the strongest EMTEs. Comparing the EMTEs and envelopes for the 1.5 and 2.0°C warming scenarios with the envelope for the reference period shows whether the EMTEs under the two global warming scenarios are stronger than the strongest events in the reference period. Under 1.5°C warming, 10 1-day EMTEs lie outside the envelope. These events have a greater intensity for the same coverage or a larger coverage for the same intensity. Under 2.0°C warming, 26 1-day EMTEs lie outside the envelope. Similarly, 24 and 72 3-day EMTEs and 20 and 28 5-day EMTEs lie outside the envelopes for global warming of 1.5 and 2.0°C, respectively. The envelopes for global warming of 1.5°C (green) and of 2.0 °C (red) both lie above the envelope of the reference period (black solid line) for 1-, 3-, and 5-day EMTEs (Fig. 9).
Therefore, in a warming world (either the 1.5 or 2.0°C scenario), some 1-, 3-, and 5-day EMTEs might exceed the most severe events observed in the reference period. Greater warming means a higher probability of EMTEs. The intensity of the most severe EMTEs under 2.0°C warming will be stronger than EMTEs with similar coverage under 1.5°C warming.
|
| Figure 11 Comparison of EMTEs with the baseline period IAD showing the envelopes for global warming of 1.5 and 2.0°C. Duration of EMTEs: (a1, a2) 1 day, (b1, b2) 3 days, and (c1, c2) 5 days. |
Figure 12 shows the projected locations of the centers of the most severe EMTEs of different durations under the two warming scenarios. The black circle in central China represents the center of the EMTE in the reference period. Under 1.5°C warming, in addition to the center in the reference period, two new EMTE centers develop: one in North China around Beijing–Tianjin–Hebei and the other in Southwest China around Chongqing– Sichuan. Under 2.0°C warming, a fourth EMTE center develops in Xinjiang Region. Therefore, additional centers of EMTE will appear with global warming, affecting a greater proportion of the population over a larger area.

|
| Figure 12 Locations of centers of maximum intensity of EMTE events of different durations under (a) 1.5 and (b) 2.0°C warming. |
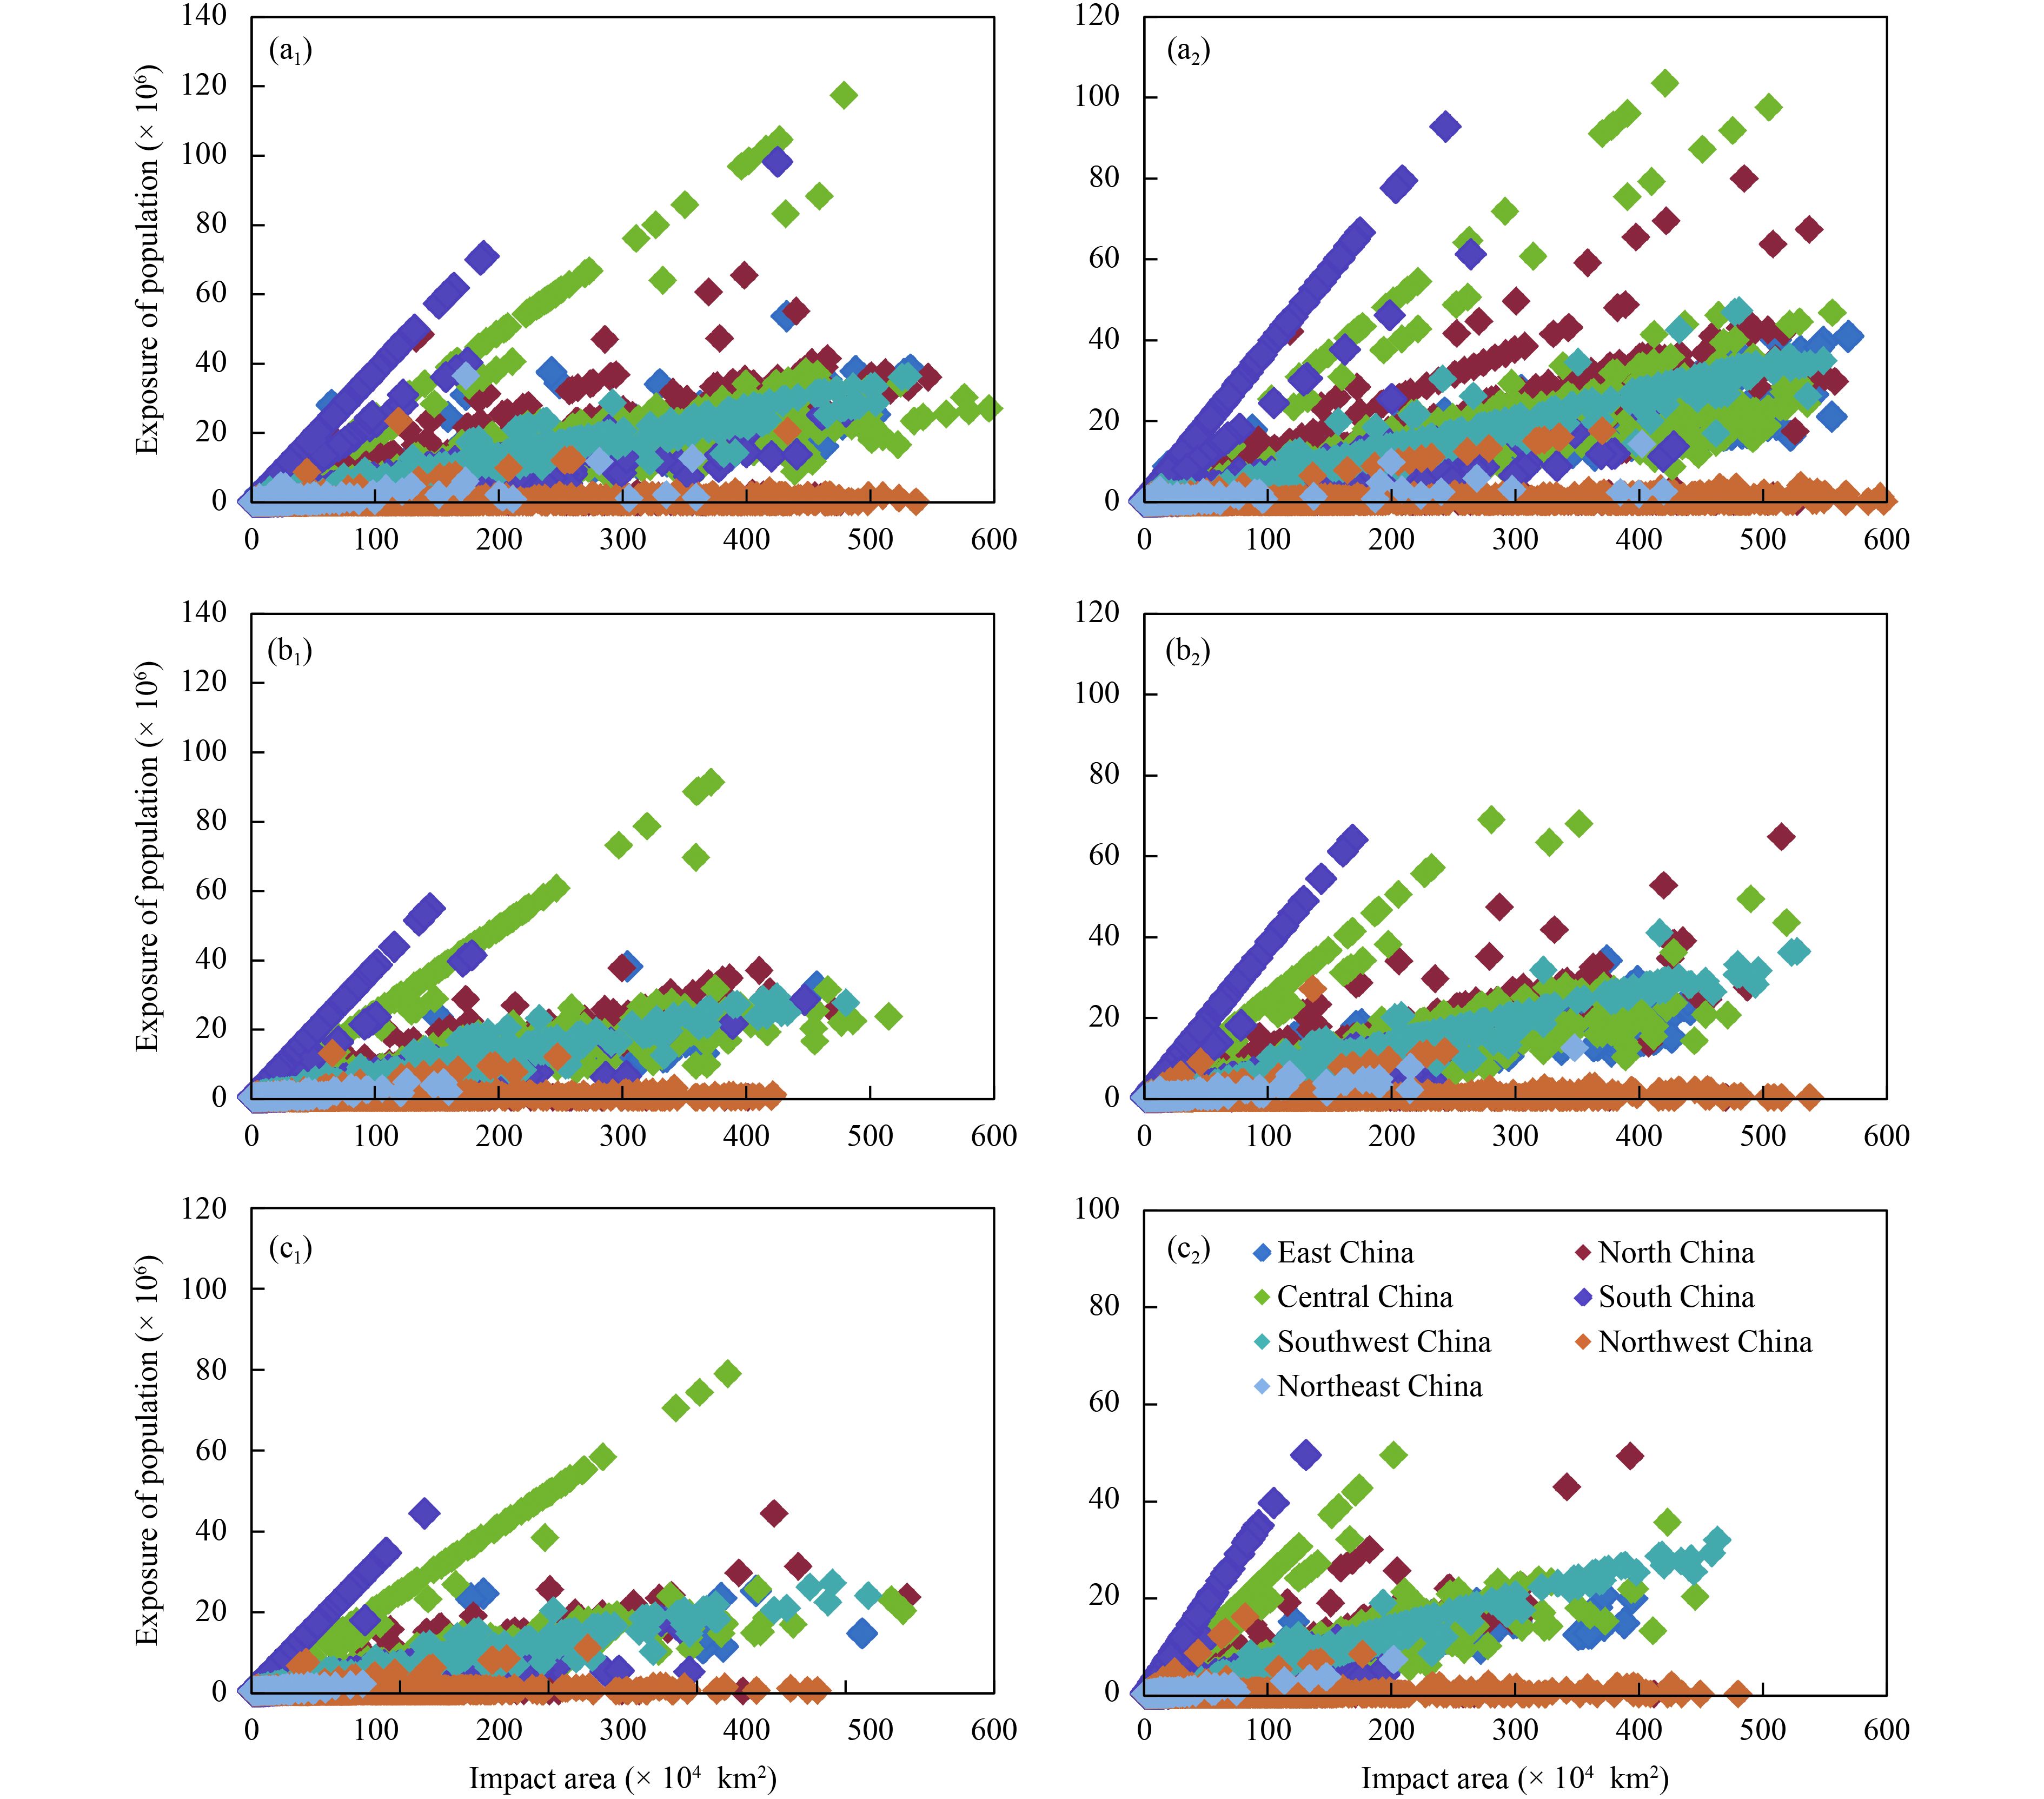
The severity of the impact of EMTEs depends not only on the events themselves, but also on the levels of exposure and vulnerability. The level of exposure is the extent to which the adverse effects of EMTEs affect the population, economy, and other factors (IPCC, 2012, 2014). It has been reported that the increased exposure of a population to EMTEs leads to higher rates of mortality (Rey et al., 2009). The exposure of a population to an EMTE is defined as that population within the areal coverage of the event. Figure 13 shows the coverage and population exposure for every EMTE in the seven geographical areas of China defined in this study. Coverage is large in the northwest, but the population exposure is low because of the low population density. The exposure in central China is the highest because of the large coverage and high population density.
Table 1 shows the population exposed to 1-, 3-, and 5-day EMTEs under the reference period and 1.5 and 2.0°C warming. Taking the 3-day EMTEs as an example, about 2.551 × 10⁸ people (20% of the total population) were exposed to EMTEs annually during the reference period. The population exposure was largest in central China, accounting for 35% of the total population exposure. The population exposure was smallest in Northeast and Northwest China, accounting for < 3% of the total population exposure. Under 1.5°C warming, it is projected that 3.386 × 10 8 people will be exposed to 3-day EMTEs annually, an increase of 32.7% compared with the reference period. It is projected that the largest population exposure will still be in central China and the smallest will be in Northeast and Northwest China. Under 2.0°C warming, it is projected that 3.6373×10⁸ people will be exposed to 3-day EMTEs annually, an increase of 7.4% compared with 1.5°C warming.
|
| Figure 13 Scatter plots of the population exposed to EMTEs. (a1) 1-day EMTEs under 1.5°C warming; (a2) 3-day EMTEs under 1.5°C warming; (b1) 1-day EMTEs under 2.0°C warming; (b2) 3-day EMTEs under 2.0°C warming; (c1) 5-day EMTEs under 1.5°C warming; and (c2) 5-day EMTEs under 2.0°C warming. |
| 1986–2005 | Global warming 1.5°C | Global warming 2.0°C | |||||||||
| 1-day EMTE | 3-day EMTE | 5-day EMTE | 1-day EMTE | 3-day EMTE | 5-day EMTE | 1-day EMTE | 3-day EMTE | 5-day EMTE | |||
| Northeast China | 3.40 | 1.44 | 0.73 | 3.70 | 1.69 | 0.97 | 2.46 | 2.42 | 1.45 | ||
| North China | 62.55 | 32.48 | 20.94 | 73.37 | 37.06 | 21.34 | 102.6 | 62.66 | 37.55 | ||
| East China | 66.30 | 46.01 | 35.54 | 73.79 | 52.54 | 40.30 | 76.23 | 58.58 | 44.19 | ||
| Central China | 129.6 | 89.39 | 62.05 | 160.1 | 123.8 | 96.55 | 132.1 | 108.9 | 86.15 | ||
| South China | 98.47 | 64.39 | 46.70 | 106.5 | 77.59 | 56.51 | 98.09 | 70.85 | 51.06 | ||
| Southwest China | 24.07 | 15.62 | 9.00 | 57.05 | 38.80 | 28.13 | 62.86 | 52.08 | 37.99 | ||
| Northwest China | 8.30 | 5.75 | 4.52 | 9.23 | 7.08 | 5.98 | 9.93 | 8.21 | 7.27 | ||
| China | 392.8 | 255.1 | 179.5 | 483.8 | 338.6 | 249.8 | 484.3 | 363.7 | 265.7 | ||
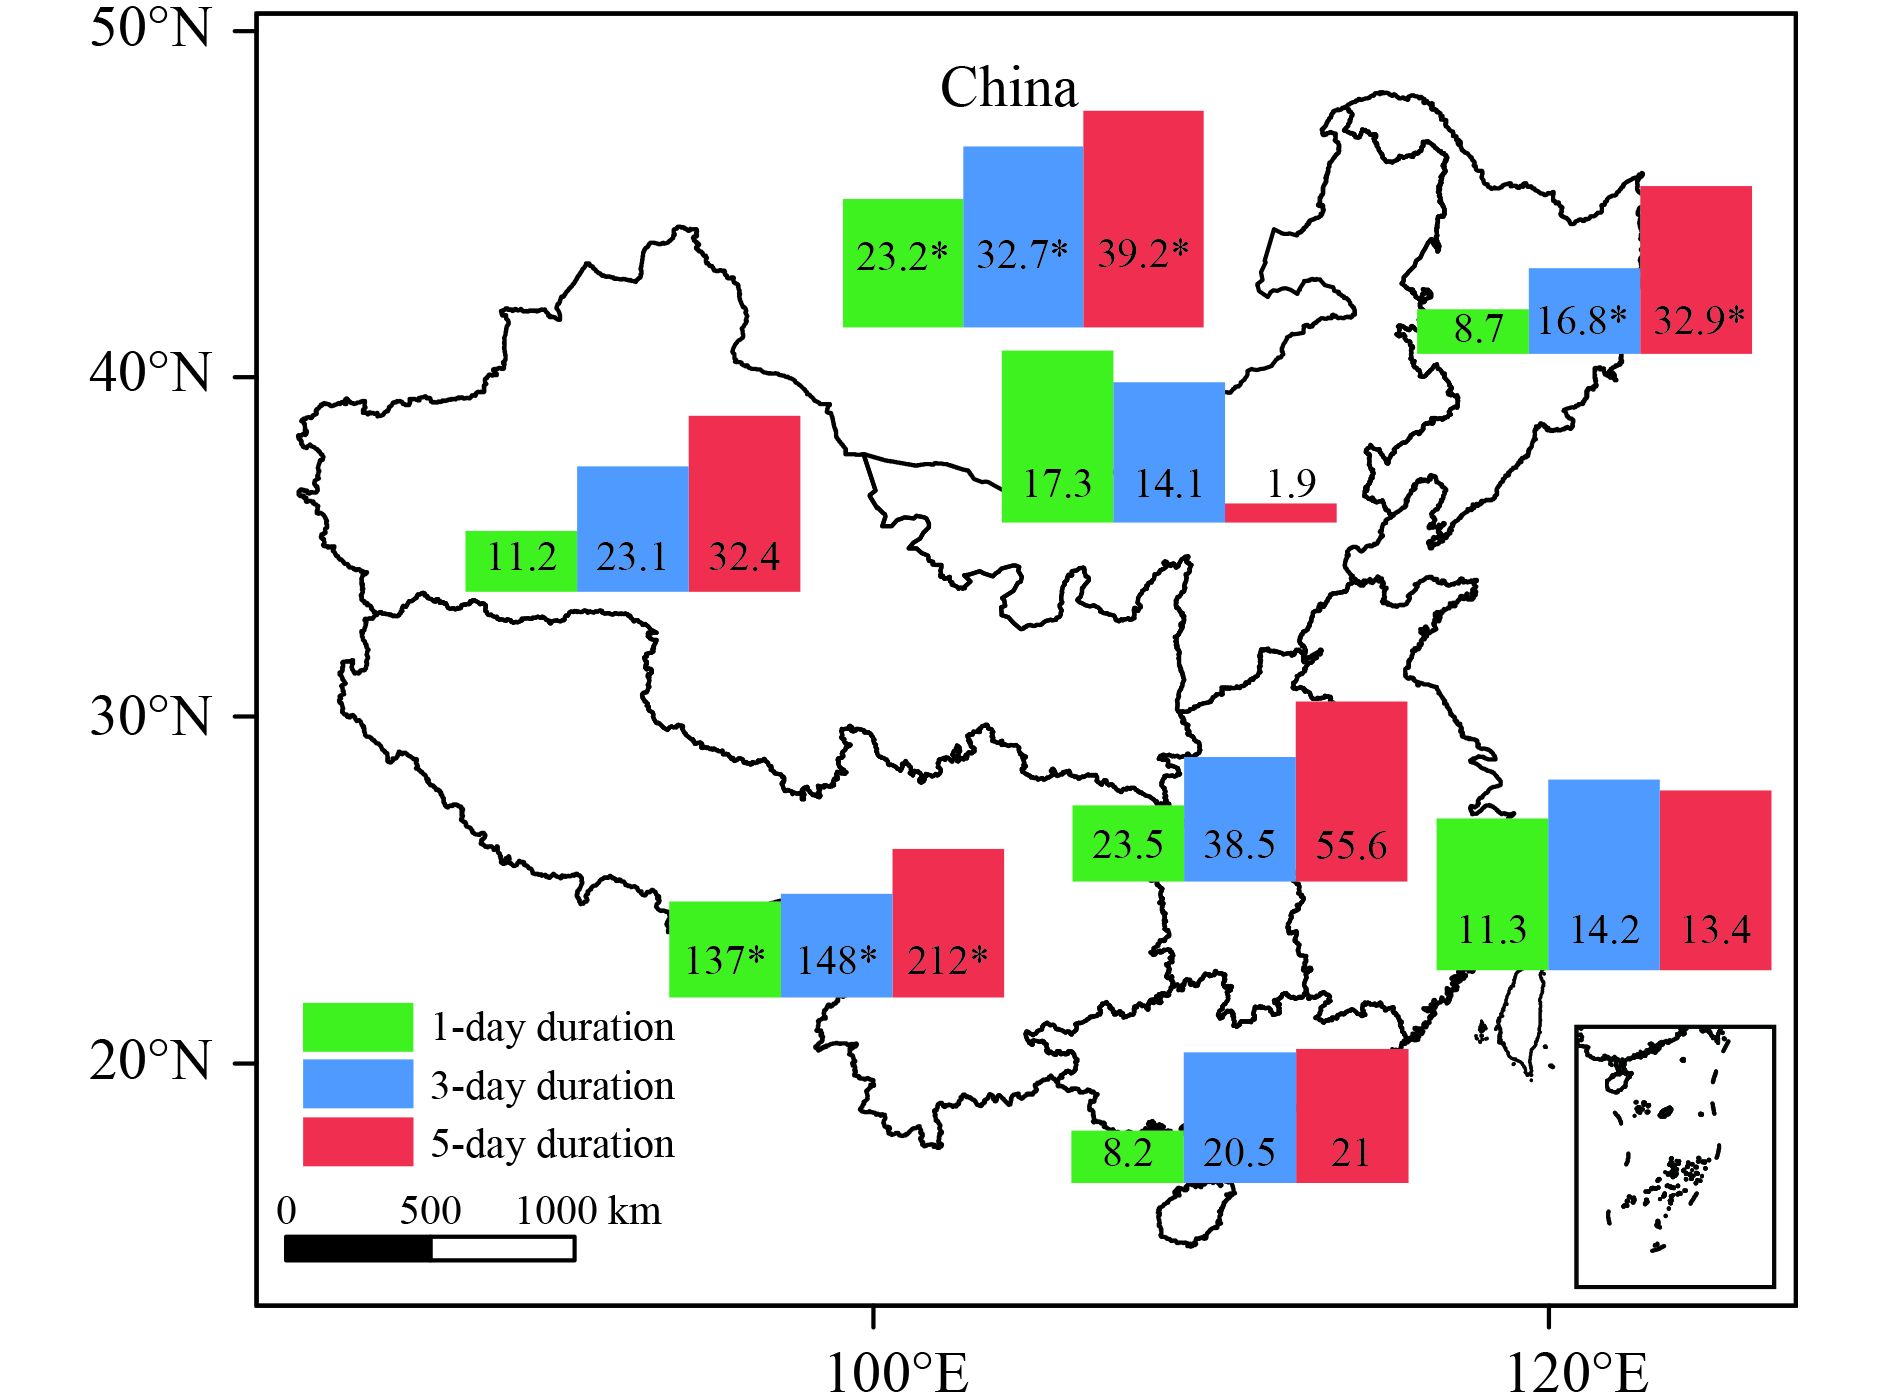
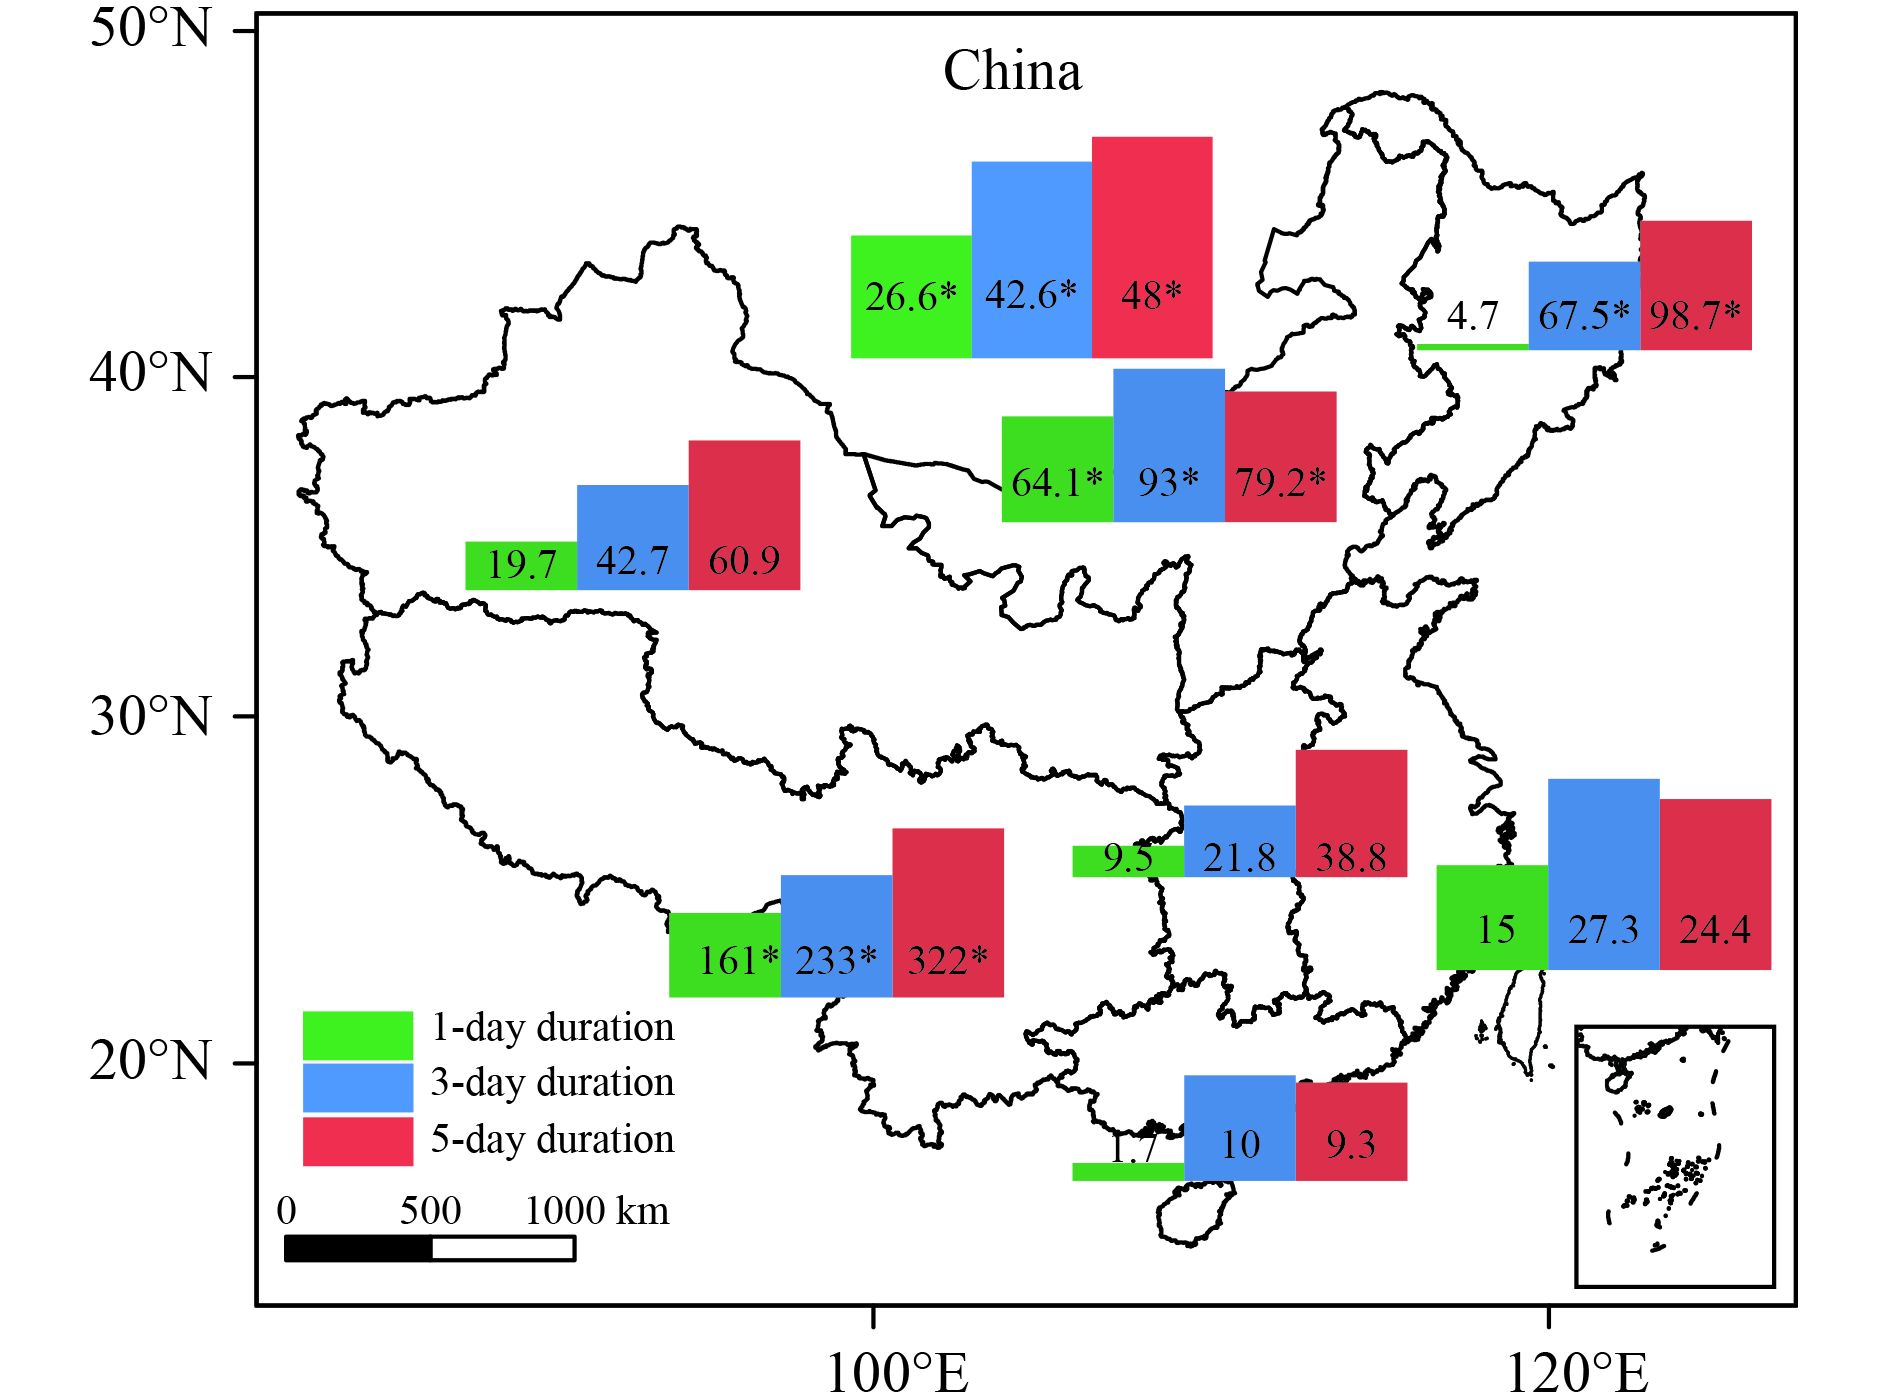
Figures 14 and 15 show the rates of projected population exposure to 1-, 3-, and 5-day EMTEs in different regions of China under the 1.5 and 2.0°C warming scenarios.In general, population exposure is expected to increase under both warming scenarios; however, the rate of growth of the 2.0°C warming scenario is higher than the 1.5°C warming scenario. Taking 3-day EMTEs as an example, it is projected that the population of China exposed to 3-day EMTEs will increase by 32.7% under 1.5°C warming and by 42.6% under 2.0°C warming. From a regional perspective, Southwest China is projected to experience the fastest rate of increase in exposure, regardless of the magnitude of global warming. Under 1.5°C warming, the rates of increase in population exposure in central and South China are projected to be higher than under 2.0°C warming. Conversely, the rates of increase under 2.0°C warming are projected to be much higher in North, Northeast, and Northwest China than under 1.5°C warming. This means that EMTEs might become more severe in North China under the warmer scenario.
|
| Figure 14 Relative change (%) of number of people exposed to EMTEs under global warming of 1.5°C (passing the 0.05 significance test). |
|
| Figure 15 As in Fig. 14, but for global warming of 2.0°C. |
Global warming had already affected EMTEs in China during the 20th century and continued warming may have further impacts. We evaluated the simulation capability of the CCLM regional climate model by comparing the model results with observational records from 756 metrological stations in China. The CCLM was able to satisfactorily simulate the observed daily maximum temperature of the reference period (1986–2005) in China. Changes in the frequency, intensity, and coverage of EMTEs under 1.5 and 2.0°C global warming scenarios are presented based on the CCLM output. The exposure of the population of China to EMTEs in a warming world is projected based on demographic data for 2010.
The frequency, intensity, and coverage of EMTEs are projected to increase with global warming and the greater the warming, the greater the increase. Table 2 presents the details of the frequency, intensity, and coverage of 1-, 3-, and 5-day EMTEs for the reference period and under the 1.5 and 2.0°C warming scenarios. Under 1.5°C warming, the number of EMTEs annually is projected to increase by 19–91 relative to the reference period, their intensity is projected to increase by 0.1–0.5°C, and their areal coverage is projected to increase by (0.54–0.72) × 106 km2. Under 2.0°C warming, the number of EMTEs annually is projected to increase by 29–166 relative to the reference period, their intensity is projected to increase by 0.2–0.9°C, and their areal coverage is projected to increase by (0.88–1.24) × 106 km2. Compared with 1.5°C warming, the number of EMTEs annually, their intensity, and area of impact under 2.0°C warming increase by 10–75, 0.1–0.5°C, and (0.34–0.52) × 106 km2, respectively. The frequency and coverage of longer lasting EMTEs are projected to increase more than for EMTEs of shorter duration. This means that longer lasting EMTEs could become more severe in a warmer future. Other studies have found similar results—for instance, Schleussner et al. (2016) estimated that for a warming of 1.5°C, the global land area projected to experience heat waves would increase by 10% (0–30%) and that the area of affected land would increase by 50% (30%–80%) under 2.0 °C warming.
| Reference period | Global warming 1.5°C | Global warming 2.0°C | ||||||||||||
| A* | B* | C* | D* | A* | B* | C* | D* | A* | B* | C* | D* | |||
| 1-day | 1680 | 31.4 | 3.88 | 392.77 | 1699 | 31.5 | 4.60 | 483.84 | 1709 | 31.6 | 5.12 | 484.33 | ||
| 3-day | 1490 | 32.6 | 2.48 | 255.08 | 1547 | 33.0 | 3.10 | 338.57 | 1595 | 33.5 | 3.51 | 363.73 | ||
| 5-day | 1330 | 33.3 | 1.76 | 179.48 | 1421 | 33.8 | 2.30 | 249.78 | 1496 | 34.0 | 2.64 | 265.66 | ||
| *A, frequency (times yr–1); B, intensity (°C); C, coverage (106 km2); and D, population exposure (106 yr–1). | ||||||||||||||
Some EMTEs (regardless of whether of 1-, 3-, or 5-day duration) for both warming scenarios are projected to be stronger than the most severe events in the reference period. Under 1.5°C warming, 10–24 unprecedented EMTEs may occur, whereas 26–72 unprecedented EMTEs may occur under 2.0°C warming. In general, a greater magnitude of global warming means a higher probability of the occurrence of unprecedented EMTEs. Diffenbaugh and Scherer (2011) found that even under the relatively moderate warming expected over the next half century, China is likely to experience unprecedented EMTEs. Therefore, it appears inevitable that China will face an increase in unprecedented EMTEs in the future.
Our results show that there was always one center of severe EMTE in central China during the reference period. Under 1.5°C warming, there are two additional centers: one in the north and the other in the southwest. Under 2.0°C warming, a fourth center appears in Xinjiang Region. The increasing number of centers of severe EMTEs means that a greater number of people and a larger area will be affected by the most severe EMTEs in the future.
In a warming world, more people will be exposed to EMTEs and the effects of EMTEs with a wide spatial coverage and long duration on natural ecosystems and human health will be more severe. Under 1.5 and 2.0°C warming, the population exposure is projected to increase by (70.3–91.07) × 106 and (86.18–108.65) × 106 people yr–1, respectively, relative to the reference period. Compared with 1.5°C warming, the population exposure increases by (0.49–25.16) × 106 people yr–1 under 2.0°C warming. Population exposure increases with temperature and new centers of the most severe EMTEs are projected to appear around the Beijing–Tianjin–Hebei and Chongqing–Sichuan regions. Because of the high population density and developed economies of these areas, the effects of these new EMTEs will have greater socioeconomic impacts. Compared with the 1.5°C warming scenario, almost all the increase in population exposure under 2.0°C warming is expected to occur in North, Northeast, and Northwest China. The northwest region of China, in particular, is an area in which the ecology is fragile and the economy is poorly developed. Under 2.0°C warming, the impact of increasingly severe EMTEs could exacerbate this situation.
The occurrence of future unprecedented EMTEs in China appears to be inevitable. However, the frequency, intensity, coverage, and population exposure of the EMTEs associated with 1.5°C warming are lower than with 2.0°C warming. Under 2.0°C warming, northern China (especially the northwest region) is expected to experience relatively greater consequences from increasingly severe EMTEs. It is therefore recommended that the Chinese government should strive to achieve the goal of 1.5°C warming.
Acknowledgments. We acknowledge the ISI–MIP coordination group at the Potsdam Institute of Climate Impact Studies in Germany for the provision of the GFDL-ESM2M, HadGEM2-ES, IPSL-CM5A-LR, MIROCESM-CHEM, NorESM1-M, and MPI-ESM-LR data. We are grateful to Anqian Wang and Jinlong Huang of the University of the Chinese Academy of Sciences and to Jing Chen, Cheng Jing, and other graduate students for participating in this work. The authors are grateful for the constructive comments and suggestions by the editor and reviewers.
| Alexer, L. V., X. Zhang, T. C. Peterson, et al., 2006: Global observed changes in daily climate extremes of temperature and precipitation. J. Geophys. Res., 111, D05109. DOI:10.1029/2005JD006290 |
| Andreadis, K. M., E. A. Clark, A. W. Wood, et al., 2005: Twentieth-century drought in the conterminous United States. J. Hydrometeor., 6, 985–1001. DOI:10.1175/JHM450.1 |
| Burkhard, R., W. Andreas, H. Andreas, et al., 2008: The regional climate model COSMO-CLM (CCLM). Meteorologische Zeitschrift, 17, 347–348. DOI:10.1127/0941-2948/2008/0309 |
| Cao, L. G., J. Zhong, B. D. Su, et al., 2013: Probability distribution and projected trends of daily precipitation in China. Progressue Inquisitiones de Mutatione Climatis, 4, 153–159. DOI:10.3724/SP.J.1248.2013.153 |
| Chen, J., H. B. Liu, Y. J. Wang, et al., 2016: Variation of drought characteristics and its agricultural exposure in North China Plain. Chinese J. Agrometeorol., 37, 587–598. DOI:10.3969/j.issn.1000-6362.2016.05.011 |
| China Meteorological Administration, 2013: The Top Ten Weather and Climate Extreme Events in China in 2013. Available on-line at http://news.weather.com.cn/2013/11/2011013_3.shtml. |
| Dankers, R., N. W. Arnell, D. B. Clark, et al., 2013: A first look at changes in flood hazard in the inter-sectoral impact model intercomparison project ensemble. Proc. Nat. Acad. Sci. USA, 111, 3257–3261. DOI:10.1073/pnas.1302078110 |
| Davie, C. S, D. Falloon J., Kahana P., et al., 2013: Comparing projections of future changes in runoff from hydrological and biome models in ISI–MIP. Earth Syst. Dynam., 4, 359–374. DOI:10.5194/esd-4-359-2013 |
| Diffenbaugh, N. S., and M. Scherer, 2011: Observational and model evidence of global emergence of permanent, unprecedented heat in the 20th and 21st centuries. Climatic Change, 107, 615–624. DOI:10.1007/s10584-011-0112-y |
| Ding, T., W. Qian, and Z. W. Yan, 2010: Changes in hot days and heat waves in China during 1961–2007. Int. J. Climatol., 30, 1452–1462. DOI:10.1002/joc.1989 |
| Ding, Y. H., G. Y. Ren, Z. C. Zhao, et al., 2007: Detection, causes and projection of climate change over China: An overview of recent progress. Adv. Atmos. Sci., 24, 954–971. DOI:10.1007/s00376-007-0954-4 |
| Easterling, D. R., J. L. Evans, P. Y. Groisman, et al., 2000: Observed variability and trends in extreme climate events: A brief review. Bull. Amer. Meteor. Soc., 81, 417–425. DOI:10.1175/1520-0477(2000)081<0417:OVATIE>2.3.CO;2 |
| Fischer, T., C. Menz, B. D. Su, et al., 2013: Simulated and projected climate extremes in the Zhujiang River basin, South China, using the regional climate model COSMO-CLM. J. Climatol., 33, 2988–3001. DOI:10.1002/joc.3643 |
| Frieler, K., R. Betts, E. Burke, et al., 2016: Assessing the impacts of 1.5°C global warming—simulation protocol of the Inter-Sectoral Impact Model Intercomparison Project (ISIMIP2b). Geosci. Model Dev., 10, 1–59. DOI:10.5194/gmd-2016-229 |
| Gemmer, M., T. Jiang, B. D. Su, et al., 2008: Seasonal precipitation changes in the wet season and their influence on flood/drought hazards in the Yangtze River Basin, China. Quaternary International, 186, 12–21. DOI:10.1016/j.quaint.2007.10.001 |
| Greene, S., L. S. Kalkstein, D. M. Mills, et al., 2011: An examination of climate change on extreme heat events and climate-mortality relationships in large U.S. cities. Wea. Climate Soc., 3, 281–292. DOI:10.1175/WCAS-D-11-00055.1 |
| Hansen, J., M. Sato, R. Ruedy, et al., 2006: Global temperature change. Proc. Nat. Acad. Sci. USA, 103, 14288–14293. DOI:10.1073/pnas.0606291103 |
| Homar, V., C. Ramis, R. Romero, et al., 2010: Recent trends in temperature and precipitation over the Balearic Islands (Spain). Climatic Change, 98, 199–211. DOI:10.1007/s10584-009-9664-5 |
| Huang, J. L., H. Tao, T. Fischer, et al., 2015: Simulated and projected climate extremes in the Tarim River basin using the regional climate model CCLM. Stoch. Environ. Res. Risk Assess., 29, 2061–2071. DOI:10.1007/s00477-015-1059-8 |
| Huang, J. L., Y. J. Wang, T. Fischer, et al., 2017a: Simulation and projection of climatic changes in the Indus River Basin, using the regional climate model COSMO-CLM. Int. J. Climatol., 37, 2545–2562. DOI:10.1002/joc.4864 |
| Huang, J. L., J. Q. Zhai, T. Jiang, et al., 2017b: Analysis of future drought characteristics in China using the regional climate model CCLM. Climate Dyn.. DOI:10.1007/s00382-017-3623-z |
| IPCC, 2012: Managing the Risks of Extreme Events and Disasters to Advance Climate Change Adaptation. Special report of the Intergovernmental Panel on Climate Change. Cambridge University Press, United Kingdom and New York, NY, USA, 326 pp. |
| IPCC, 2013: Climate Change 2013: The Physical Science Basis. Contribution of Working Group I to the Fifth Assessment Report of the Intergovernmental Panel on Climate Change. Stocker, T. F., D. Qin, G. -K. Plattner, et al., Eds., United Kingdom and New York, NY, USA, Cambridge University Press, 356 pp. |
| IPCC, 2014: Summary for Policymakers. Climate Change 2014: Impacts, adaptation and vulnerability. Contribution of Working Group II to the Fifth Assessment Report of the Intergovernmental Panel on Climate Change. Field, C. B., V. R. Barros, D. J. Dokken, et al., Eds., United Kingdom and New York, NY, USA, Cambridge University Press, 569 pp. |
| Ito, A., K. Nishina, and H. M. Noda, 2016: Impacts of future climate change on the carbon budget of northern high-latitude terrestrial ecosystems: An analysis using ISI-MIP data. Polar Sci., 10, 346–355. DOI:10.1016/j.polar.2015.11.002 |
| Jing, C., T. Jiang, Y. J. Wang, et al., 2016: A study on regional extreme precipitation events and the exposure of population and economy in China. Acta Meteor. Sinica, 74, 572–582. DOI:10.11676/qxxb2016.037 |
| Karl, T. R., and D. R. Easterling, 1999: Climate extremes: Selected review and future research directions. Climatic Change, 42, 309–325. DOI:10.1023/A:1005436904097 |
| Kothawale, D. R., and K. R. Kumar, 2005: On the recent changes in surface temperature trends over India. Geophys. Res. Lett., 32, L18714. DOI:10.1029/2005GL023528 |
| Kousari, M. R., H. Ahani, and R. Hendi-Zadeh, 2013: Temporal and spatial trend detection of maximum air temperature in Iran during 1960–2005. Global and Planetary Change, 111, 97–110. DOI:10.1016/j.gloplacha.2013.08.011 |
| Kruger, A. C., and S. S. Sekele, 2013: Trends in extreme temperature indices in South Africa: 1962–2009. Int. J. Climatol., 33, 661–676. DOI:10.1002/joc.3455 |
| National Bureau of Statistics of the People’s Republic of China, 2010: The Sixth Nationwide Population Census Data. [Available online at http://www.stats.gov.cn/tjsj/tjgb/rkpcgb/qgrkpcgb/201104/t20110429_30328.html]. |
| National Center for Health Statistics, 2007: National Vital Statistics System: Mortality data. [Available online at http://www.cdc.gov/nchs/deaths.htm]. |
| National Weather Service, 2009: Weather Fatalities. [Available online at http://www.nws.noaa.gov/om/hazstats.shtml]. |
| Perkins, S. E., L. V. Alexer, and J. R. Nairn, 2012: Increasing frequency, intensity and duration of observed global heatwaves and warm spells. Geophys. Res. Lett., 39, L20714. DOI:10.1029/2012GL053361 |
| Qin, N. X., J. N. Wang, G. S. Yang, et al., 2015: Spatial and temporal variations of extreme precipitation and temperature events for Southwest China in 1960–2009. Geoenvironmental Disasters, 2. DOI:10.1186/s40677-015-0014-9 |
| Rey, G., A. Fouillet, P. Bessemoulin, et al., 2009: Heat exposure and socio-economic vulnerability as synergistic factors in heat-wave-related mortality. Eur. J. Epidemiol., 24, 495–502. DOI:10.1007/s10654-009-9374-3 |
| Rogelj, J., W. Hare, J. Lowe, et al., 2011: Emission pathways consistent with a 2 °C global temperature limit. Nat. Climate Change, 1, 413–418. DOI:10.1038/nclimate1258 |
| Schleussner, C. -F., T. K. Lissner, E. M. Fischer, et al., 2016: Differential climate impacts for policy-relevant limits to global warming: The case of 1.5°C and 2°C. Earth Syst. Dynam., 7, 327–351. DOI:10.5194/esd-7-327-2016 |
| Sheffield, J., K. M. Andreadis, E. F. Wood, et al., 2009: Global and continental drought in the second half of the twentieth century: Severity–area–duration analysis and temporal variability of large-scale events. J. Climate, 22, 1962–1981. DOI:10.1175/2008JCLI2722.1 |
| Shi, Y. F., Y. P. Shen, D. L. Li, et al., 2003: Discussion on the present climate Change from warm-dry to warm-wet in Northwest China. Quaternary Sciences, 23, 152–164. DOI:10.3321/j.issn:1001-7410.2003.02.005 |
| Steppeler, Doms, Schättler J., et al., 2003: Meso-gamma scale forecasts using thenon-hydrostatic model LM. Meteor. Atmos. Phys., 82, 75–96. DOI:10.1007/s00703-001-0592-9 |
| Su, B., J. L. Huang, M. Gemmer, et al., 2016: Statistical downscaling of CMIP5 multi-model ensemble for projected changes of climate in the Indus River Basin. Atmos. Res., 178-179, 138–149. DOI:10.1016/j.atmosres.2016.03.023 |
| Tan, F., B. D. Su, C. Gao, et al., 2012: High-resolution regional climate model (CCLM) for simulation of precipitation in the Huaihe River Basin, China. Resour. Environ. Yangtze Basin, 21, 1236–1242. |
| Thomson, A. M., K. V. Calvin, S. J. Smith, et al., 2011: RCP4.5: A pathway for stabilization of radiative forcing by 2100. Climatic Change, 109, 77–94. DOI:10.1007/s10584-011-0151-4 |
| Taylor, K. E., 2001: Summarizing multiple aspects of model performance in a single diagram. J. Geophy. Res. Atmos., 106, 7183–7192. DOI:10.1029/2000JD900719 |
| United Nations Framework Convention on Climate Change (UNFCCC), 2015: The Paris Agreement. [Available online at http://unfccc.int/paris_agreement/items/9485.php]. |
| Upperman, C. R., J. Parker, C. S. Jiang, et al., 2015: Frequency of extreme heat event as a surrogate exposure metric for examining the human health effects of climate change. PLoS One, 10, e0144202. DOI:10.1371/journal.pone.0144202 |
| Valleron, A. J., and A. Boumendil, 2004: Epidemiology and heat waves: Analysis of the 2003 episode in France. Comptes Rendus Biologies, 327, 1125–1141. DOI:10.1016/j.crvi.2004.09.009 |
| Van, Vuuren, P. D., Edmonds J., Kainuma M., et al., 2011: The representative concentration pathways: An overview. Climatic Change, 109, 5. DOI:10.1007/s10584-011-0148-z |
| Vescovi, L., A. Bourque, G. Simonet, et al., 2009: Transfer of climate knowledge via a regional climate-change management body to support vulnerability, impact assessments and adaptation measures. Climate Res., 40, 163–173. DOI:10.3354/cr00787 |
| Vose, R. S., D. R. Easterling, and B. Gleason, 2005: Maximum and minimum temperature trends for the globe: An update through 2004. Geophys. Res. Lett., 32, L23822. DOI:10.1029/2005GL024379 |
| Wang, D. N., C. Menz, T. Simon, et al., 2013: Regional dynamical downscaling with CCLM over East Asia. Meteor. Atmos. Phys., 121, 39–53. DOI:10.1007/s00703-013-0250-z |
| Wang, P. X., and J. H. Yang, 2007: Extreme high temperature events and response to regional warming in recent 45 years in Northwest China. J. Desert Res., 27, 649–655. |
| Warszawski, L., K. Frieler, V. Huber, et al., 2014: The Inter-Sectoral Impact Model Intercomparison Project (ISI–MIP): Project framework. Proc. Nat. Acad. Sci. USA, 111, 3228–3232. DOI:10.1073/pnas.1312330110 |
| Xu, Y., X. J. Gao, Y. Shen, et al., 2009: A daily temperature dataset over China and its application in validating a RCM simulation. Adv. Atmos. Sci., 26, 763–772. DOI:10.1007/s00376-009-9029-z |
| Zhai, J. Q., J. L. Huang, B. D. Su, et al., 2017: Intensity–area–duration analysis of droughts in China, 1960–2013. Climate Dyn., 48, 151–168. DOI:10.1007/s00382-016-3066-y |
| Zhang, F., H. Gao, and X. Cui, 2008: Frequency of extreme high temperature days in China, 1961–2003. Weather, 63, 46–49. DOI:10.1002/wea.136 |
| Zhang, S. Y., S. R. Wang, Y. S. Zhang, et al., 2004: The climatic character of high temperature and the prediction in the large cities of east of China. J. Tropical Meteor., 20, 750–760. |
| Zhou, Y., and G. Y. Ren, 2011: Change in extreme temperature event frequency over mainland China, 1961–2008. Climate Res., 50, 125–139. DOI:10.3354/cr01053 |
 2018, Vol. 32


