The Chinese Meteorological Society
Article Information
- YOU, Ting, Renguang WU, and Gang HUANG, 2018.
- Differences in Meteorological Conditions between Days with Persistent and Non-Persistent Pollution in Beijing, China. 2018.
- J. Meteor. Res., 32(1): 81-98
- http://dx.doi.org/10.1007/s13351-018-7086-x
Article History
- Received June 5, 2017
- in final form August 24, 2017
2. College of Atmospheric Sciences, Chengdu University of Information Technology, Chengdu 610225;
3. State Key Laboratory of Numerical Modeling for Atmospheric Sciences and Geophysical Fluid Dynamics, Institute of Atmospheric Physics, Chinese Academy of Sciences, Beijing 100029;
4. Laboratory for Regional Oceanography and Numerical Modeling, Qingdao National Laboratory for Marine Science and Technology, Qingdao 266237;
5. Joint Center for Global Change Studies, Beijing 100875;
6. University of Chinese Academy of Sciences, Beijing 100049
Particulate matter in the form of microscopic solid or liquid particles suspended in the earth’s atmosphere is a major cause of air pollution. Particulate matter poses significant threats to human health (Kaur et al., 2007; Pope III et al., 2009), the environment (Berico et al., 1997), and transportation (Ji et al., 2012). For instance, particulate matter may lead to permanent mutations in DNA, heart attacks, and premature death if the particles penetrate unfiltered into our lungs and bloodstream (Wilson et al., 2004). Particulate matter may cause traffic congestion as a result of reduced visibility. Particulate matter can also reflect and absorb solar radiation and alter the properties of clouds (Twomey, 1974; Lyu et al., 2016). A greater understanding of the relationship between air pollution and meteorological conditions may help to improve the prediction and effective mitigation of the distribution of air pollutants.
Air pollution is influenced by emissions of particulate matter (Buchanan et al., 2002; Beaver et al., 2010; Molina et al., 2010), the weather (Buchanan et al., 2002; Chen et al., 2008; Jacob and Winner, 2009; Beaver et al., 2010; Fung and Wu, 2014; Zhao et al., 2016), and the local topography (Fu et al., 2014). The major sources of aerosol pollution in Beijing include the burning of coal as fuel, exhaust fumes from traffic, and dust transported from other regions (Sun et al., 2004). The local meteorological conditions and topography are responsible for the conversion, diffusion, and transport of aerosol particles. Beijing is characterized by a monsoon climate, with northerly winds prevailing in winter and southerly winds dominating in summer, and the city is located south of the Yan Mountains and east of the Taihang Mountains. As a result of this half-open basin topography, which is unfavorable for the diffusion of air pollutants, regional air pollution tends to be more severe when southwesterly and southeasterly winds prevail over the North China Plain (Chen et al., 2008; Liu et al., 2013; Pu et al., 2015; Zhang L. et al., 2015; Ye et al., 2016).
The concentrations of particulate matter in Beijing show remarkable interannual, seasonal, monthly, weekly, and diurnal variations (Choi et al., 2008; Tian et al., 2014). A reduction has been observed in the number of days with atmospheric pollution in the Beijing metropolitan region over the last decade (Tian et al., 2014). Tian et al. (2014) reported that the poorest air quality occurs in spring and the best air quality in summer. Choi et al. (2008) suggested that there is a possible link on a weekly scale between cloud formation and particulate matter with a diameter < 10 μm (PM 10). PM2.5 pollution generally increases at night and decreases during the day (Lyu et al., 2016). The overall concentration of particulate matter varies on different temporal scales. It is therefore important to investigate the relationship between the concentration of particulate matter and meteorological variables on different temporal scales.
A range of weather factors may affect air pollution. Previous studies have suggested that weak winds and high relative humidity (Zhang H. L. et al., 2015) are favorable to the formation of pollution events. Weak winds can re-suspend particles, leading to the accumulation of aerosol particles. A high relative humidity facilitates the partition of semi-volatile species into the aerosol phase (Hu et al., 2008), leading to high concentrations of particulate matter. Atmospheric pressure has been suggested to be the most important meteorological factor influencing the concentration of PM10 (Tian et al., 2014). The direction of winds is a key factor in the occurrence of air pollution. The highest PM2.5 concentrations in Beijing were observed during easterly winds (Zhang H. L. et al., 2015). The impact of precipitation on air quality has been reported in many studies. Increased rainfall may improve air quality as aerosols are washed out of the atmosphere (Cheng et al., 2006; Wang and Lu, 2006; Dawson et al., 2007). The vertical structure of the atmospheric boundary layer plays an important part in the variations in the concentration of surface pollutants (Zhang L. et al., 2015). Temperature inversion can suppress the development of vertical mixing and the dispersion of air pollutants (Ji et al., 2012).
The effect of synoptic patterns on air quality has received increasing attention in recent years. Chen et al. (2008) observed that the increasing phase of the air pollution index was associated with high pressure followed by low pressure. Zhang R. H. et al. (2013) reported that a weak East Asian monsoon, an anomalous high at 500 hPa, a reduction in the vertical shear of horizontal winds, and an anomalous inversion in the near-surface atmosphere all provide favorable conditions for the development and persistence of fog and haze over eastern China. Chen and Wang (2015) reported that the occurrence of severe haze events in the boreal winter is generally related to weakened northerly winds, the development of inversion anomalies in the lower troposphere, a weakened East Asian trough in the mid-troposphere, and the northward displacement of the East Asian jet in the upper troposphere. Zhang et al. (2016) found a significant correlation between air quality and the strength of the East Asian monsoon and the interannual variability in the frequency of weather patterns. Ye et al. (2016) showed that a high frequency of low visibility events was associated with certain flow types, including high pressure to the northeast of the North China Plain, a weak low pressure band, high pressure to the southeast, and high pressure to the north.
Air quality often shows prominent day-to-day changes in Beijing, which is of great concern to the public. Given the regular source of emissions and the fixed terrain, the day-to-day changes in air quality may be attributed to changes in the meteorological conditions. Most previous studies have examined the total field of meteorological variables when analyzing the reasons for the occurrence of air pollution. However, because meteorological variables vary on different timescales, the respective roles of slow and fast changes in meteorological variables cannot be determined based on the results of these previous studies. We therefore separated the slow and fast changes in meteorological variables and focused on analyzing the relationship between pollution events and the rapid variations in meteorological conditions. This allowed us to determine the relative contributions of slow and fast variations in meteorological conditions in the occurrence of pollution events in Beijing.
You et al. (2017) analyzed the synoptic meteorologi-cal patterns affecting air pollution and their inter-seasonal variations in Beijing. However, they did not distinguish between persistent and non-persistent pollution events. By contrast, our study focused on pollution events that persisted for at least three days and aimed to compare the difference in meteorological conditions between persistent and non-persistent pollution days separately by season. Differences in the meteorological conditions and their temporal evolution between persistent and non-persistent pollution days may help to elucidate the processes that produce persistent atmospheric pollution. This would be of benefit in forecasting the states of atmospheric pollution and in making informed decisions for the mitigation of atmospheric pollution based on the meteorological conditions.
This paper is organized as follows. The data and the methods used in the study are described in Section 2. Sections 3 and 4 examine the temporal evolution of meteorological fields corresponding to persistent and non-persistent pollution days, respectively, with the purpose of understanding the differences between persistent and non-persistent pollution events. Section 4 documents and compares the local conditions between persistent and non-persistent events. A summary and discussion are provided in Section 5.
2 Data and methodsMean daily PM10 concentration data for Beijing were obtained from the Beijing Environmental Protection Bureau during the period 1 January 2008 to 25 September 2015. Daily PM10 data at 12 national air quality monitoring sites available for the period 1 January 2013 to 25 September 2015 were used to validate the pollution events. Hourly meteorological data from four of the stations used in this study—including the surface temperature, pressure, relative humidity, and wind speed—were obtained from the China Meteorological Administration (CMA). The daily mean meteorological data were calculated from the hourly meteorological data at the four observation stations. The average of the meteorological variables at the four stations was used to represent the mean meteorological state in Beijing.
The temperature profile at 0000 and 1200 UTC between January 2007 and June 2014 was obtained from a CMA radiosonde station at 39°48'N, 116°28'E. Meteorological data—including the air temperature at 2 m, 1000 hPa, and 850 hPa, mean sea-level pressure, relative humidity at 1000 hPa, zonal and meridional winds at 10 m, and geopotential height at 500 hPa—were provided 4 times per day (at 0000, 0600, 1200, and 1800 UTC) by the US NCEP–Department of Energy Reanalysis-2 dataset (Kanamitsu et al., 2002) with a horizontal resolution of 2.5° × 2.5° from January 2007 to December 2015. The daily mean values of the reanalysis variables were constructed by averaging the four values falling within a day of local time as the daily mean particulate matter concentrations. Reanalysis variables on 2.5° × 2.5° grids were used to identify the synoptic-scale meteorological conditions for air pollution events in Beijing. The features on a smaller spatial scale, which may involve effects from complex terrains, could not be resolved in this study using the reanalysis data.
This study aimed to investigate the meteorological conditions present during persistent and non-persistent pollution events separately in the four seasons. The time periods of the four seasons were defined following the method of You et al. (2017), where spring includes the days from 1 March to 31 May, summer from 1 June to 31 August, fall from 1 September to 30 November, and winter from 1 December to 28 February. The analysis was based on seven springs, summers, falls, and winters.
Most previous studies used original data to document the relationship between air pollution and meteorologi-cal variables and the interseasonal variations were not taken into account. It is likely that the relationship between air quality and meteorological variables will vary by season and will depend on the timescale. This study focused on the influence of high-frequency meteorological variations. Following the work of You et al. (2017), harmonic analysis was used to extract high-frequency meteorological variations (period < 90 days) from the observed data. The slow meteorological variations (period > 90 days) were excluded from the analy-sis. This method differs from most previous studies, which did not separate meteorological variations on different timescales.
3 Synoptic patterns of persistent pollution eventsThis section examines the regional patterns of different meteorological variables corresponding to persistent pollution days in the four seasons. Persistent pollution events were determined separately for the four seasons as follows. First, we defined the polluted day as a day when the concentration of PM10 was > 150 μg m –3 (He et al., 2014). A persistent pollution event was recorded when there were three or more consecutive pollution days. For the period 2013–15 when data from 12 stations were available, we used an alternative definition of a persistent pollution event as when the PM10 concentration reached the level of a persistent event simultaneously at more than 8 of the 12 stations. The persistent pollution events determined based on 12 air quality monitoring stations all fell into the events defined by the mean PM10 data over the last two years. Therefore the mean PM10 data were a good representation of the regional pollution conditions in Beijing. Because the temporal coverage of the 12 air quality monitoring stations was shorter than that of the mean data, we used the mean data to analyze the relationship between the meteorological conditions and air pollution.
| Number of events | Mean PM10 value (μg m–3) | |||
| 1st day | 2nd day | 3rd day | ||
| Spring | 24 | 211.36 | 273.48 | 282.49 |
| Summer | 7 | 179.55 | 199.23 | 203.18 |
| Fall | 21 | 198.08 | 261.89 | 254.60 |
| Winter | 21 | 217.19 | 256.97 | 266.60 |
Table 1 presents the number of persistent pollution events and the mean PM10 values by season. The number of events in spring, summer, fall, and winter was 24, 7, 21, and 21, respectively. The highest mean PM10 concentration was observed in spring and the lowest mean PM10 concentration was observed in summer. The lowest number of events was observed in summer, representing the lowest probability of persistent pollution events for the year.
Composite maps of the persistent pollution events were constructed for the surface air temperature, the sea-level pressure, the low-level relative humidity, and the surface winds in each of the four seasons by averaging the reconstructed high-frequency meteorological variations (referred to as anomalies to distinguish them from the original values) at each grid point. We then examined the temporal evolution of synoptic patterns in each of the four seasons, which may help us to understand the persistence of air pollution in Beijing. The composite anomalies in summer may not be as robust as in the other seasons because there were only seven pollution days during the period of analysis.
The synoptic patterns appeared to be fairly stable for persistent pollution events in spring. A higher surface air temperature was maintained over most of eastern China (Figs. 1a–c). A large region of temperature anomaly was located north of Beijing. Anomalous low sea-level pressure was observed north of Beijing during the pollution events (Figs. 1d–f). This was accompanied by an anomalous cyclone, the center of which was located south of Lake Baikal on the first polluted day, over Mongolia on the second polluted day, and north of Beijing on the third polluted day. During the first two days, the region around Beijing was under the continuous influence of anomalous southwesterly winds, but the anomalous winds weakened on the third day. Anomalous southwesterly winds controlled southeast China during the pollution events, which transported warmer and wetter air from lower latitudes, leading to higher surface air temperatures (Figs. 1a–c). The effect of an increase in temperature appeared to overcome the increase in specific humidity, leading to a decrease in relative humidity (Figs. 1g–i). The North China Plain was in a region with southerly winds or relatively weak winds and lower level anomalous convergence, which provided favorable conditions for the persistence of pollution.

|
| Figure 1 Composite anomalies of (a–c) surface temperature (K), (d–f) sea-level pressure (shading; hPa) and winds at 10 m (vector with scale at top-right corner; m s–1), and (g–i) relative humidity (%) during persistent pollution events in spring. Polluted_1, Polluted_2, and Polluted_3 refer to the first, second, and third day, respectively. The dotted region shows where the composite anomalies are significant at the 95% confidence level according to the one-tailed Student’s t-test. Only winds that are significant at the 95% confidence level are plotted. |
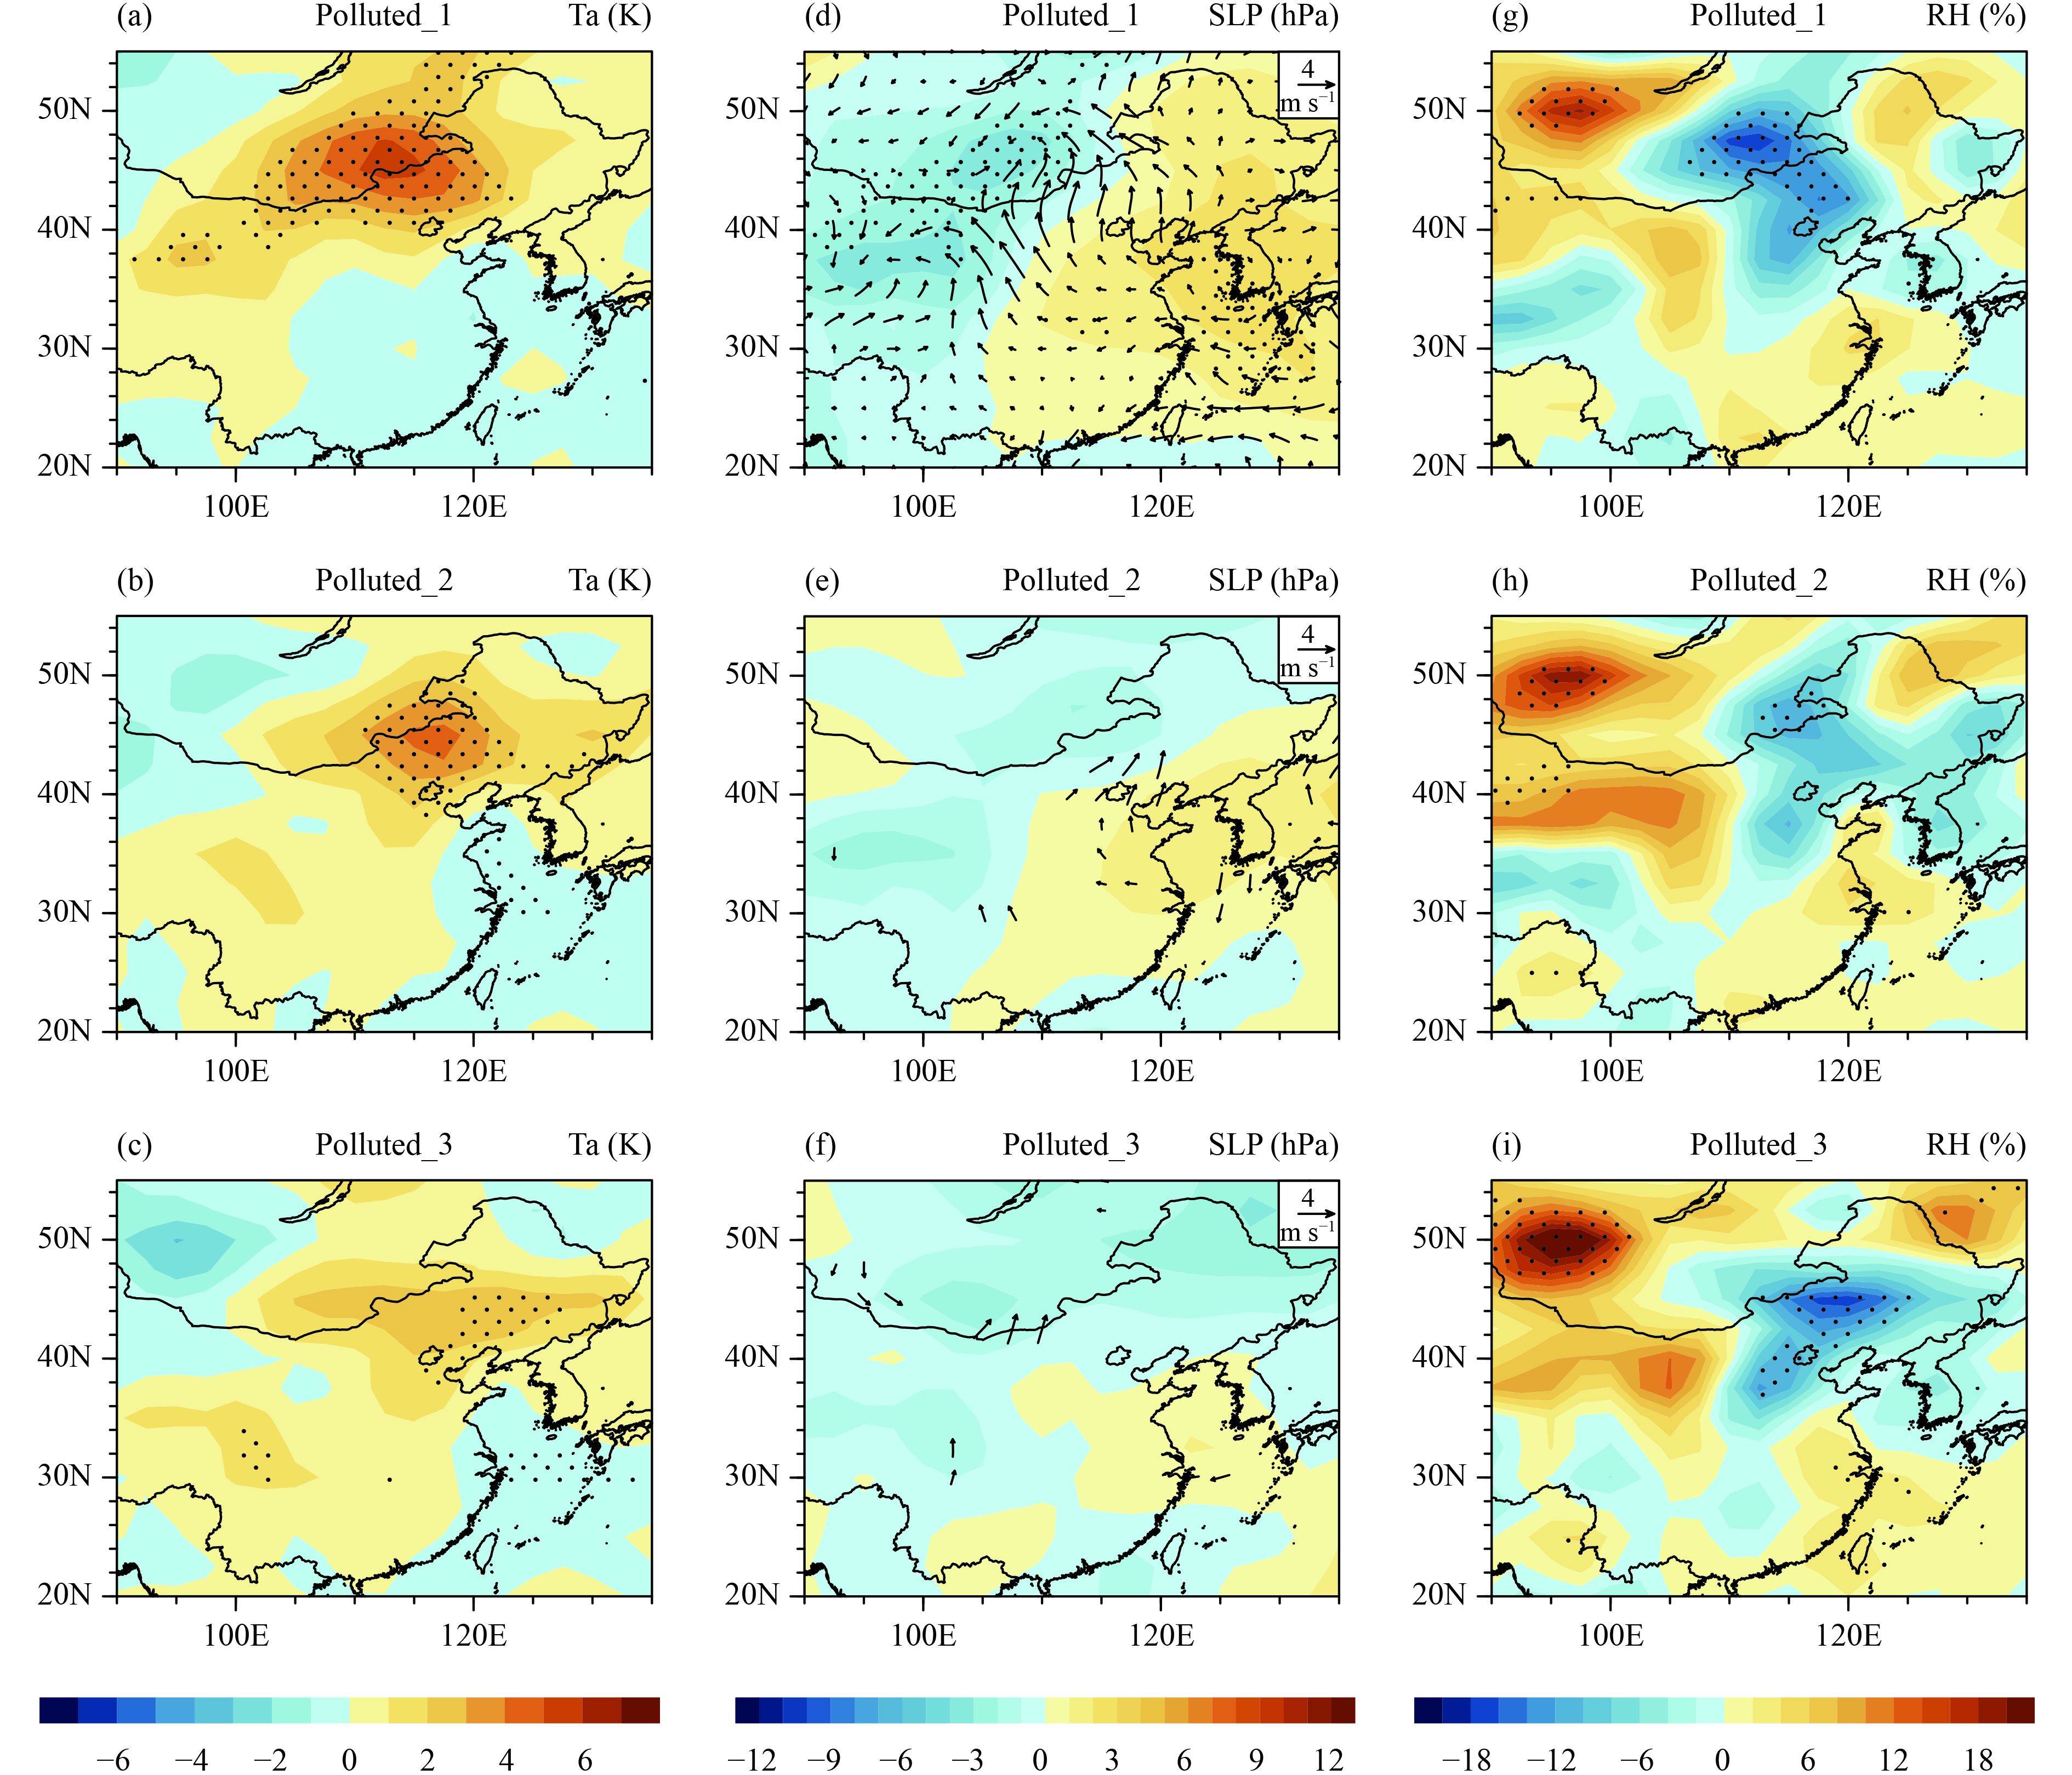
For the persistent pollution events in summer, a higher surface air temperature was recorded in Mongolia on the first polluted day (Fig. 2a). This higher temperature region moved slowly southwestward over time, reaching north of Beijing on the third polluted day (Figs. 2b, c). The distribution of anomalous sea-level pressure featured a northwest–southeast contrast, with lower pressure lying northwest and higher pressure southeast of Beijing (Figs. 2d–f). A similar pattern of anomalous pressure on pollution days has been reported previously by You et al. (2017). The associated southerly winds transported warmer air from the south, contributing to a higher surface air temperature (Chen et al., 2008; Wang et al., 2010). Under the influence of southerly winds, pollution particles south of Beijing were easily transported to Beijing, which favored persistent pollution events over Beijing. The lower relative humidity concurred with the higher surface air temperature during this period (Figs. 2g–i). It was obvious that the movement of the anomalous synoptic patterns was slow. The slow movement of synoptic patterns provided favorable conditions for the persistence of air pollution over Beijing. The composite features were relatively weak in summer due to the limited number of days with pollution.
|
| Figure 2 As in Fig. 1, but in summer. |
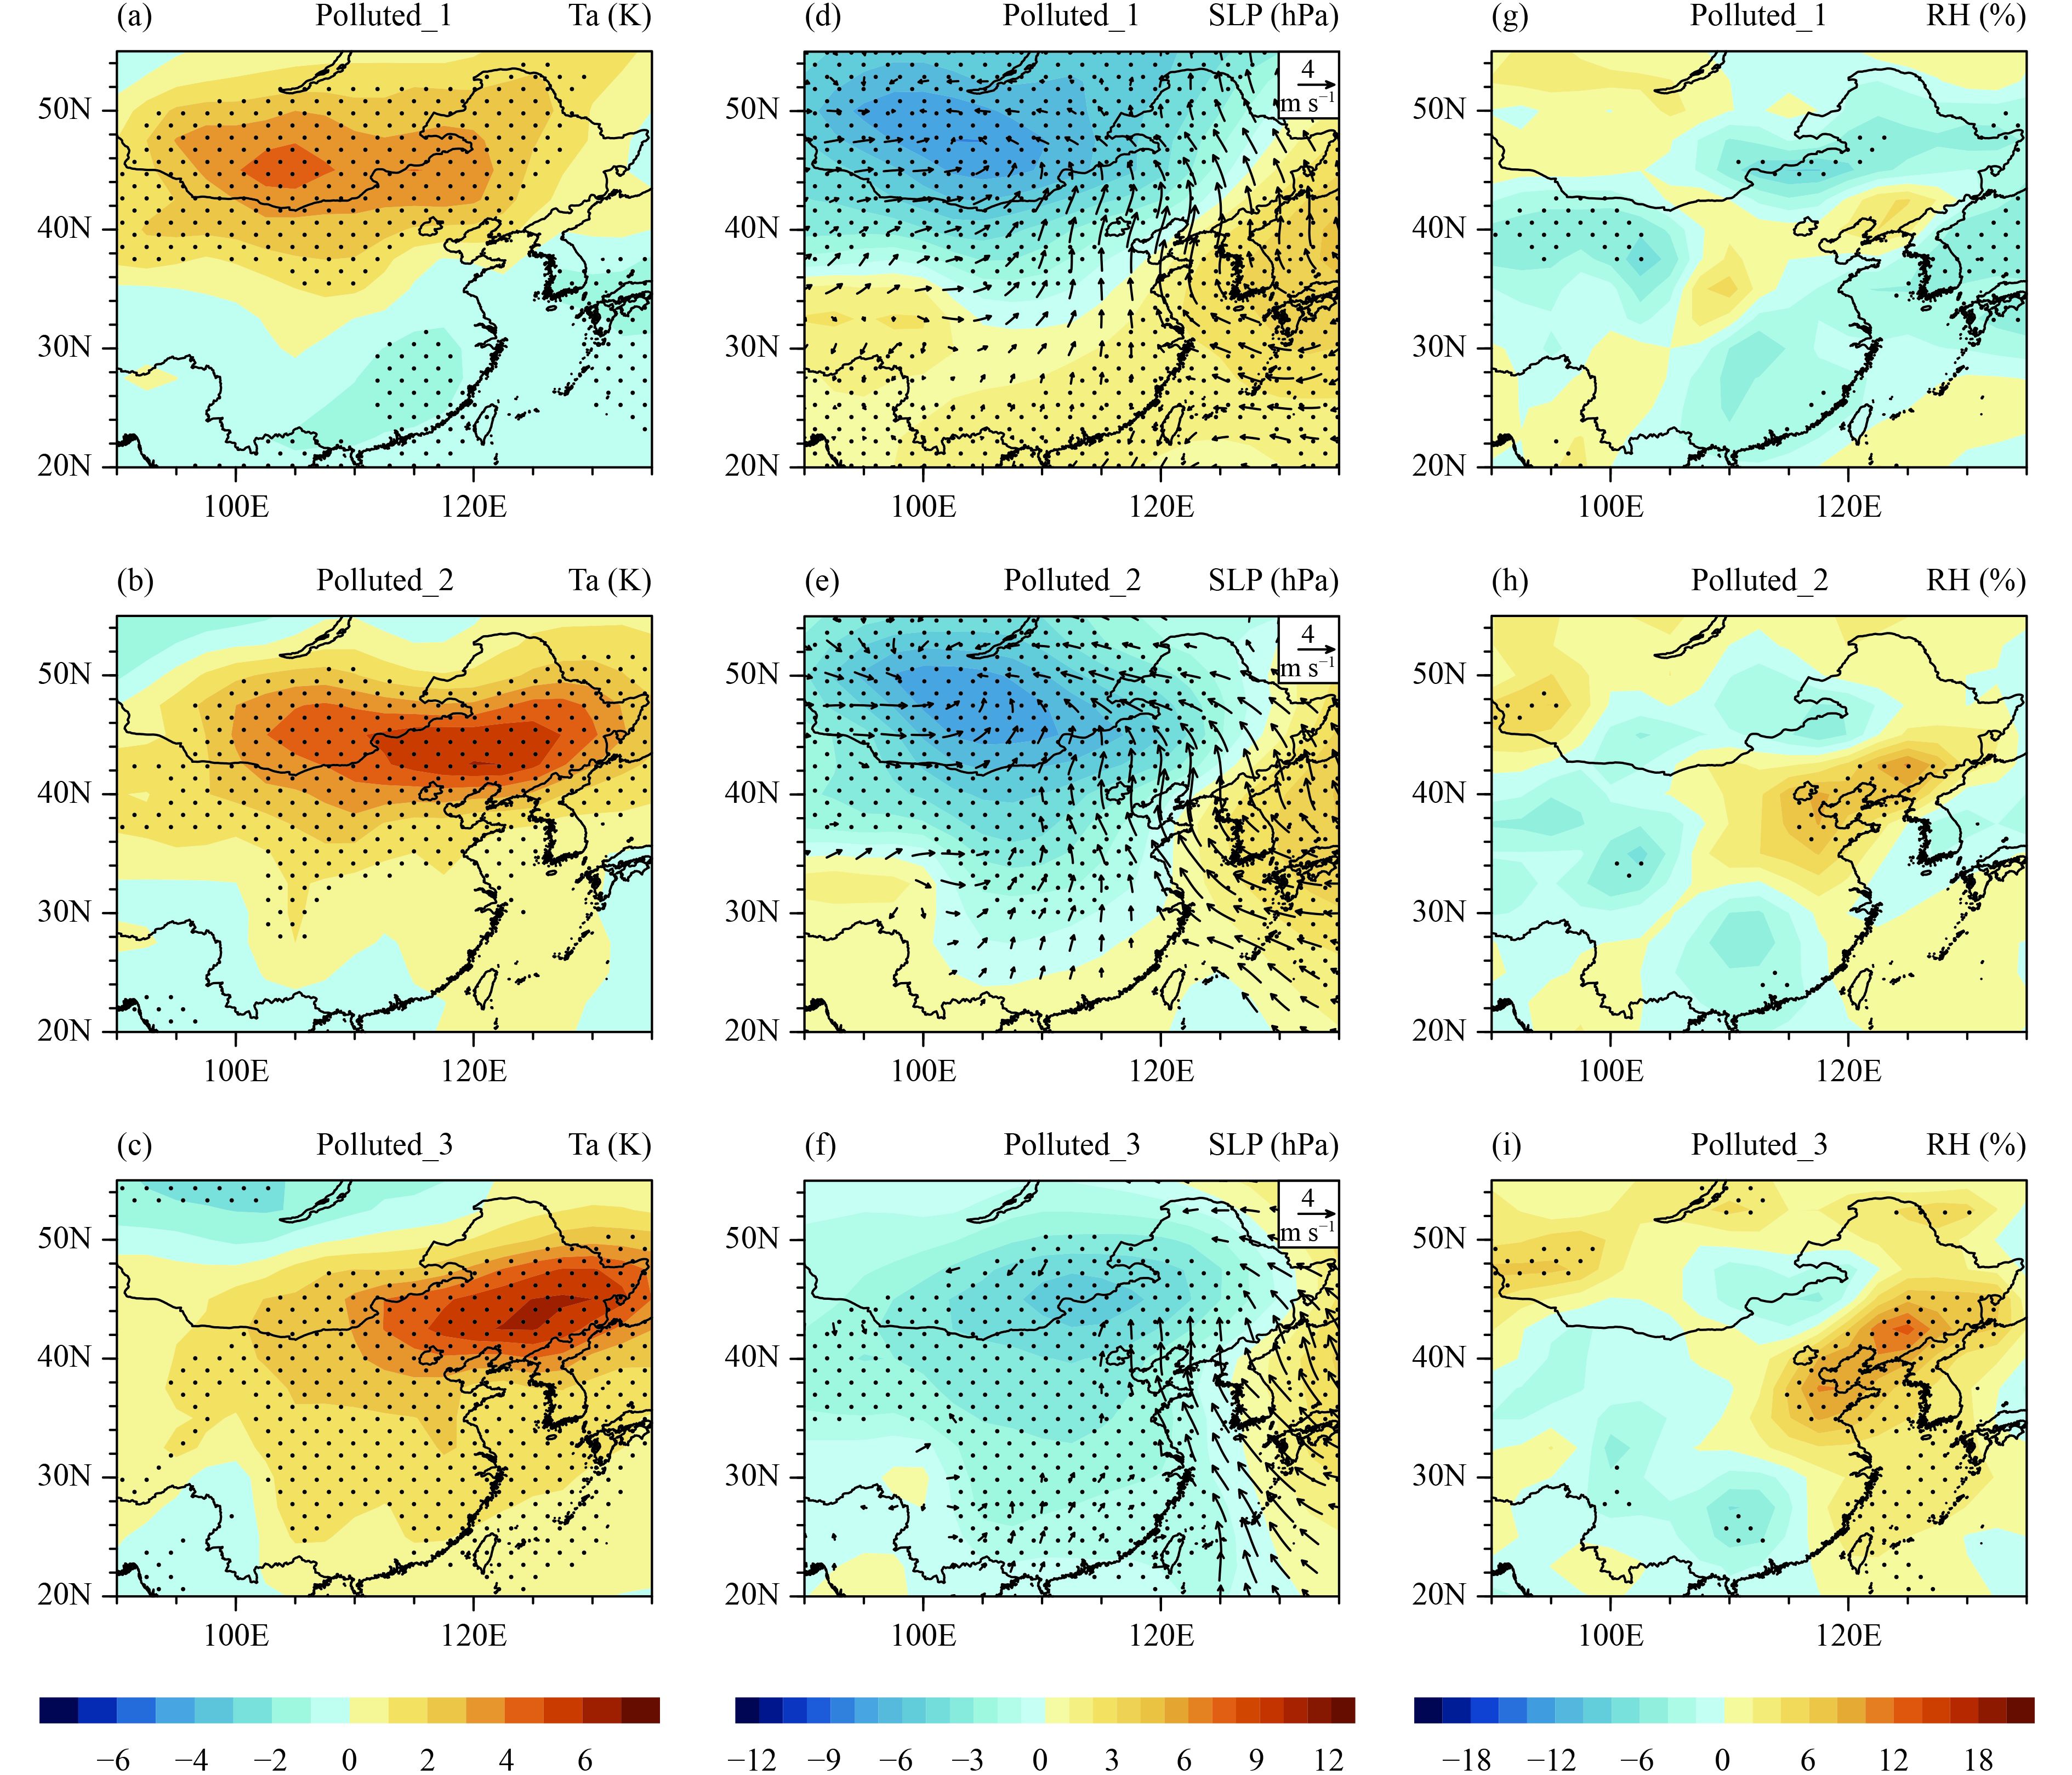
For persistent pollution events in fall, a zonal band of higher surface air temperature with a slow increase in magnitude was maintained north of Beijing (Figs. 3a–c). A region of anomalously low sea-level pressure was observed over Mongolia with the center moving slowly southeastward (Figs. 3d–f). Anomalous southerly winds therefore controlled most of eastern China, which accounted for the higher surface air temperature in the north. A band of high relative humidity covered the region southeast of Beijing (Figs. 3g–i), which may be attributed to the anomalous southerly winds bringing wetter air from lower latitudes. The North China Plain overall was under the influence of a higher air temperature, higher relative humidity, and anomalous southerly winds during this time period. These synoptic patterns facilitated the transport to, and storage of, pollutants near Beijing.
|
| Figure 3 As in Fig. 1, but in fall. |
For persistent pollution events in winter, a large region of higher surface air temperature moved eastward over the midlatitudes (Figs. 4a–c). During this process, a higher temperature was maintained over Beijing. An anomalous low sea-level pressure moved southeastward, with the center located southwest of Lake Baikal on the first day, over Mongolia on the second day, and over North China on the third day (Figs. 4d–f). The North China Plain was under the influence of large anomalous southerly winds on the first two days and the anomalous winds weakened on the third day. Positive relative humidity anomalies controlled the region around Beijing, with their magnitude increasing during the pollution events (Figs. 4g–i). The higher relative humidity and higher temperatures were attributed to anomalous southerly winds that brought warmer and wetter air from the south. The temperature, pressure, and wind patterns displayed clearer movement over time in winter than in the fall. However, the North China Plain was still under the influence of anomalous southerly winds, higher temperatures, and higher relative humidity in the winter, as in the fall, conditions that provided favorable conditions for the persistence of pollution.

|
| Figure 4 As in Fig. 1, but in winter. |
A higher surface air temperature was observed during the persistent pollution events in all four seasons, with the center located to the north of Beijing. Another common feature was that Beijing was under the influence of anomalous southerly winds. The regional synoptic patterns experienced relatively small changes during the pollution events in all four seasons, which was associated with the slow movement of the synoptic patterns. However, some notable differences were seen among the four seasons. An anomalous negative pressure covered the region around Beijing in the spring, fall, and winter, whereas a northwest low pressure–southeast high pressure pattern was observed in summer. The relative humidity in Beijing was lower in spring and summer, but higher in fall and winter, consistent with the results of You et al. (2017).
4 Synoptic patterns for non-persistent pollution eventsThis section examines the regional patterns of different meteorological variables corresponding to non-persistent pollution days in the four seasons. After identifying a pollution day based on the method described in the preceding section, we examined the PM10 value in the two days after the pollution day. The day with the PM10 value < 50 μg m –3 in an individual season was identified as a clean day in that season. When two consecutive clean days were detected after the polluted day, a non-persistent pollutant event was recorded.
Table 2 shows the number of identified non-persistent pollution events and the corresponding mean PM10 values in the four seasons. There were 3, 5, 8, and 11 non-persistent pollution events in spring, summer, fall, and winter, respectively. The mean PM10 concentration varied from 26 to 43 μg m–3 on the clean days in the four seasons. As for the persistent pollution events, composite maps of the meteorological variables were constructed for non-persistent pollution events in the four seasons by averaging the reconstructed variations with periods < 90 days. The number of events was small, particularly in spring and summer. Thus the features based on the composite map may not be as robust as those for the persistent pollution events.
| Number of events | Mean PM10 value (μg m–3) | |||
| 1st day | 2nd day | 3rd day | ||
| Spring | 3 | 284.95 | 33.45 | 42.99 |
| Summer | 5 | 210.46 | 26.18 | 32.05 |
| Fall | 8 | 197.39 | 31.85 | 30.10 |
| Winter | 11 | 204.25 | 28.94 | 28.79 |
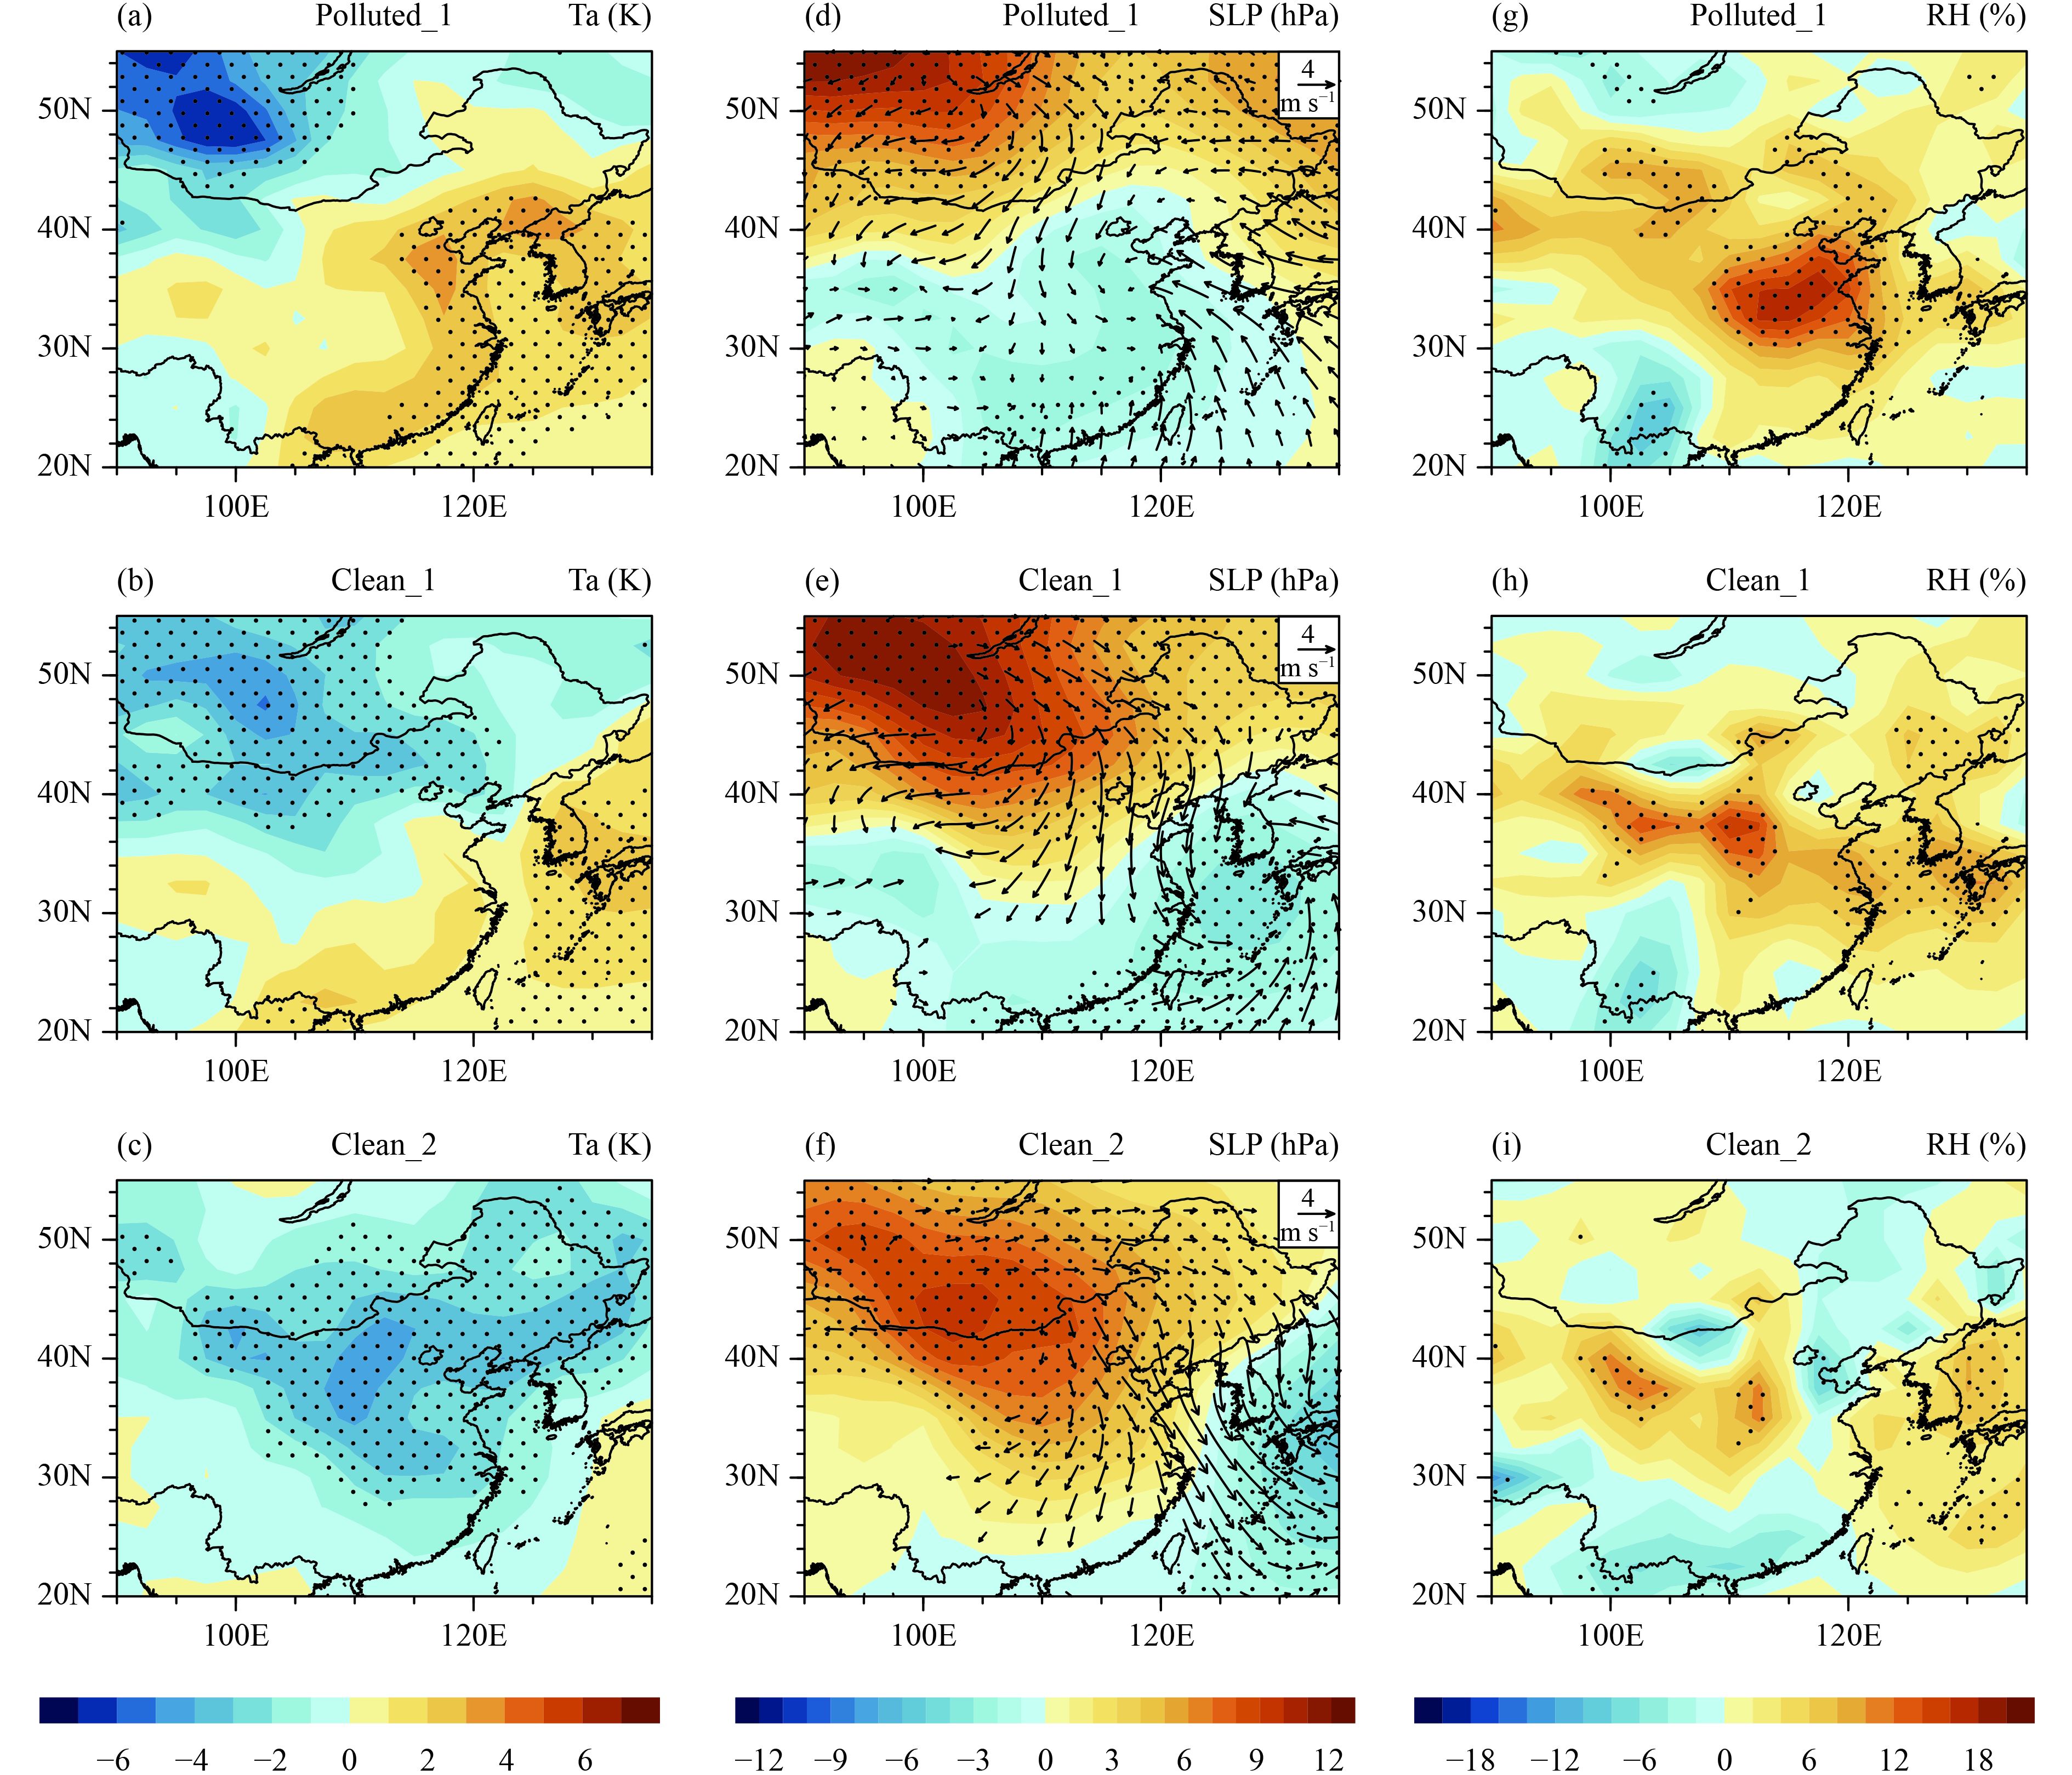
The regional meteorological patterns corresponding to the non-persistent pollution events in spring showed pronounced changes during the events. The surface air temperature around Beijing changed from positive to negative anomalies following the eastward movement of large regions of temperature anomaly along the midlatitudes (Figs. 5a–c). The North China Plain was dominated by an anomalous low pressure on the polluted day, accompanied by anomalous cyclonic winds with a convergence centered southwest of Beijing (Fig. 5d). On the following two days, the anomalous low and the cyclone moved southeastward quickly and Beijing was influenced by large anomalous northerly winds (Figs. 5e, f). On the pollution day, two large regions of positive relative humidity were observed, one lying on the border of Mongolia and the other over central China (Fig. 5g). The latter was associated with an anomalous lower level convergence of moisture. The northern region remained stationary, whereas the southern region moved quickly eastward, following the movement of the anomalous cyclone, and was replaced by a larger region of negative relative humidity in the following two days (Figs. 5h, i). Thus Beijing experienced a dramatic change from higher temperatures, lower pressures, and an anomalous cyclone to lower temperatures and anomalous northerly winds. The relative humidity near Beijing did not show a large change, however. It appears that the large region of anomalous northerly winds plays an important part in cleaning the air.

|
| Figure 5 Composite anomalies of (a–c) surface temperature (K), (d–f) sea-level pressure (shading; hPa) and wind at 10 m (vector with scale at top-right corner; m s–1), and (g–i) relative humidity (%) during non-persistent pollution events in spring. Polluted_1, Clean_1, and Clean_2 refer to the polluted day and the first and second clean day, respectively. The dotted region shows where the composite anomalies are significant at the 95% confidence level according to the one-tailed Student’s t-test. Only winds that are significant at the 95% confidence level are plotted. |
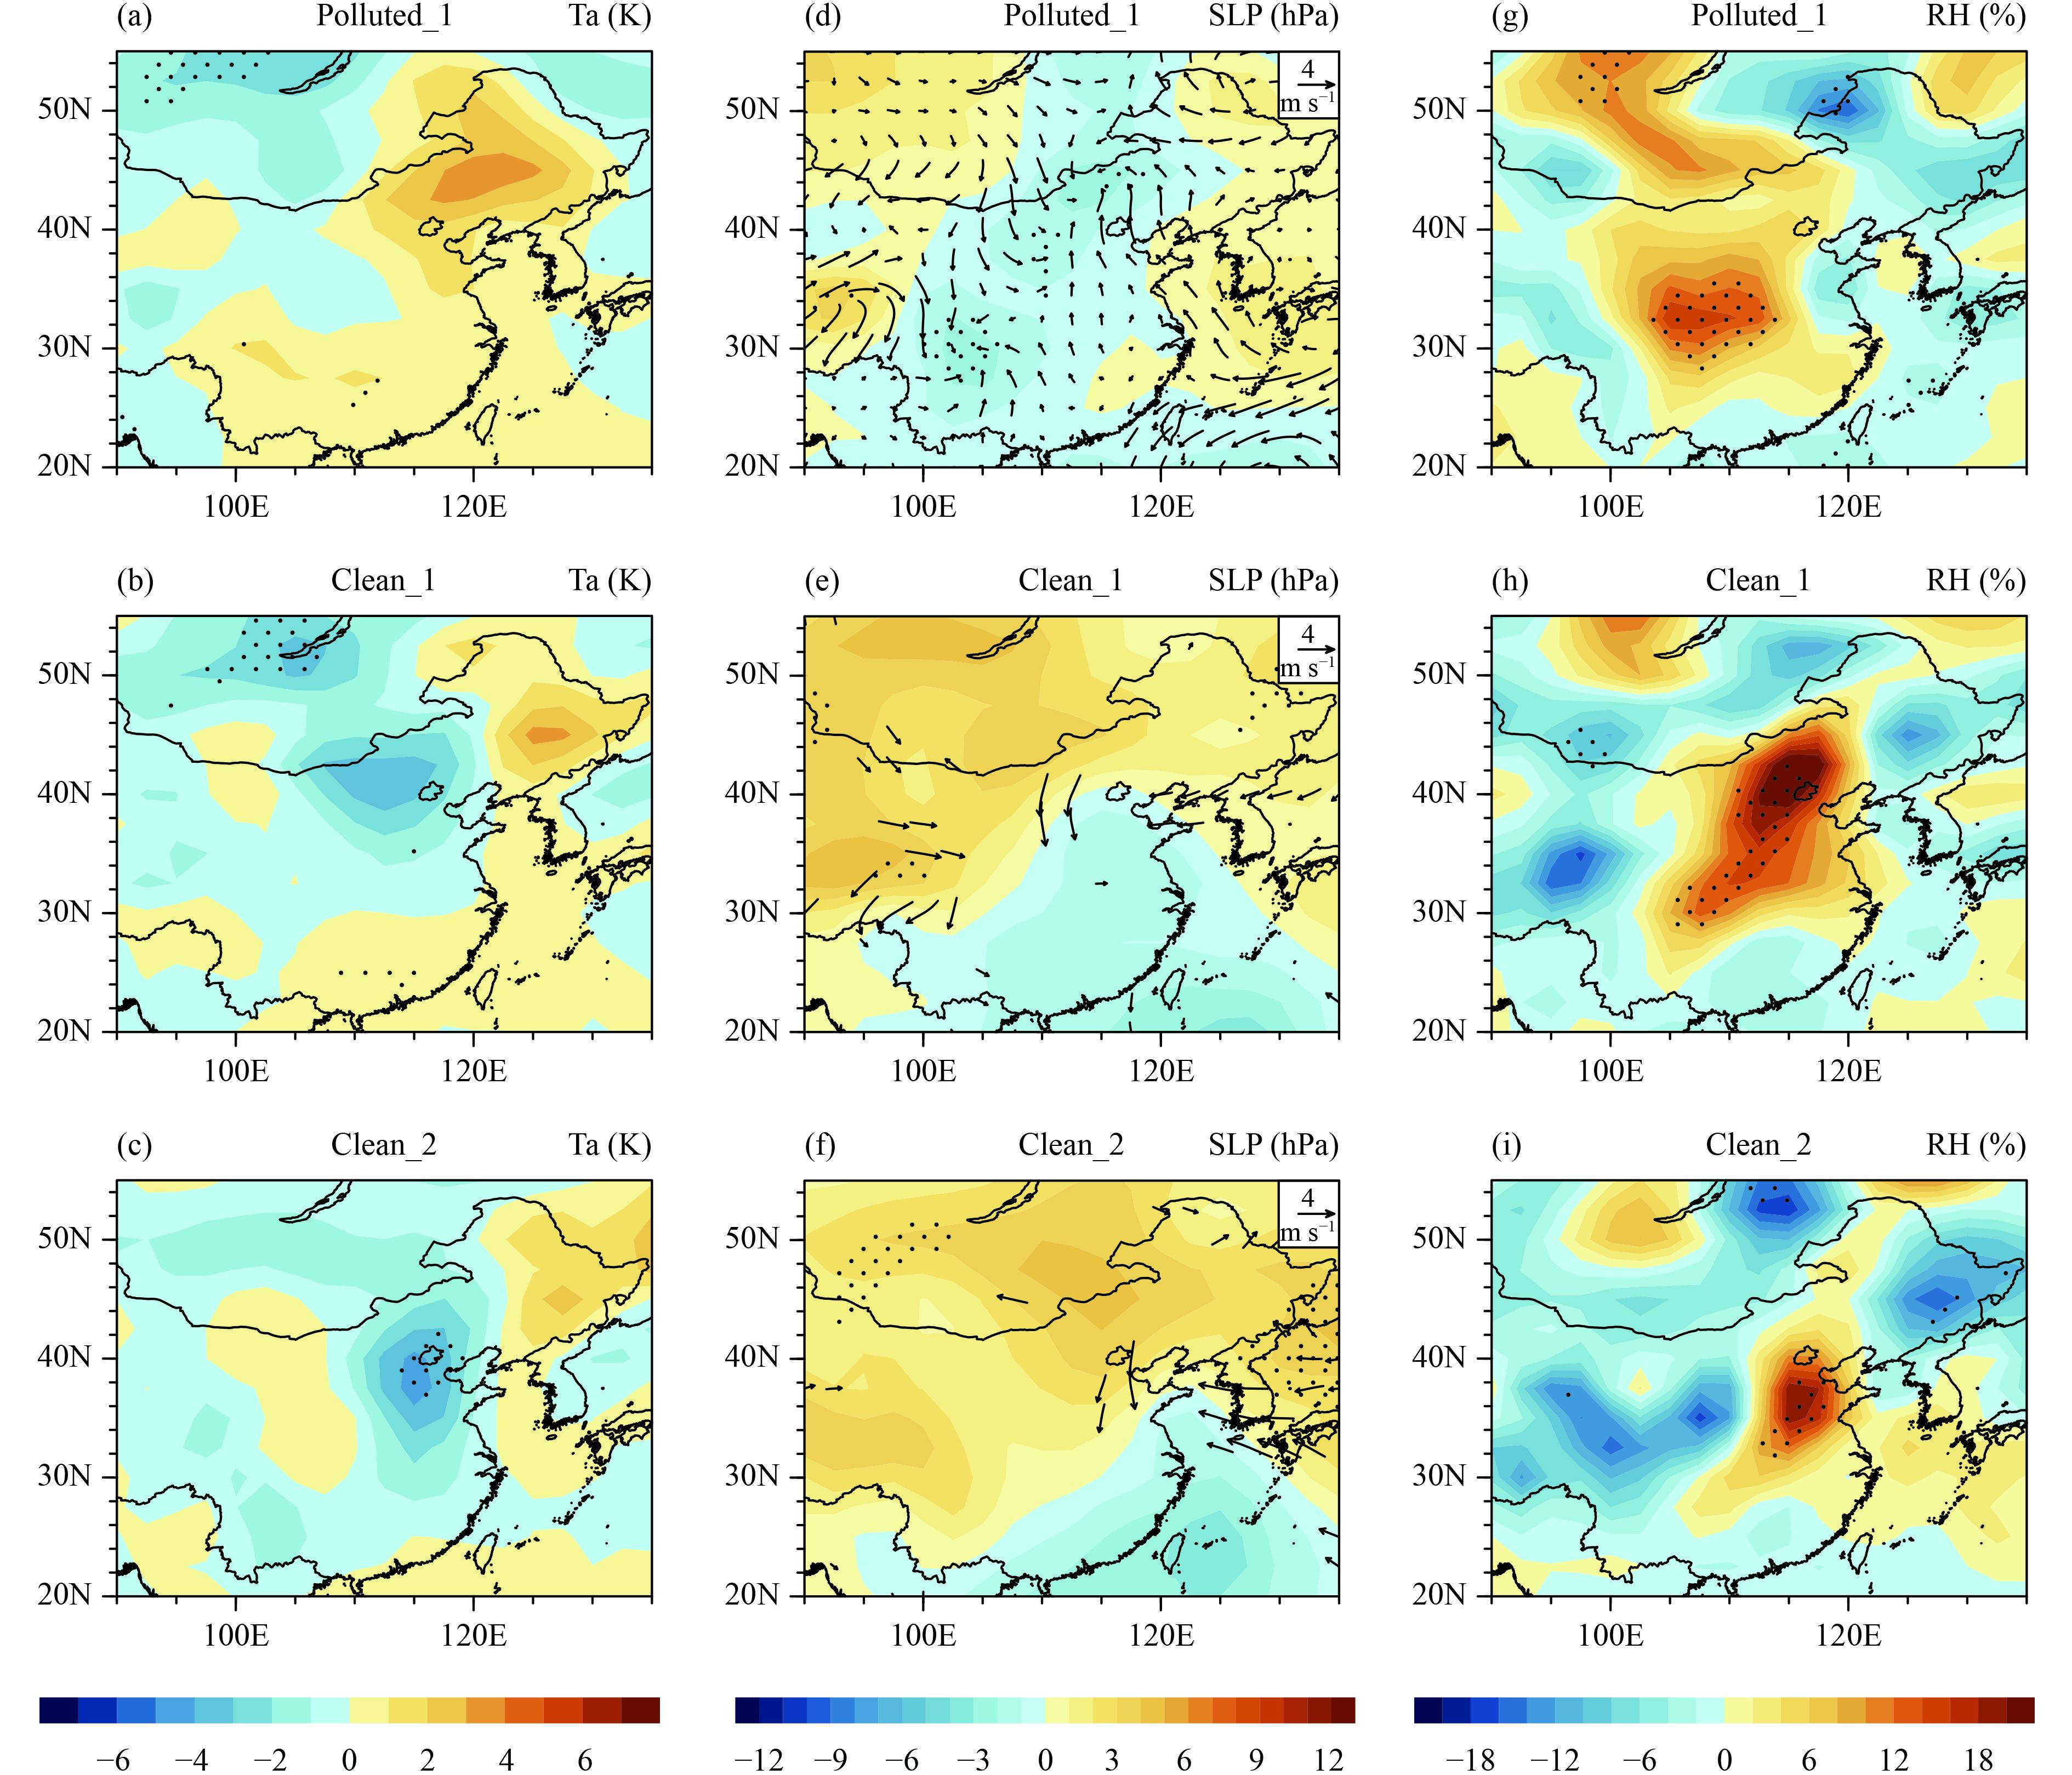
The surface air temperature anomalies around Beijing switched from positive to negative corresponding to the non-persistent pollution events in summer (Figs. 6a–c). An anomalous low and associated anomalous southerly wind controlled the North China Plain on the polluted day (Fig. 6d), which was favorable for the transportation of air pollutants from regions south of Beijing where more emissions were located. With the southeastward movement of the anomalous low and the cyclone, anomalous northerly winds dominated the region surrounding Beijing on the following two days (Figs. 6e, f). The relative humidity anomalies were small near Beijing on the pollution day (Fig. 6g). This was replaced by very large positive anomalies in the relative humidity (Fig. 6h), which may be due to the anomalous convergence of moisture at lower levels (Fig. 6e). This indicated that the cleaning of the air was a result of precipitation quickly washing out particles of pollution. The anomalies in relative humidity weakened on the following day (Fig. 6i). The distribution of the pressure anomaly featured a northwest high–southeast low pattern on the second clean day. This pattern was typical of clean days in summer (You et al., 2017). The composite anomalies were generally weak in relation to the small number of events.
|
| Figure 6 As in Fig. 5, but in summer. |
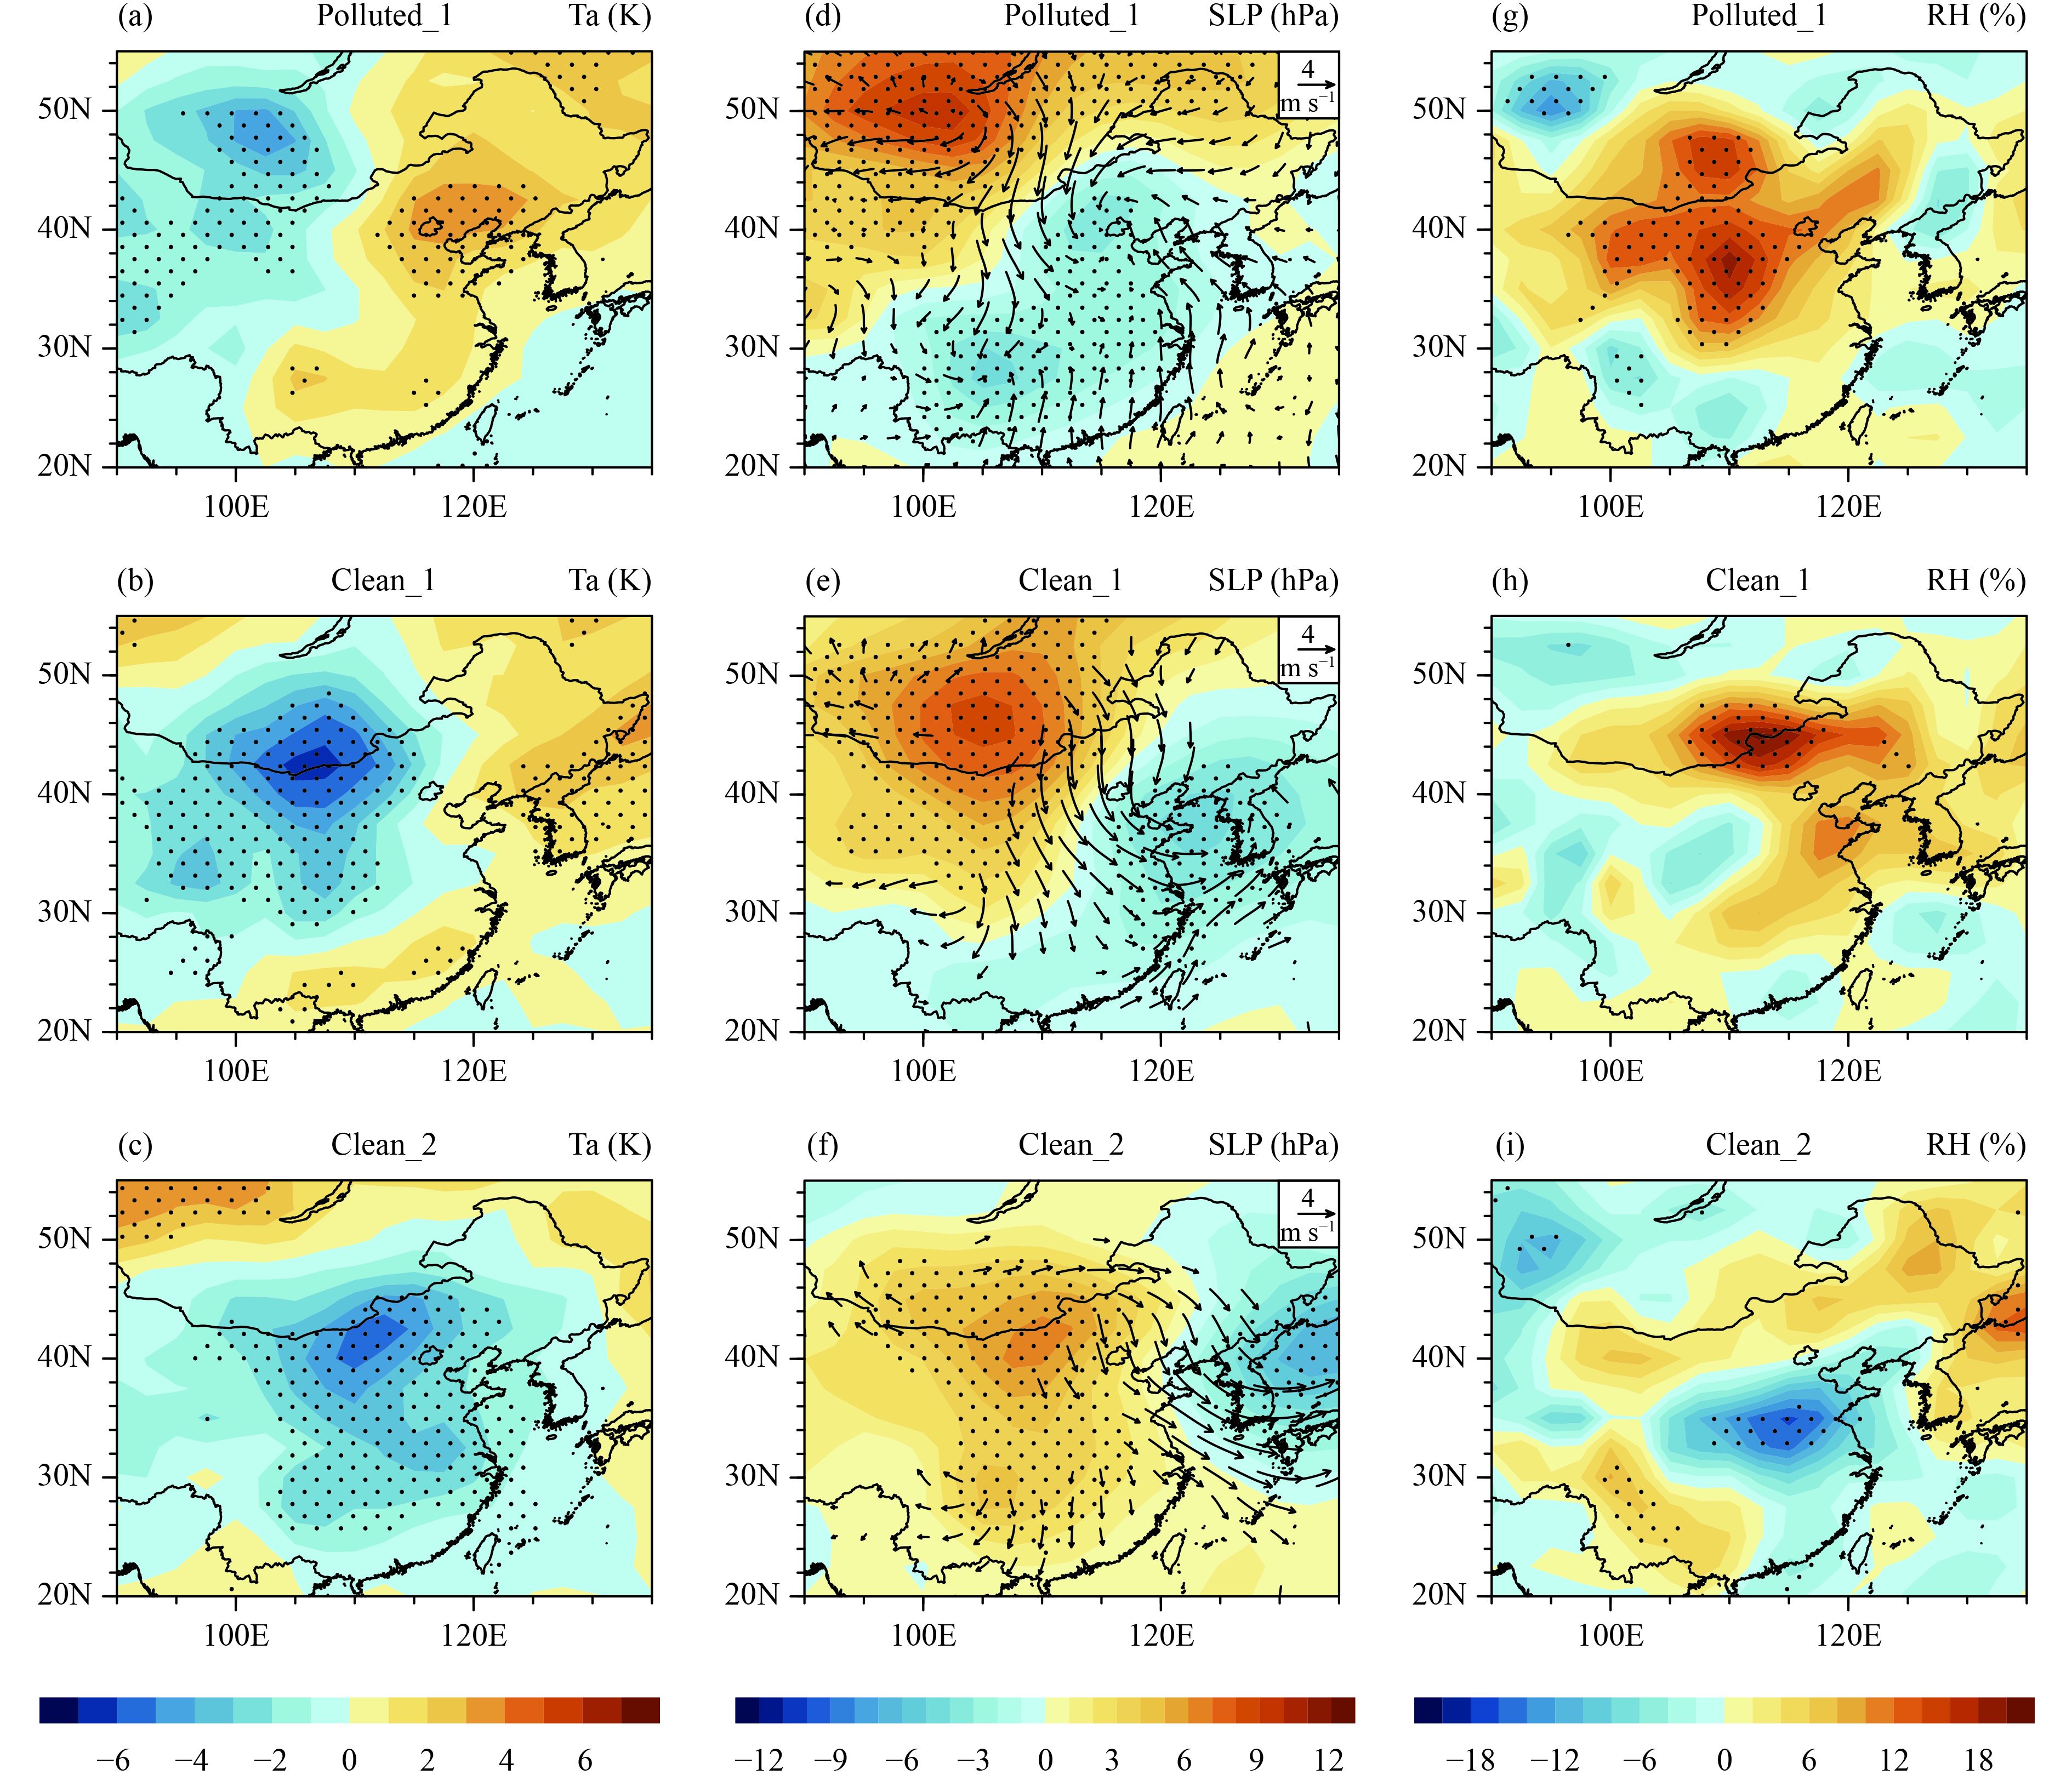
Pronounced changes were observed in temperature, pressure, and wind patterns corresponding to the non-persistent pollution events in fall. On the pollution day, Beijing and the surrounding regions were under the influence of higher temperatures (Fig. 7a) and lower pressures and the anomalous convergence of winds (Fig. 7d), which was favorable for the accumulation of pollutants. There were positive anomalies in relative humidity around Beijing (Fig. 7g). On the following clean days, Beijing was characterized by lower temperatures (Figs. 7b, c), higher pressure, and anomalous northerly winds (Figs. 7e, f). Such changes were associated with the quick southeastward movement of negative temperature anomalies and an anomalous anticyclone from southwest of Lake Baikal. The change in temperature may be explained by anomalous northerly winds carrying colder air from higher latitudes. However, the anomalies in relative humidity decreased in magnitude (Figs. 7h, i). The changes in wind after the rapid movement of the synoptic patterns appeared to be a major reason for the dispersion of pollutants.
|
| Figure 7 As in Fig. 5, but in fall. |
The changes in the meteorological patterns corresponding to non-persistent pollution events in winter were mostly similar to those in the fall. A switch in the temperature anomalies from positive to negative (Figs. 8a–c) and the replacement of lower pressure and the anomalous cyclone by high pressure and anomalous northerly winds (Figs. 8d–f) were observed around Beijing. The relative humidity anomalies were small around Beijing on clean days in winter (Figs. 8g–i). Another difference was that the movement of the synoptic pattern was faster in winter than in the fall.
|
| Figure 8 As in Fig. 5, but in winter. |
The switch from polluted to clean air was associated with rapid changes in the meteorological conditions. The temperature anomaly was positive on the polluted day and changed to negative on the clean days. The sea-level pressure was lower on the polluted day, but it became higher on the clean days, except in summer. An anomalous convergence of lower level winds was observed on the polluted day, which favored the accumulation of pollutants. Anomalous northerly winds were observed on clean days, which was beneficial for the dispersion of air pollutants. These large changes in local meteorological variables were associated with the rapid movement of synoptic patterns, which was distinct from the days with persistent pollution. The distinction between persistent and non-persistent pollution events will be discussed further in Section 5.
5 Difference in local conditions between persistent and non-persistent pollution eventsThe previous two sections analyzed the synoptic patterns corresponding to persistent and non-persistent pollution events in Beijing and identified prominent differences between the two types of event. The synoptic patterns tended to move slowly during persistent pollution events, leading to stagnant weather patterns favorable for persistent air pollution (Ye et al., 2016; Zhang et al., 2016). By contrast, the rapid movement of synoptic patterns during non-persistent pollution events led to a prominent change in the meteorological conditions from those favorable for the accumulation of air pollutants to those favorable for their dispersion, meaning that the pollution status could not be sustained. This section considers the temporal evolution of local meteorological conditions under persistent and non-persistent pollution events during different seasons.
First, we compare the changes in surface temperature, pressure, relative humidity, and wind speed. Area-mean anomalies of these four variables were constructed based on the average of observations from the four meteorological stations for the two types of event in each season (Tables 1 and 2). A composite anomaly was constructed from five days before to five days after the first day of these events.
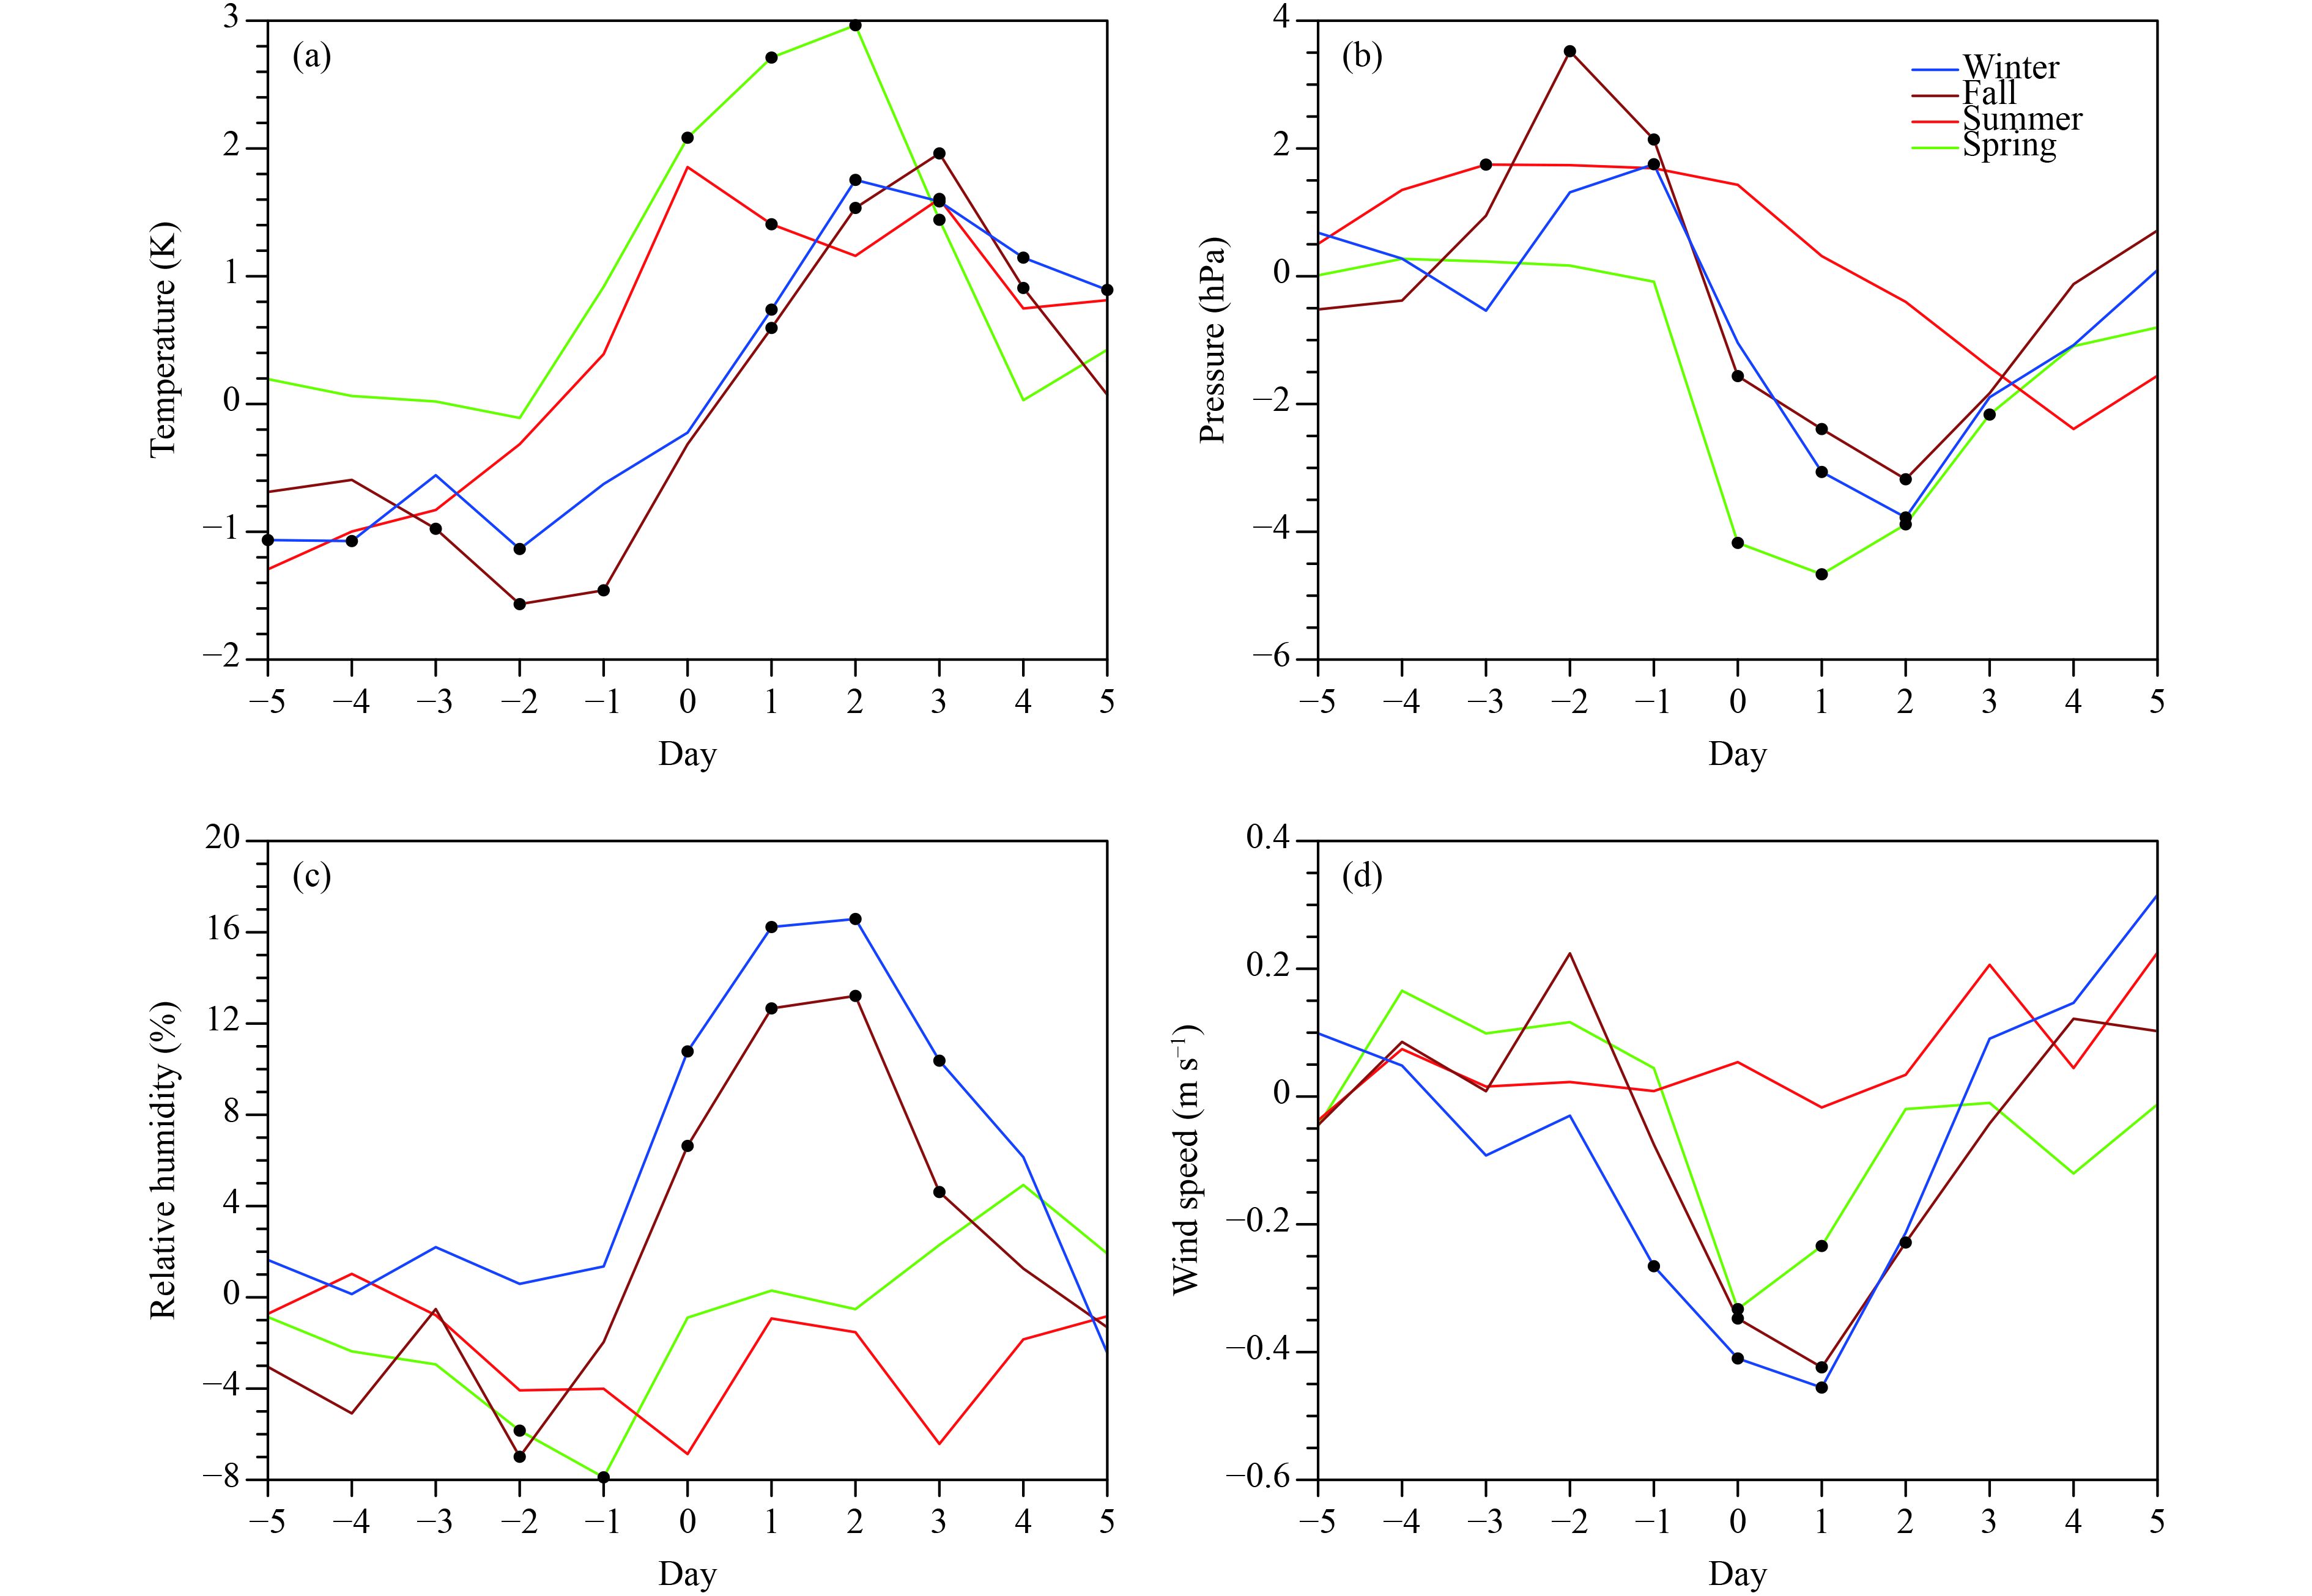
The surface air temperature increased before and during persistent pollution events, with significant anomalies in all four seasons (Fig. 9a). The increase in temperature was earlier in spring and summer than in fall and winter and the temperature anomalies in spring were larger than those in the other three seasons. The temperature anomalies decreased rapidly after the end of the persistent event. The pressure anomalies remained negative and significant during the air pollution event and recovered quickly after the end of the persistent events in spring, fall and winter (Fig. 9b). The pressure anomalies switched in summer. The temporal variations in the observed pressure anomalies agreed with the evolution of pressure patterns based on the reanalysis dataset. During the persistent pollution events, the relative humidity anomalies were weakly negative in spring and summer, but large, positive, and significant in fall and winter (Fig. 9c). This is also consistent with the reanalysis dataset. The surface wind speed weakened significantly during the events and then recovered in the spring, fall, and winter (Fig. 9d). The wind speed anomalies were small in summer. These changes in wind speed were in agreement with the relation of the anomalous winds to the climatological mean wind direction in the reanalysis dataset.
|
| Figure 9 Temporal evolutions of (a) surface temperature, (b) pressure, (c) relative humidity, and (d) wind speed anomalies from five days before to five days after the first day (denoted as day 0) during persistent pollution events in different seasons in Beijing. The marked points show composite anomalies significant at the 95% confidence level according to the one-tailed Student’s t-test. |
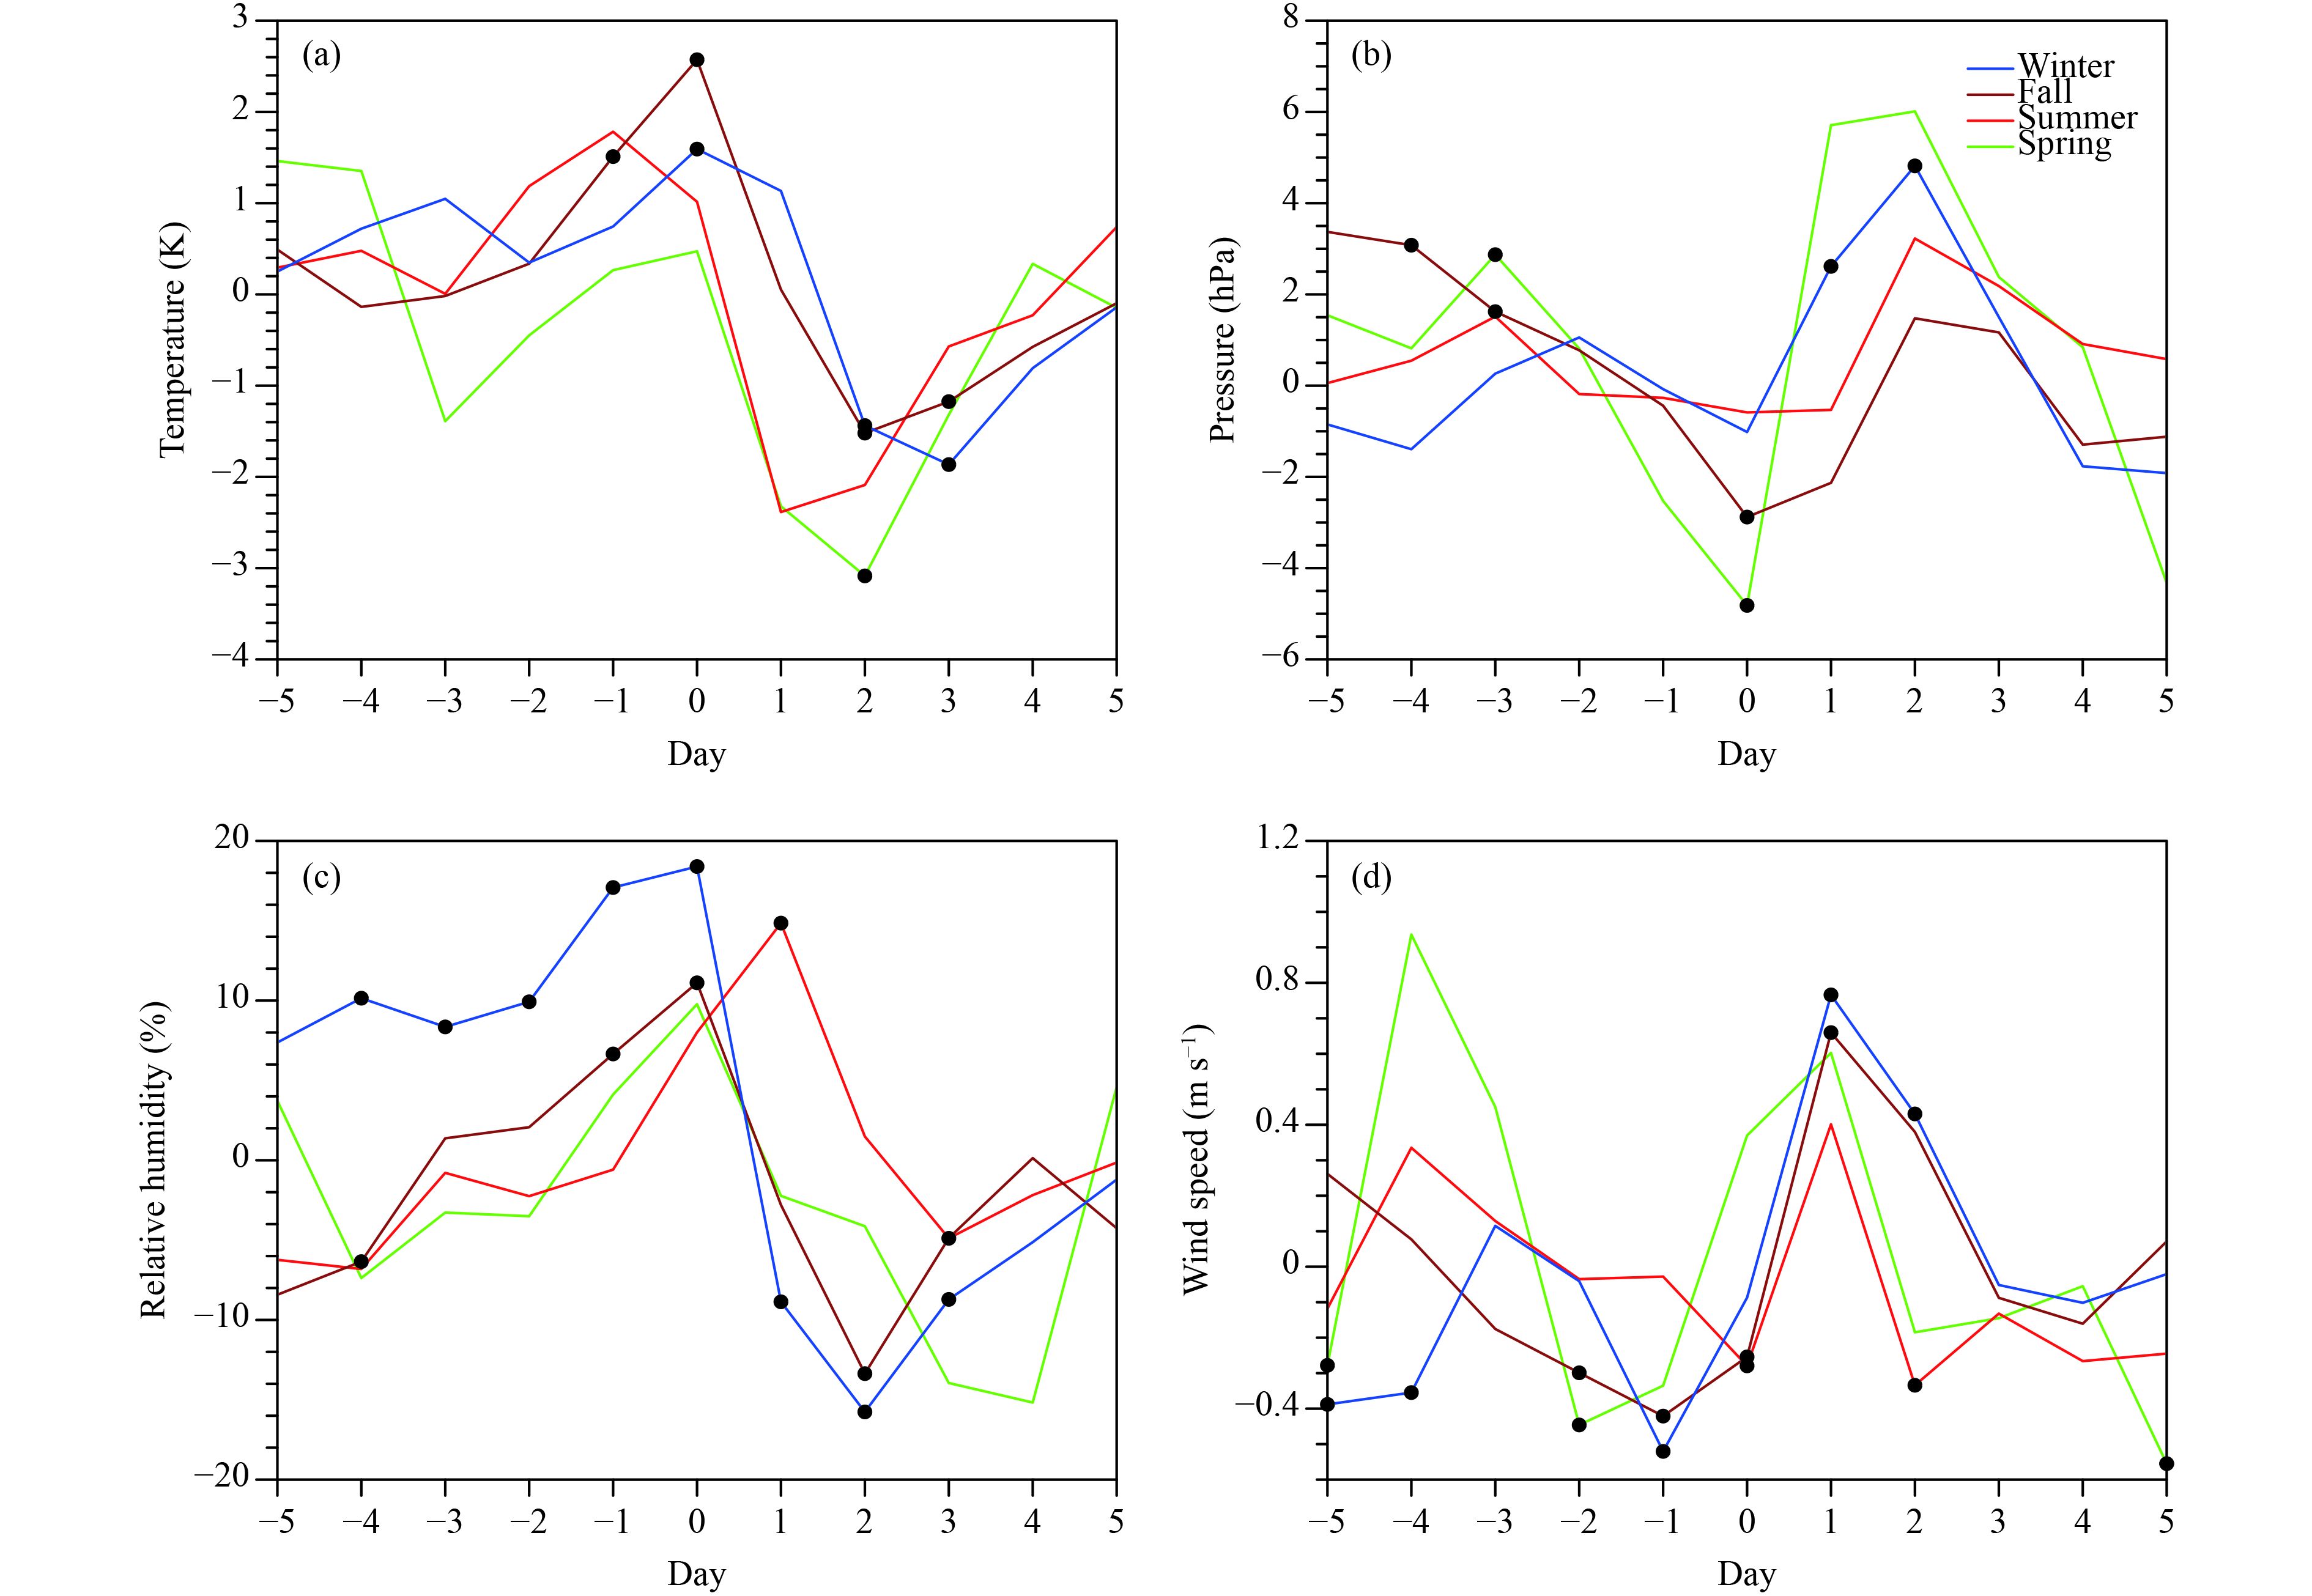
All four variables showed a large change from the polluted day to the clean day in the non-persistent pollution events. The surface temperature decreased rapidly after the polluted day in all four seasons, with large negative temperature anomalies at day 2 (Fig. 10a). The surface pressure changed from negative to positive anomalies (Fig. 10b) with the smallest change in summer. The relative humidity began to decrease after the polluted day in spring, fall, and winter (Fig. 10c). The decrease in relative humidity in summer was later than in the other three seasons. The relative humidity anomalies were more significant in fall and winter. The surface wind speed increased from the polluted day to the clean day in all four seasons (Fig. 10d) and the wind speed anomalies were more significant in fall and winter.
|
| Figure 10 As in Fig. 9, but during non-persistent pollution events. |
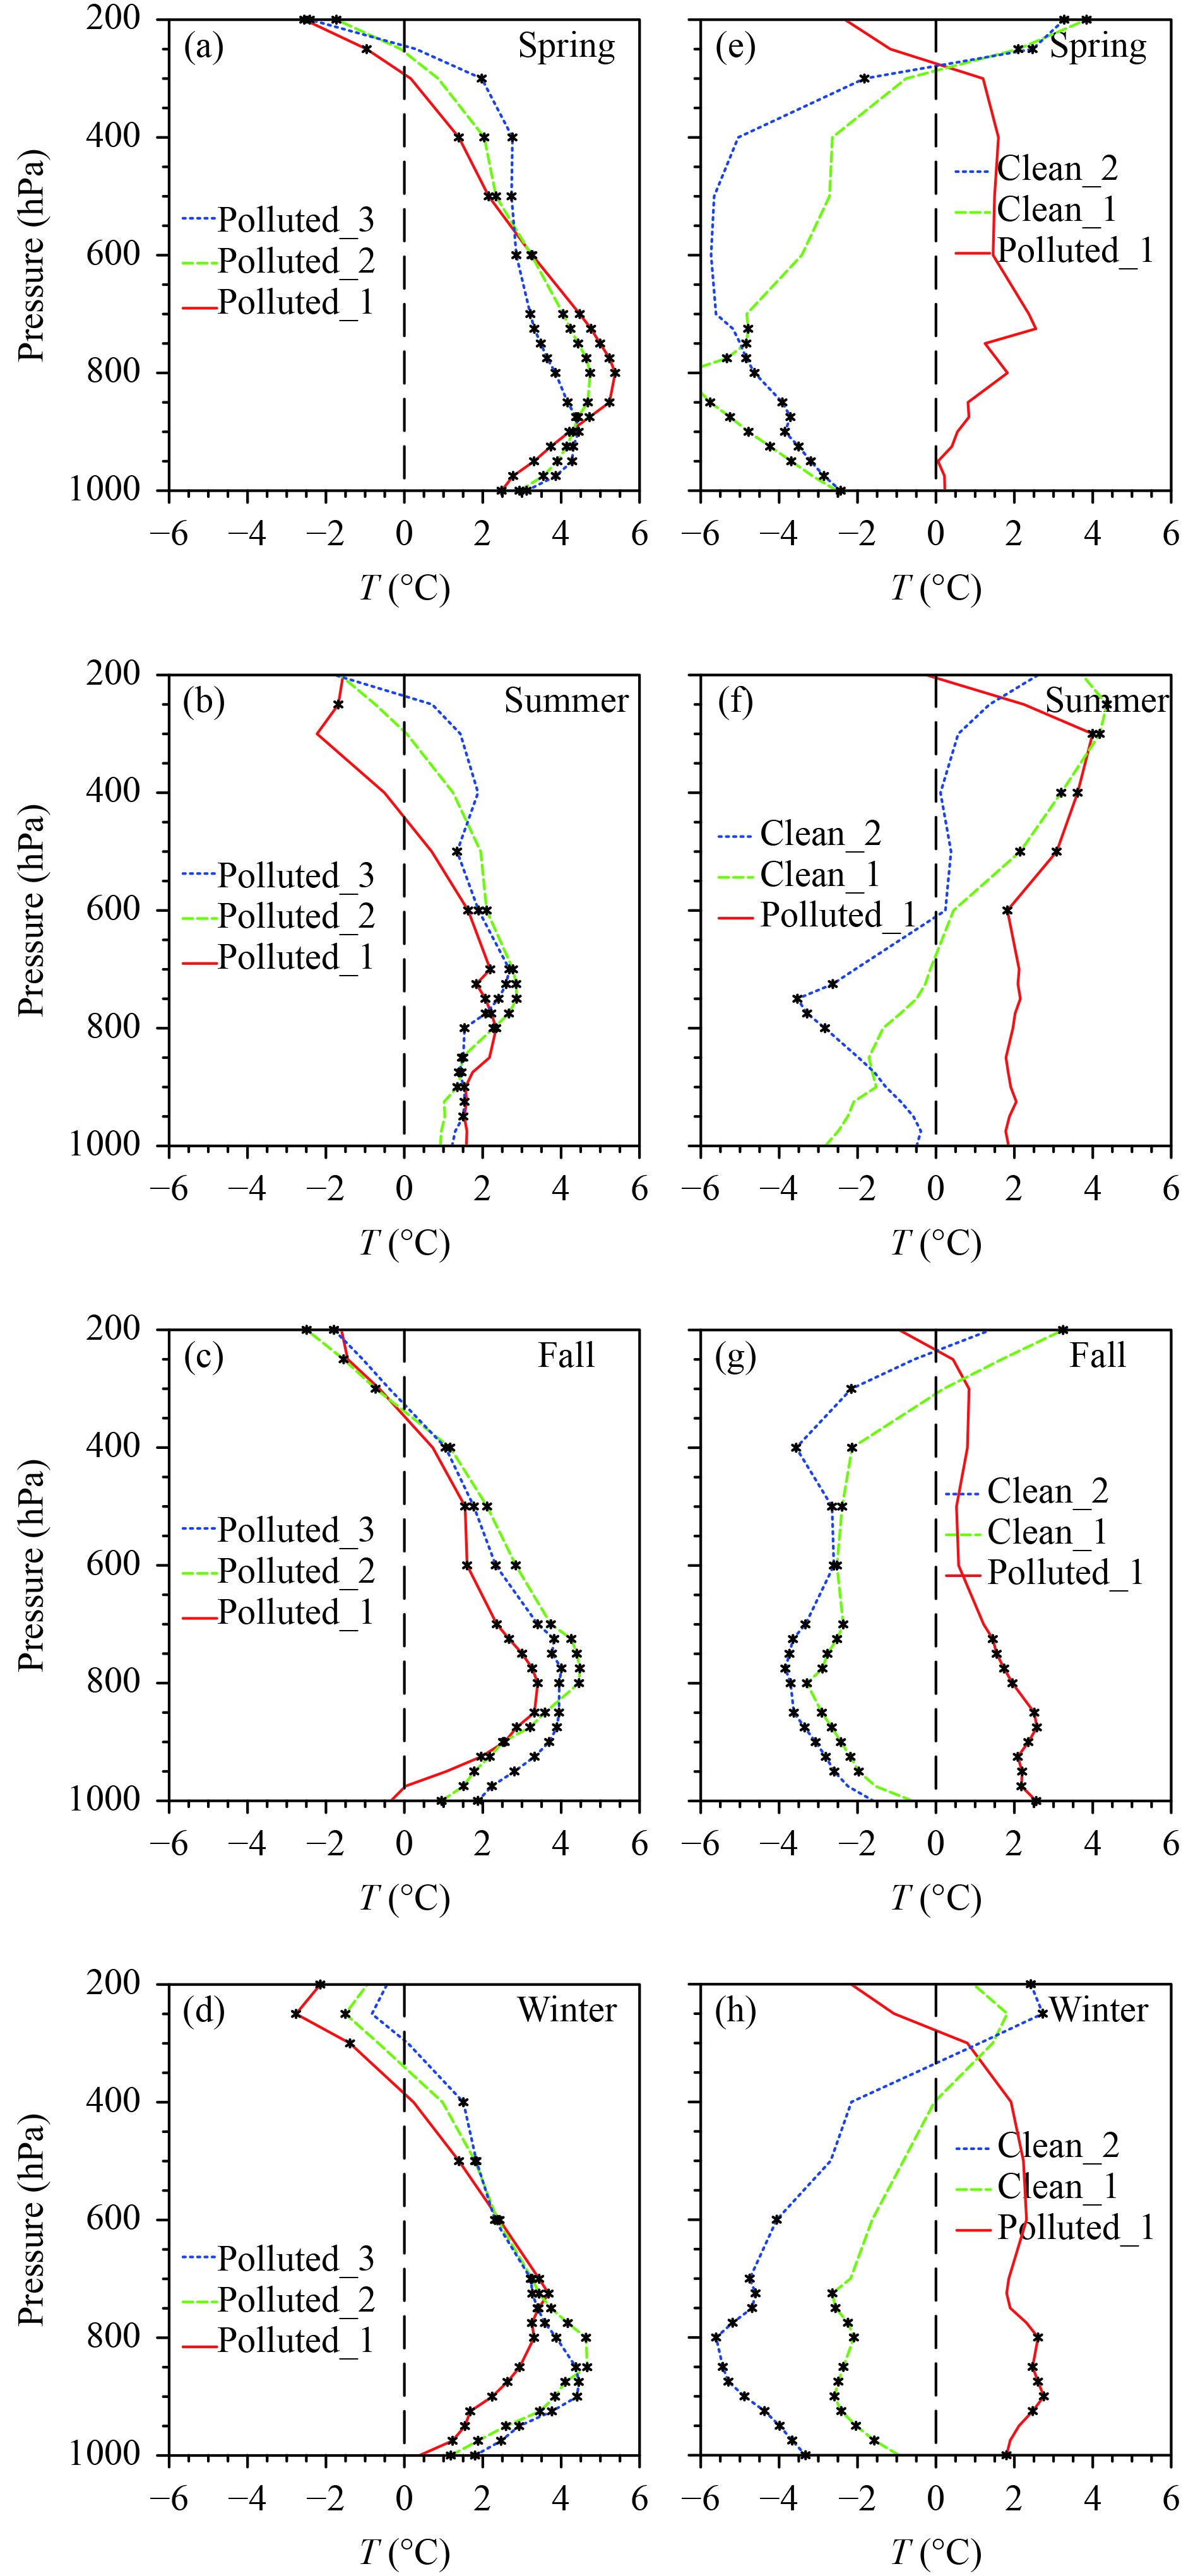
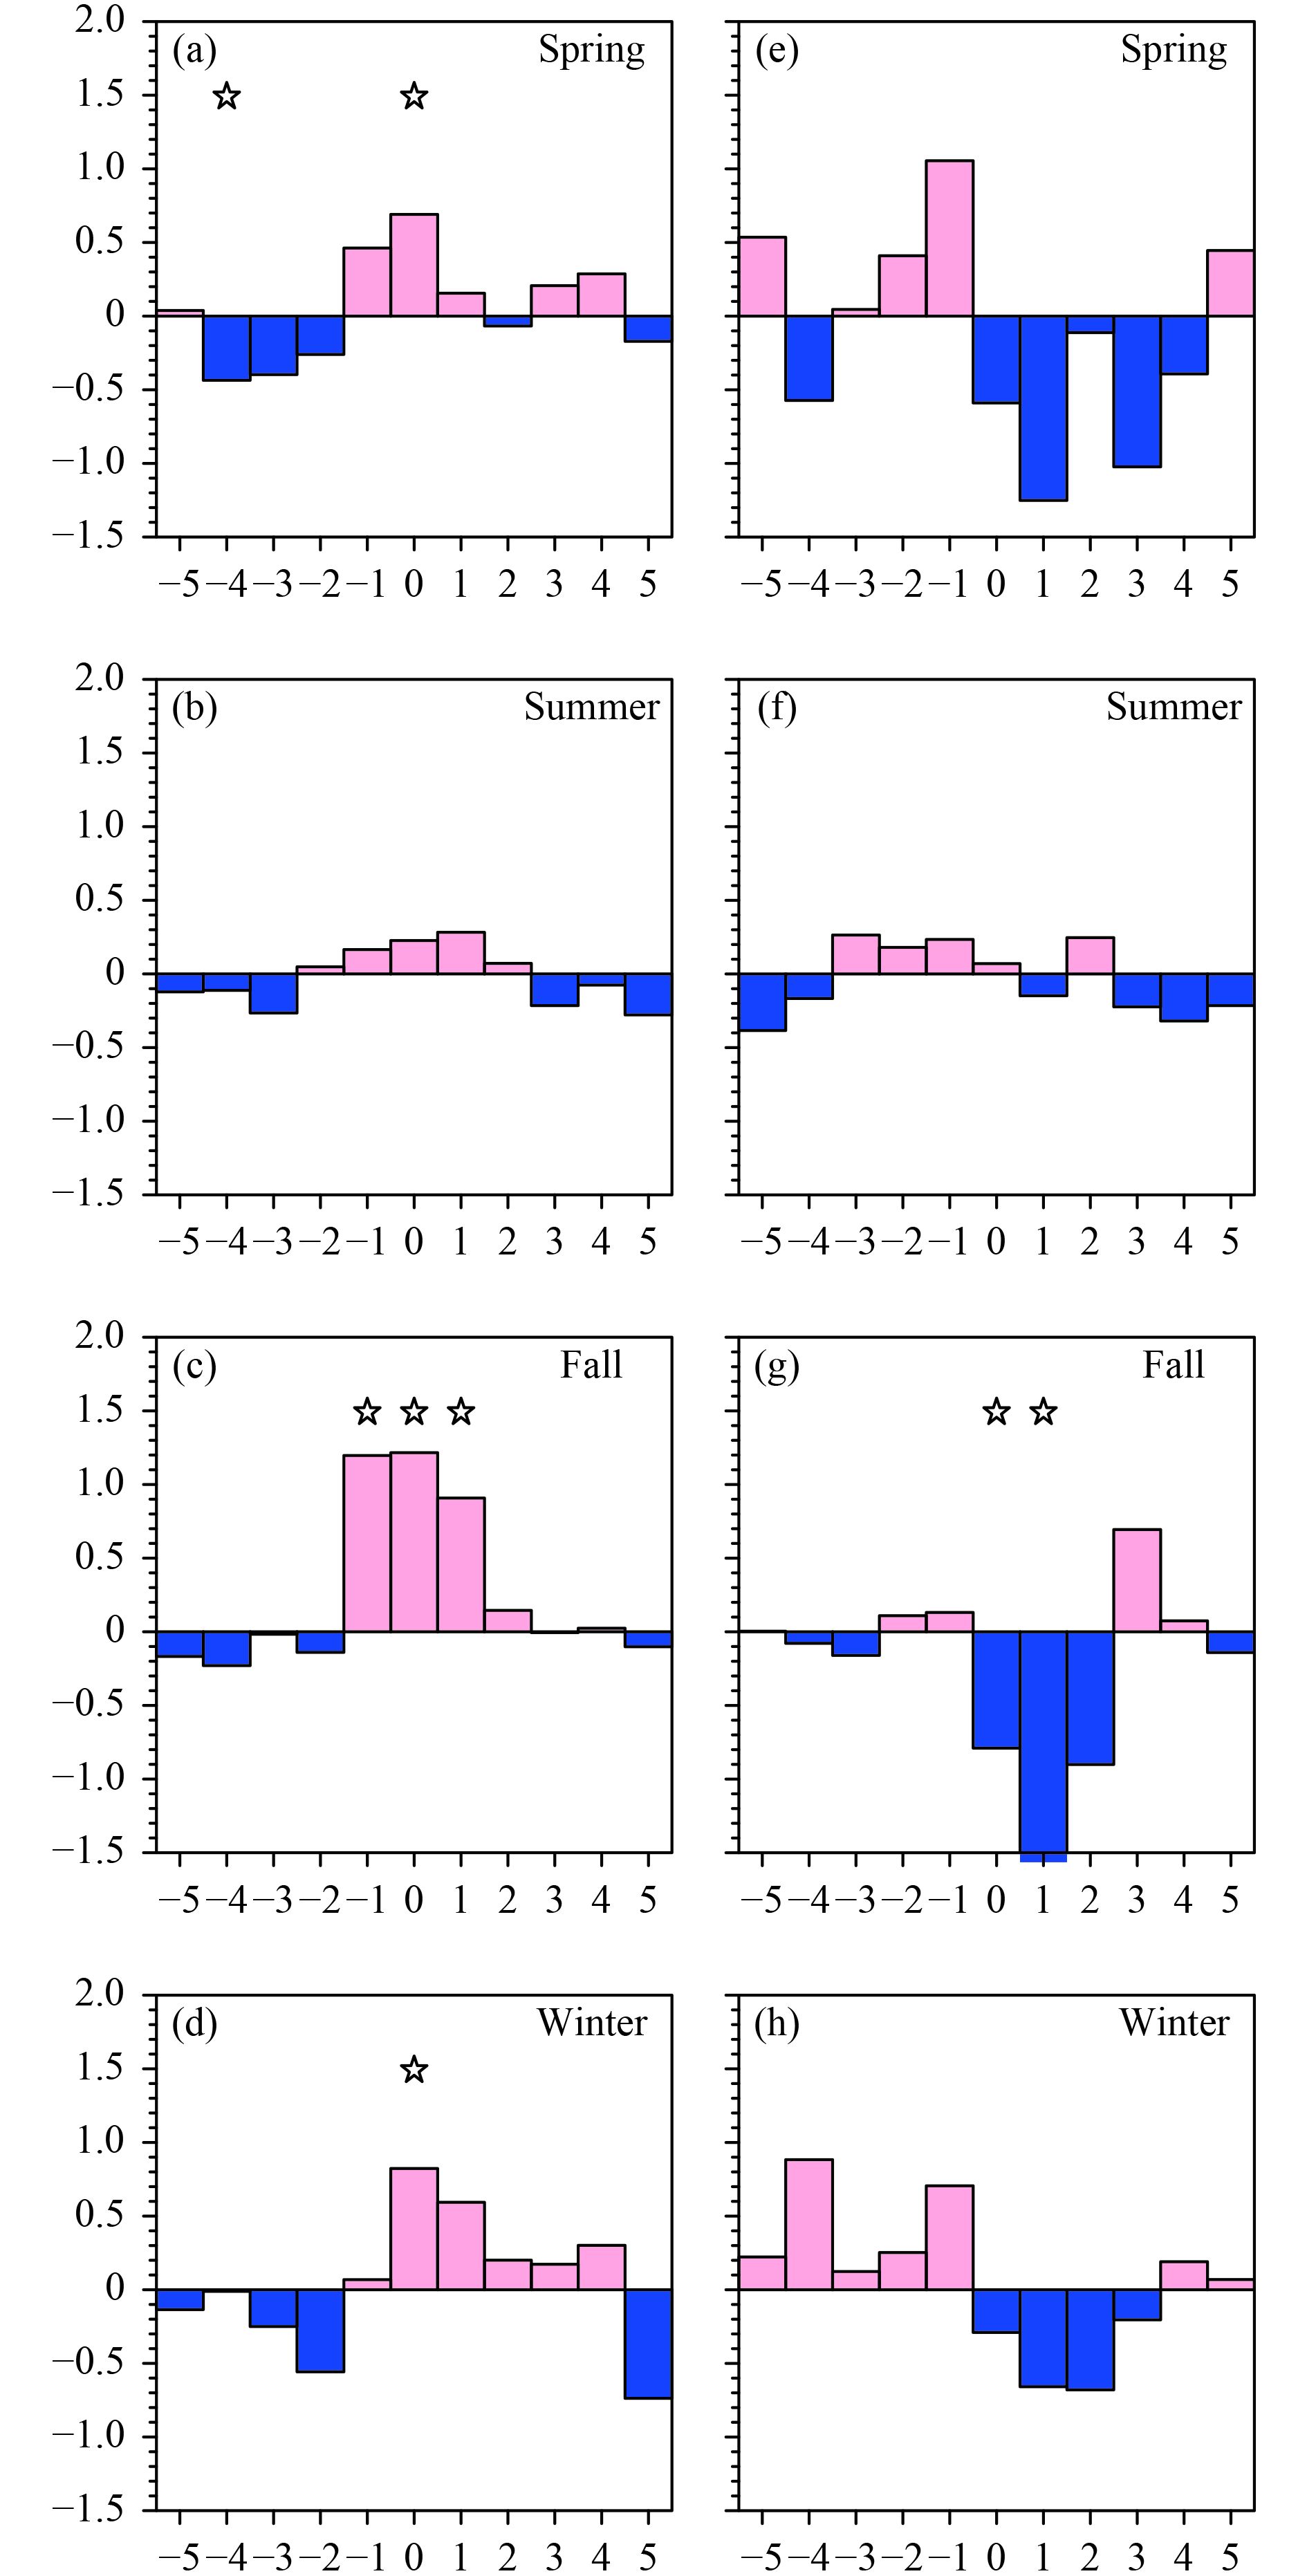
We compared the difference in the stability of the lower troposphere between the persistent and non-persistent pollution events. Previous studies have suggested that the presence of a temperature inversion favors the occurrence of pollution (Ye et al., 2016). All the air temperature anomalies showed an increase in significant positive values with height during persistent pollution events in the lower troposphere below 900 hPa in the spring, fall, and winter (Figs. 11a, c, d). This indicated an anomalous inversion during persistent pollution events, which restricted the dispersion of pollutants. The change in the temperature anomalies with altitude was relatively small in the lower troposphere in summer (Fig. 11b). The change in the positive temperature anomalies with height in the lower troposphere was small on the polluted day for non-persistent pollution events. However, the increase in significant negative temperature anomalies with height was large on the clean days in spring, fall, and winter (Figs. 11e, g, h) and the vertical structure of the temperature anomalies became favorable for the dispersion of pollutants. The temperature anomalies in the lower troposphere were insignificant in summer (Fig. 11f). This suggests that the temperature inversion was less important in the pollution events in summer than in the other seasons.
|
| Figure 11 Vertical distributions of air temperature anomalies (°C) during (a–d) persistent pollution events and (e–h) non-persistent pollution events in different seasons in Beijing. The marked points denote that the composite anomalies were significant at the 95% confidence level according to the one-tailed Student’s t-test. |
The effects of atmospheric stability were analyzed using an instability index calculated using the reanalysis dataset for the air temperature recorded four times per day during the period January 2007 to December 2015. The air temperature averaged over the region 37.5°–42.5°N, 115°–117.5°E was used to calculate the stability index, which was defined as the air temperature at 850 hPa minus the air temperature at 1000 hPa. A positive stability index indicated that the atmospheric stratification was stable in the lower troposphere and a negative index indicated unstable atmospheric stratification.
The stability index value was usually positive in all four seasons between one day before and two days after the first polluted day of persistent pollution events (Figs. 12a–d). By contrast, the instability index was larger in fall and winter and smaller in summer. In particular, the instability index anomaly was significant on all three polluted days (Fig. 12c). The instability index experienced an obvious switch from positive before the polluted day to negative on the clean days in spring, fall, and winter during non-persistent pollution events (Figs. 12e, g, h). In addition, the instability index anomaly was large, negative, and significant in fall (Fig. 12g). The instability index was smaller in summer (Fig. 12f). This contrast in the stability index indicated that the effect of atmosphe-ric stability on pollution was more robust in spring, fall, and winter than in summer.
|
| Figure 12 Temporal evolutions of the stability index over the region 37.5°–42.5°N, 115°–117.5°E from five days before to five days after the first polluted day (denoted as day 0) during (a–d) persistent pollution events and (e–h) non-persistent pollution events in different seasons. The star symbols above the bars denote when the composite stability index was significant at the 95% confidence level according to the one-tailed Student’s t-test. |
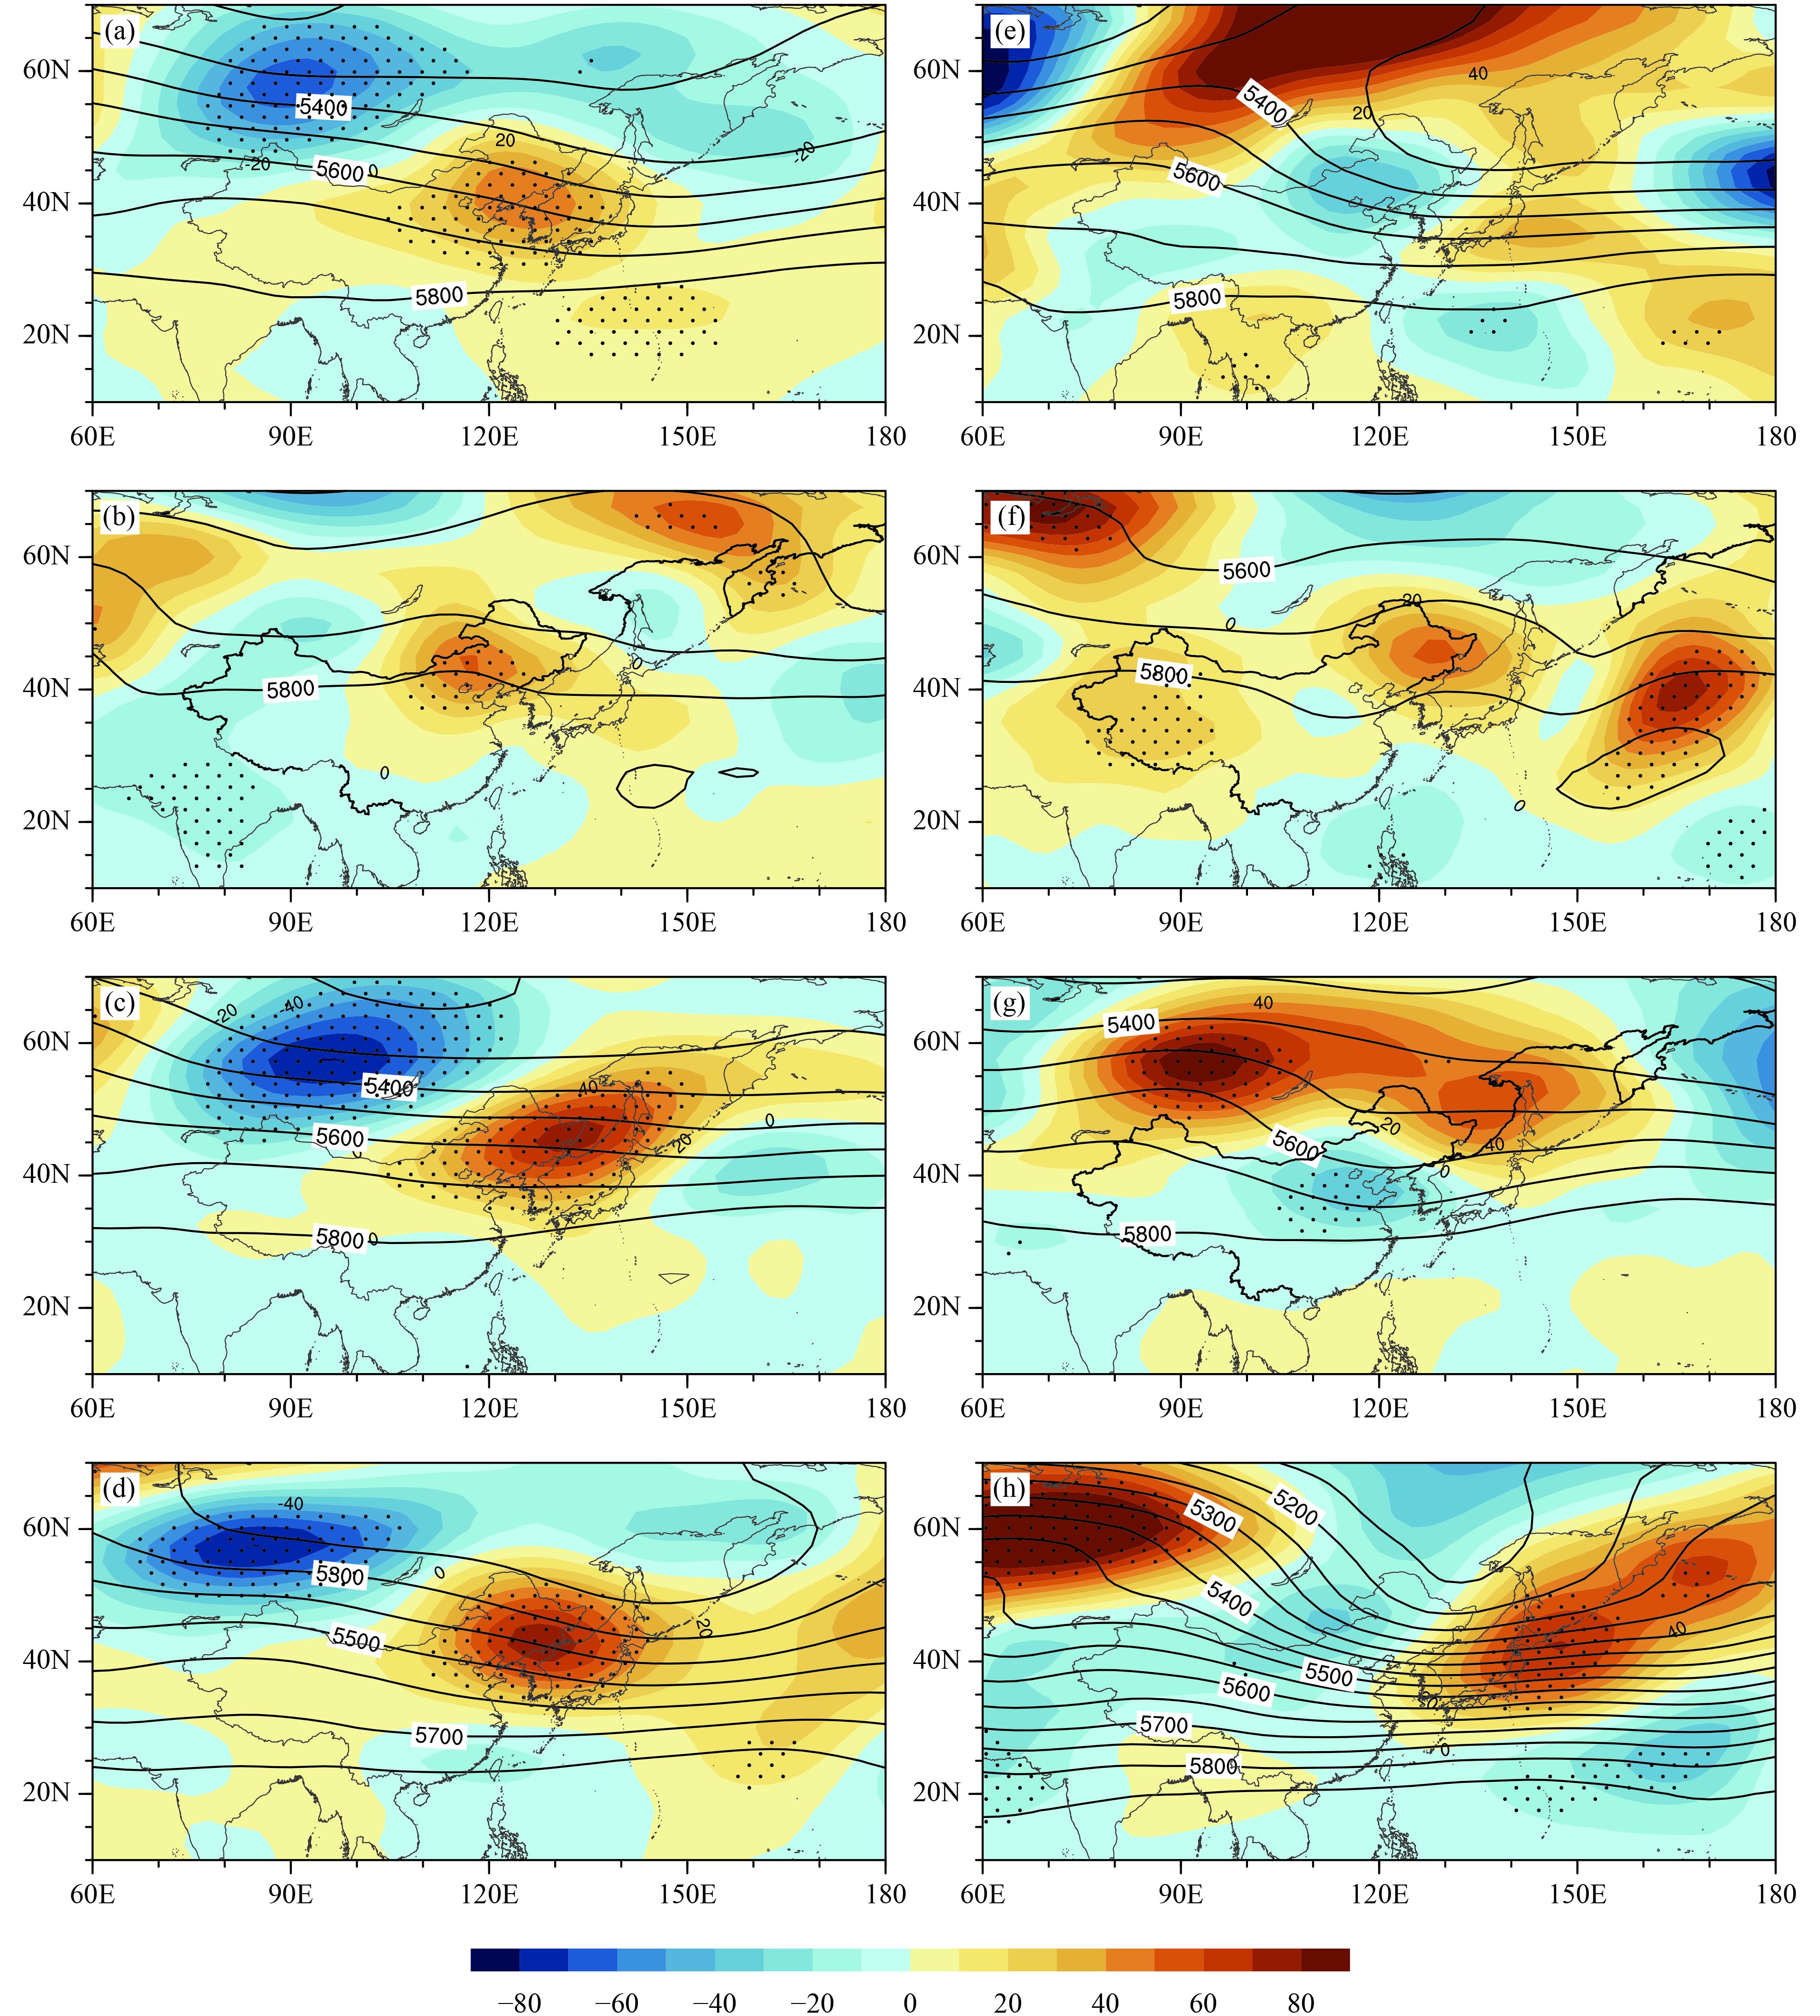
An important difference between the persistent and non-persistent pollution events was the rate of change of the synoptic pattern with time. The synoptic patterns changed relatively slowly during persistent pollution events, but rapidly during non-persistent pollution events. This led to a prominent difference in the tempo-ral evolution of the local meteorological conditions. We compared 3-day mean geopotential height at 500 hPa between the persistent and non-persistent pollution events to help understand the contributions to the different rates of change of synoptic patterns. A stronger ridge was observed west of Lake Baikal during non-persistent pollution events (Figs. 13e, g) than during persistent pollution events (Figs. 13a, c) in spring and fall. The East Asian trough was much deeper with a westward displacement and the ridge over west Siberia was much stronger during non-persistent pollution events (Fig. 13h) than during persistent pollution events (Fig. 13d) in winter. This difference was associated with the distribution of height anomalies. During non-persistent pollution events, the height anomalies were negative over North China and positive west of Lake Baikal (Figs. 13e, g, h). The opposite height anomalies were observed in these regions during persistent pollution events (Figs. 13a, c, d). Conse-quently, larger northwesterly winds were observed over the midlatitudes of East Asia during non-persistent pollution events, which guided the rapid movement of lower level weather systems. The meteorological conditions were thus able to change quickly and the pollution status was short-lived. By contrast, the mid-tropospheric steering winds were weak during persistent pollution events and the lower level weather systems moved relatively slowly. Such a weak circulation may be followed by weaker cold air from the north, but more warm and humid air from the south (Zhang X. Y. et al., 2013). This favors stagnant weather conditions and the formation of a temperature inversion in the lower troposphere, leading to the persistence of pollution. The difference in the 3-day mean 500-hPa geopotential height field was relatively small between the two types of event in summer (Figs. 13b, f).
|
| Figure 13 The 3-day mean geopotential height (contours) and its anomaly (shading) at 500 hPa (gpm) during (a–d) persistent pollution events and (e–h) non-persistent pollution events in (a, e) spring, (b, f) summer, (c, g) fall, and (d, h) winter. The dotted region shows where the composite anomalies were significant at the 95% confidence level according to the one-tailed Student’s t-test. |
We analyzed the regional synoptic patterns and local meteorological conditions corresponding to persistent and non-persistent pollution events in Beijing during 2007–15. The analysis was conducted separately for the four seasons to identify inter-seasonal changes in the factors affecting the occurrence of pollution events. Prominent differences were detected between persistent and non-persistent pollution events in both the regional patterns of occurrence and the local conditions.
An analysis of the synoptic patterns suggested that the slow movement of weather systems favored a longer duration of air pollution events. The slow movement produced stagnant weather conditions, which were unfavorable for the dispersion of air pollutants. By contrast, the rapid movement of weather systems led to a dramatic change in the local weather conditions and rapidly changed the pollution status so the pollution event was short-lived. The difference in the movement of weather systems appeared to be related to the mid-tropospheric circulation.
The regional synoptic patterns showed notable inter-seasonal differences for persistent pollution events. Lower pressure extended from the north to cover the region around Beijing in spring, fall, and winter, whereas the pressure anomaly distribution featured a northwest low–southeast high contrast around Beijing in summer. Higher relative humidity was observed near Beijing in fall and winter, whereas the relative humidity was lower in spring and summer. The changes in temperature and relative humidity were mostly associated with changes in the winds. The most fundamental variable for changes in air quality were the winds, which were dynamically consistent with the pressure distribution. The effects of wind changes were manifested in the transport of air pollutants and in the modulation of temperature and relative humidity via horizontal advection.
The changes in synoptic patterns corresponding to non-persistent pollution events were mostly consistent among the four seasons, although some differences were seen at the time of switching. The main features included the eastward movement of positive and negative temperature regions and the southeastward movement of anomalous regions of low pressure (cyclones) and high pressure (anticyclones). The changes in relative humidity were less clear. The anomalous convergence of lower level winds or southerly winds near Beijing was replaced by anomalous northerly winds during the pollution events.
The changes in the local meteorological conditions were consistent with the movement of the synoptic patterns. During persistent pollution events, the surface air temperature first increased, was sustained at the high value, and then decreased. The surface pressure decreased and then recovered quickly, except in summer. The surface wind speed reduced, stayed at a low value, and then increased in the spring, fall, and winter. The relative humidity increased to a high value and then decreased after the pollution event in fall and winter. During non-persistent pollution events, a large decrease in temperature and relative humidity and an increase in pressure and wind speed were observed in all four seasons.
The temperature inversion in the lower troposphere was a key factor in the occurrence of air pollution in spring, fall, and winter. The inversion was maintained during persistent pollution events, but reversed with the clearing of the air pollution. This contrast in the temperature inversion between the two types of event was closely associated with the temporal changes in the synoptic patterns. The impact of atmospheric stability on air pollution appears to be more robust under stagnant weather conditions.
This study focused on the impact of high-frequency (period < 90 days) variations in meteorological conditions on the occurrence of persistent air pollutions events in Beijing. This differed from previous studies that analyzed all the meteorological fields. Some of the results obtained in this study are similar to those of previous studies. This indicates that high-frequency variations in meteorological conditions determine the prominent day-to-day changes in air quality that are often experienced in Beijing. This study also shows that the relationship between air pollution and the variation in relative humidity in spring and summer differs from the general relationship obtained in previous studies. We identified that the high relative humidity condition for air pollution applies in fall and winter, but not in spring and summer.
The composite analysis used in this study was based on a defined number of pollution events. The number of events was fairly limited in some categories, such as persistent events in summer (seven events) and non-persistent events in spring (three events) and summer (five events). As such, some of the features obtained based on this composite analysis may not be robust. Further analysis using a greater amount of data is needed to confirm the results of this study. An analysis of synoptic patterns with respect to the persistent pollution events determined based on PM2.5 measurements at the US Embassy in Beijing led to similar results. In particular, the relative humidity anomalies were large and positive in fall and winter, but small or negative in spring and summer.
Acknowledgments. We appreciate the comments of the two anonymous reviewers. The NCEP–DOE reanalysis 2 data were obtained from ftp://ftp.cdc.noaa.gov/.
| Beaver, S., A. Palazoglu, A. Singh, et al., 2010: Identification of weather patterns impacting 24-h average fine particulate matter pollution. Atmos. Environ., 44, 1761–1771. DOI:10.1016/j.atmosenv.2010.02.001 |
| Berico, M., A. Luciani, and M. Formignani, 1997: Atmospheric aerosol in an urban area—measurements of TSP and PM10 standards and pulmonary deposition assessments . Atmos. Environ., 31, 3659–3665. DOI:10.1016/S1352-2310(97)00204-5 |
| Buchanan, C. M., I. J. Beverl, and M. R. Heal, 2002: The influence of weather-type and long-range transport on airborne particle concentrations in Edinburgh, UK. Atmos. Environ., 36, 5343–5354. DOI:10.1016/S1352-2310(02)00579-4 |
| Chen, H. P., and H. J. Wang, 2015: Haze days in North China and the associated atmospheric circulations based on daily visibility data from 1960 to 2012. J. Geophys. Res. Atmos., 120, 5895–5909. DOI:10.1002/2015JD023225 |
| Chen, Z. H., S. Y. Cheng, J. B. Li, et al., 2008: Relationship between atmospheric pollution processes and synoptic pressure patterns in northern China. Atmos. Environ., 42, 6078–6087. DOI:10.1016/j.atmosenv.2008.03.043 |
| Cheng, Y., K. F. Ho, S. C. Lee, et al., 2006: Seasonal and diurnal variations of PM1.0, PM2.5 and PM10 in the roadside environment of Hong Kong . China Particuology, 4, 312–315. DOI:10.1016/S1672-2515(07)60281-4 |
| Choi, Y. S., C. H. Ho, D. L. Chen, et al., 2008: Spectral analysis of weekly variation in PM10 mass concentration and meteorological conditions over China . Atmos. Environ., 42, 655–666. DOI:10.1016/j.atmosenv.2007.09.075 |
| Dawson, J. P., P. J. Adams, and S. N. Pis, 2007: Sensitivity of PM2.5 to climate in the eastern US: A modeling case study . Atmos. Chem. Phys., 7, 4295–4309. DOI:10.5194/acp-7-4295-2007 |
| Fu, G. Q., W. Y. Xu, R. F. Yang, et al., 2014: The distribution and trends of fog and haze in the North China Plain over the past 30 years. Atmos. Chem. Phys., 14, 11949–11958. DOI:10.5194/acp-14-11949-2014 |
| Fung, W. Y., and R. Wu, 2014: Relationship between intrasea-sonal variations of air pollution and meteorological variables in Hong Kong. Annals of GIS, 20, 217–226. DOI:10.1080/19475683.2014.945480 |
| He, S. S., B. T. Zhao, and Z. Y. Yu, 2014: Development and comparison of national ambient air quality standards in China. Environ. Monitor. China, 30, 50–55. DOI:10.3969/j.issn.1002-6002.2014.04.009 |
| Hu, X. M., Y. Zhang, M. Z. Jacobson, et al., 2008: Coupling and evaluating gas/particle mass transfer treatments for aerosol simulation and forecast. J. Geophys. Res. Atmos., 113, D11208. DOI:10.1029/2007JD009588 |
| Jacob, D. J., and D. A. Winner, 2009: Effect of climate change on air quality. Atmos. Environ., 43, 51–63. DOI:10.1016/j.atmosenv.2008.09.051 |
| Ji, D. S., Y. S. Wang, L. L. Wang, et al., 2012: Analysis of heavy pollution episodes in selected cities of northern China. Atmos. Environ., 50, 338–348. DOI:10.1016/j.atmosenv.2011.11.053 |
| Kanamitsu, M., W. Ebisuzaki, J. Woollen, et al., 2002: NCEP–DOE AMIP-II reanalysis (R-2). Bull. Amer. Meteor. Soc., 83, 1631–1643. DOI:10.1175/BAMS-83-11-1631 |
| Kaur, S., M. J. Nieuwenhuijsen, and R. N. Colvile, 2007: Fine particulate matter and carbon monoxide exposure concentrations in urban street transport microenvironments. Atmos. Environ., 41, 4781–4810. DOI:10.1016/j.atmosenv.2007.02.002 |
| Liu, X. G., J. Li, Y. Qu, et al., 2013: Formation and evolution mechanism of regional haze: A case study in the megacity Beijing, China. Atmos. Chem. Phys., 13, 4501–4514. DOI:10.5194/acp-13-4501-2013 |
| Lyu, B. L., B. Zhang, and Y. Q. Bai, 2016: A systematic analysis of PM2.5 in Beijing and its sources from 2000 to 2012 . Atmos. Environ., 124, 98–108. DOI:10.1016/j.atmosenv.2015.09.031 |
| Molina, L. T., S. Madronich, J. S. Gaffney, et al., 2010: An overview of the MILAGRO 2006 Campaign: Mexico City emissions and their transport and transformation. Atmos. Chem. Phys., 10, 8697–8760. DOI:10.5194/acp-10-8697-2010 |
| Pope, III, A. C., Ezzati M., and W. Dockery D., 2009: Fine-particulate air pollution and life expectancy in the United States. N. Engl. J. Med., 360, 376–386. DOI:10.1056/NEJMsa0805646 |
| Pu, W. W., X. J. Zhao, X. F. Shi, et al., 2015: Impact of long-range transport on aerosol properties at a regional background station in northern China. Atmos. Res., 153, 489–499. DOI:10.1016/j.atmosres.2014.10.010 |
| Sun, Y. L., G. S. Zhuang, Y. Wang, et al., 2004: The air-borne particulate pollution in Beijing—concentration, composition, distribution and sources. Atmos. Environ., 38, 5991–6004. DOI:10.1016/j.atmosenv.2004.07.009 |
| Tian, G. J., Z. Qiao, and X. L. Xu, 2014: Characteristics of particulate matter (PM10) and its relationship with meteorological factors during 2001–2012 in Beijing . Environ. Pollut., 192, 266–274. DOI:10.1016/j.envpol.2014.04.036 |
| Twomey, S., 1974: Pollution and the planetary albedo. Atoms. Environ., 8, 1251–1256. DOI:10.1016/0004-6981(74)90004-3 |
| Wang, F., D. S. Chen, S. Y. Cheng, et al., 2010: Identification of regional atmospheric PM10 transport pathways using HYSPLIT, MM5-CMAQ and synoptic pressure pattern analysis . Environ. Modell. Softw., 25, 927–934. DOI:10.1016/j.envsoft.2010.02.004 |
| Wang, X. K., and W. Z. Lu, 2006: Seasonal variation of air pollution index: Hong Kong case study. Chemosphere, 63, 1261–1272. DOI:10.1016/j.chemosphere.2005.10.031 |
| Wilson, A. M., J. C. Salloway, C. P. Wake, et al., 2004: Air pollution and the demand for hospital services: A review. Environ. Int., 30, 1109–1118. DOI:10.1016/j.envint.2004.01.004 |
| Ye, X. X., Y. Song, X. H. Cai, et al., 2016: Study on the synoptic flow patterns and boundary layer process of the severe haze events over the North China Plain in January 2013. Atmos. Environ., 124, 129–145. DOI:10.1016/j.atmosenv.2015.06.011 |
| You, T., R. Wu, G. Huang, et al., 2017: Regional meteorological patterns for heavy pollution events in Beijing. J. Meteor. Res., 31, 597–611. DOI:10.1007/s13351-017-6143-1 |
| Zhang, H. L., Y. G. Wang, J. L. Hu, et al., 2015: Relationships between meteorological parameters and criteria air pollutants in three megacities in China. Environ. Res., 140, 242–254. DOI:10.1016/j.envres.2015.04.004 |
| Zhang, L., T. Wang, M. Y. Lyu, et al., 2015: On the severe haze in Beijing during January 2013: Unraveling the effects of meteorological anomalies with WRF-Chem. Atmos. Environ., 104, 11–21. DOI:10.1016/j.atmosenv.2015.01.001 |
| Zhang, R. H., Q. Li, and R. N. Zhang, 2013: Meteorological conditions for the persistent severe fog and haze event over eastern China in January 2013. Sci. China Earth Sci., 57, 26–35. DOI:10.1007/s11430-013-4774-3 |
| Zhang, X.-Y., J.-Y. Sun, Y.-Q. Wang, et al., 2013: Factors contributing to haze and fog in China. Chinese Sci. Bull., 58, 1178–1187. DOI:10.1360/972013-150 |
| Zhang, Y., A. J. Ding, H. T. Mao, et al., 2016: Impact of synoptic weather patterns and inter-decadal climate variability on air quality in the North China Plain during 1980–2013. Atmos. Environ., 124, 119–128. DOI:10.1016/j.atmosenv.2015.05.063 |
| Zhao, S. P., Y. Yu, D. Y. Yin, et al., 2016: Annual and diurnal variations of gaseous and particulate pollutants in 31 provincial capital cities based on in situ air quality monitoring data from China National Environmental Monitoring Center. Environ. Int., 86, 92–106. DOI:10.1016/j.envint.2015.11.003 |
 2018, Vol. 32


