The Chinese Meteorological Society
Article Information
- REN, Yan, Shuwen ZHENG, Wei WEI, et al., 2018.
- Characteristics of Turbulent Transfer during Episodes of Heavy Haze Pollution in Beijing in Winter 2016/17. 2018.
- J. Meteor. Res., 32(1): 69-80
- http://dx.doi.org/10.1007/s13351-018-7072-3
Article History
- Received May 20, 2017
- in final form September 20, 2017
2. State Key Laboratory of Severe Weather, Chinese Academy of Meteorological Sciences, Beijing 100081;
3. Tianjin Meteorological Bureau, Tianjin 300074;
4. State Key Joint Laboratory of Environmental Simulation and Pollution Control, Department of Environmental Science, Peking University, Beijing 100871
China has witnessed frequent episodes of severe air pollution in recent years. The main environmental problem is haze, mostly caused by particulate matter (PM) (Ma et al., 2012; Zhang et al., 2012, 2013). Heavy haze pollution in China impairs visibility and is now occurring more often and lasting for longer periods of time (Zhang et al., 2008; Zhao et al., 2011; Kang et al., 2013; Wang et al., 2013). Haze pollution usually accompanies meteorological conditions that are unfavorable to the dissipation of pollutants, such as an inversion of the atmospheric boundary layer, stable atmospheric stratification, or low horizontal wind speeds. These conditions can result in increasing concentrations of atmospheric pollutants and cause severe air pollution events (Zhao et al., 2013). Although we do not have a complete physical explanation for the formation of haze, many researchers (Bilde and Svenningsson, 2004; Sun et al., 2006; Wang et al., 2006, 2012; Li et al., 2011, 2013; Zhang et al., 2014) have studied the chemical composition of aerosols, their optical properties, mixing states, radiative effects, hygroscopic growth characteristics, and chemical transformations under hazy weather conditions. Some studies have shown that meteorological conditions are important factors in the occurrence and type of hazy weather (Chen et al., 2008; Guo et al., 2014) and that the structure of the atmospheric boundary layer and the capacity for turbulent transport and diffusion are important (Liu et al., 2014; Zhao et al., 2013).
Many researchers have investigated how meteorological factors and the structure of the boundary layer affect the transfer and dispersion of air pollutants (Holzworth, 1967; Wehner and Wiedensohler, 2003; Rigby and Toumi, 2008; Barlow et al., 2011). Fu et al. (2014) analyzed the spatial distribution and inter-annual variability of haze episodes over the past 30 years in the most polluted area of the North China Plain and found that the wind fields and inter-annual variations in wind speed had crucial roles in the formation of fog and haze events. Decreased mean wind speeds and stable weather conditions made it difficult for pollutants to dissipate. The mean relative humidity increased and was accompanied by hazy weather in the southern North China Plain, which showed that the hygroscopic growth of aerosols contributed to the hazy weather. Quan et al. (2013) analyzed the relationship between boundary layer structures and aerosol concentrations using an experiment in Tianjin from 9 to 30 September 2010 and found a feedback relationship between the height of the boundary layer and the concentration of aerosols. Increasing the aerosol concentration resulted in less solar radiation and prohibited the development of the boundary layer, which weakened the diffusion of pollutants and made the pollution more severe.
A relatively smaller amount of research is being conducted on turbulence structures and transfer rules. The diffusion of atmospheric pollutants in urban areas is closely related to the structure of atmospheric turbulence (Liu et al., 2003; Zhou et al., 2005). Therefore, it is necessary to investigate the characteristics of atmospheric turbulence and the laws governing transfer in pollution processes to determine the methods of formation, maintenance, and dissipation of heavy pollution.
Focusing on the multiple heavy haze pollution processes in the Beijing area from 6 December 2016 to 9 January 2017 and using comprehensive atmospheric science and environmental observation data from Peking University, we describe the structure and evolution of turbulence during the initiation, development, maintenance, and dissipation of heavy haze processes. We considered two aspects: first, the similarities and differences between the haze and unpolluted periods in terms of the statistical characteristics of the turbulence, turbulence flux, and turbulence energy spectrum; and second, the characteristics of turbulence during the dissipation period of haze processes.
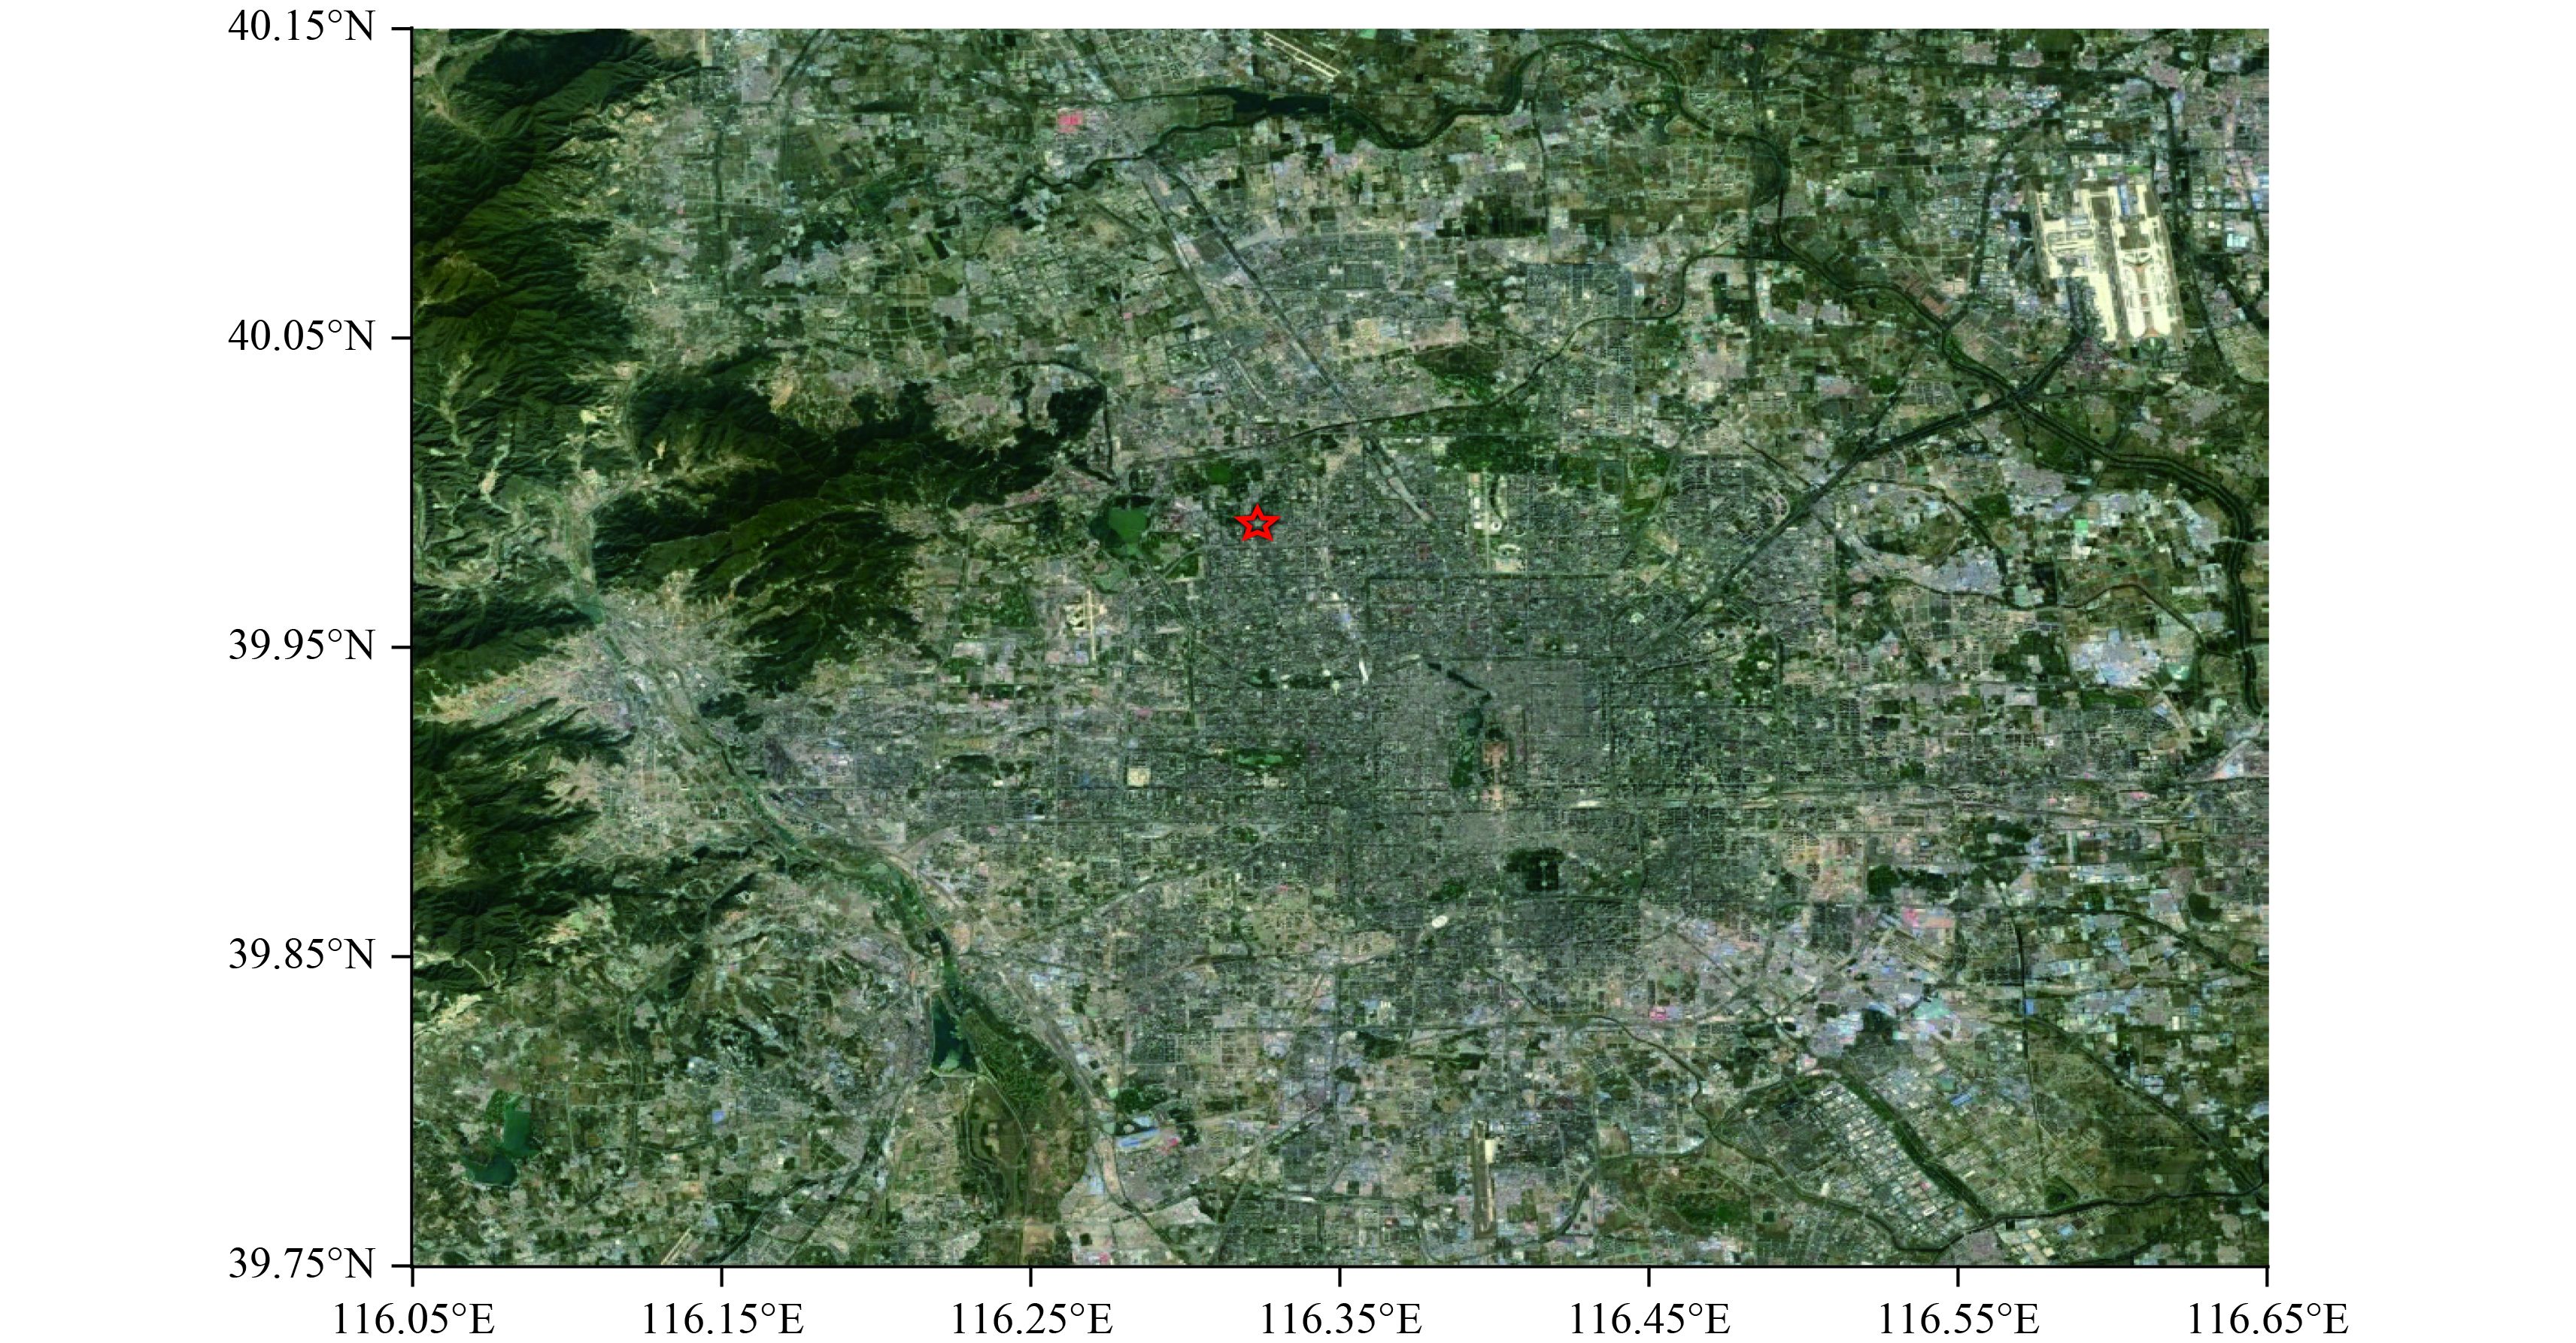
2 Data acquisition and processingThis study used data collected at Peking University’s atmospheric science and environment observation station from 6 December 2016 to 9 January 2017. These observation data included rapid fluctuations in wind speed, temperature, humidity, the mass concentration of atmospheric aerosols, and the wind profile in the boundary layer. The observation station is located on the campus of Peking University in the Haidian District of Beijing (39°59′N, 116°18′E) (Fig. 1). The station is located in a typical urban landscape and is surrounded by teaching and residential buildings and public transit facilities.
The measurement instruments are located 25 m above the ground and include an IRGASON integrated sonic anemometer and gas analyzer (IGRASON, Campbell Scientific, USA), an AWS0 automated weather station (AWS0, Vasaila, Finland), two FH62-C14 continuous particulate monitors for PM2.5 and PM1 (FH62-C14, Thermo Fisher Scientific, USA), and a CFL-3 mobile wind profiler (CFL-3, Beijing Wireless Measuring Research Laboratory). All the measurements are automated and continuous. The turbulence measurement instrument had a sampling frequency of 10 Hz. The wind profile radar measured the horizontal wind speed, the horizontal wind direction, and the vertical wind speed every 6 min. The mass concentration of atmospheric PM (including PM2.5 and PM1) was measured every 10 min. The turbulence data were processed and calculated by using the Advanced 4.2.1 version of Eddy Pro (LI-COR Biosciences, USA). The turbulence data processing included de-spiking, secondary coordinate rotation (Wilczak et al., 2001), de-trending, data screening, and instrumental corrections such as shadow correction (Grant and Watkins, 1989), frequency response correction, and sound virtual temperature correction (Xu et al., 2008).
The recorded data were rejected based on the following criteria: (1) runs with more than ± 120° between the wind direction and sonic anemometer pointer; (2) a friction velocity u*< 0.05 m s–1; and (3) a sensible heat flux < 5 W m –2. The eddy covariance method was used to calculate the sensible heat flux, as
|
| Figure 1 Google Earth map of the observation site (red star) in Beijing. |
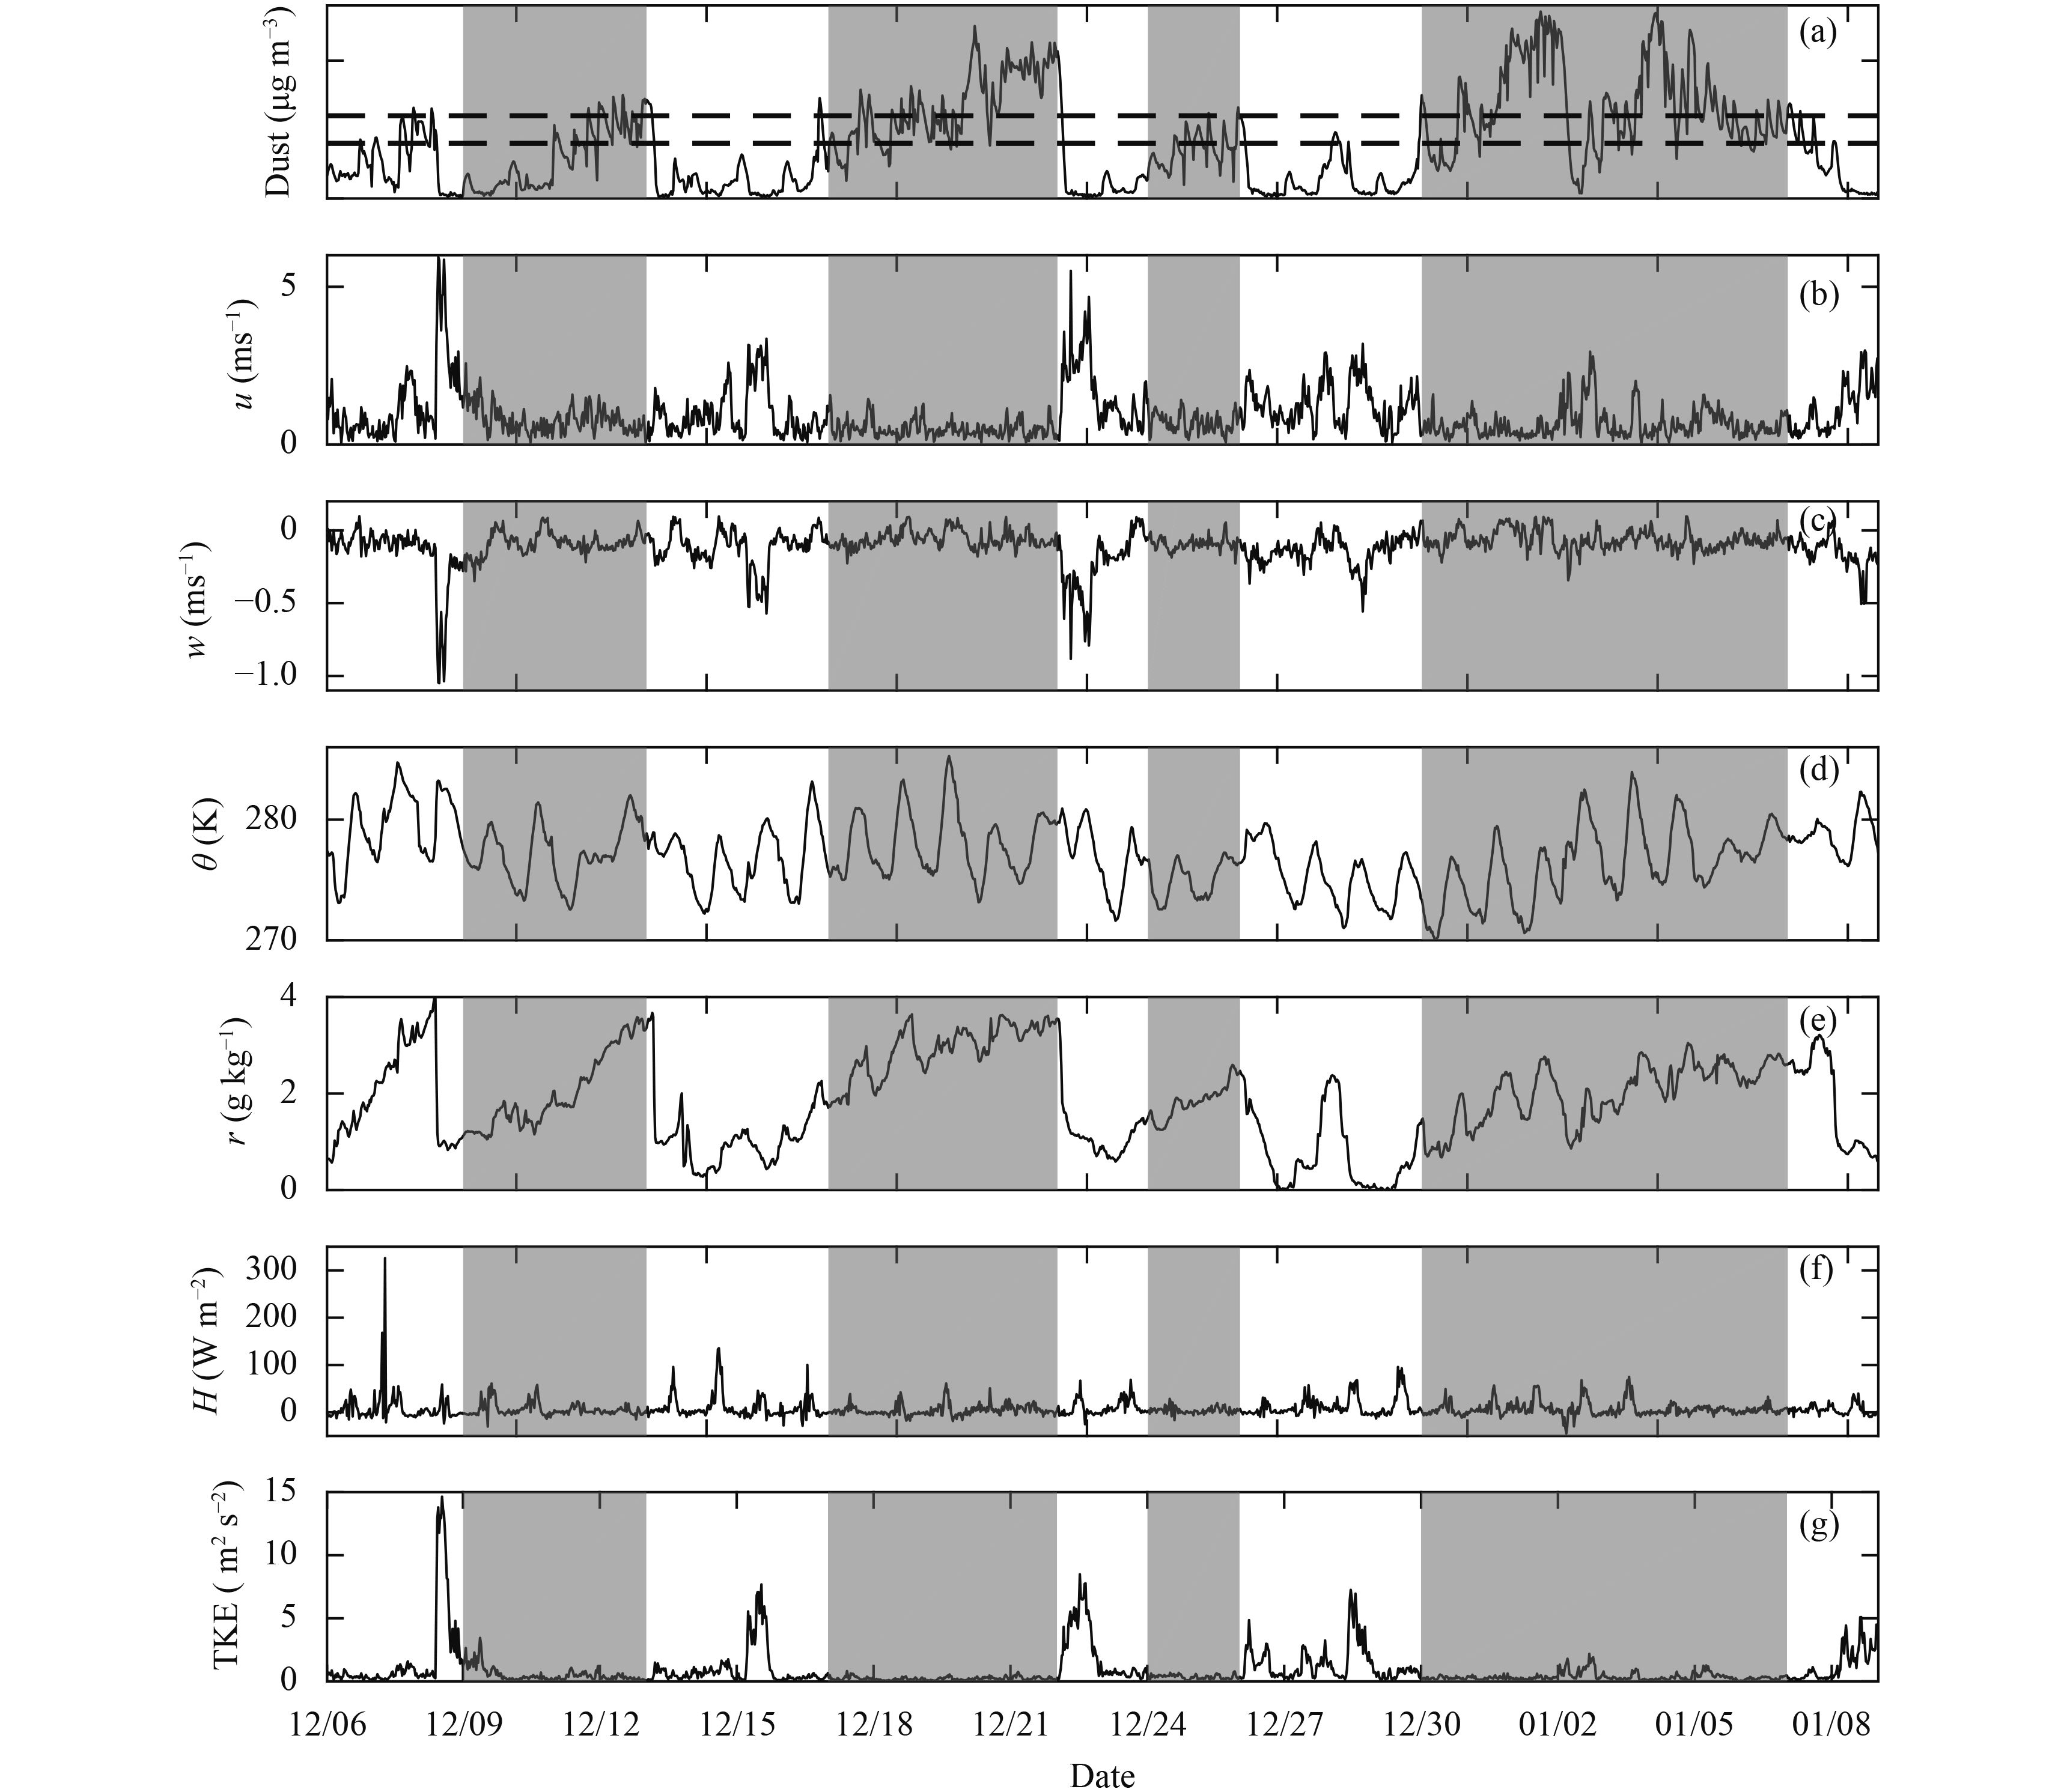
Several severe pollution episodes occurred in the Beijing area between 6 December 2016 and 9 January 2017. We used the actual weather conditions reported by the National Meteorological Center of the China Meteorological Administration as the standards for polluted and clean weather conditions. Figure 2 shows temporal evolution of the PM (PM2.5) mass concentration, horizontal wind speed, vertical wind speed, temperature, water vapor mixing ratio, sensible heat flux, and TKE from 6 December 2016 to 9 January 2017. Haze pollution occurred during 9–12, 17–21, and 24–25 December 2016, and 30 December 2016–6 January 6 2017. The shaded areas represent the four episodes of haze pollution. Figure 2a shows that the mean PM2.5 mass concentration in the Beijing area was 281 μg m–3 during the polluted periods, with the maximum reaching 678 μg m–3. During clean weather (the unshaded part of Fig. 2), the mean PM2.5 mass concentration was 88 μg m–3.
Figure 2b shows that the horizontal wind speed u was lower during polluted weather than during clean weather. The mean wind speed was 0.7 m s–1 in polluted weather and 1.2 m s–1 in clean weather. Under polluted conditions, the maximum horizontal wind speed was < 2.5 m s –1, but it reached 6 m s–1 under clear conditions. The wind speed was negatively correlated with the PM2.5 mass concentration. This shows that the mean wind speed represents the capacity to dissipate pollutants via the dynamic transport, which is consistent with the conclusions of Wei et al. (2009) and Deng et al. (2011). Figure 2c shows that the vertical wind speed w was less than the horizontal wind speed u. The vertical wind speed w varied little with time during the haze period, with a mean of –0.1 m s–1. The maximum and mean wind speeds were about –1.1 and –0.2 m s–1, respectively, during the clean period. The increasing trend of the decreasing wind speed is consistent with the increase in the horizontal wind speed and with the decrease in the PM2.5 concentration.
The temperature and heat flux are also important factors affecting pollution episodes. Although Wang et al. (2015) found that an increasing temperature was a basic feature of heavy pollution episodes in Beijing, Liu et al. (2014) found that temperatures were lower during the onset of polluted weather than on the preceding days. However, there was no apparent correlation between temperature and aerosol concentrations in our study (Fig. 2d). The sensible heat flux represents the capacity for vertical heat transfer, which is fairly small during polluted weather when the atmosphere is usually stable (Chambers et al., 2015) and the vertical wind speed is relatively small with a weak capacity for vertical transfer. The sensible heat flux is lower in polluted weather than in clean weather. Figure 2f shows that the mean sensible heat flux was 5.8 W m–2 with a maximum of 74.9 W m–2 in polluted weather. In clean weather, however, the mean sensible heat flux was 9.6 W m–2 with a maximum of 326.0 W m–2.
|
| Figure 2 Time series of meteorological parameters from 6 December 2016 to 9 January 2017. (a) Atmospheric PM2.5 concentration (the dashed lines represents concentrations of 200 and 300 μg m–3); (b) horizontal wind speed; (c) vertical wind speed; (d) potential temperature; (e) water vapor mixing ratio; (f) sensible heat flux; and (g) TKE. The shaded areas mark episodes of pollution. |
Figure 2e shows that the moisture content increased gradually in every pollution episode and decreased rapidly when the pollution episode ended and clean weather began. The water vapor mixing ratio correlated well with the PM concentration, and therefore, the timing of the rapid decreases in the PM concentration and the water vapor mixing ratio also had a good correspondence. This could be the result of the water vapor mixing ratio affecting the chemical mechanism of aerosol formation in the atmosphere. Sun et al. (2014) found that the SO2 concentration in polluted winter weather in the Beijing area was sensitive to the humidity because gaseous SO2 is converted to sulfate at high humidity, aggravating the PM2.5 pollution.Liu et al. (2014) found a positive correlation between aerosol composition and relative humidity. A high relative humidity provided favorable conditions for the hygroscopic growth of aerosol particles with positive feedback mechanisms.
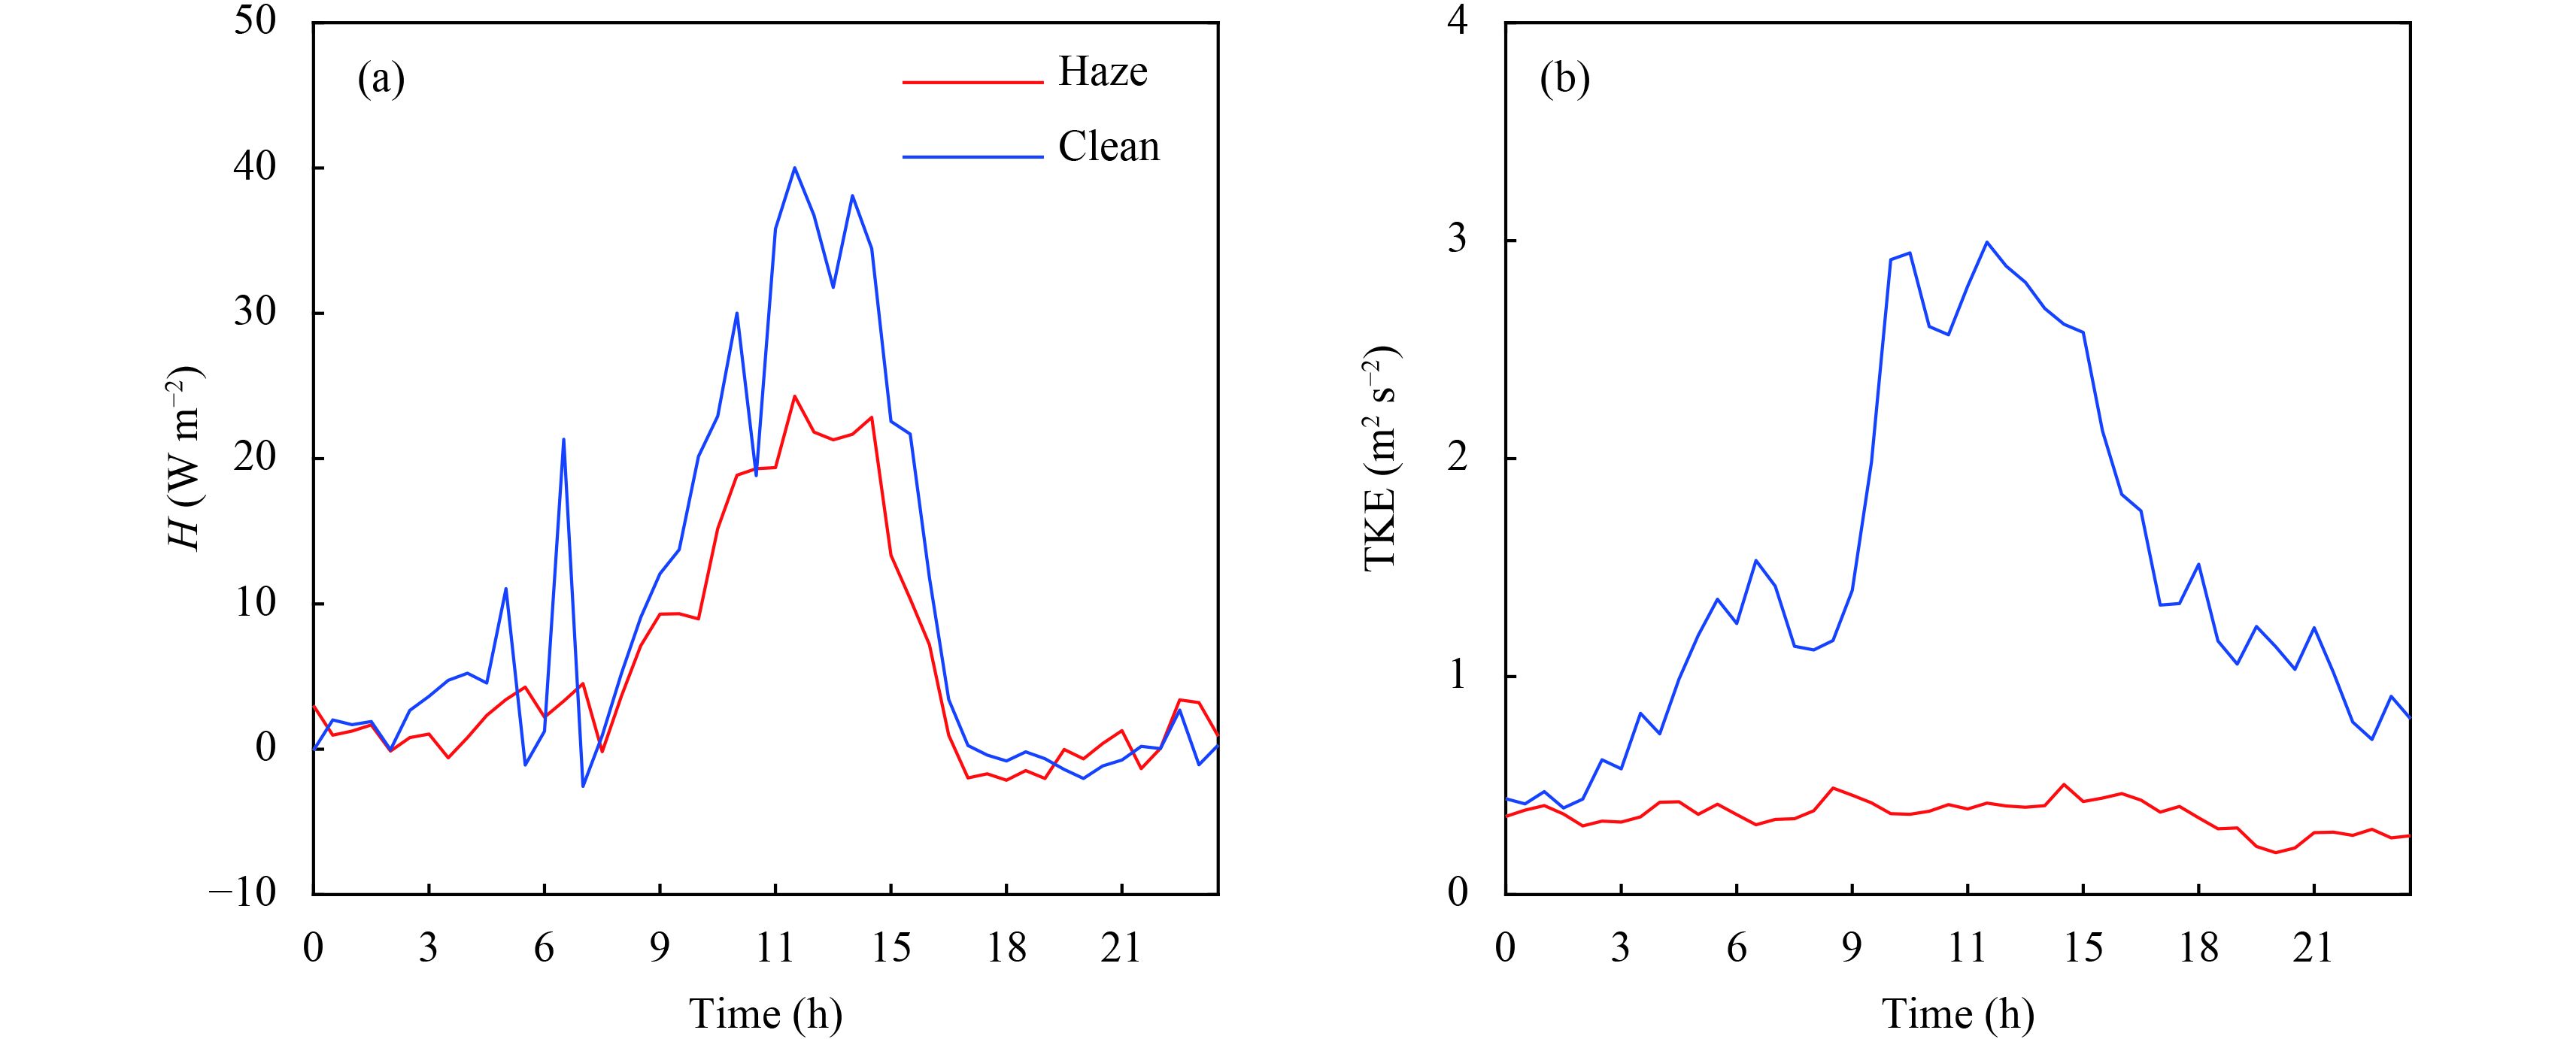
3.2 Sensible heat flux and TKEFigure 3 shows the diurnal variations of the mean sensible heat flux and the TKE in both polluted and clean weather. In the period considered in this study, there were 19 days of polluted weather and 15 days of clean weather, so the numbers of samples are similar. The PM mass concentration in polluted weather remained fairly high, so for the purpose of simplicity, it is reasonable to assume that the atmospheric turbulence on every polluted day was in a steady state. Therefore, the diurnal variations in the mean sensible heat flux and TKE on polluted days may be used to represent their variation during polluted weather.
The sensible heat flux showed clear diurnal variations in polluted and clean weather (Fig. 3a). It had an increasing trend from 0700 BT (Beijing Time) in the morning, reached a maximum at noon, maintained its noon maximum until 1400 BT, and then slowly decreased. The trends in the sensible heat flux in polluted and clean weather were basically the same, but the noon maximum was greater in clean weather than in polluted weather.
The diurnal variations in the TKE were very different in polluted and clean weather (Fig. 3b). The TKE was high in clean weather and had obvious diurnal variations. The TKE increased rapidly after sunrise and reached its maximum at noon. It then gradually decreased and remained low after sunset and reached its minimum at midnight. In polluted weather, the TKE was low throughout the day, with a daytime maximum that was less than the minimum in clean weather. This means that the turbulent motion was very weak during the polluted periods and the TKE was low. The weak turbulence transfer capacity retained pollutants in the atmospheric boundary layer and maintained the PM concentrations at high levels, which caused the heavy pollution episodes. The diurnal variations of the sensible heat flux and TKE during polluted and clean weather resulted in the same conclusion.
|
| Figure 3 (a) Diurnal variations of the mean sensible heat flux in polluted and clean weather. (b) Diurnal variations of the mean TKE in polluted and clean weather. |
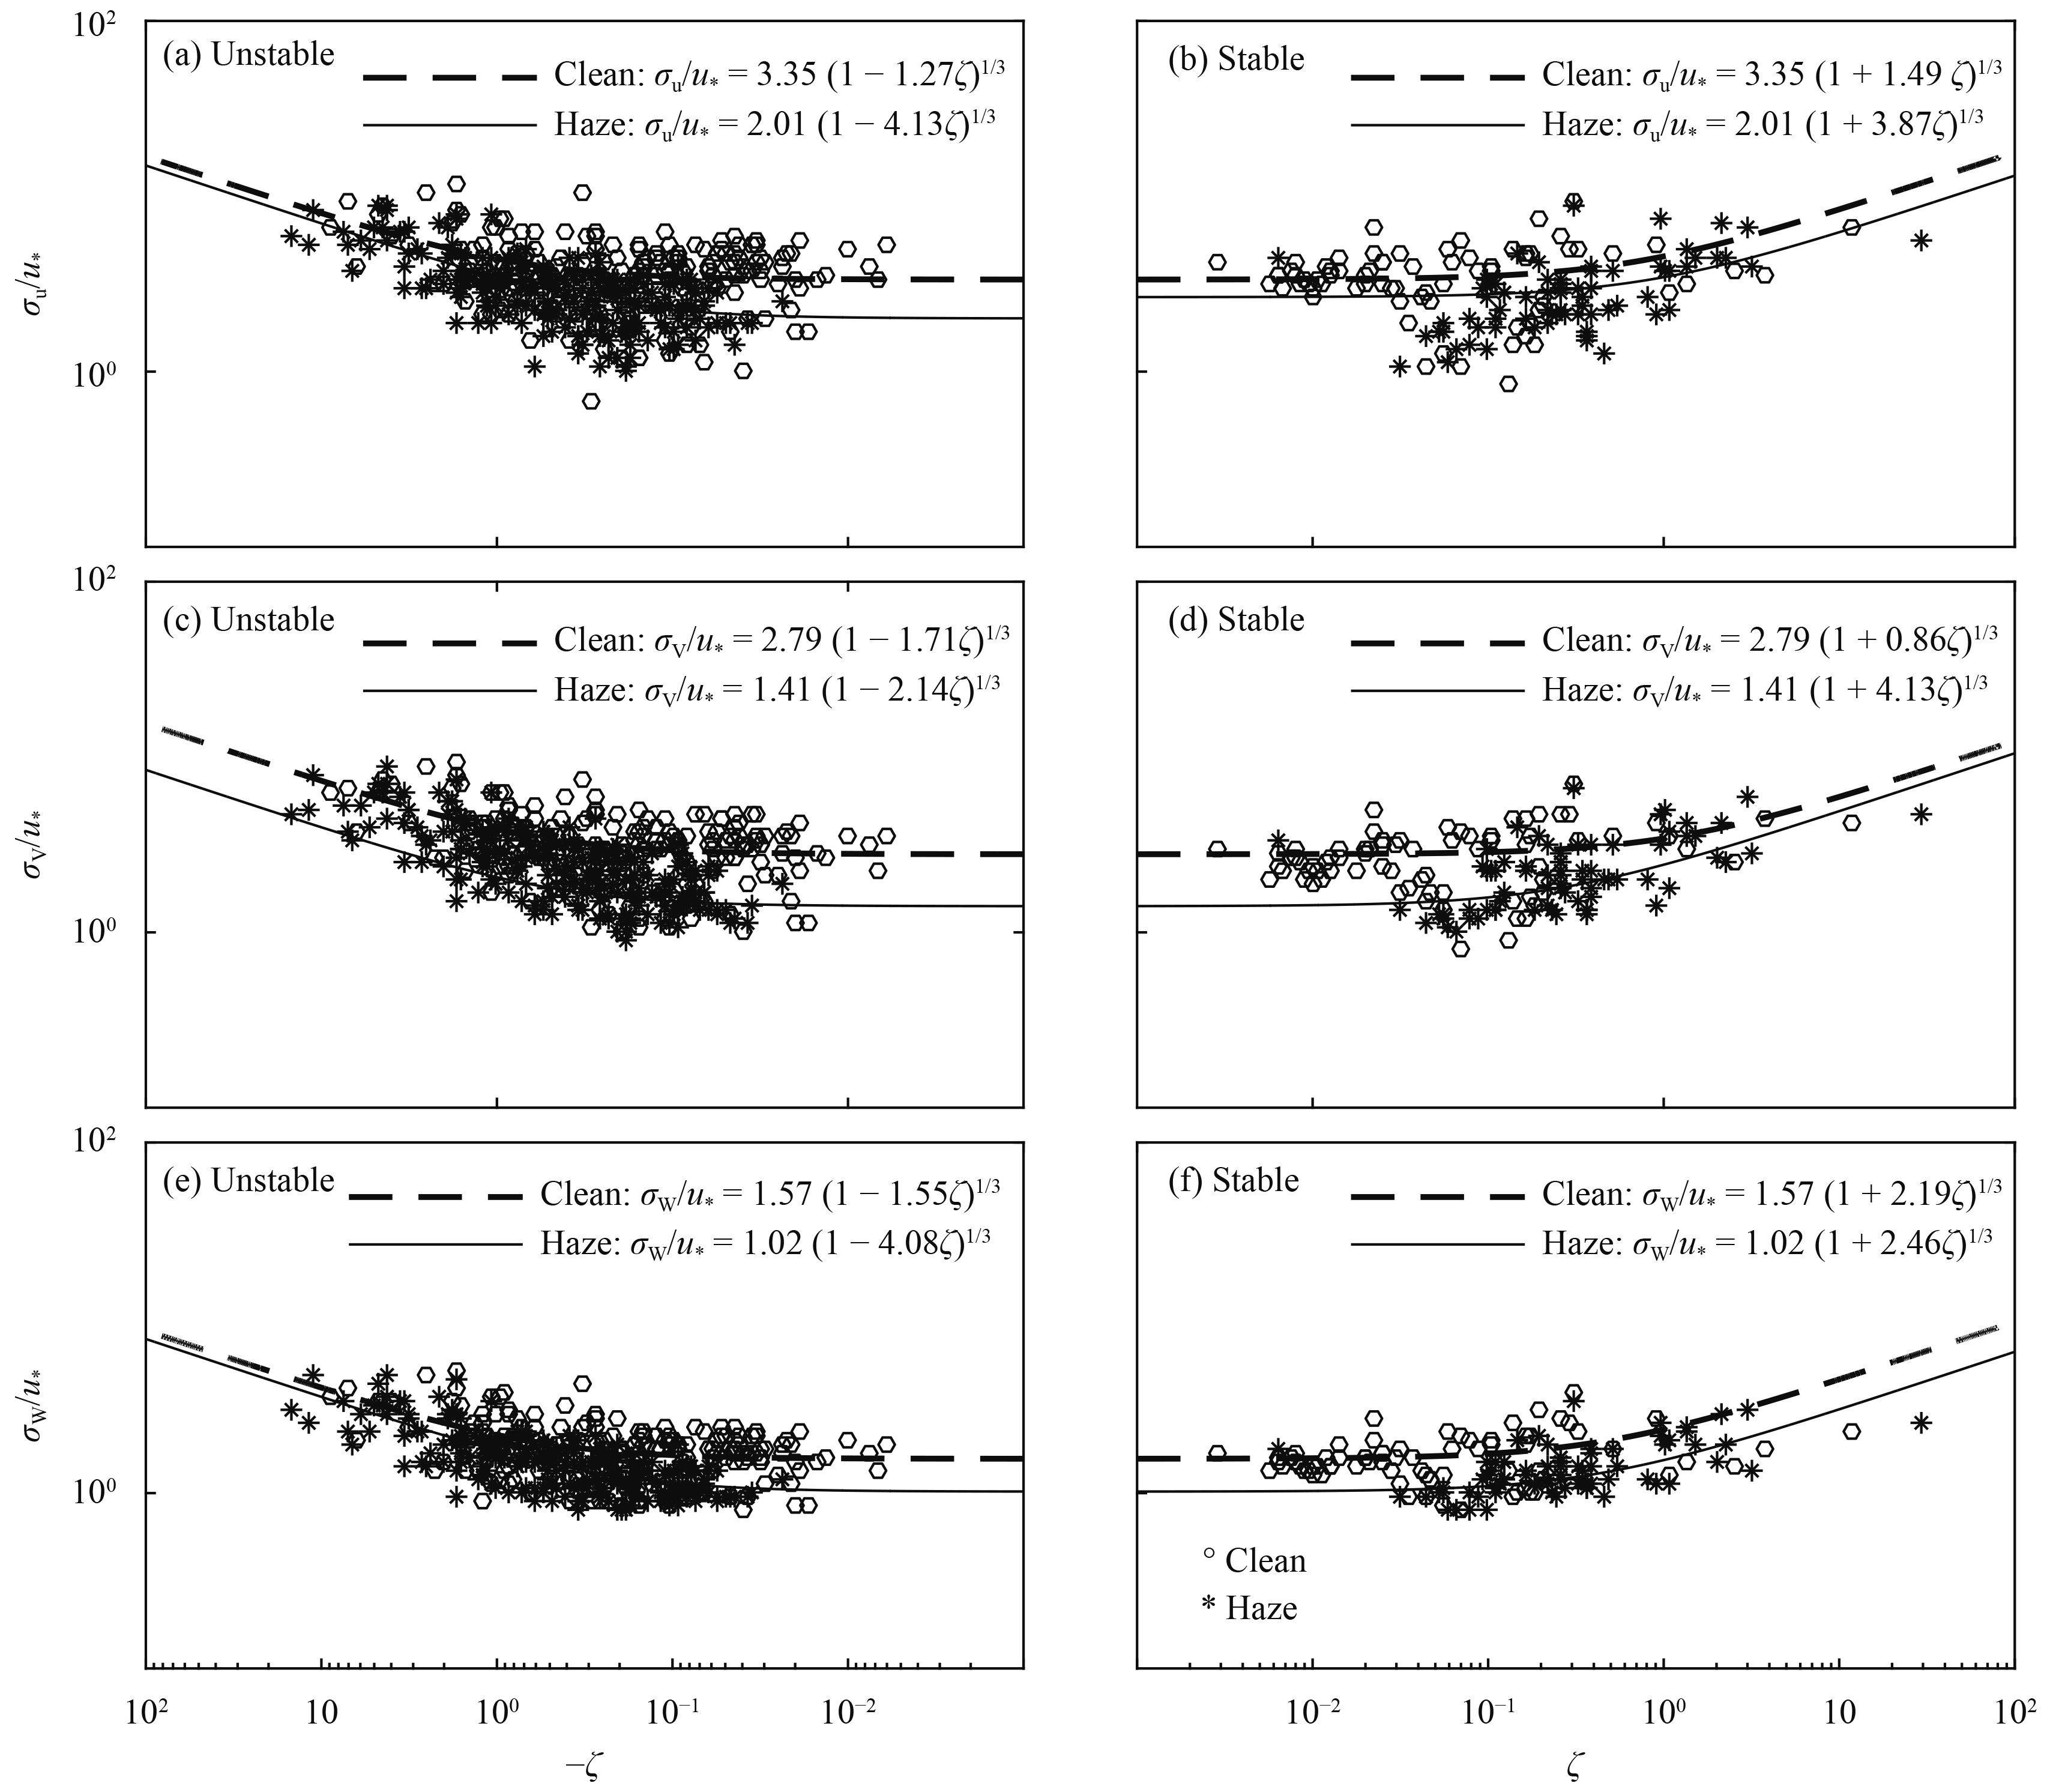
Figure 4 shows the relationship between the normalized standard deviations σu/u*, σv/u*, and σw/u* of the three wind speed components and the stability parameter ζ [(z–d)/L] in polluted and clean weather in the Beijing area from 6 December 2016 to 9 January 2017. The zero displacement (d) is 20 m (Xu et al., 2009). Figure 4 shows that in both polluted and clean weather, the relation between the normalized standard deviations of the horizontal and vertical wind speeds and the stability parameter z/L follow a one-third power law in both stable and unstable layers. The normalized standard deviation was more dispersed in the horizontal direction (Figs. 4a–d) than in the vertical direction (Figs. 4e, f). This is consistent with the results presented by Zhang et al. (2004) and Ma et al. (2002) and shows that the physical characteristics of the land surface, such as topography and roughness, have less effect on the statistical properties of the vertical wind speed than on the horizontal wind speed.
According to the Monin–Obukhov similarity theory for the surface layer, the normalized standard deviations of the horizontal and vertical wind speeds are almost constant under near-neutral conditions (here, –0.01 < ζ < 0.01). Figures 4a, 4c, and 4e show that the values in clean weather (circles) are higher than those in haze weather (stars) under unstable conditions. The normalized standard deviations of the horizontal and vertical wind speeds were different in polluted and clean weather under neutral conditions: σu/u*=2.01, σv/u*=1.41, and σw/u*=1.02, under polluted conditions and σu/u*=3.35, σw/u*=2.79, and 1.57 under clean conditions. The turbulence was weak throughout the pollution period. The results in the u and v directions were similar during polluted and clean periods. This shows that the turbulence in the horizontal directions was similar and that the constants were larger in the u and v directions than in the w direction, indicating that the TKE was weak in the vertical direction. This is consistent with the results of Sorbjan (1988), Gao et al. (2006), and Zhang et al. (2016).
|
| Figure 4 Normalized standard deviations of the wind speed in the horizontal and vertical directions σu/u*, σv/u*, and σw/u* as functions of the stability parameter ζ. The solid (dashed) line in the figure represents results for polluted (clean) weather. Observations marked with * (°) were made in polluted (clean) weather. |
Table 1 presents a comparison of the normalized standard deviation of the wind speed for neutral stratification from prior research and in this study. Compared with the classic values for a flat land surface given by Panofsky and Dutton (1984), the results presented in this study were larger in clean weather and smaller in polluted weather. The results were obtained at 47-m height in the the middle and upper layers of the city canopy in Beijing (Zhang et al, 1991; Su and Hong, 1994; Zhang et al, 2004; Zhou et al, 2005). In general, the thickness of the urban canopy has increased with the continuous development of urbanization in Beijing. The results in this paper obtained at 25-m height represent the turbulence characteristics of the present urban canopy in Beijing. The rate of generation of turbulence in the urban canopy is higher as we move closer to the top of the canopy (Wang and Sun, 2014). Therefore, the normalized standard deviations of the horizontal and vertical wind speeds under near-neutral conditions in these studies are less than the results obtained in clean weather.
| Reference | Surface type | σu/u* | σv/u* | σw/u* | z0 | |
| Panofsky and Dutton (1984) | Flat surface | 2.39 ± 0.03 | 1.92 ± 0.05 | 1.25 ± 0.03 | 0.7–1.7 | |
| Zhang et al. (1991) | Beijing suburbs | 2.30 | 1.62 | 1.23 | 0.63 | |
| Roth (1993) | Vancouver suburbs | 2.30 | 1.70 | 1.20 | 0.5 | |
| Su and Hong (1994) | Beijing suburbs | 2.33 | 1.97 | 1.16 | 0.63 | |
| Zhang et al. (2004) | Beijing suburbs | 1.95 | 1.36 | 1.20 | 0.37 | |
| Zhou et al. (2005) | Beijing city | 1.73 | 1.50 | 1.40 | 1.38 | |
| Wood et al. (2010) | London city | 2.30 | 1.85 | 1.35 | 0.87 | |
| This work (2018) | Haze | Beijing city | 2.01 | 1.41 | 1.02 | 1.23 |
| Clean | 3.35 | 2.79 | 1.57 | |||
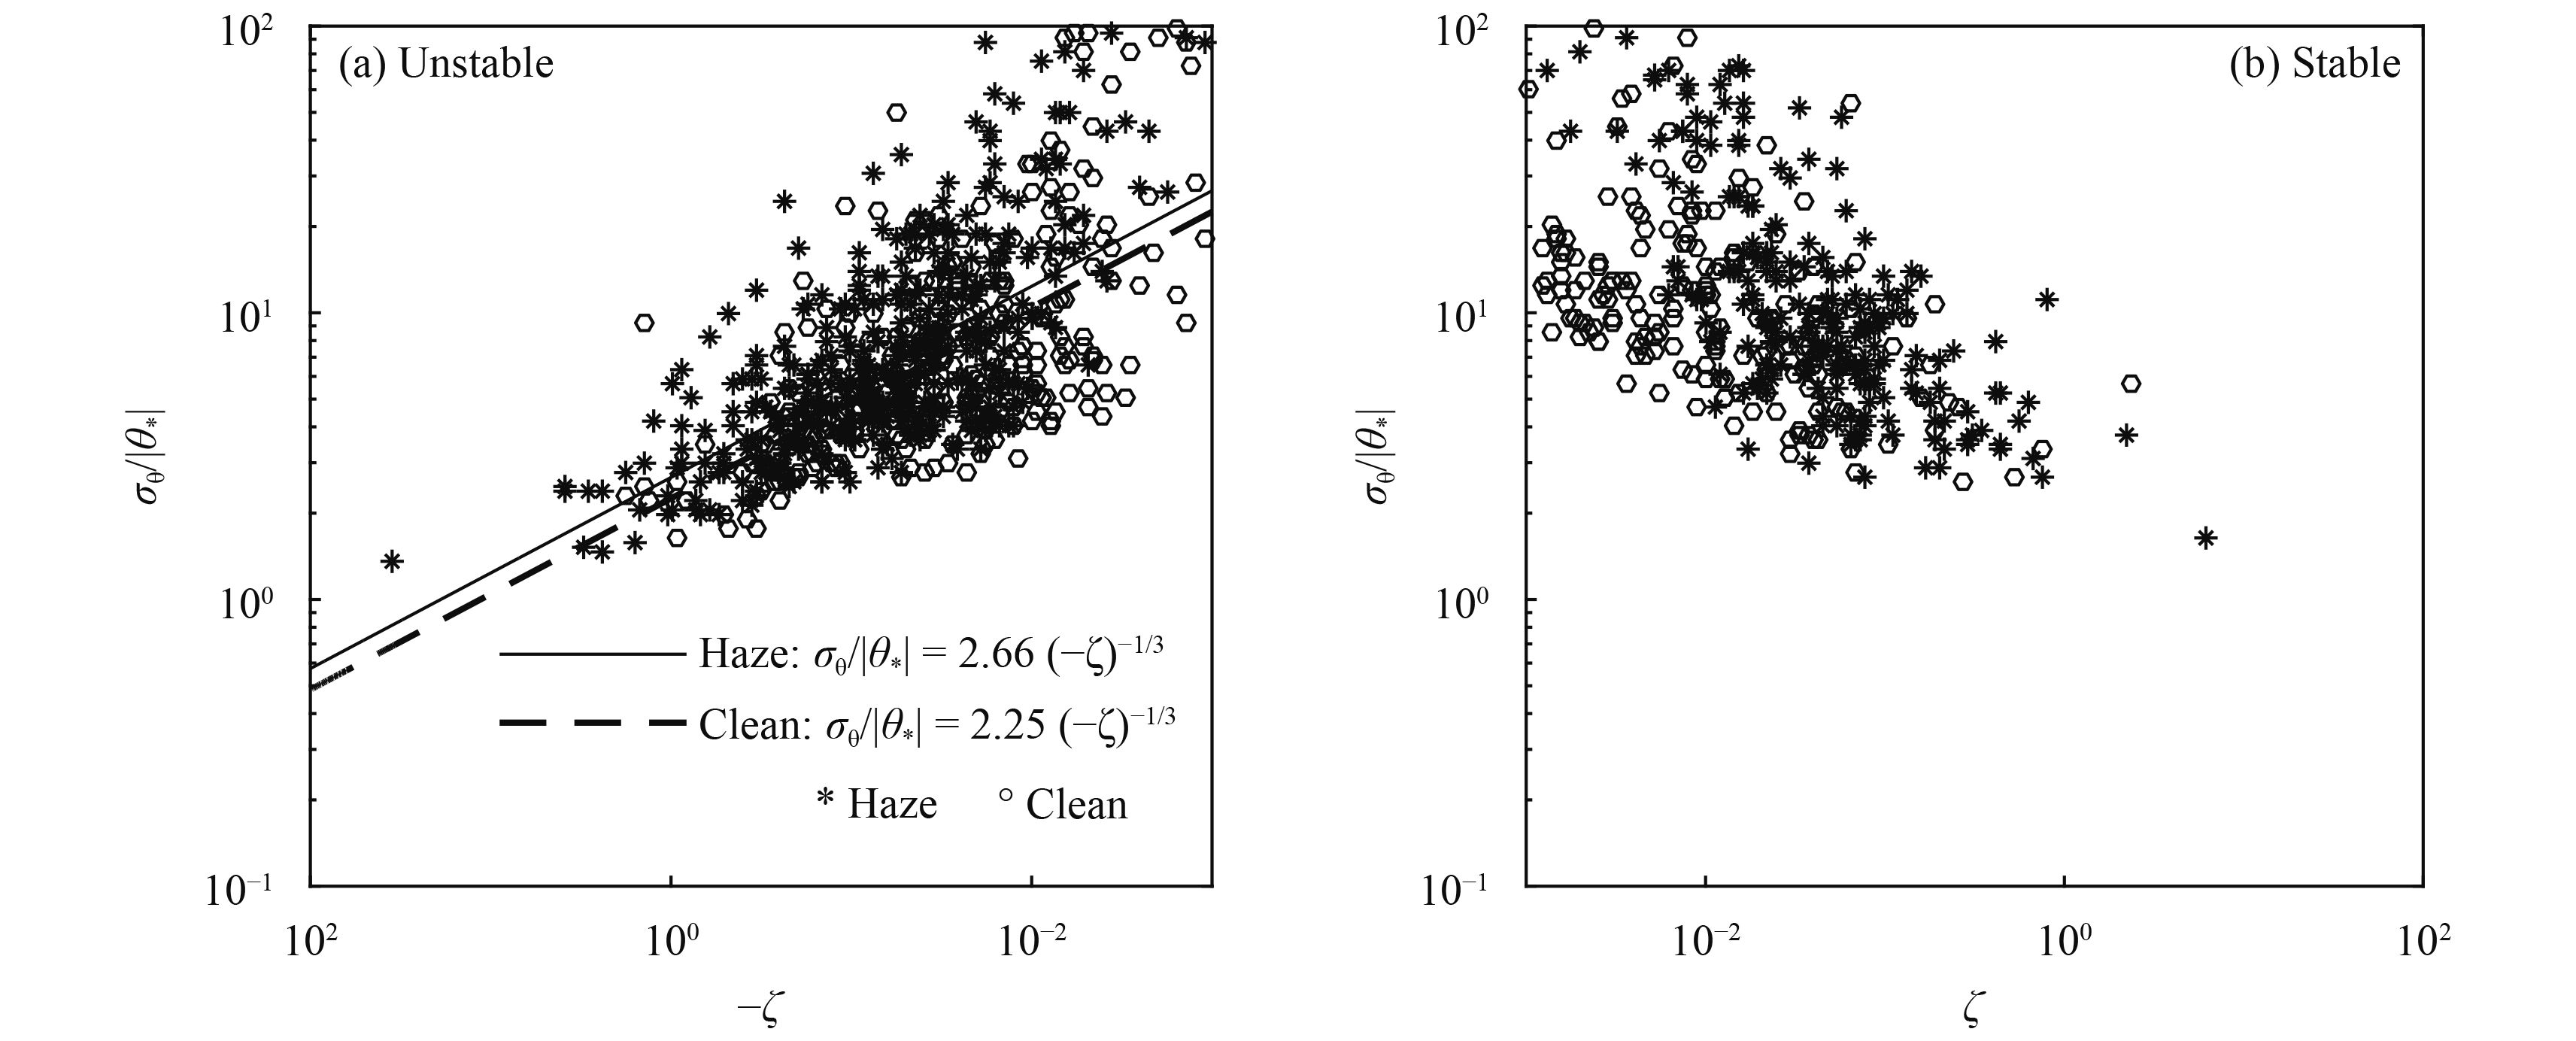
Figure 5 shows the relationship between the normalized standard deviation of the potential temperature and the stability parameter ζ. With unstable stratification, the normalized standard deviation of the potential temperature σθ/|θ*| fits the function ζ–1/3. The best-fit curve was σθ/|θ*| = 2.66(–ζ)–1/3 (ζ < 0) during polluted periods and σθ/|θ*| = 2.25(–ζ)–1/3 (ζ < 0) during clean periods, with some scatter. The dimensionless constant was smaller during clean periods (2.25) than during polluted weather (2.66). This was consistent with the conclusion of Li et al. (2015) for pollution episodes in the Nanjing area. Our values were much higher than the typical value of 0.95 presented in Wyngaard et al. (1971) using data from Kansas grassland in the USA; the difference should relate to the different land surface types near the observation stations. Our observation station is located in an urban area, near an urban canopy area in the lower part of the rough sublayer of the atmospheric boundary layer. In that location, σθ/|θ*| is affected by all types of surface heat, which may have increased the dimensionless constant. With stable stratification, σθ/|θ*| was more discrete and had no apparent pattern of distribution. The normalized standard deviation of the moisture content σq/|q*| for unstable and stable stratification was discretely related to the stability parameter ζ (figure omitted), consistent with the conclusions of Zhang et al. (2016). Zhang et al. (2016) found that the normalized standard deviation of the moisture content during winter was more discrete due to the dynamic and thermal characteristics of the atmosphere in winter.
|
| Figure 5 Normalized standard deviation of the potential temperature σθ/|θ*| as a function of the stability parameter ζ. |
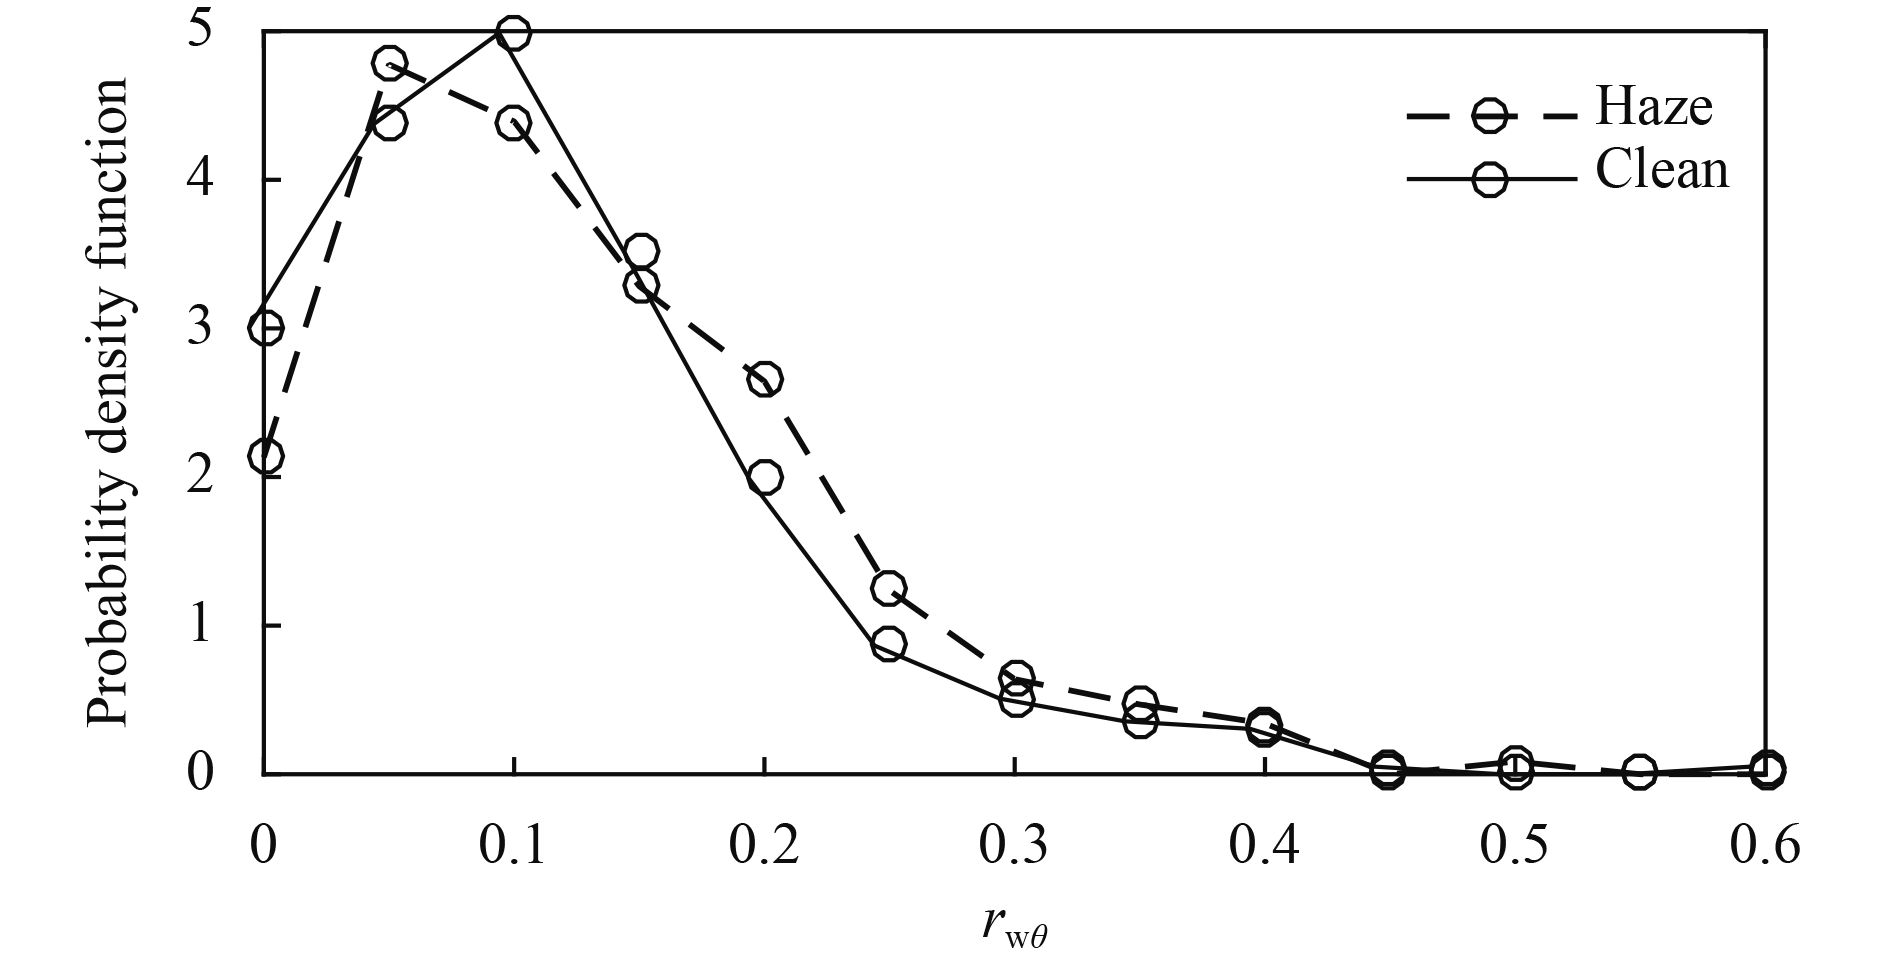
Figure 6 shows the probability density function of the correlation coefficient rwθ between the vertical wind speed and the potential temperature. It shows that the probability of rwθ between 0 and 0.05 was the greatest in polluted weather. The probability of rwθ between 0.05 and 1 was the greatest in clean weather. Therefore, from the perspective of probability, rwθ was smaller in polluted weather than in clean weather. The correlation coefficient of the vertical wind speed and the potential temperature (

|
(1) |
According to Fig. 4f, σw/u* was smaller in polluted weather than in clean weather and was smaller in polluted weather than in clean weather. We can therefore conclude that σθ/|θ*| was larger in polluted weather than in clean weather based on Eq. (1). This conclusion is consistent with that in Fig. 5.
|
| Figure 6 Probability density function of the correlation coefficient between the vertical wind speed and the potential temperature. |
Figure 7 shows the turbulence energy spectrum for the horizontal and vertical wind speeds in polluted and clean weather. The horizontal axis is the dimensionless frequency f = n(z – d)/ L, where n is the natural frequency, z is the measurement altitude (25 m), and d is the zero displacement (20 m). The vertical axis is the normalized energy spectral density for the horizontal and vertical components of the wind speed
The normalized wind speed energy spectrum in the low-frequency band was usually distributed around the stability parameter (z – d)/ L. In clean weather, it was consistent with that reported by Panofsky and Dutton (1984)—that is, the normalized turbulence energy profiles for different atmospheric stratifications in an inertial subarea merged into a single line. In the energy vortex area, the curves of the normalized wind speed energy spectrum were arranged in order from unstable to stable stratification according to values of the stability parameter (Figs. 7d–f) and the range of variation in the vertical energy spectrum with the stability parameter was narrower than that of the horizontal energy spectrum. In polluted weather, the normalized wind speed energy spectrum in the low-frequency band was not distributed around the stability parameter (Figs. 7a–c), i.e., different from that reported by Panofsky and Dutton (1984).

|
| Figure 7 Normalized turbulence energy spectrum of (a, d) the zonal velocity u; (b, e) the meridional velocity v; and (c, f) the vertical velocity w during (a–c) polluted weather and (d–f) clean weather. |
To investigate the variations in wind speed at different altitudes during episodes of pollution and the effect of updrafts and downdrafts, we selected two pollution episodes, one from 0100 BT 12 to 2300 BT 14 December and the other from 1100 to 2000 BT 21 December.
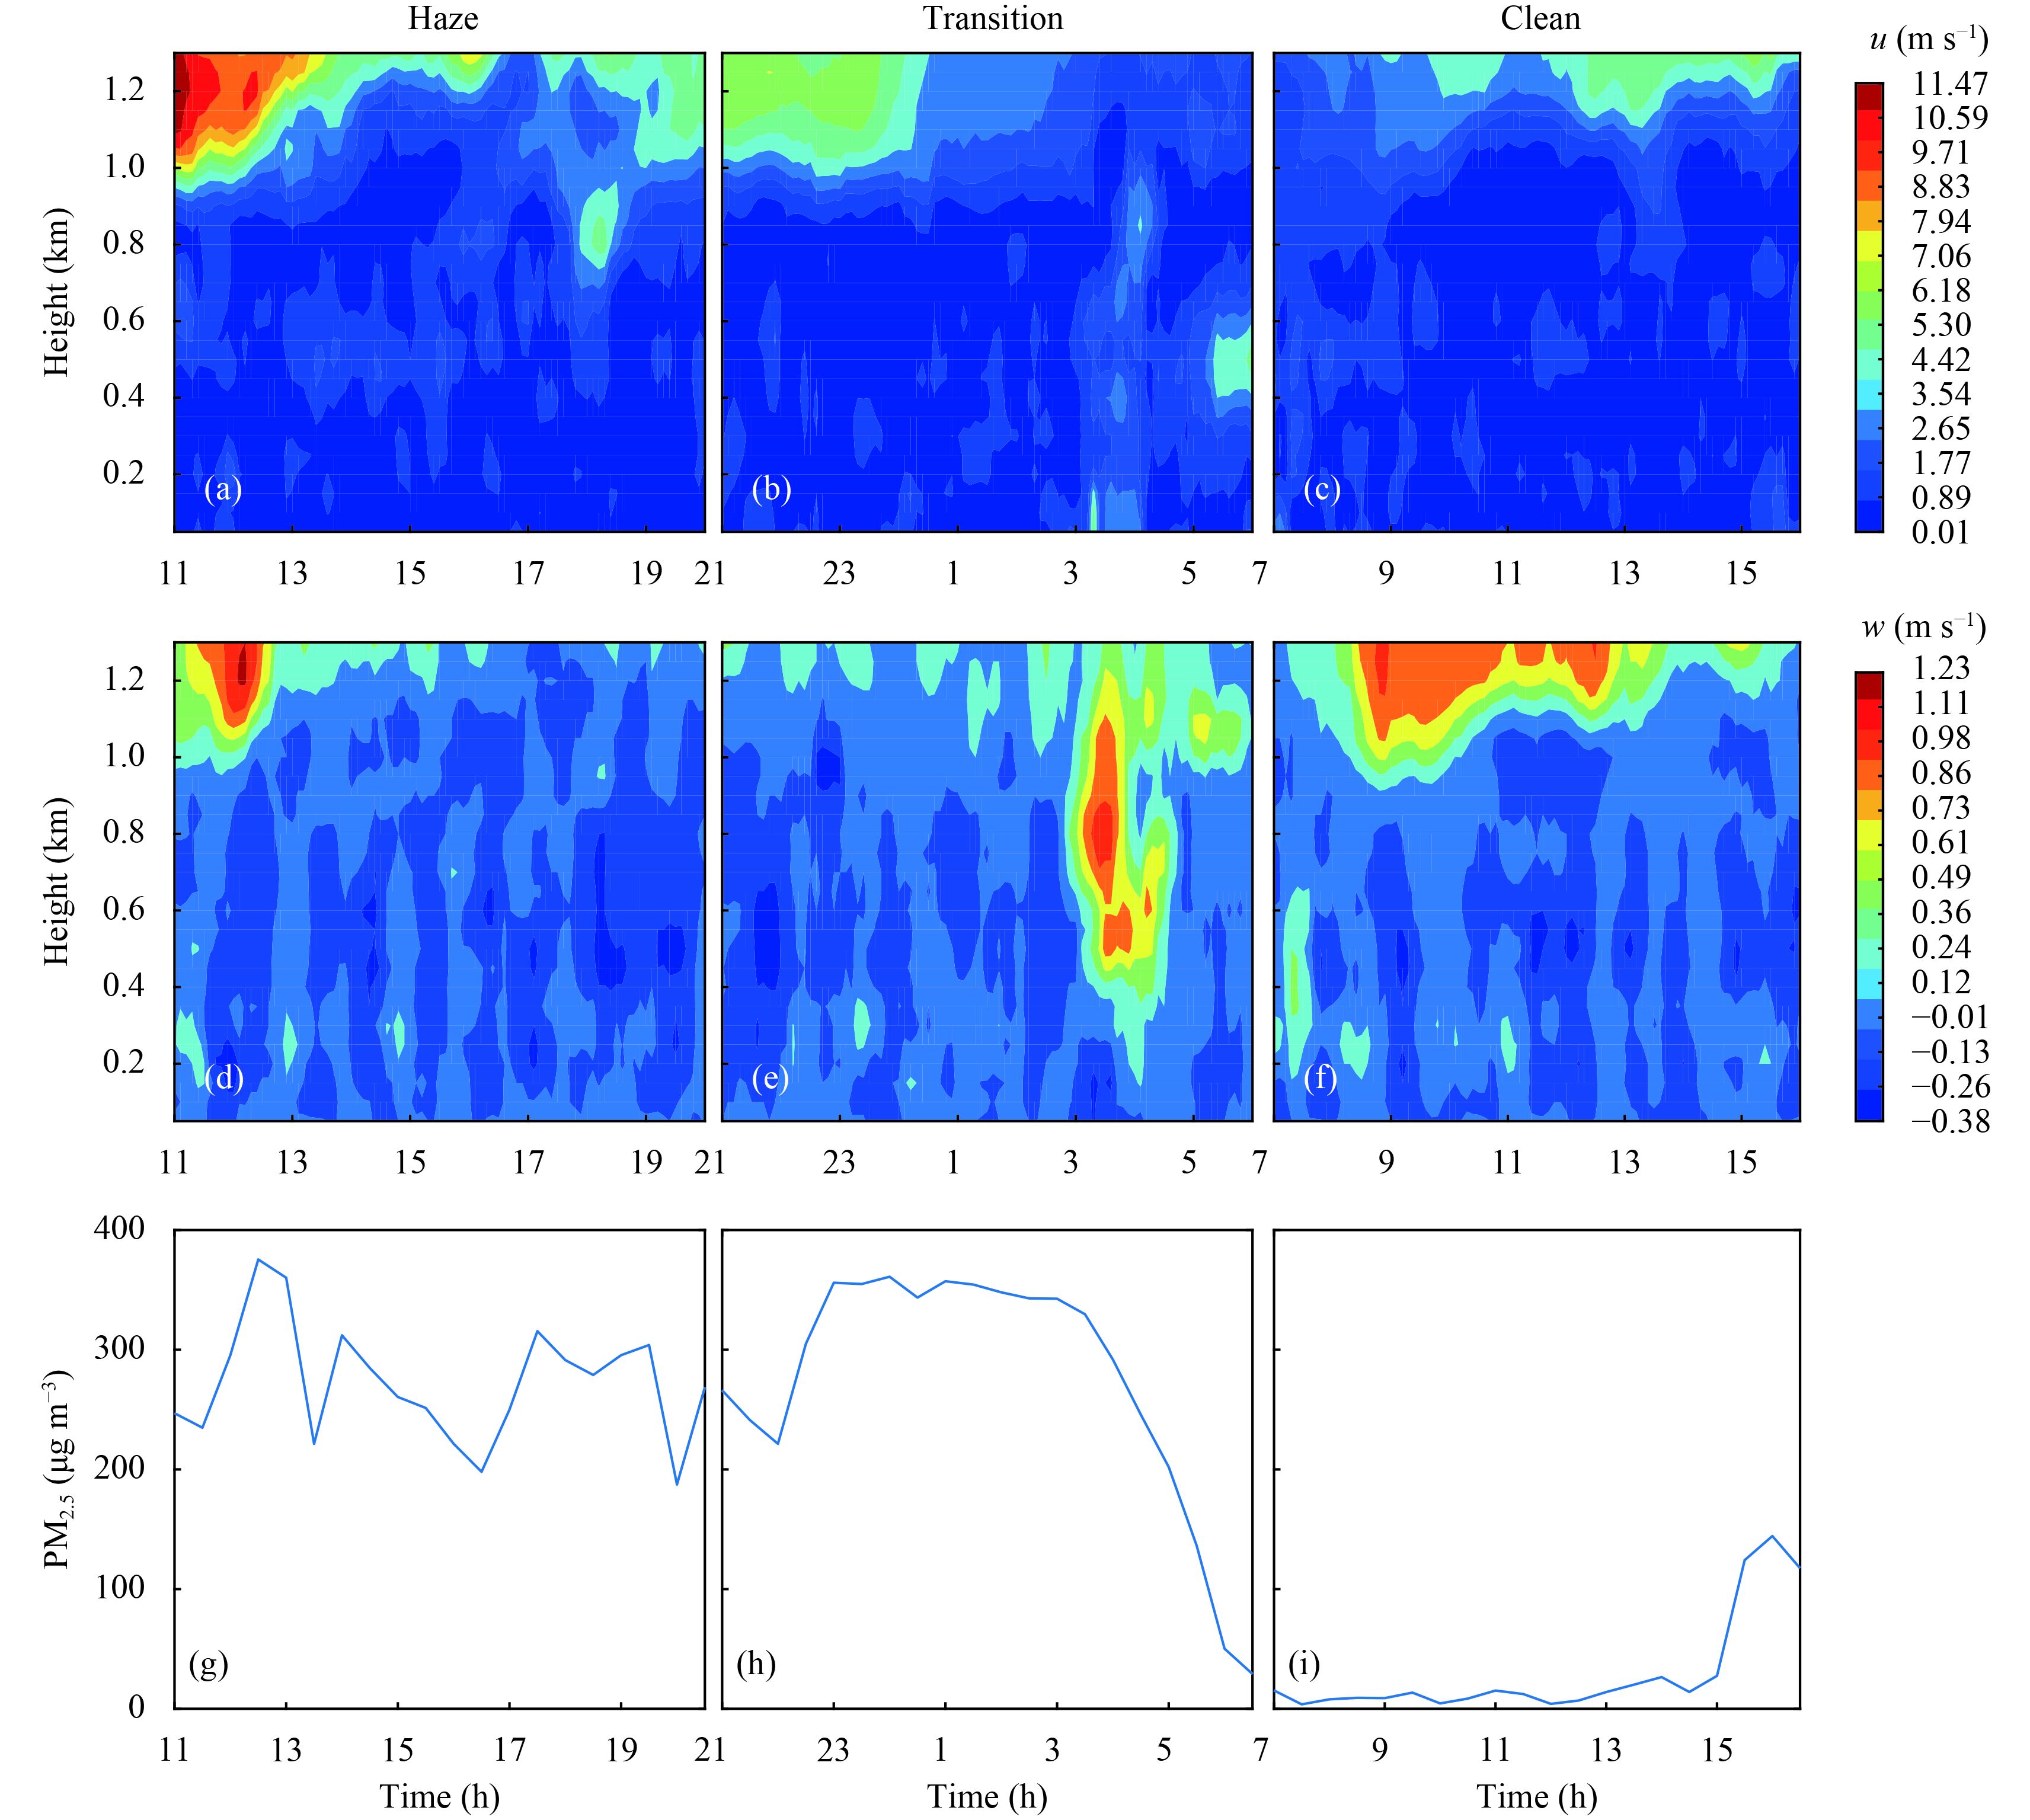
In the first pollution episode, the Beijing area experienced heavy haze pollution between 0100 and 1400 BT 12 December 2016, with a half-hour average PM2.5 concentration > 200 μg m –3 (from here onwards, all PM2.5 concentrations are given as half-hour averages). Between 0100 and 2400 BT 13 December 2016, the PM2.5 concentration decreased rapidly to < 50 μg m –3 as the heavy pollution dissipated. For convenience, this pollution episode is divided into three stages: a pollution stage from 1100 to 2000 BT 12 December; a transition stage from 2100 BT 12 to 0600 BT 13 December; and a clean stage from 0700 to 1600 BT 13 December.
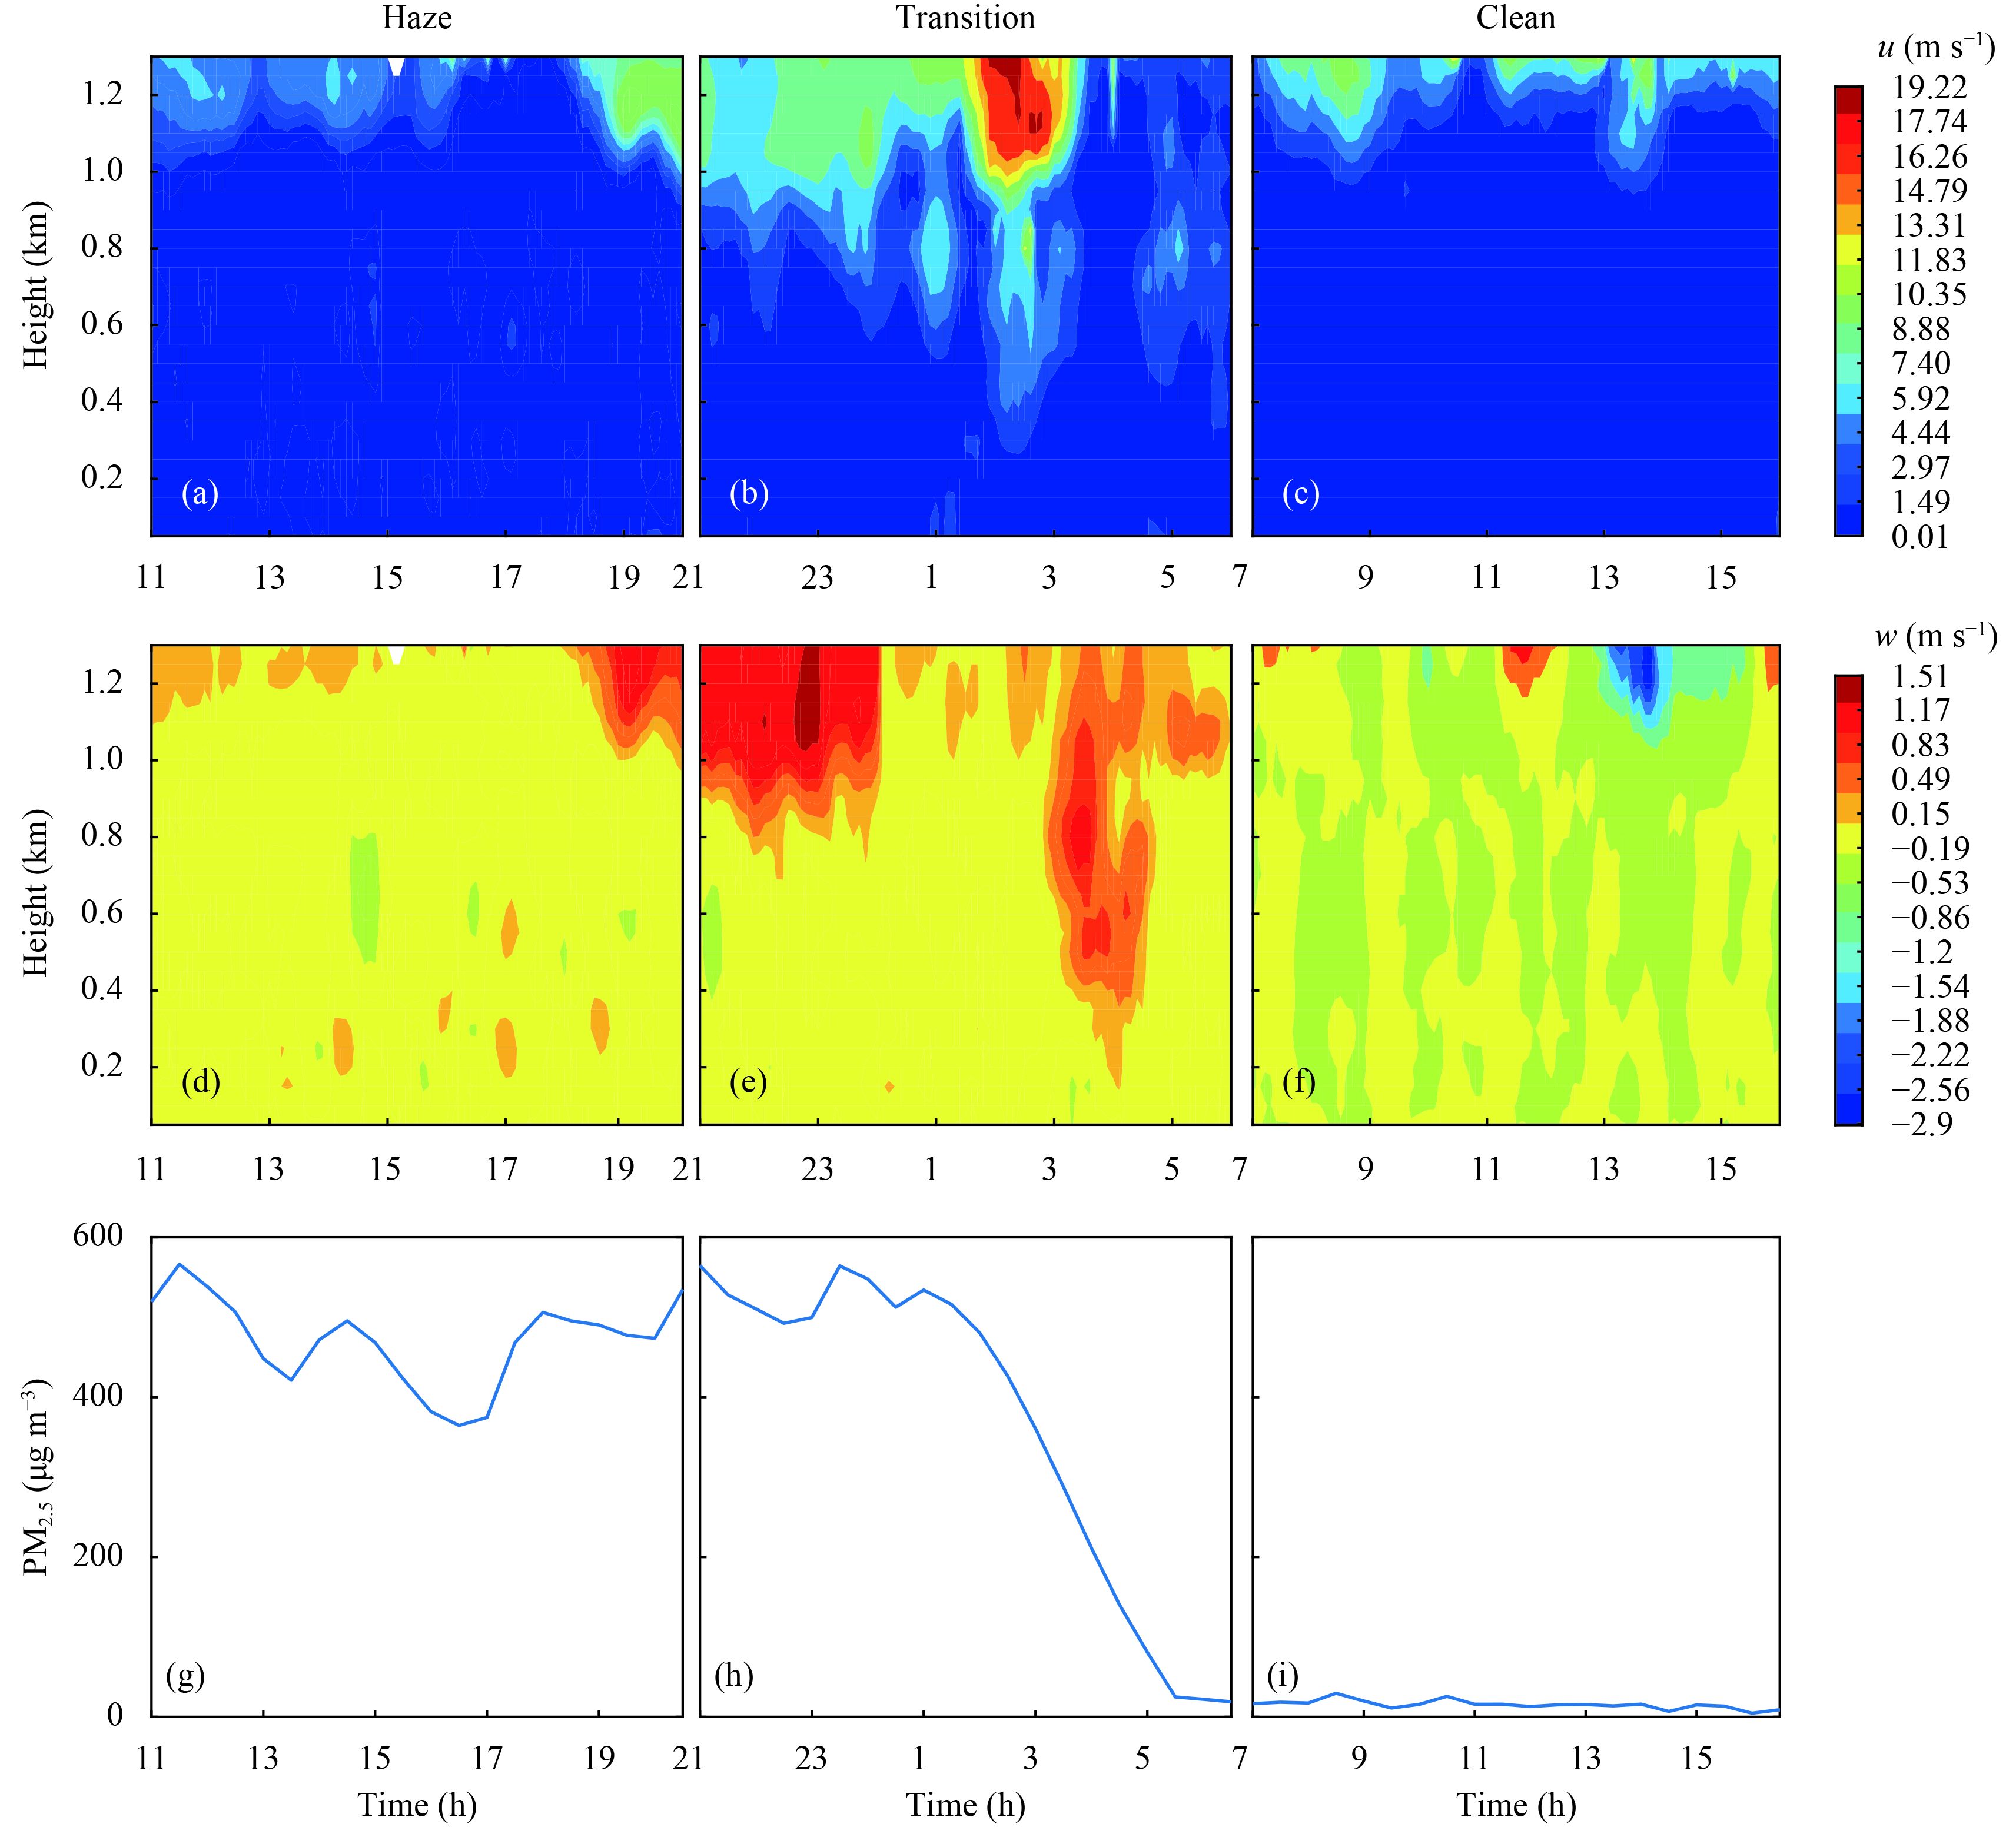
During the second pollution episode, the PM2.5 concentration was > 400 μg m –3 between 0000 BT 21 and 0000 BT 22 December. It then decreased rapidly to < 50 μg m –3 between 0000 BT 22 and 0000 BT 24 December. Like the first episode, the second episode was divided into three stages: a pollution stage from 1100 to 2000 BT 21 December; a transition stage from 2100 BT 21 to 0600 BT 22 December; and a clean stage from 0700 to 1600 BT 22 December.
Figures 8 and 9 show the horizontal and vertical wind speed over time and the time series of the PM2.5 concentration during the two pollution episodes, respectively. During the polluted period 12–13 December, the horizontal wind speed near the surface layer was < 1 m s –1 (Fig. 8a) and the vertical wind speed exhibited weak convective motion with both updrafts and downdrafts of about 0.1 m s–1 below a height of 1 km (Fig. 8b). The PM2.5 concentration in this stage was between 200 and 400 μg m–3 and remained > 200 μg m –3 (Fig. 8g). In the transition stage before 2300 BT 12 December, the PM2.5 concentration remained high at about 360 μg m–3 due to the low vertical and horizontal wind speeds and the weak downdraft seen in the near-surface vertical velocity. Between 0300 and 0400 BT 13 December, the horizontal wind speed at heights below 200 m increased strongly from about 2 to 4–5 m s–1. At the same time, this increasing trend spread to higher levels and strong updrafts occurred at heights between 100 m and 1 km, as shown in the cross-section of the vertical wind speed (Fig. 8e). The corresponding PM2.5 concentration decreased rapidly (Fig. 8h) from 370 to about 50 μg m–3 at 3 h. In the clean stage, the horizontal and vertical wind speeds were low and varied steadily with time (Figs. 8c, f, i).
Between 21 and 22 December, the horizontal and vertical wind speeds were low, as in the earlier pollution stage. There was weak convective motion near the surface and the PM2.5 concentration was between 390 and 570 μg m–3 (Figs. 9a, d). During the transition stage between 2100 and 2400 BT 21 December, there was a strong updraft above 800 m that featured a high horizontal wind speed, but this was not transferred to the near-surface layer, which caused the PM2.5 concentration to remain high until 0100 BT 22 December.
Between 0200 and 0300 BT 22 December, high wind speeds in the upper boundary layer tended to spread to lower levels (Fig. 9b). Over 400–800 m, the horizontal wind speed increased to about 5 m s–1; at the same time, there was no clear convective motion in the vertical, but the PM2.5 concentration started to decrease. Between 0300 and 0400 BT 22 December, the horizontal wind speed remained constant, but there was a strong updraft and the PM2.5 concentration continuously decreased to < 50 μg m –3 at 0500 BT. The horizontal and vertical wind speeds varied little with time in the clean stage.
In summary, during pollution periods, the horizontal wind speed near the surface was fairly low and the vertical convective motion was weak, so the PM2.5 concentration fluctuated over a small range. During the transition periods, the horizontal wind speed began to increase first at the upper levels and later the lower levels, decreasing the concentration of PM2.5. If accompanied by a strong updraft, both the increased horizontal velocity and the updraft could cause the PM2.5 concentration to decrease rapidly and the air quality changed from very polluted to good in 2–3 h. Therefore, strong variations in the horizontal and vertical wind speeds were important in changing the PM2.5 concentrations in polluted weather.
|
| Figure 8 Time series for different stages of the pollution development process between 12 and 13 December 2016. (a–c) Horizontal wind speed, (d–f) vertical wind speed, and (g–i) PM2.5 concentration. |
|
| Figure 9 As in Fig. 8, but for 21 and 22 December 2016. |
We analyzed the structure and evolution of turbulent transfer and wind profiles in the atmospheric boundary layer with respect to aerosol concentrations during the heavy haze episodes in Beijing from 6 December 2016 to 9 January 2017. The study was based on turbulence data collected at Peking University’s atmospheric science and environment observation station. The main conclusions are as follows.
(1) There were a strong negative correlation between the wind speed and PM2.5 mass concentrations and a strong positive correlation between the moisture content and PM2.5 mass concentrations.
(2) The sensible heat flux had obvious and consistent diurnal variations during both polluted and clean weather, but with a greater daytime maximum during clean wea-ther. Meanwhile, the TKE was high and had an obvious diurnal variation during clean weather, but was low with no obvious diurnal variation during heavy haze episodes.
(3) Under both clean and heavily polluted conditions, the normalized standard deviations of the horizontal and vertical wind speeds were proportional to the 1/3 power of the stability parameter ζ. The deviations were smaller in polluted weather than in clean weather under near-neutral conditions. With unstable stratification, the normalized standard deviation of potential temperature σθ/|θ*| was roughly proportional to the stability parameter ζ to the –1/3 power and was larger in polluted weather than in clean weather.
(4) In both polluted and clean weather, the turbulence energy spectra of the horizontal and vertical wind speeds were scaled with the –2/3 power in the high-frequency band. In the low-frequency band, the wind speed energy spectrum was distributed around the stability parameter in clean weather, but was not related to atmospheric stratification in polluted weather.
(5) The horizontal wind speed started to increase from high to low altitudes in the dissipation period of heavy pollution and was accompanied by a strong vertical updraft, which caused the PM2.5 concentration to decrease rapidly. The larger horizontal wind speed and the stronger vertical updraft were important dynamic factors affecting the dissipation of heavy pollution.
| Barlow, J. F., T. M. Dunbar, E. G. Nemitz, et al., 2011: Boundary layer dynamics over London, UK, as observed using Doppler lidar during REPARTEE-II. Atmos. Chem. Phys., 11, 2111–2125. DOI:10.5194/acp-11-2111-2011 |
| Bilde, M., and B. Svenningsson, 2004: CCN activation of slightly soluble organics: The importance of small amounts of inorganic salt and particle phase. Tellus B, 56, 128–134. DOI:10.3402/tellusb.v56i2.16406 |
| Broersen, P. M. T., 2002: Automatic spectral analysis with time series models. IEEE Trans. Instrum. Meas., 51, 211–216. DOI:10.1109/19.997814 |
| Chambers, S. D., F. J. Wang, A. G. Williams, et al., 2015: Quantifying the influences of atmospheric stability on air pollution in Lanzhou, China, using a radon-based stability monitor. Atmos. Environ., 107, 233–243. DOI:10.1016/j.atmosenv.2015.02.016 |
| Chen, Z. H., S. Y. Cheng, J. B. Li, et al., 2008: Relationship between atmospheric pollution processes and synoptic pressure patterns in northern China. Atmos. Environ., 42, 6078–6087. DOI:10.1016/j.atmosenv.2008.03.043 |
| Deng, X. J., F. Li, D. Wu, et al., 2011: Turbulence and mass exchange characteristics of typical clean and pollution process over Guangzhou region. China Environ. Sci., 31, 1424–1430. |
| Fu, G. Q., W. Y. Xu, R. F. Yang, et al., 2014: The distribution and trends of fog and haze in the North China Plain over the past 30 years. Atmos. Chem. Phys., 14, 11949–11958. DOI:10.5194/acp-14-11949-2014 |
| Gao, Z. Q., L. G. Bian, Z. G. Chen, et al., 2006: Turbulent variance characteristics of temperature and humidity over a non-uniform land surface for an agricultural ecosystem in China. Adv. Atmos. Sci., 23, 365–374. DOI:10.1007/s00376-006-0365-y |
| Grant, A. L. M., and R. D. Watkins, 1989: Errors in turbulence measurements with a sonic anemometer. Bound.-Layer Meteor., 46, 181–189. DOI:10.1007/BF00118453 |
| Guo, S., M. Hu, M. L. Zamora, et al., 2014: Elucidating severe urban haze formation in China. Proc. Nat. Aca. Sci. USA, 111, 17373–17378. DOI:10.1073/pnas.1419604111 |
| Holzworth, G. C., 1967: Mixing depths, wind speeds and air pollution potential for selected locations in the United States. J. Appl. Meteor., 6, 1039–1044. DOI:10.1175/1520-0450(1967)006<1039:MDWSAA>2.0.CO;2 |
| Kaimal, J. C., J. C. Wyngaard, Y. Izumi, et al., 1972: Spectral characteristics of surface-layer turbulence. Quart. J. Roy. Meteor. Soc., 98, 563–589. DOI:10.1002/(ISSN)1477-870X |
| Kang, H. Q., B. Zhu, J. F. Su, et al., 2013: Analysis of a long-lasting haze episode in Nanjing, China. Atmos. Res., 120–121, 78–87. DOI:10.1016/j.atmosres.2012.08.004 |
| Li, M. N., S. J. Niu, S. T. Zhang, et al., 2015: Comparative study of turbulent characteristics between the fog day and haze day in Nanjing. Acta Meteor. Sinica, 73, 593–608. DOI:10.11676/qxxb2015.032 |
| Li, W. J., S. Z. Zhou, X. F. Wang, et al., 2011: Integrated evaluation of aerosols from regional brown hazes over northern China in winter: Concentrations, sources, transformation, and mixing states. J. Geophys. Res., 116, D09301. DOI:10.1029/2010JD015099 |
| Li, Z. Q., X. Gu, L. Wang, et al., 2013: Aerosol physical and chemical properties retrieved from ground-based remote sensing measurements during heavy haze days in Beijing winter. Atmos. Chem. Phys., 13, 10171–10183. DOI:10.5194/acp-13-10171-2013 |
| Liu, L. X., X. L. Lin, and W. D. Guo, 2014: A study of the impacts of aerosols on micrometeorological characteristics and energy budget in the western Yangtze River delta. J. Nanjing Univ., 6, 800–809. DOI:10.13232/j.cnki.jnju.2014.06.008 |
| Liu, M. X., H. S. Zhang, X. Z. Song, et al., 2008: Spectral characteristics of atmospheric turbulence over various surface conditions. Acta Sci. Nat. Univ. Pekinensis, 44, 391–398. DOI:1000-0534(2004)05-0598-07 |
| Liu, Y., F. Hu, S. G. Wang, et al., 2003: Preliminary study of the variety of stable atmospheric boundary layer in Lanzou city zone. J. Graduate School Chinese Acad. Sci., 20, 482–487. |
| Ma, J. Z., X. B. Xu, C. S. Zhao, et al., 2012: A review of atmospheric chemistry research in China: Photochemical smog, haze pollution, and gas-aerosol interactions. Adv. Atmos. Sci., 29, 1006–1026. DOI:10.1007/s00376-012-1188-7 |
| Ma, Y. M., W. Q. Ma, Z. Y. Hu, et al., 2002: Similarity analysis of atmospheric turbulent intensity over grassland surface of Qinghai–Xizang Plateau. Plateau Meteor., 21, 514–517. |
| Panofsky, H. A., and J. A. Dutton, 1984: Atmospheric Turbulence—Models and Methods for Engineering Applications. John Wiley & Sons, 156–173. |
| Qi, Y. Q., J. M. Wang, L. Jia, et al., 1996: A study of turbulent transfer characteristics in Wudaoliang area of Qinghai–Xizang Plateau. Plateau Meteor., 15, 172–177. |
| Quan, J. N., Y. Gao, Q. Zhang, et al., 2013: Evolution of planetary boundary layer under different weather conditions, and its impact on aerosol concentrations. Particuology, 11, 34–40. DOI:10.1016/j.partic.2012.04.005 |
| Rigby, M., and R. Toumi, 2008: London air pollution climatology: Indirect evidence for urban boundary layer height and wind speed enhancement. Atmos. Environ., 42, 4932–4947. DOI:10.1016/j.atmosenv.2008.02.031 |
| Roth, M., 1993: Turbulent transfer relationships over an urban surface. II: Integral statistics. Quart. J. Roy. Meteor. Soc., 119, 1105–1120. DOI:10.1002/(ISSN)1477-870X |
| Sorbjan, Z., 1988: Local similarity in the convective boundary layer (CBL). Bound.-Layer Meteor., 45, 237–250. DOI:10.1007/BF01066672 |
| Su, H. B., and Z. X. Hong, 1994: An experimental study of turbulence in northern suburban surface layer of Beijing. Chinese J. Atmos. Sci., 18, 739–750. |
| Sun, F., D. W. Zhang, R. W. Sun, et al., 2014: Typical heavy pollution episode analysis on PM2.5 in winter of Beijing . Environ. Monit. China, 30, 1–12. DOI:1008-1534(2015)04-0364-07 |
| Sun, Y. L., G. S. Zhuang, A. H. Tang, et al., 2006: Chemical characteristics of PM2.5 and PM10 in haze–fog episodes in Beijing . Environ. Sci. Technol., 40, 3148–3155. DOI:10.1021/es051533g |
| Wang, G. Y., and J. N. Sun, 2014: Characteristics of turbulence spectra in the urban roughness layer. J. Nanjing Univ., 50, 820–828. DOI:10.1007/s10546-014-9966-7 |
| Wang, W. G., and G. G. Zheng, 2013: Green Book of Climate Change: Annual Report on Actions to Address Climate Change: Focus on Low Carbon Urbanization. Social Sciences Academic Press, 221 pp. (in Chinese) |
| Wang, X. F., W. X. Wang, L. X. Yang, et al., 2012: The secondary formation of inorganic aerosols in the droplet mode through heterogeneous aqueous reactions under haze conditions. Atmos. Environ., 63, 68–76. DOI:10.1016/j.atmosenv.2012.09.029 |
| Wang, Y., G. S. Zhuang, Y. L. Sun, et al., 2006: The variation of characteristics and formation mechanisms of aerosols in dust, haze, and clear days in Beijing. Atmos. Environ., 40, 6579–6591. DOI:10.1016/j.atmosenv.2006.05.066 |
| Wang, Z. S., F. Sun, Q. H. Qiu, et al., 2015: Analyzing characteristics of heavy air pollution events during the winter in urban Beijing. Environ. Sci. Technol., 28, 47–53. DOI:10.3969/j.issn.1674-4829.2015.02.012 |
| Wehner, B., and A. Wiedensohler, 2003: Long term measurements of submicrometer urban aerosols: Statistical analysis for correlations with meteorological conditions and trace gases. Atmos. Chem. Phys., 3, 867–879. |
| Wei, Y. X., Y. Q. Tong, Y. Yan, et al., 2009: The variety of main air pollutants concentration and its relationship with meteorological condition in Nanjing City. Trans. Atmos. Sci., 32, 451–457. |
| Wilczak, J. M., S. P. Oncley, and S. A. Stage, 2001: Sonic anemometer tilt correction algorithms. Bound.-Layer Meteor., 99, 127–150. DOI:10.1023/A:1018966204465 |
| Wood, C. R., A. Lacser, J. F. Barlow, et al., 2010: Turbulent flow at 190-m height above London during 2006–2008. A climatology and the applicability of similarity theory. Bound.-Layer Meteor., 137, 77–96. DOI:10.1007/s10546-010-9516-x |
| Wyngaard, C., R. Coté J., and Izumi O., 1971: Local free convection, similarity, and the budgets of shear stress and heat flux. J. Atmos. Sci., 28, 1171–1182. DOI:10.1175/1520-0469(1971)028<1171:LFCSAT>2.0.CO;2 |
| Xu, Y. Y., S. H. Liu, F. Hu, et al., 2009: Influence of Beijing urbanization on the characteristics of atmospheric boundary layer. Chinese J. Atmos. Sci., 33, 859–867. |
| Xu, Z. W., S. M. Liu, L. J. Gong, et al., 2008: A study on the data processing and quality assessment of the eddy covariance system. Adv. Earth Sci., 23, 357–370. |
| Zhang, A. C., J. Lyu, B. Zhang, et al., 1991: The turbulence characteristics in the boundary layer of the rural area and border of urban area of Beijing. Chinese J. Atmos. Sci., 15, 87–96. |
| Zhang, B., Y. X. Wang, and J. M. Hao, 2014: Simulating aerosol–radiation–cloud feedbacks on meteorology and air quality over eastern China under severe haze conditions in winter. Atmos. Chem. Phys., 15, 2387–2404. DOI:10.5194/acp-15-2387-2015 |
| Zhang, H. B., C. H. Guan, S. X. Huang, et al., 2016: Local similarity study on turbulence of the Haerbaling meteorological tower in Changbai Mountains. J. Meteor. Sci., 36, 474–482. DOI:10.3969/2015jms.0020 |
| Zhang, H. S., F. Y. Li, and J. Y. Chen, 2004: Statistical characteristics of atmospheric turbulence in different underlying surface conditions. Plateau Meteor., 23, 598–604. |
| Zhang, X. Y., Y. Q. Wang, T. Niu, et al., 2012: Atmospheric aerosol compositions in China: Spatial/temporal variability, chemical signature, regional haze distribution and comparisons with global aerosols. Atmos. Chem. Phys., 11, 26571–26615. DOI:10.5194/acpd-11-26571-2011 |
| Zhang, X. Y., J. Y. Sun, Y. Q. Wang, et al., 2013: Factors contributing to haze and fog in China. Chinese Sci. Bull., 58, 1178–1187. DOI:10.1360/972013-150 |
| Zhang, Y. H., M. Hu, L. J. Zhong, et al., 2008: Regional integrated experiments on air quality over Pearl River Delta 2004 (PRIDE-PRD2004): Overview. Atmos. Environ., 42, 6157–6173. DOI:10.1016/j.atmosenv.2008.03.025 |
| Zhao, P. S., X. L. Zhang, X. F. Xu, et al., 2011: Long-term visibility trends and characteristics in the region of Beijing, Tianjin, and Hebei, China. Atmos. Res., 101, 711–718. DOI:10.1016/j.atmosres.2011.04.019 |
| Zhao, X. J., P. S. Zhao, J. Xu, et al., 2013: Analysis of a winter regional haze event and its formation mechanism in the North China Plain. Atmos. Chem. Phys., 13, 5685–5696. DOI:10.5194/acp-13-5685-2013 |
| Zhou, M. Y., W. Q. Yao, X. D. Xu, et al., 2005: Vertical dynamic and thermodynamic characteristics of urban lower boundary layer and its relationship with aerosol concentration over Beijing. Sci. China Ser. D Earth Sci., 48, 25–37. |
 2018, Vol. 32


