 2018, Vol. 32
The Chinese Meteorological Society
Article Information
- QI, Xuefei, Junying SUN, Lu ZHANG, et al., 2018.
- Aerosol Hygroscopicity during the Haze Red-Alert Period in December 2016 at a Rural Site of the North China Plain. 2018.
- J. Meteor. Res., 32(1): 38-48
- http://dx.doi.org/10.1007/s13351-018-7097-7
Article History
- Received June 19, 2017
- in final form November 8, 2017


2. Integrated Ecological–Meteorological Observation and Experimental Station, Chinese Academy of Meteorological Sciences, Beijing 100081
Aerosol hygroscopic growth reflects the effect of relative humidity (RH) on the physical and chemical properties of the particles, which is one of the important properties of aerosols. Aerosol hygroscopicity matters since particles can change both in size and optical properties (scattering coefficient, single scattering albedo, etc.) after they take up water (Sun et al., 2016). Thereby, aerosol hygroscopicity either influences the direct aerosol radiative forcing (Ackerman et al., 2004; Cheng et al., 2008; Kuang et al., 2016a) or reduces the visibility (Yang et al., 2015) and serves as cloud condensation nuclei (CCN) (Hudson and Clarke, 1992). Many factors influence the aerosol hygroscopic growth, such as particle size, chemical component, and mixing state (Li et al., 2016).
Previous studies reported that different types of aerosol particles usually have diverse hygroscopic growth properties. Generally, the hygroscopic growth of marine aerosol ranks first and would be reduced with increased anthropogenic pollution (Fierz-Schmidhauser et al., 2009; Zieger et al., 2010). Urban aerosol or continental aerosol takes the second place (Yan et al., 2009; Fierz-Schmidhauser et al., 2010). The hygroscopic growth of dust aerosol or biomass burning aerosol ranks the lowest (Carrico et al., 1998; Fierz-Schmidhauser et al., 2009; Zieger et al., 2010).
In Europe and North America, many experiments on aerosol hygroscopic properties were carried out (Seinfeld and Pandis, 1998; Zieger et al., 2010, 2014, 2015; Stock et al., 2011; Cruz and Pandis, 2016). In contrast, there are few measurements in China, and these measurements were mainly distributed over Guangzhou, Lin’an, and Beijing and its surrounding areas (Pan et al., 2009; Yan et al., 2009; Kuang et al., 2015; Zhang, 2017). Liu and Zhang (2010) reported that three types of aerosols exhibited different values of scattering enhancement factor at Guangzhou in July 2006, which were 2.04 ± 0.28 (urban), 2.29 ± 0.28 (mixed), and 2.68 ± 0.59 (marine), respectively, indicating that the aerosol hygroscopicity is quite high. It was also reported that the enhancement factor was 1.58 ± 0.12 at Lin’an in March 2013 in the Yangtze River Delta (Zhang et al., 2015), a relatively low value corresponding to lower aerosol hygroscopicity. The deliquescent phenomena (i.e., jump of scattering enhancement factor values) of ambient aerosols in the North China Plain were observed in 2014, which were highly correlated with the high concentration of ammon-ium sulfate (Kuang et al., 2016b). The scattering enhancement factors at RH = 80% were found to be approximately 1.26 ± 0.15 at the Chinese Academy of Meteorological Sciences observation site (urban site of Beijing) and 1.24 ± 1.11 at the Shangdianzi regional station (rural site) from December 2005 to January 2006 (Yan et al., 2008), which were also comparatively low.
With the rapid development of Chinese economy, the Beijing, Tianjin, and Hebei area has become one of the severely polluted areas in China. In winter, severe anthropogenic pollution would occur in the heating period and the frequency of haze increases. Previous studies mentioned above could not accurately describe the properties of aerosols in winter, especially during heavy pollution episodes. In winter 2016, a number of haze alerts were issued, of which the first haze red alert was from 17 to 22 December. In this study, we focus on the analysis of aerosol optical properties and aerosol hygroscopicity and its relationship to chemical composition, and try to understand the characteristics of aerosols in the North China Plain during this heavy pollution event.
2 Experimental sites and instrumentation 2.1 Sampling siteThis study was carried out at the Gucheng Integrated Ecological–Meteorological Observation and Experimental Station of the Chinese Academy of Meteorological Sciences (Gucheng station; 39°08′N, 115°40′E; 15.2 m a.s.l.), which is located in Dingxing county, Hebei Province (seeFig. 1). The site is approximately 110 km southwest of Beijing, 130 km southwest of Tianjin, and 35 km northeast of Baoding, and is surrounded by farmland and sporadic villages. In addition, there is a stone yard about 450 m southwest of the Gucheng station, where larger stones are made smaller. Therefore, a large amount of mineral aerosols is produced there. Fortunately, during the red-alert period, the work was suspended.

|
| Figure 1 Topography (shadings) of the study area and locations (triangles) of the Gucheng Integrated Ecological–Meteorological Observation and Experimental Station and the three surrounding cities (Beijing, Tianjin, and Baoding). |
The aerosol hygroscopicity was measured with a humidification system named humidograph, which covered two integrating nephelometers and a humidifier. The aerosol scattering coefficient and backscatter coefficient were measured at three different wavelengths (λ = 450, 550, and 700 nm) by nephelometers (TSI Inc., Model 3563). Data were collected as 60-second averages, and every one hour, a zero check was automatically operated. The humidifier was made by the aerosol group in the Global Monitoring Division, Earth System Research Laboratory, USA (NOAA/GMD), in line with the model description in Carrico et al. (1998). The detailed characteristics of this instrument have been described in a previous study (Zhang et al., 2015).
The ambient air was pumped through a PM10 impac-tor, an aerosol dryer, then to all the instruments, such as a humidograph, Aerodynamic Particle Sizer (APS), Twin Differential Mobility Particle Sizer (TDMPS), HR-Tof-aerosol mass spectrometer (HR-Tof-AMS), and so on. The automatic regenerating adsorption aerosol dryer (Tuch et al., 2009; Shen et al., 2011) provides low RH sample air to ensure the comparability of all measurements. The humidograph was operated at a constant flow of 22 lpm, including 7.2 lpm sample air and 14.8 lpm dilution flow (particle-free air). The diluted sample air at a lower RH (< 30%) entered the first nephelometer (DryNeph), then the sample air went by the humidifier, where the sample air could obtain a high RH at a range of approximately 40%–85% and finally passed into the next nephelometer (WetNeph), where the scattering coefficient of humidified aerosols was measured.
To ensure the reliability of the data, several comparisons and calibrations have been carried out before and during the experiment. Both nephelometers were calibrated with filtered air and CO2 (purity 99.999%). Particle-free air measurements were automatically performed every 60 min to check the nephelometer background. The sample and dilution flow were controlled by a mass flow controller calibrated with a Gilibrator bubble flow meter before the experiment. In addition, the RH control is crucial to the f(RH) measurement. Two built-in RH sensors and three external RH sensors were calibrated by using a Vaisala Humidity Calibrator (HMK15) with four saturated salt solutions (LiCl, K2CO3, NaCl, and (NH4)2SO4) in the RH range of 11%–80%. In the end, to make sure that the system had no leakage, particle-free air tests were also performed.
In addition to the aerosol hygroscopicity, aerosol chemistry was also measured at the station. A multi-angle absorption photometer (MAAP, model 5012, Thermo Scientific Inc.) at a 637-nm wavelength collected the mass concentration of equivalent black carbon (EBC), and the PM1 mass concentrations of sulfate, nitrate, ammonium, organic matter (OM), and chloride were measured with an HR-Tof-AMS (Aerodyne Inc.). Meanwhile, meteorological data were provided by Gucheng station.
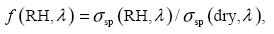
2.3 Definition and formulasThe aerosol scattering enhancement factor f(RH, λ) is used to describe the RH dependency of σsp (Kotchenruther et al., 1999), which is defined as
|
(1) |
where σsp(RH, λ) is the aerosol particle light scattering coefficient at a certain wavelength λ and RH, and σsp(dry, λ) is the corresponding scattering coefficient measured at dry conditions. To make the results comparable, normalized f(RH) was usually used (Day and Malm, 2001). We define RH = 40% as the reference RH, i.e., f(40%) is set to 1 to obtain the final f(RH) (Sheridan et al., 2001).
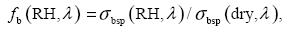
Likewise, the enhancement factor for the backscattering coefficient fb(RH, λ) is used to describe the impact of relative humidity on the aerosol backscattering coefficient:
|
(2) |
where σbsp(dry, λ) represents particle backscattering coefficient at wavelength λ in dry conditions, and σbsp(RH, λ) represents particle backscattering coefficient at a defined relative humidity.
The Ångström exponent α is one of the aerosol optical characteristic parameters and can reflect aerosol particle size. It is derived by calculating scattering coefficients at different wavelengths, as follows,

|
(3) |
In this study, scattering coefficients at wavelengths of 450 and 700 nm were used to obtain the Ångström exponent. The hemispheric backscatter fraction (fβ) is defined as the ratio of the backscattering coefficient (σbsp) to the total scattering coefficient (σsp). All parameters discussed are based on the measurements at the wavelength of 550 nm, unless when specifically mentioned.
3 Results 3.1 Characteristics of dry aerosols and meteorological conditionsFigure 2 shows the time series of the scattering coefficient, backscattering coefficient, scattering Ångström exponent, and hemispheric backscatter fraction along with meteorological parameters (e.g., relative humidity, temperature, wind speed, and wind direction). As seen from Fig. 2a, the hourly averaged aerosol scattering coefficient at 450, 550, and 700 nm had the same trend and were in accordance with a decreasing order for 450, 550, and 700 nm. The mean (standard deviation) scattering coefficient at 550 nm was 1699 Mm–1 (292 Mm–1). Figure 2b shows the hourly averaged aerosol backscattering coefficient at three wavelengths. The trend of the backscattering coefficient followed that of the scattering coefficient, but the magnitude was much lower. The average and standard deviation of the backscattering coefficient at 550 nm were 291.7 and 88.5 Mm–1, respectively. Based on the measured backscattering coefficient and scattering coefficient, the aerosol scattering Ångström exponent and hemispheric backscatter fraction were calculated (Fig. 2c), which are two aerosol optical size-dependent parameters. The hemispheric backscatter fraction was in the range of 0.109–0.139, with an average of 0.119, which is lower than the values at Lin’an (0.128) (Zhang et al., 2015) and at Zhangye, Gansu Province (0.164) (Tian et al., 2010), indicating that the particle size was relatively large at Gucheng in December 2016. The Ångström exponent showed a decreasing trend with time. The mean Ångström exponent was 0.82, with a range of 0.34–1.74, which is lower than the results at Mount Tai (1.40) (Shen, 2012). These results suggested that the aerosol at Gucheng is mainly composed of a larger accumulation size, especially during the late period of this study. The accumulation mode particle number concentration of 18,090 ± 7640 cm–3 at Gucheng accounted for approximately 65% of the submicron particle, which is about 3 times that in urban Beijing (Shen et al., 2018). During the red-alert period, the ambient atmosphere was in a high humidity state, with an average RH of 89.4% and a range from 47% to 100%, and the mean of the ambient temperature was –1.8°C, with a maxi-mum of 6.2°C and minimum of –8.5°C (Fig. 2d). When the ambient RH went down, the values of aerosol scattering coefficient decreased simultaneously, and vice versa. The average of wind speed (WS) was 0.38 m s–1, with a highest WS of 2.8 m s–1. The frequency of light wind (0.3 m s–1 < WS < 1.5 m s –1) was 32.6% and the frequency of calm case (WS < 0.2 m s –1) was 62.1%. The prevailing wind direction on 17 December was northerly, but from 1400 local time (LT, equivalent to Beijing Time) 19 December to 0200 LT 20 December the winds were mainly southerly, and those from 0500 to 1600 LT 20 December were mainly northeasterly. For the rest of the time, the Gucheng site was in stagnant conditions. During the red-alert period, the ambient atmosphere at Gucheng station was humid and stagnant, which contributed to a high scattering coefficient of aerosol particles at the site.
As for the aerosol composition, the statistics of the mass concentration of each species are shown in Table 1. The mass concentrations of organic and EBC were 112.8 and 49.8 μg m–3; the mass fractions of nitrate, sulfate, chloride, and ammonium were 22.1, 31.1, 10.0, and 16.8 μg m–3, approximately 3 times of those in Beijing in winter 2008 (Zhang et al., 2013). Organic, nitrate, sulfate, and EBC were the major aerosol components. The average composition during this study was organic 46%, EBC 21%, sulfate 13%, nitrate 9%, ammonium 7%, and chloride 4%. The relative contribution of different species at Gucheng is similar to the results from Beijing in winter 2008 (Zhang et al., 2013). The high concentration of organics and EBC in winter is related to high emissions from heating and biomass burning, while the lower ambient temperature also favors gas-particle partition. The inorganics mass fraction, summing up sulfate, nitrate, ammonium, and chloride, only has the amount of 33%. This demonstrates that the mass fraction of hydrophilic aerosol was low at Gucheng during the heavy pollution period. One thing worth mentioning is that EBC was measured at the PM10 size cut, which could underestimate the inorganic fraction to some extent.
| Organic | Sulfate | Nitrate | Ammonium | Chloride | EBC | |
| mean | 112.8 | 31.1 | 22.1 | 16.8 | 10.0 | 49.8 |
| Standard deviation | 69.9 | 16.3 | 6.4 | 4.9 | 6.3 | 12.1 |
| Median | 28.2 | 22.7 | 17.1 | 7.9 | 50.0 | 48.7 |
| Min | 33.5 | 7.5 | 10.7 | 8.6 | 2.5 | 25.8 |
| Max | 492.8 | 125.2 | 42.6 | 36.7 | 40.5 | 87.1 |
| Note: EBC measured by MAAP; others by HR-Tof-AMS. | ||||||

|
| Figure 2 Time series of the measured aerosol variables, ambient RH, wind speed, and wind direction during the haze red-alert period in December 2016. (a) Hourly averaged aerosol scattering coefficients at 450- (blue), 550- (green), and 700-nm (red) wavelengths; (b) hourly averaged aerosol backscattering coefficients at different wavelengths; (c) hemispheric backscatter fraction and Ångström exponent; (d) relative humidity (RH) and temperature at ambient conditions; (e) wind speed (WS); and (f) wind direction (WD). |

|
| Figure 3 Histogram of f(80%, 550 nm) overlaid with the Gaussian curves based on the statistics for f(80%, 450 nm), f(80%, 550 nm), and f(80%, 700 nm). |
Since solar irradiance at the earth’s surface is dependent on wavelengths in the visible band, the wavelength dependence of the scattering enhancement factor is important to estimation of the aerosol radiative forcing. Figure 3 shows the histogram of scattering enhancement factor f(80%, 550 nm) overlaid with Gaussian curves based on the statistics for f(80%) at three wavelengths. Only an approximate 2% shift to higher f(80%) values with a larger standard deviation was observed as the wavelength increased, which is similar for the backscatter enhancement factors. Therefore, only slight spectral dependency of f(RH) was observed during the red-alert period. Similar results were obtained for aerosols collected at Lin’an, a regional station in the Yangtze River Delta (Zhang et al., 2015); a regional continental site in Melpitz, Germany (Zieger et al., 2015); and in the flights off the mid-Atlantic coast of the United States during July 1996 (Kotchenruther et al., 1999). Therefore, the focus in the following discussion will be kept on the 550-nm wavelength.
3.3 Aerosol hygroscopicityThe time series of the scattering enhancement factor f(80%) and backscattering enhancement factor fb(80%), as well as the percentage of the mass concentration of aerosol chemical composition, are shown in Fig. 4. In general, f(80%) and fb(80%) showed a negative correlation with the percentage of organics and a positive correlation with that of inorganics. There are similar trends for f(80%) and fb(80%) but with different magnitudes. The f(80%) ranged from 1.12 to 1.62 with an average of 1.29, while fb(80%) varied from 1.02 to 1.24, with an average of 1.10. Both f(80%) and fb(80%) showed a diurnal pattern that peaked in the late afternoon (approximately 1400 LT), especially during the first 3 days. Compared with the percentage of different chemical species (Fig. 4b), the increases of f(80%) and fb(80%) were accompanied with the mass percentage increases of nitrate, ammonium, and sulfate and a decrease of organics. The diurnal pattern could be driven by enhanced photochemi-cal production, gas-particle partition, and so on.

|
| Figure 4 Time series of the (a) scattering enhancement factor f(80%) and backscattering enhancement factor fb(80%), and (b) percentage of mass concentration of aerosol chemical composition. Two periods are defined: period_1 from 1100 to 1900 LT 18 December and period_2 from 0700 to 1500 LT 20 December 2016. |
To illustrate the influence of chemical composition on the humidogram, a plot of the scattering enhancement factor f(RH) vs. RH over two periods with relative constant composition periods were selected: period_1 from 1100 to 1900 LT 18 December and period_2 from 0700 to 1500 LT 20 December. During period_1, the total PM1 mass concentration was 131.2 μg m–3, EBC was 35.0 μg m–3, and the mass fraction of the aerosol chemi-cal composition was organic 30%, EBC 21%, nitrate 18%, sulfate 14%, ammonium 12%, and chloride 5%. During period_2, the mass fraction of the aerosol chemical composition was organic 38%, EBC 28%, nitrate 11%, sulfate 13%, ammonium 8%, and chloride 2%, with a total PM1 mass concentration of 101.8 μg m–3 and EBC of 39.3 μg m–3 (Fig. 5). The mass fraction of inorganic (including nitrate, sulfate, ammonium, and chloride) is approximately 49% and 32% during period_1 and period_2, respectively. The mass fraction of nitrate in period_1 was much higher than that in period_2.
Humidograms during period_1 and period_2 are shown in Fig. 6. For the humidograms measured at Gucheng, f(RH) increased continuously and monotonically. However, the curvatures of the humidograms are different. The humidograms in period_2 increased much slower than those in period_1. These suggest that the scattering enhancement factor could largely vary, dependent on the aerosol composition, even during heavy pollution conditions, although the mass fraction of sul-fate was quite similar.

|
| Figure 5 Mass fraction of the aerosol chemical composition in (a) period_1 from 1100 to 1900 LT 18 December and (b) period_2 from 0700 to 1500 LT 20 December 2016. |

|
| Figure 6 Scatter plot of the scattering enhancement factor vs. RH during period_1 from 1100 to 1900 LT 18 December and period_2 from 0700 to 1500 LT 20 December 2016. |

|
| Figure 7 Scattering enhancement factor f(80%) vs. different chemical compositions: (a, c) f(80%) vs. organic mass fraction denoted by the x-axis and vs. (a) nitrate or (c) sulfate mass fraction denoted by color shading on the right; (b, d) f(80%) vs. inorganic mass fraction denoted by the x-axis and vs. (b) nitrate or (d) sulfate mass fraction denoted by color shading on the right. The black solid line represents the fitting curve of f(80%) and the organic mass fraction in (a, c) or the inorganic mass fraction in (b, d). |

|
| Figure 8 Nitrate mass fraction vs. the scattering enhancement factor f(80%). |
To quantitatively understand the relationship, values of f(80%) and the mass fraction of different chemical compositions are shown in Fig. 7. The total mass concentration was summed up by the mass concentrations of organics, nitrate, sulfate, chloride, and ammonium obtained by HR-Tof-AMS, and EBC obtained by MAAP. Inorganics includes ammonium, nitrate, sulfate, and chloride. As seen from Fig. 7, the scattering enhancement factor f(80%) was negatively correlated to the organic mass fraction due to lower hygroscopicity of organics, while f(80%) was positively correlated to the inorganic mass fraction due to their hygroscopic characteristics. Thus, aerosol chemical composition was found to be the main factor determining the magnitude of f(RH).
The absolute values of slope and intercept of the bivariate linear regression fitting for f(80%) vs. organic mass fraction was 0.99 and 1.7, respectively, which were lower than those (1.2 and 2.05) at Lin’an (Zhang et al., 2015) and much lower than those (3.1 and 3.6) at Melpitz, Germany (Zieger et al., 2014). This could be partly explained by a higher organic mass fraction at Gucheng (46%) compared with that at Lin’an (37%) and Melpitz (approximately 25%). It is interesting to notice that the value of f(80%) increased with increasing nitrate mass fraction (Figs. 7a, c), but not the case for sulfate (Figs. 7b, d). To make this difference clear, the scattering enhancement factor f(80%) vs. nitrate mass fraction is plotted in Fig. 8. The solid red line represents the fitting curve of f(80%) and the nitrate mass fraction. The value of R2 is 0.70, which suggests a strong correlation of the two variables. This implies that nitrate plays a vital role in determining the aerosol hygroscopic growth at the Gucheng site in the measured RH range. Previous studies suggested that the knowledge of particles mixing structure is necessary to explain their hygroscopicity, cloud condensation nucleus activity, and optical properties in field measurements and modeling simulations. Secondary aerosol components (e.g., sulfates, nitrates, and organics) could determine the particle mixing states (Li et al., 2016). We could not estimate the influence of particle mixing states on hygroscopicity in this study since no particle mixing state information is available.
The scattering enhancement factor for different aerosol types from previous results and our study are listed in Table 2. The scattering enhancement factor f(80%) from this study is comparable with the results for dust-influenced aerosol or locally polluted aerosol in the Yangtze River Delta (Zhang et al., 2015), for the aerosol in the Beijing mega-city at the background site (Yan et al., 2009), and for the aerosol in the clean period at a rural site (Pan et al., 2009) in the North China Plain; but it is much lower than the results for other styles of aerosols, such as marine aerosol, urban aerosol, and most contaminated aerosols from other continents.
| Period | Study region (experiment) | Aerosol type | f(RH) | RH | Wave length | Reference |
| April–May 2006 | Tianjin, Baodi, China | Dust,
clean, polluted |
1.2±0.02
1.31±0.03 1.57±0.02 |
80% | 525 nm | Pan et al. (2009) |
| June 2006 | Guangzhou, China | Urban,
mixed, marine |
2.06
3.26 4.92 |
80% | 525 nm | Liu et al. (2009) |
| March 2013 | Lin’an, China | Locally polluted, northerly polluted, dust influenced | 1.36±0.11
1.50±0.09 1.37±0.05 |
80% | 550 nm | Zhang et al. (2015) |
| December 2005–January
2006 |
CAMS Beijing, China
SDZ Beijing, China |
Mega-city,
rural |
1.26±0.15
1.24±0.11 |
80%±1% | 525 nm | Yan et al. (2009) |
| February–March 2009 | Melpitz, Germany | Continental | 2.77±0.37 | 85% | 550 nm | Zieger et al. (2014) |
| August 2007 | Mace Head, Ireland | Ocean,
polluted |
2.22±0.17
1.77±0.31 |
85% | 550 nm | Fierz-Schmidhauser et al. (2010) |
| 17–22 December 2016 | Baoding, Gucheng, China | Heavily polluted | 1.29±0.10 | 80% | 550 nm | This work |
| Note: “Northerly polluted” refers to a pollution event that was influenced by long-distance transport of air masses from northern China. | ||||||
The scattering enhancement factor f(RH) can be parameterized with empirical equations. They were widely used in satellite remote sensing, global climate models, and radiation transmission models to predict the scattering enhancement factor of aerosols in certain areas. Kotchenruther and Hobbs (1998) proposed a formula as follows,
| (4) |
where a and b are empirical parameters; a determines the maximum of the scattering enhancement factor f(RH) at the RH of 100%, and b determines the curvature of the humidogram. The empirical parameters a and b of different types of aerosols are shown in Table 3. The results from this study are much lower than those from other studies (Pan et al., 2009; Zhang et al., 2015). A wide range of the values of scattering enhancement factor f(RH) were found in this study. From 1500 to 1530 LT on 18 December, the f(RH) at different RH values were higher than those in other times, and f(80%) was 1.62. In this period, the empirical parameters a and b were 1.86 and 4.65, respectively. From 0730 to 0800 LT on 19 December, the hygroscopic growth of aerosol was lower than others, with an f(RH) of 1.2, and a and b of 0.36 and 4.31, respectively. When the hygroscopic growth of aerosol is higher, the values of a and b are larger. The value of R2 for this equation was 0.35.
| a | b | f(80%) | Reference | |
| Polluted
|
0.56±0.02 | 3.44±0.09 | 1.29±0.10 | This work
|
| Clean | 1.20±0.06 | 6.07±0.27 | 1.31±0.03 | Pan et al. (2009) |
| Polluted | 2.30±0.03 | 6.27±0.10 | 1.57±0.02 | |
| Dust
|
0.64±0.04 | 5.17±0.40 | 1.20±0.02 | |
| Locally polluted | 1.24±0.29 | 5.46±1.90 | 1.36±0.11 | Zhang et al. (2015) |
| Northerly polluted | 1.20±0.21 | 3.90±1.90 | 1.50±0.09 | |
| Dust influenced | 1.02±0.19 | 4.51±0.80 | 1.37±0.05 |
Another empirical equation was proposed by Kasten (Kasten, 1969) as follows,
| (5) |
where c and g are empirical parameters. The values of f(RH) would rise with the increase of c and g. Table 4 shows the results of c and g derived from this study and two previous studies. The values of c and g in this study are similar to those at Lin’an (Zhang et al., 2015), while the values of f(80%) of both experiments had small differences. Compared with those of Arctic aerosol, the values of c and g in this study are smaller. Similarly, the aerosol hygroscopic growth at the Gucheng site is much lower than that of Arctic aerosol (Zieger et al., 2010). During the measurement, from 1500 LT to 1530 LT on 18 December, f(RH) reached 1.62, and c and g were 0.79 and 0.45, respectively. Meanwhile, when f(RH) was 1.12, from 0730 to 0800 LT on 19 December, c and g were 0.95 and 0.11, respectively. Based on these results, it is inferred that the value of g makes a greater contribution to the f(RH). These empirical parameters can be used in model calculations to simulate the aerosol hygroscopic growth. The value of R2 for this equation was 0.42. Thus, the fitting result of Eq. (5) is better than that of Eq. (4) for the aerosol at the Gucheng site.
| c | g | f(80%) | Reference | |
| Polluted
|
0.91±0.01 | 0.21±0.01 | 1.29±0.10 | This work |
| Arctic
|
1.0 | 0.58±0.09 | 3.24±0.63 (f(85%)) | Zieger et al. (2010) |
| Locally polluted | 0.85±0.08 | 0.29±0.04 | 1.36±0.11 | Zhang et al. (2015) |
| Northerly polluted | 0.93±0.07 | 0.28±0.03 | 1.50±0.09 | |
| Dust influenced | 0.87±0.08 | 0.27±0.02 | 1.37±0.05 |
The influence of the water uptake on the aerosol scattering coefficient has been investigated at the rural site of Gucheng in the North China Plain during a haze red-alert period based on the measurements from a humidified nephelometer system. The aerosol scattering enhancement factor f(80%) at a wavelength of 550 nm ranged from 1.12 to 1.62, with an average (standard deviation) of 1.29 (0.10), which has been found to be largely variable, even in the heavy pollution period. It is found that the aerosol scattering coefficient and backscattering coefficient increased by only 29% and 10% respectively when RH went up from 40% to 80%, while the hemispheric backscatter fraction went down by 14%, implying that the aerosol hygroscopicity represented by the aerosol scattering enhancement factor f(RH) is relatively low and RH exerted little effects on the aerosol light scattering in this case. The f(RH) values at different wavelengths only showed an approximately 2% shift to higher values at larger wavelengths. The aerosol was characterized by high organic and EBC, which accounted for 51%–66% of all aerosols. The scattering enhancement factor was closely related to the aerosol chemical composition, which has a significant positive correlation with the inorganic mass fraction and a negative correlation with the organic and EBC mass fractions. When there is a large mass fraction of inorganics and a small mass fraction of organic matter, f(RH) reaches a high value. The fraction of NO3– was strongly correlated with the aerosol scattering coefficient at RH = 80%, which suggests that NO3– played an important role in aerosol hygroscopic growth during the heavy pollution period.
It is worth mentioning that nitrate played an important role in aerosol hygroscopic than the other inorganics at Gucheng. The scattering enhancement factor f(RH) measured at Gucheng can be well fitted into the following two empirical equations: f(RH) = 1 + a × RHb and f(RH) = c (1 – RH)–g, where parameters a = 0.56 ± 0.02, b = 3.44 ± 0.09, c = 0.91 ± 0.01, and g = 0.21 ± 0.01. The hygroscopic growth of aerosol has an important impact on aerosol scattering properties and radiative forcing. Further study is needed to characterize the influence of relative humidity and different kinds of aerosol on the aerosol scattering enhancement factors in these regions.
Acknowledgments. This study was also supported by the China Meteorological Administration Innovation Team for Haze–fog Observation and Forecasts.
| Ackerman, A. S., M. P. Kirkpatrick, D. E. Stevens, et al., 2004: The impact of humidity above stratiform clouds on indirect aerosol climate forcing. Nature, 432, 1014–1017. DOI:10.1038/nature03174 |
| Carrico, C. M., M. J. Rood, and J. A. Ogren, 1998: Aerosol light scattering properties at Cape Grim, Tasmania, during the First Aerosol Characterization Experiment (ACE 1). J. Geophys. Res., 103, 16565–16574. DOI:10.1029/98JD00685 |
| Cheng, Y. F., A. Wiedensohler, H. Eichler, et al., 2008: Relative humidity dependence of aerosol optical properties and direct radiative forcing in the surface boundary layer at Xinken in Pearl River Delta of China: An observation based numerical study. Atmos. Environ., 42, 6373–6397. DOI:10.1016/j.atmosenv.2008.04.009 |
| Cruz, C. N., and S. N. Pis, 2016: Deliquescence and hygroscopic growth of mixed inorganic–organic atmospheric aerosol. Environ. Sci. Technol., 34, 4313–4319. DOI:10.1021/es9907109 |
| Day, D. E., and W. C. Malm, 2001: Aerosol light scattering measurements as a function of relative humidity: A comparison between measurements made at three different sites. Atmos. Environ., 35, 5169–5176. DOI:10.1016/s1352-2310(01)00320-X |
| Fierz-Schmidhauser, R., P. Zieger, M. Gysel, et al., 2009: Measured and predicted aerosol light scattering enhancement factors at the high alpine site Jungfraujoch. Atmos. Chem. Phys., 10, 2319–2333. DOI:10.5194/acp-10-2319-2010 |
| Fierz-Schmidhauser, R., P. Zieger, A. Vaishya, et al., 2010: Light scattering enhancement factors in the marine boundary layer (Mace Head, Ireland). J. Geophys. Res., 115, D20204. DOI:10.1029/2009JD013755 |
| Hudson, J. G., and A. D. Clarke, 1992: Aerosol and cloud condensation nuclei measurements in the Kuwait plume. J. Geophys. Res., 97, 14533–14536. DOI:10.1029/92jd00800 |
| Kasten, F., 1969: Visibility forecast in the phase of pre-condensation. Tellus, 21, 631–635. DOI:10.1111/j.2153-3490.1969.tb00469.x |
| Kotchenruther, R. A., and P. V. Hobbs, 1998: Humidification factors of aerosols from biomass burning in Brazil. J. Geophys. Res., 103, 32081–32089. DOI:10.1029/98jd00340 |
| Kotchenruther, R. A., P. V. Hobbs, and D. A. Hegg, 1999: Humidification factors for atmospheric aerosols off the mid-Atlantic coast of the United States. J. Geophys. Res., 104, 2239–2251. DOI:10.1029/98jd01751 |
| Kuang, Y., C. S. Zhao, J. C. Tao, et al., 2015: Diurnal variations of aerosol optical properties in the North China Plain and their influences on the estimates of direct aerosol radiative effect. Atmos. Chem. Phys., 15, 339–369. DOI:10.5194/acp-15-5761-2015 |
| Kuang, Y., C. S. Zhao, J. C. Tao, et al., 2016a: Impact of aerosol hygroscopic growth on the direct aerosol radiative effect in summer on the North China Plain. Atmos. Environ., 147, 224–233. DOI:10.1016/j.atmosenv.2016.10.013 |
| Kuang, Y., C. S. Zhao, N. Ma, et al., 2016b: Deliquescent phenomena of ambient aerosols on the North China Plain. Geophys. Res. Lett., 43, 8744–8750. DOI:10.1002/2016gl070273 |
| Li, W. J., J. X. Sun, L. Xu, et al., 2016: A conceptual framework for mixing structures in individual aerosol particles. J. Geophys. Res., 121, 13784–13798. DOI:10.1002/2016jd025252 |
| Liu, X. G., and Y. H. Zhang, 2009: Research on the measurement of aerosol hygroscopic growth factor in Guangzhou city. China Environ. Sci., 29, 1128–1133. DOI:10.3321/j.issn:1000-6923.2009.11.002 |
| Liu, X. G., and Y. H. Zhang, 2010: Advances in research on aerosol hygroscopic properties at home and abroad. Climatic Environ. Res., 15, 808–816. DOI:10.3878/j.issn.1006-9585.2010.06.10 |
| Pan, X. L., P. Yan, J. Tang, et al., 2009: Observational study of influence of aerosol hygroscopic growth on scattering coefficient over rural area near Beijing mega-city. Atmos. Chem. Phys., 9, 7519–7530. DOI:10.5194/acp-9-7519-2009 |
| Seinfeld, J. H., and S. N. Pandis, 1998: Atmospheric Chemistry and Physics: From Air Pollution to Climate Change. Wiley Press, 1326 pp. |
| Shen, X. J., 2012: Characteristics of the particle number size distribution and optical properties at Mt. Tai. Ph.D. Dissertation, Chinese Academy of Meteorological Sciences, China, 130 pp. (in Chinese) |
| Shen, X. J., J. Y. Sun, Y. M. Zhang, et al., 2011: First long-term study of particle number size distributions and new particle formation events of regional aerosol in the North China Plain. Atmos. Chem. Phys., 11, 1565–1580. DOI:10.5194/acp-11-1565-2011 |
| Shen, X. J., J. Y. Sun, X. Y. Zhang, et al., 2018: Comparison of submicron particles at a rural and an urban site in the North China Plain during the December 2016 heavy pollution episodes. J. Meteor. Res., 32, 26–37. DOI:10.1007/s13351-018-7060-7 |
| Sheridan, P. J., D. J. Delene, and J. A. Ogren, 2001: Four years of continuous surface aerosol measurements from the Department of Energy’s Atmospheric Radiation Measurement Program Southern Great Plains Cloud and Radiation Testbed site. J. Geophys. Res., 106, 20735–20747. DOI:10.1029/2001JD000785 |
| Stock, M., Y. F. Cheng, W. Birmili, et al., 2011: Hygroscopic properties of atmospheric aerosol particles over the Eastern Mediterranean: Implications for regional direct radiative forcing under clean and polluted conditions. Atmos. Chem. Phys., 11, 4251–4271. DOI:10.5194/acp-11-4251-2011 |
| Sun, J. Y., L. Zhang, X. J. Shen, et al., 2016: A review of the effects of relative humidity on aerosol scattering properties. Acta Meteor. Sinica, 74, 672–682. DOI:10.11676/qxxb2016.059 |
| Tian, L., W. Zhang, J. S. Shi, et al., 2010: A preliminary study on scattering property of dust aerosol in Hexi Corridor. Plateau Meteor., 29, 1050–1057. |
| Tuch, M., Haudek T., Müller A., et al., 2009: Design and performance of an automatic regenerating adsorption aerosol dryer for continuous operation at monitoring sites. Atmos. Meas. Tech., 2, 417–422. DOI:10.5194/amt-2-417-2009 |
| Yan, P., X. L. Pan, J. Tang, et al., 2008: An experimental study on the influence of relative humidity on the atmospheric aerosol scattering coefficient at an urban site in Beijing. Acta Meteor. Sinica, 66, 111–119. DOI:10.3321/j.issn:0577-6619.2008.01.011 |
| Yan, P., X. L. Pan, J. Tang, et al., 2009: Hygroscopic growth of aerosol scattering coefficient: A comparative analysis between urban and suburban sites at winter in Beijing. Particuology, 7, 52–60. DOI:10.1016/j.partic.2008.11.009 |
| Yang, Y. R., X. G. Liu, Y. Qu, et al., 2015: Characteristics and formation mechanism of continuous hazes in China: A case study during the autumn of 2014 in the North China Plain. Atmos. Chem. Phys., 15, 8165–8178. DOI:10.5194/acp-15-8165-2015 |
| Zhang, L., 2017: Observation and model study of relative humidity effects on aerosol light scattering at a regional background site in the Yangtze Delta Region. Ph.D. Dissertation, Chinese Academy of Meteorological Sciences, China, 81 pp. (in Chinese) |
| Zhang, L., J. Y. Sun, X. J. Shen, et al., 2015: Observations of relative humidity effects on aerosol light scattering in the Yangtze River Delta of China. Atmos. Chem. Phys., 15, 8439–8454. DOI:10.5194/acp-15-8439-2015 |
| Zhang, Y. M., J. Y. Sun, X. Y. Zhang, et al., 2013: Seasonal characterization of components and size distributions for submicron aerosols in Beijing. Sci. China Earth Sci., 56, 890–900. DOI:10.1007/s11430-012-4515-z |
| Zieger, P., R. Fierz-Schmidhauser, M. Gysel, et al., 2010: Effects of relative humidity on aerosol light scattering in the Arctic. Atmos. Chem. Phys., 10, 3875–3890. DOI:10.5194/acp-10-3875-2010 |
| Zieger, P., R. Fierz-Schmidhauser, L. Poulain, et al., 2014: Influence of water uptake on the aerosol particle light scattering coefficients of the central European aerosol. Tellus, 66, 22716. DOI:10.3402/tellusb.v66.22716 |
| Zieger, P., P. P. Aalto, V. Aaltonen, et al., 2015: Low hygroscopic scattering enhancement of boreal aerosol and the implications for a columnar optical closure study. Atmos. Chem. Phys., 15, 7247–7267. DOI:10.5194/acp-15-7247-2015 |