The Chinese Meteorological Society
Article Information
- SHEN, Xiaojing, Junying SUN, Xiaoye ZHANG, et al., 2018.
- Comparison of Submicron Particles at a Rural and an Urban Site in the North China Plain during the December 2016 Heavy Pollution Episodes. 2018.
- J. Meteor. Res., 32(1): 26-37
- http://dx.doi.org/10.1007/s13351-018-7060-7
Article History
- Received June 12, 2017
- in final form October 15, 2017
2. Integrated Ecological–Meteorological Observation and Experimental Station, Chinese Academy of Meteorological Sciences, Beijing 100081;
3. Longfengshan Atmospheric Background Regional Station, Heilongjiang Provincial Meteorological Bureau, Wuchang 150209
Submicron particle matter (PM1, diameter < 1 μm) plays an important role in changes of visibility, human health, and radiative forcing. These particles also provide the largest contribution to the particle mass and number concentration on non-dust storm days. The particle number size distribution (PNSD) provides sources and atmospheric process information for the particles ( Vu et al., 2015). The PNSD is also a key parameter for evaluating the effects of particles on regional climate and air quality, as well as human health, especially for submicron particles (Kulmala et al., 2012). The on-going transformation of the PNSD results in substantial temporal and spatial variability (Birmili et al., 2013). The submicron range is usually separated into nucleation mode (3–25 nm), Aitken mode (25–100 nm), and accumulation mode (100–1000 nm), based on the PNSD measurement (Dal Maso et al., 2005). In urban areas, the main sources of ultrafine particles (nucleation and Aitken modes) include the traffic emission and photochemical new particle formation (NPF) events (Kumar et al., 2014; Ma and Birmili, 2015). The main contributors to the accumulation mode of particles were the regional transport and the condensational growth of smaller particles.
In recent years, China has been suffering from severe air pollution as a result of rapid industrialization and urbanization, especially in the highly developed economic zones, including the North China Plain, the Yangtze River Delta, and the Pearl River Delta. The Jing–Jin–Ji region, covering the city of Beijing, Tianjin, and major areas of Hebei province, also called the Beijing–Tianjin–Hebei area, is one of the most polluted regions in China. Severe haze–fog of longer duration and more extensive coverage has occurred frequently in the Jing–Jin–Ji region, especially during winter. It was reported that the hourly mean mass concentration of PM2.5 (particulate matter with diameter < 2.5 μm) reached approximately 700 μg m –3 during the severe haze–fog episodes in January 2013 (Wang Y. S. et al., 2014). The sharp increase of particle mass concentration was partly attributable to unfavorable meteorological conditions, as well as the quick secondary transformation process through heterogeneous reactions of particles in the atmosphere (Wang Y. S. et al., 2014; Zhang et al., 2014; Zheng et al., 2015). The pollution episodes usually lasted for 3–5 days, and then the mass concentration decreased sharply due to the arrival of clean air mass. This alternating pattern of pollution and clean air had occurred in Beijing and was identified as a “sawtooth pattern” in a previous study (Jia et al., 2008). As an important component, black carbon from the industrial and combustion emission also contributed to the enhanced PM2.5 mass concentration and influenced the regional radiative forcing (Cohen, 2014; Cohen and Wang, 2014; Zhou et al., 2016). It was reported that the simulated surface-layer black carbon concentrations in the North China Plain were undoubtedly higher in winter than in summer (Li et al., 2016).
NPF is a key gas-to-particle transformation process in the atmosphere and has been identified as one of the most important sources for cloud condensation nuclei (CCN) around the world (Kulmala et al., 2004). Several studies on NPF in China have been conducted in diverse conditions, including urban (Wu et al., 2007; Wang et al., 2011), suburban (Qi et al., 2015), rural (Shen et al., 2011), marine boundary layer (Peng et al., 2014), and mountain sites (Wang H. L. et al., 2014; Shen et al., 2016a). These studies found that NPF events usually occurred under clear conditions with a condensation sink (CS) lower than 0.02 s–1. This phenomenon could also occur under polluted conditions in China, which was hardly ever observed in western countries. It was also reported that the NPF events could result in the enhancement of CCN number concentration by a factor of 2–6 in many places in China (Yue et al., 2011; Wang et al., 2013; Peng et al., 2014; Shen et al., 2016b), thereby attracting more attention due to its crucial role in influencing cloud formation and the regional climate as a whole.
Under the support of Ministry of Science and Technology of China, an extensive field campaign for measurement of the physical and chemical properties of aerosols was simultaneously conducted at an urban site in Beijing and a rural site in Hebei Province during December 2016. The measured variables included the PNSD, CCN number concentration, size-resolved chemical component of non-refractory submicron particles, aerosol scattering and absorption coefficients, and the hygroscopic growth factor based on the scattering coefficient. The objective of this experiment was to study the physical and chemical properties of the aerosols during heavy pollution episodes and their associated interactions with meteorological conditions. In this paper, we focus on examining the particle number size evolution during a heavy pollution episode in December 2016 and try to characterize the differences between the urban site in Beijing and the rural site in Hebei Province. We also try to quantitatively separate the contributions from local emission and from regional transport to the particle mass concentration at the two sites.
2 Experimental description 2.1 Measurement sitesThe urban site in Beijing (population of approximately 22 million as of the end of 2016) is on the building roof of the Chinese Academy of Meteorological Sciences (CAMS) in the China Meteorological Administration campus. The laboratory is approximately 53 m above ground level and is located in the western urban area of Beijing, between the 2nd and 3rd Ring Roads (Fig. 1). West of the site, within a distance of less than 200 m, is a major road with heavy traffic.
The rural site is Gucheng (GC, 39°08′N, 115°40′E; 15.2 m a.s.l), located in Heibei Province, approximately 110 km southwest of Beijing, 35 km north of the city of Baoding (population of about 5 million), and 160 km away from the provincial capital city, Shijiazhuang (population of about 10 million), of Hebei Province, as shown in Fig. 1. This site is an Integrated Ecological–Meteorological Observation and Experimental Station belonging to the Chinese Academy of Meteorological Sciences. The Taihang Mountains (about 1200–2880 m a.s.l) lie approximately 30 km to the west of the GC site. There is a national road (G107) and a highway (Peking–Hong Kong–Macao Highway) to the west and east of the site, which are approximately 0.5 and 3 km away, respectively. The station is surrounded by agricultural fields, primarily consisting of corn and wheat. The dominant wind direction at GC is southwest to northeast. This site is an upwind site to the southwest of Beijing and is a representative station for studying the air pollution severity levels in the Jing–Jin–Ji region.

|
| Figure 1 Location of the measurement sites: (a) CAMS in Beijing city and GC in Hebei Province and (b) the national roads as well as highways in this region. The map is from Google Earth. |
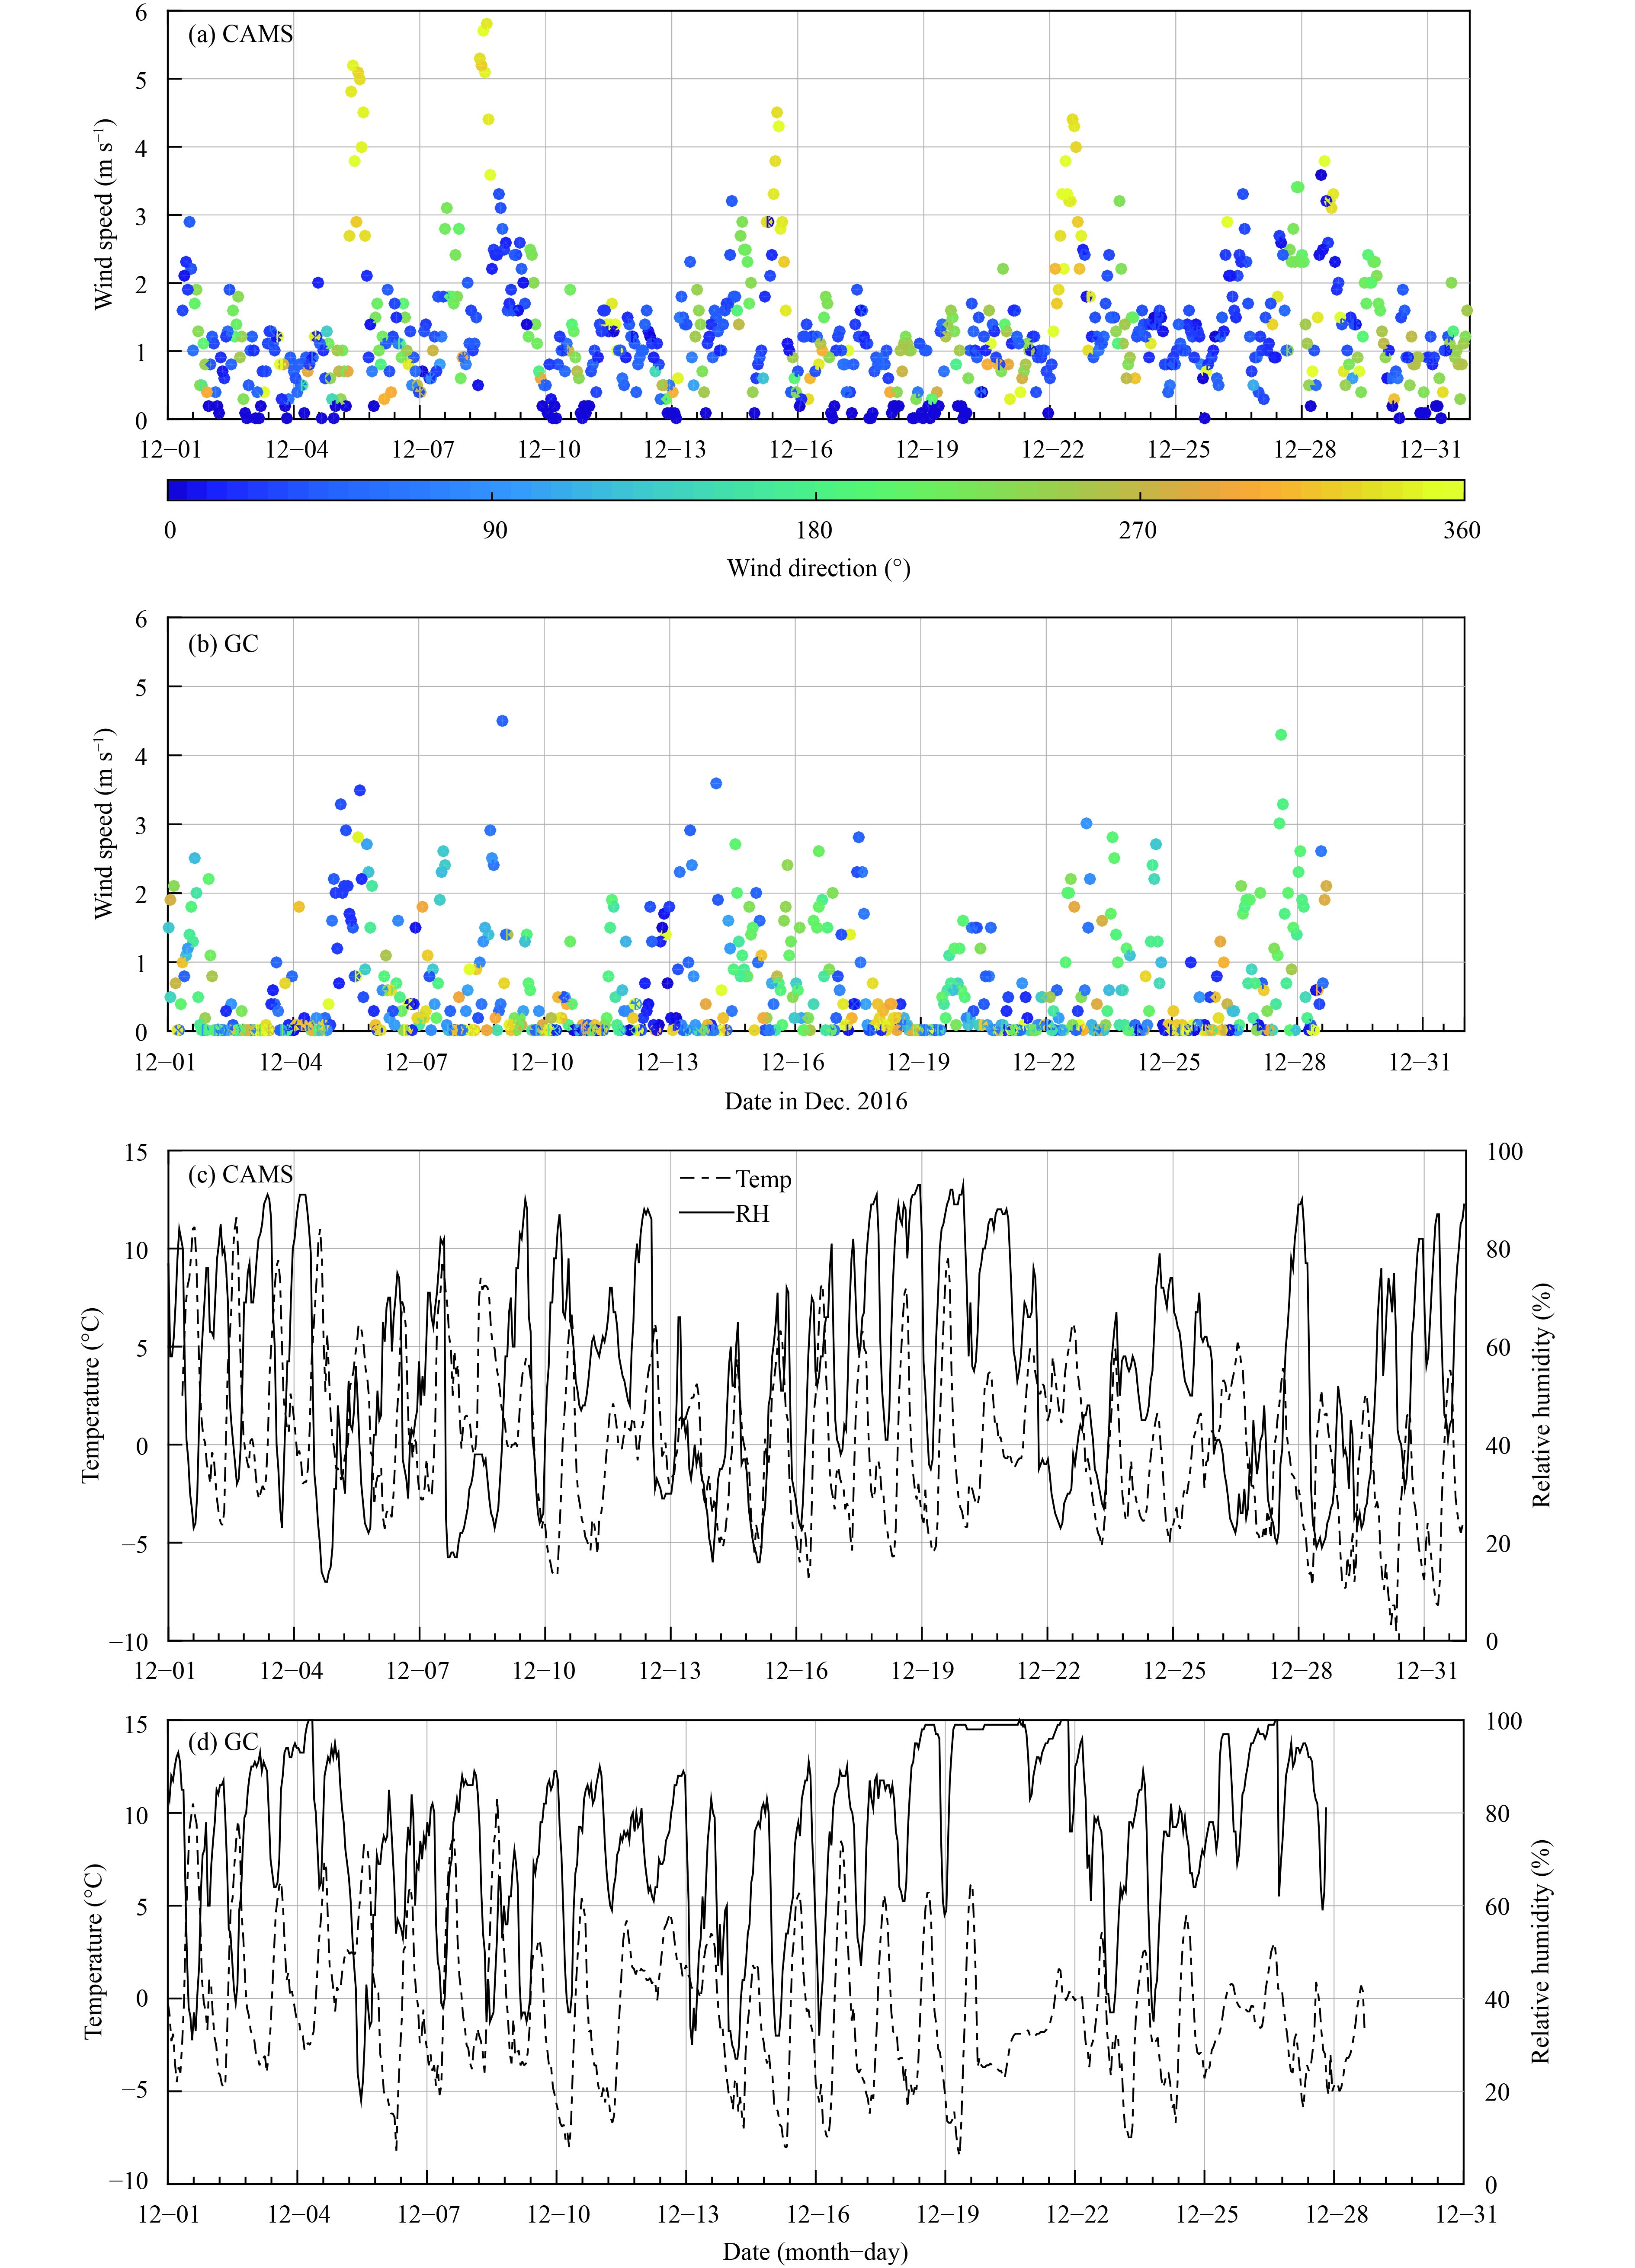
The meteorological parameters, including wind direction and speed, air temperature, and relative humidity (RH), on an hourly resolution at the two sites are given in Fig. 2. There was no available meteorological data at CAMS, thereby the data observed at Haidian station (39°59'N, 116°17'E; 45.8 m a.s.l.) in Beijing was applied instead, about 3 km to the east of CAMS. The wind speed was usually lower than 2 m s–1 at the two sites (Figs. 2a, b), indicating the unfavorable dispersion condition present in winter. Especially at GC, calm wind was more frequent. In December 2016, the mean temperature at two sites was quite close, which was 0°C at CAMS and –0.8°C at GC, respectively (Figs. 2c, d). But the mean RH at GC was 74%, which was much higher than that at CAMS (53%). This indicates that GC was more easily influenced by the humid and stagnant air mass.
|
| Figure 2 (a, b) Wind speed and wind direction, and (c, d) air temperature (Temp; dashed line) and relative humidity (RH; solid line) at (a, c) the CAMS site and (b, d) the GC site in December 2016. The color of dots in (a, b) indicates the wind direction from 0 to 360 degree. |
Particle number size distribution in the range of 4–850 nm is measured by a Tandem Scanning Mobility Particle Sizer (TSMPS) developed by the Leibniz Institute for Tropospheric Research (TROPOS), Germany. This system is comprised of two condensing particle counters (CPC model 3772 and UCPC model 3776, TSI Inc., St Paul, USA) and two differential mobility analyzers (a DMA, type Hauke-median and an ultrafine DMA, type Hauke-short). The combination of CPC/UCPC and DMA/UDMA can measure the PNSD in the size range of 4–70 nm and 10–850 nm, respectively. The measurement included an up-scan (5 min) and down-scan (5 min) with a 10-min resolution. The raw mobility distribution data were converted into PNSD under the standard ambient condition (temperature 273.15 K and pressure 1013.25 hPa), and processed with the overlap correction between DMA and UDMA and diffusion loss and CPC efficiency correction following the routine suggested byPfeifer et al. (2014) and Wiedensohler et al. (2012).
A Multi-Angle Absorption Photometer (MAAP Model 5012, Thermo Fisher Scientific Inc., USA) was used to determine the absorption coefficient (σabs, 637) at a wave-length of 637 nm (Müller et al., 2011) at the GC station. The measurement principle is based on the simultaneous measurement of light passing through the filter and light being scattered back from accumulated particles. The MAAP provides the absorption coefficient with a sampl-ing frequency of 1 min. Hourly averaged data were used in the discussion in Section 3. Non-refractory PM1 chemical components, including sulfate, nitrate, ammo-nium, organic, and chloride, were identified by the Aero-dyne Quadropole Aerosol Mass Spectrometer (Q-AMS), which provides the information of size-resolved chemi-cal composition of PM1 at the CAMS station. More information about the Q-AMS setup can be found in Sun et al. (2010). All times reported in this study are Beijing Time (BT; equal to UTC + 8) unless otherwise specified.
3 Results 3.1 Particle size distribution and number concentrationThe evolution of particle size distribution and the geometric mean diameter (Dp, g) at CAMS and GC during December 2016 are shown in Fig. 3. At CAMS, the accumulation mode particles (diameter > 100 nm) were the main contributors during the pollution period, while the ultrafine particles (diameter < 100 nm) including nucleation and Aitken mode particles dominated the clean period based on the contour plot ( Fig. 3). The clean and polluted periods alternated at CAMS, while polluted conditions dominated during most periods at GC. There were some episodes, e.g., on 5, 8, and 15 December, showing high wind speed and northerly winds (Figs. 2a, b), corresponding to low number concentration of accumulation mode at CAMS. But at GC, calm winds with southerly direction prevailed, resulting in high concentration of the accumulation mode particles at most times.
There were a total of 8 NPF events observed during the measurement on 1, 5, 8, 15, 22, and 26–28 December. The NPF occurrence is indicated by a burst of nucleation mode particle number concentration, and the nucleated particles could grow into larger size in the following hours (Dal Maso et al., 2005). During the measurement, NPF occurrence frequency at CAMS was 26% (8/31 × 100%), lower than the value of approximately 40% found at another urban site of Beijing, i.e., the Peking University site (PKU; Wu et al., 2007) and a rural site of Shangdianzi (SDZ; Shen et al., 2011). Once the NPF event occurred, Dp, g grew into the Aitken mode and even larger sizes at CAMS during subsequent days, which was proved by a NPF event case study in Section 3.3. There was no NPF event observed at the GC site and the Dp, g fluctuated around 100 nm with a higher concentration.
The mass concentration of PM1 can be calculated based on the PNSD measurement with an assumption of spherical particle shape. The density of the particle was approximately 1.5 g cm–3, which was determined based on the volume fraction of the different chemical components derived from Aerosol Mass Spectrometer (AMS). PM1 mass concentration showed a clear 3–4 days sawtooth pattern at the urban CAMS site (Fig. 4), which was quite similar to a previous result in Beijing reported by Jia et al. (2008). The mass concentration increased slowly over several days under the stagnant southerly air mass and later decreased abruptly when the northerly air mass arrived. The pollution episode persisted for over 6 days from 16 to 21 December in the Jing–Jin–Ji region when the first red alert in 2016 was issued in Beijing and the surrounding cities. The sawtooth pattern was not obvious at GC station, and the mean mass concentration of PM1 at GC was approximately 270 μg m–3, which was nearly 3 times that of 83 μg m–3 at CAMS. The measurements also showed that the PM1 mass concentration continuously increased simultaneously at the two sites at most times, especially with southwesterly wind of less than 2 m s–1 as shown in Figs. 2a, b, indicating that the air pollution was a regional phenomenon.

|
| Figure 3 Particle number size distribution (PNSD) at (a) CAMS and (b) GC in December 2016. The purple line indicates the geometric mean diameter of PNSD at each site. |

|
| Figure 4 Time series of hourly mean PM1 mass concentration calculated based on PNSD at CAMS (dashed line) and GC (solid line), respectively. |
The mean and standard deviation of PNSD at CAMS and GC during the measurement are given in Fig. 5. The bimodal log-normal distribution function was used to parameterize the hourly mean PNSD at the two sites (Hussein et al., 2005). The fitting parameters shown in Table 1 include the mode number concentration N, standard deviation σ, and geometric mean diameter Dp, g. The fitting results showed that the Aitken mode was the dominant mode of PNSD at CAMS, while the accumulation mode prevailed at GC. The PNSD at GC had a larger size and higher mode concentration than that at CAMS. The higher number concentration of particles below 40 nm at CAMS resulted from the NPF events and vehicle emissions, given that the site was located on a busy roadway. On NPF days, the initial size of nucleated particles was about 1 nm (Kulmala et al., 2004), but due to the detection limitation, we could only see the burst of particle number concentration starting from about 3 nm. The PNSD from vehicle emissions usually ranged from 10 to 100 nm, peaking at 30–60 nm, depending on such factors as the combustion fuel, the vehicle operating mode, and the distance from the source (Vu et al., 2015). The high concentration of accumulation mode particles at GC was probably related to the growth of the Aitken mode, as well as long-range transport. The PNSD at GC peaked at approximately 100–200 nm as shown in Fig. 5, indicating that the particles were aged.

|
| Figure 5 Comparison of mean PNSD between CAMS and GC. The bars indicate standard deviation. |
| Mode 1 | Mode 2 | |||||
| Dp, g, 1 (nm) | σg, 1 | N1 (cm–3) | Dp, g, 2 (nm) | σg, 2 | N2 (cm–3) | |
| CAMS | 61±38 | 2.00±0.70 | 12,500±4330 | 310±60 | 1.63±0.33 | 1530±4330 |
| GC | 120±32 | 1.97±0.10 | 25,810±10,190 | 320±29 | 1.80±0.34 | 1180±2150 |
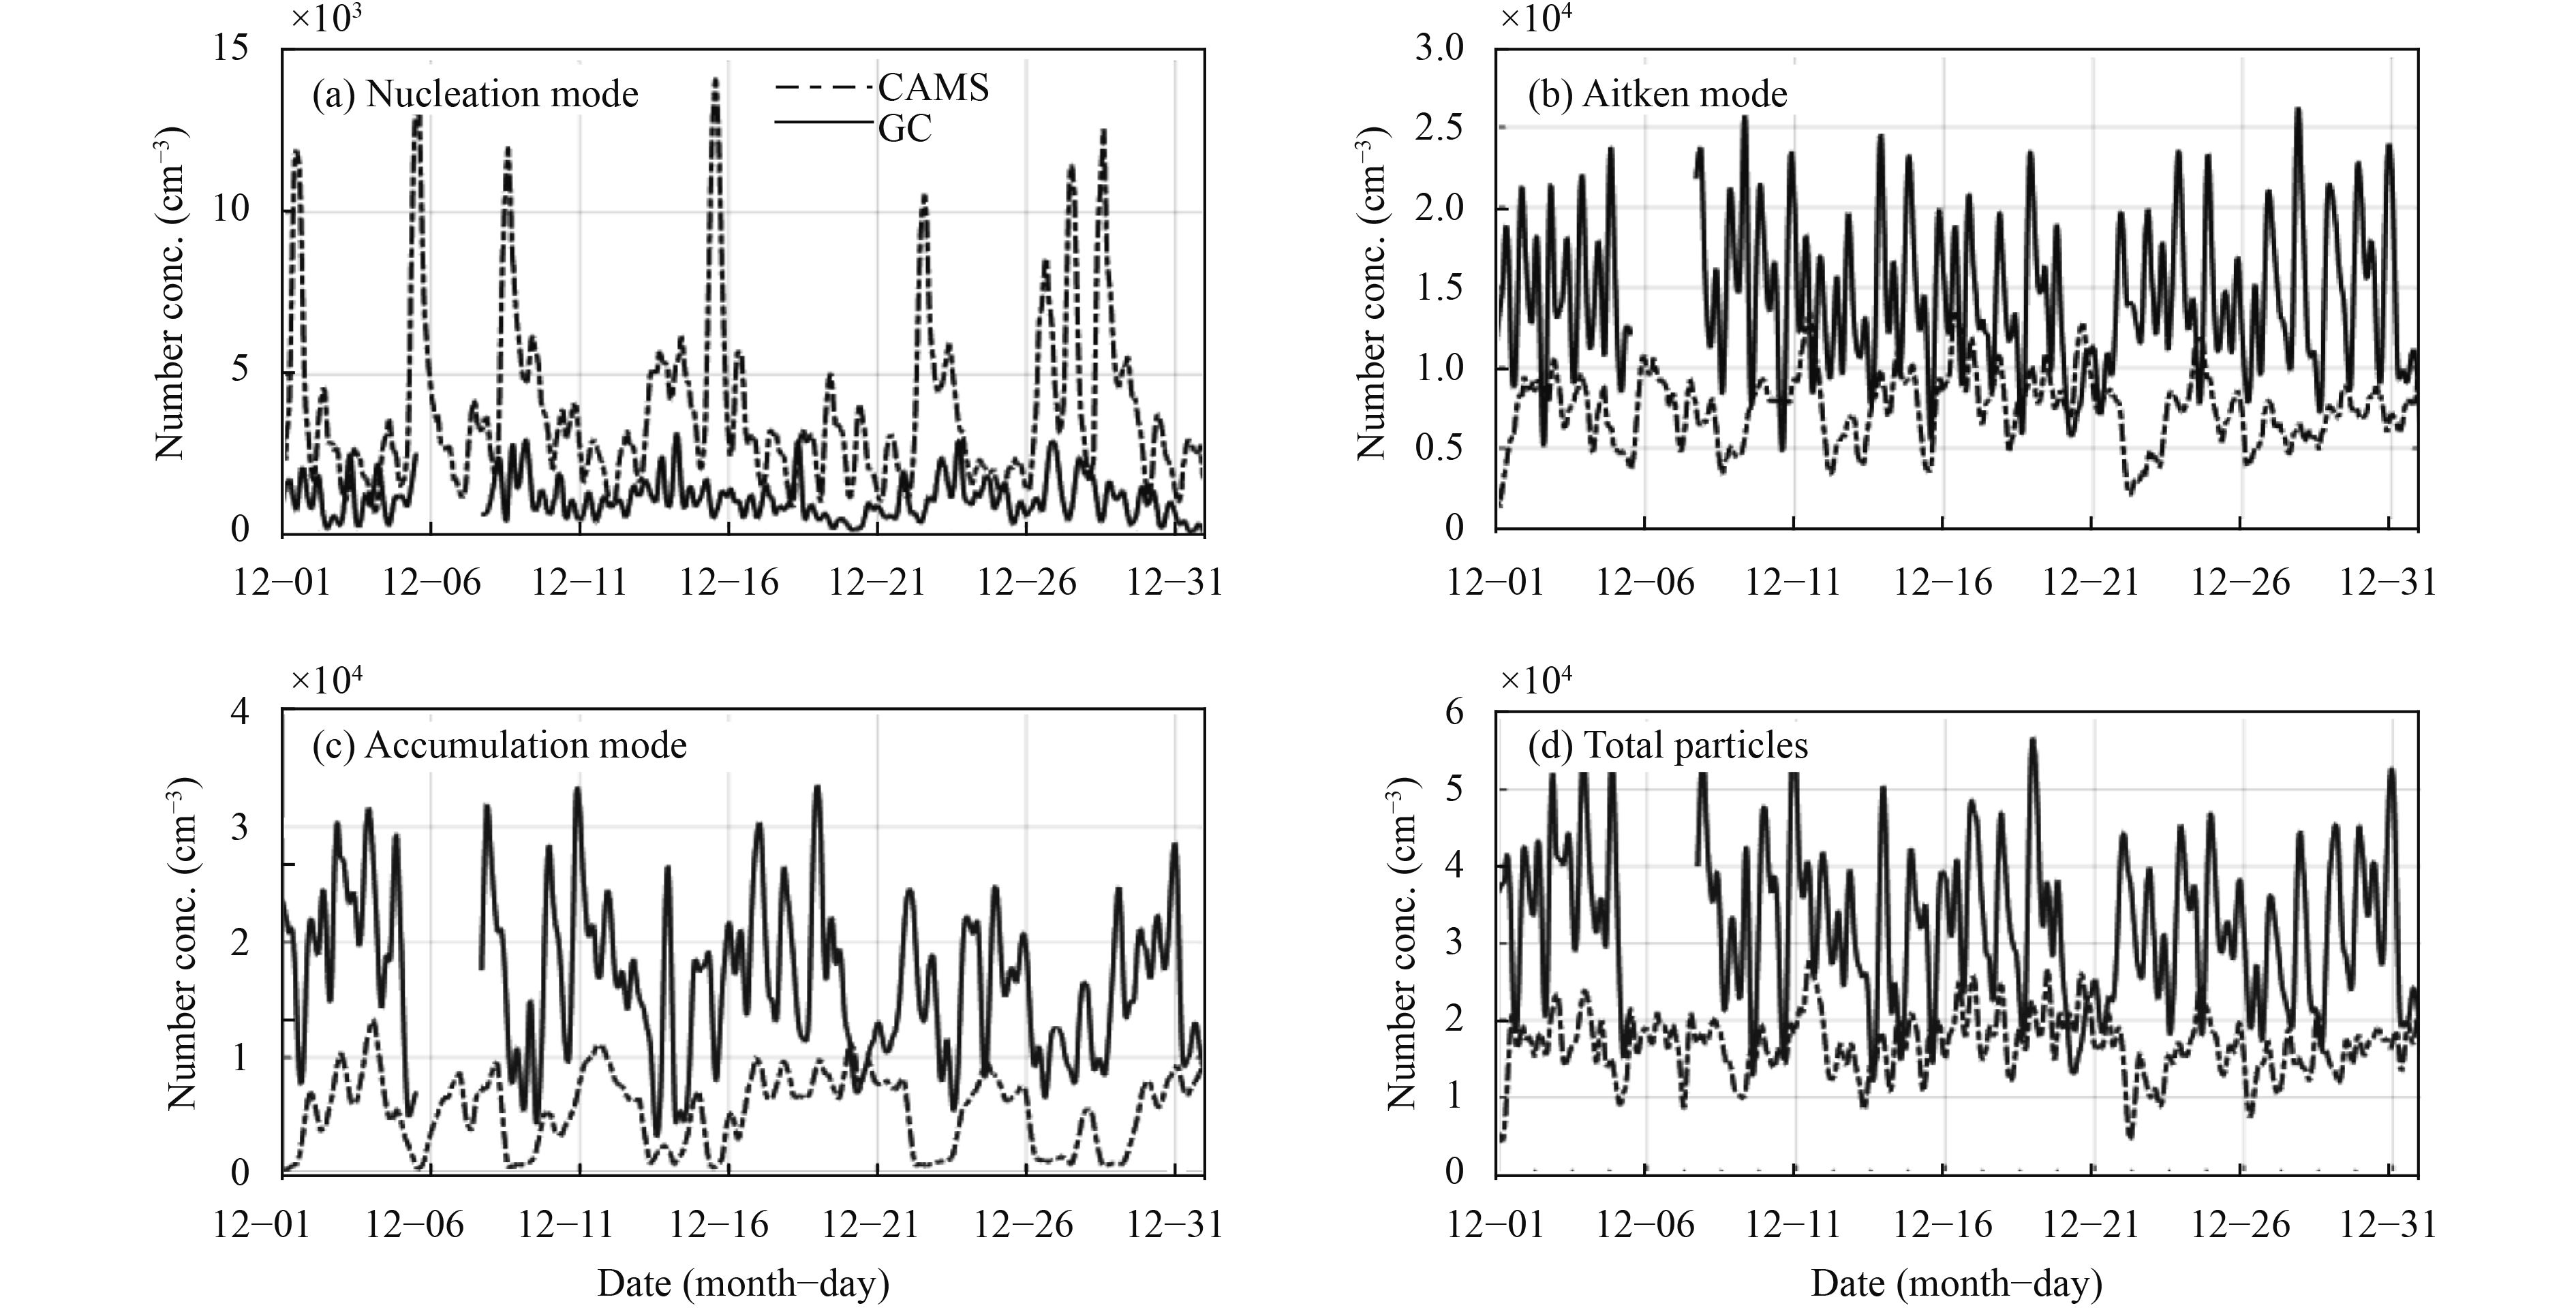
The number concentration of different modes was calculated and compared at the two sites (Fig. 6). The CAMS site showed a much higher nucleation mode number concentration. The mean Aitken mode particle number concentration at GC was 11,000 ± 4310 cm–3, which was approximately twice the value of 5090 ± 2210 cm–3 at the CAMS site. The accumulation mode particle number concentration was even higher at GC, with a number of 18,090 ± 7640 cm–3, which was more than 3 times the value of 5850 ± 3600 cm–3 at CAMS. Generally, the total particle number concentration was 28,020 ± 13,110 cm–3 at GC, a factor of two when compared with the value of 14,780 ± 4370 cm–3 at CAMS. It should be noted that the particle number concentration at GC was much higher than the results of 19,200 cm–3 at the SORPES station in Nanjing (Qi et al., 2015), 11,500 cm–3 at the rural site of Shangdianzi to the northeast of Beijing (Shen et al., 2011), and even more than 10 times the value of 2100 cm–3 at Mt. Waliguan (Kivekäs et al., 2009). The accumulation mode provided the largest contribution to the submicron particle number concentration at GC (with a contribution of 65%) compared to other continental sites that were usually dominated by ultrafine particles with a contribution of 70% to 90% (Wu et al., 2008; Vu et al., 2015). It had been known that the accumulation mode particles made a major contribution to the particle surface concentration. Thus, these particles had the potential ability to enhance the heterogeneous reactions in the atmosphere at GC.
|
| Figure 6 Hourly mean number concentration of different modes: (a) nucleation mode, (b) Aitken mode, (c) accumulation mode, and (d) total particles at CAMS (dashed line) and GC (solid line). |
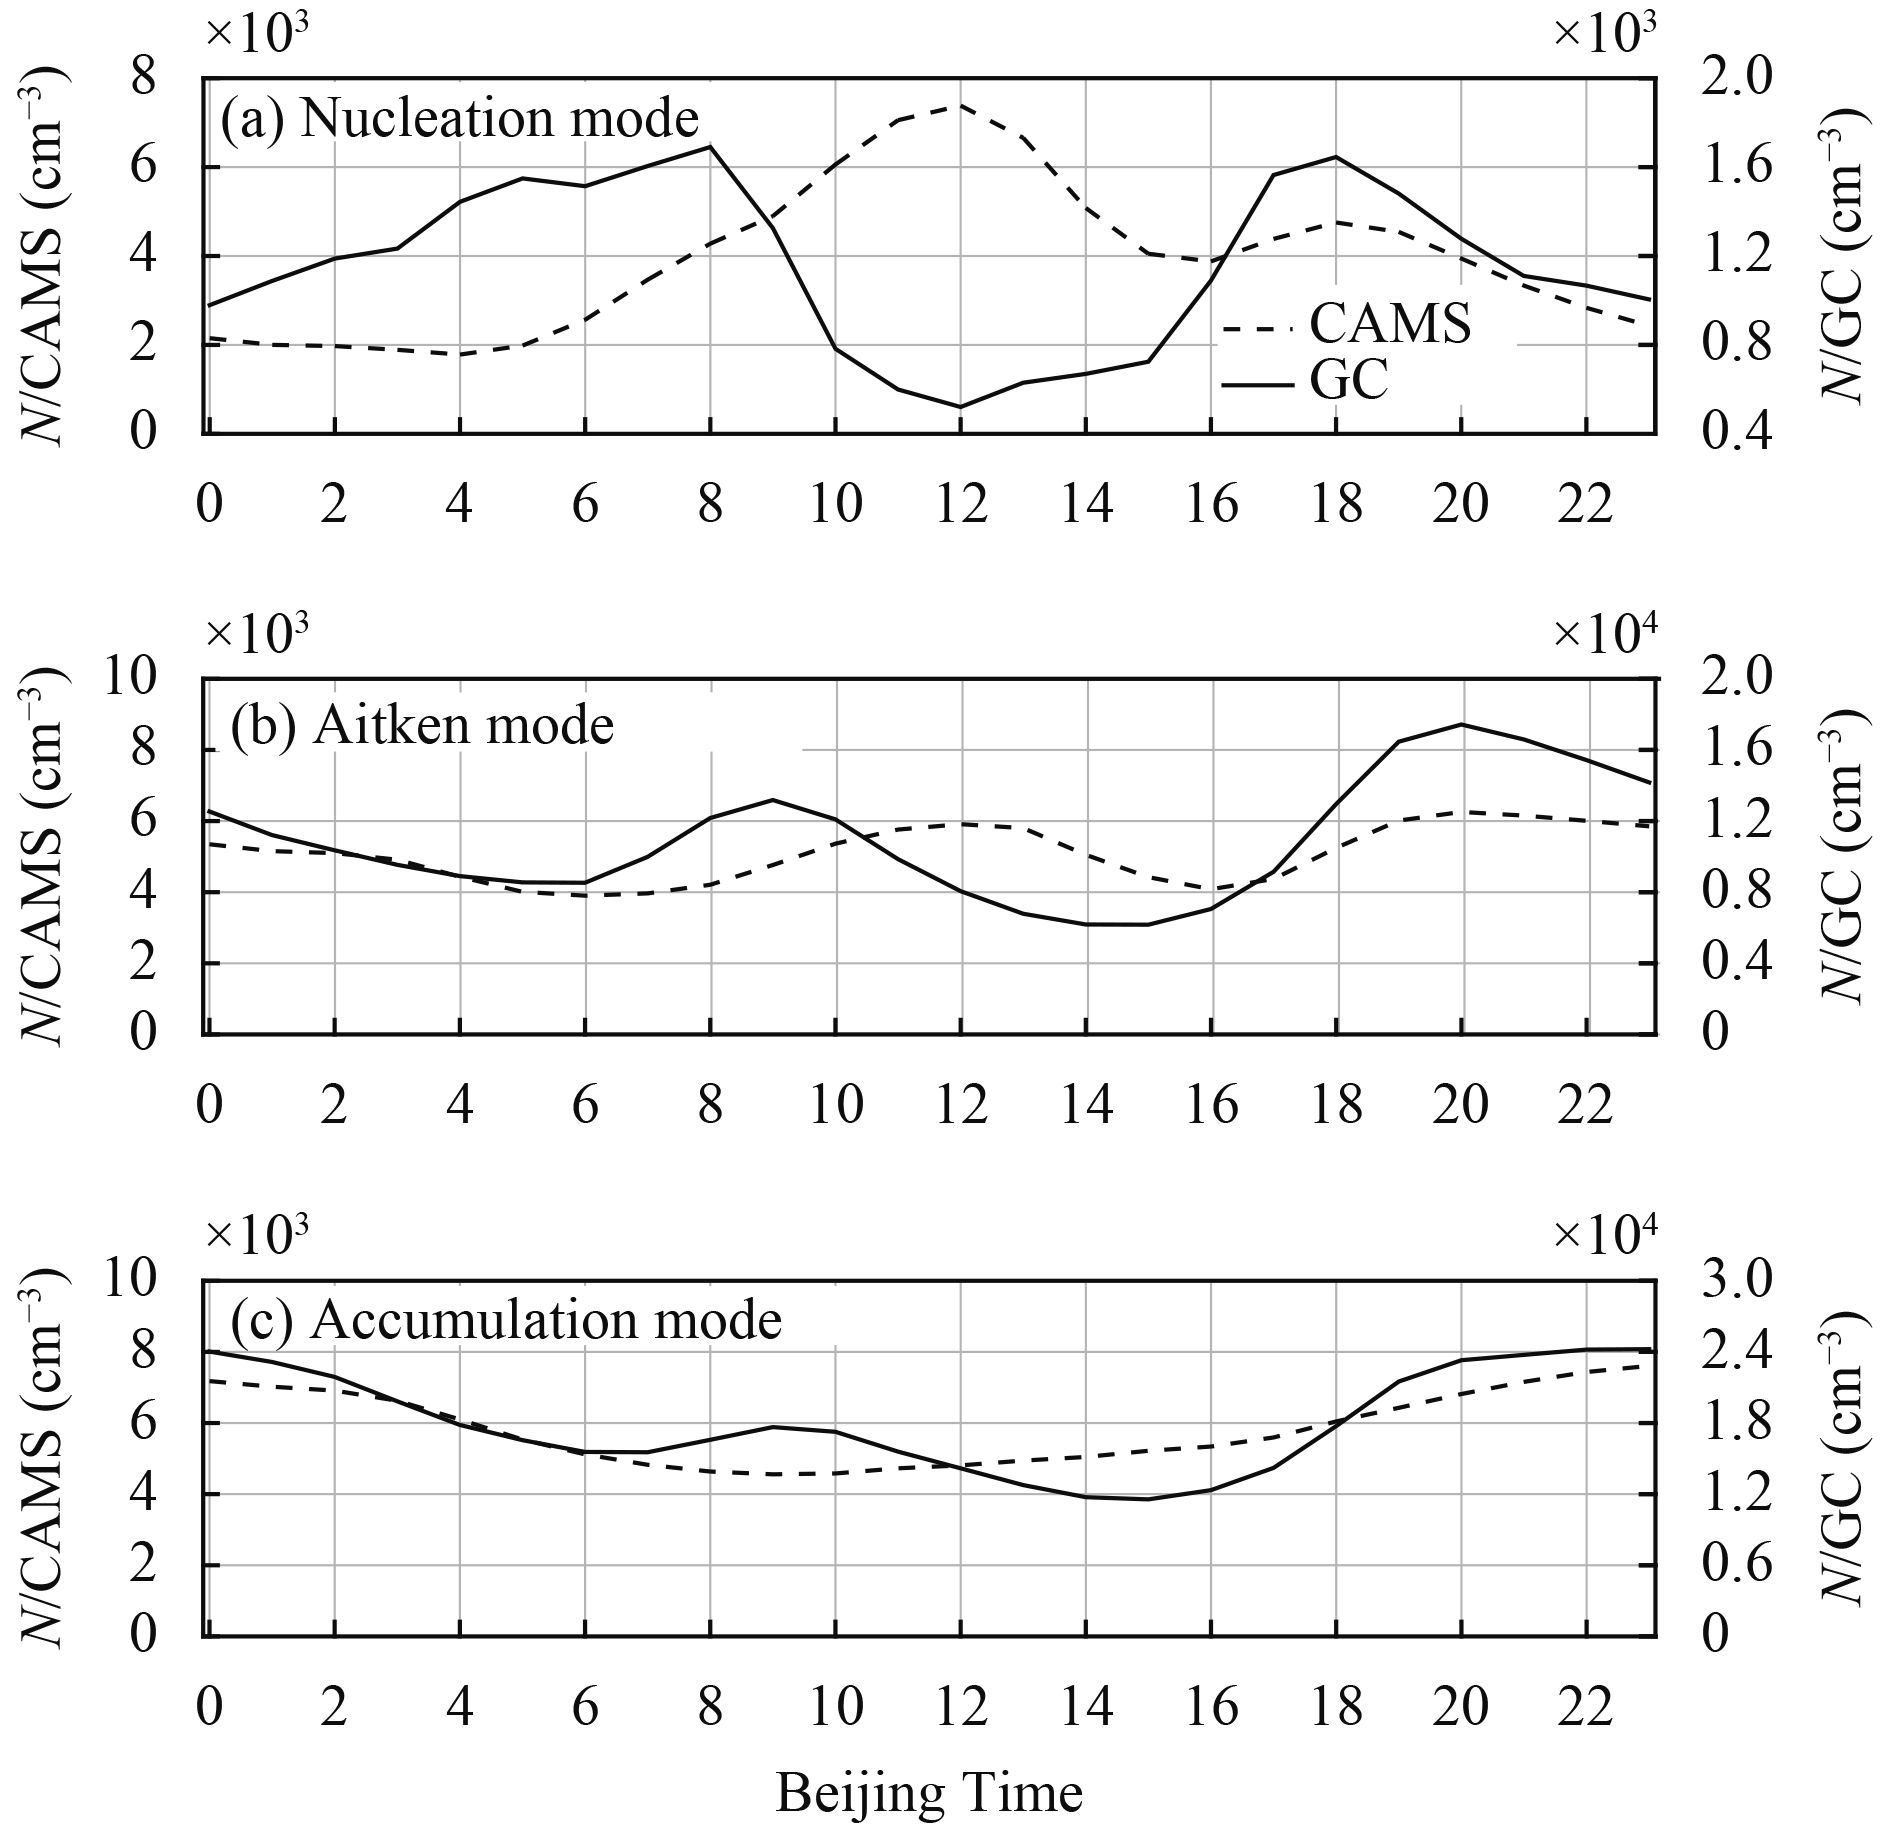
Different diurnal patterns were found for the nucleation, Aitken, and accumulation mode particles at CAMS and GC, indicating different aerosol sources at the two sites (Fig. 7). The diurnal variability of nucleation mode particles at CAMS was influenced by NPF events, with the peak observed around noon (Fig. 7a). The Aitken mode particle number concentration also showed a peak around noon at CAMS, which was due to the growth process of the nucleated particles. The CAMS site also showed high number concentration at nighttime (2200–0200 BT) because of the decreased planetary boundary layer (PBL) height, which was unfavorable for pollutant dispersion at night (Fig. 7b). The PBL height was retrieved from the vertical profiles of the aerosol optical parameters measured by a Mie-Elastic backscattering polarization lidar at 532 nm at the Institute of Atmospheric Physics in northern urban area of Beijing, approximately 6 km from CAMS (Zhong et al., 2017). The data showed that the PBL height was usually 0.5–1.5 km at daytime, and lower than 0.5 km at nighttime and even daytime during severe polluted episodes in Beijing. Thus, the accumulation mode particle number concentrations at both stations were high at night (Fig. 7c). The nucleation mode particle number concentration at GC was approximately an order of magnitude lower than that at CAMS but showed a clear bimodal diurnal pattern with peaks at approximately 0800 and 1800 BT (Fig. 7a). This concentration was probably affected by the continuous vehicle emissions, as there was no NPF event observed at GC site during the measurement and it was located close to the highway. However, the scavenging of small particles by the condensation and coagulation processes was faster due to the high accumulation mode particles, which resulted in the low concentration of nucleation mode particles. The diurnal variability of Aitken mode particle concentration at GC also displayed a bimodal pattern, peaking at 0900 and 2000 BT (Fig. 7b). Furthermore, the morning peak was 3 h ahead of CAMS (1200 BT), suggesting different sources of Aitken mode particles at the two sites. At CAMS, the traffic emission and growth of nucleation mode particles were the major contributors to the Aitken mode, whereas the traffic emission was more dominated at GC.
|
| Figure 7 Diurnal patterns of hourly mean number concentration (N, cm–3) of (a) nucleation mode, (b) Aitken mode, and (c) accumulation mode at CAMS (dashed line, left axis) and GC (solid line, right axis). |
The comparison results between the hourly mean absorption coefficient (σabs, 637) and the number concentration of the Aitken mode and accumulation mode particles (Nait and Nacc) are given in Fig. 8. The absorption coefficient is mainly determined by the soot particles (or black carbon) emitted by the fuel combustion process. The good relationship between absorption coefficient and accumulation mode particles suggested that the aged soot particles were concentrated in the accumulation mode. It has been reported in the study conducted in Beijing that the fresh soot particles were sized at 30 nm, and after several hours they became aged, reaching the size of 100–300 nm (Cheng et al., 2012). Biofuel burning for domestic heating in winter, and coal-fired power plants and factories in Hebei province were the possible causes for the high number concentration of accumulation mode particles at GC site. It was also reported that higher concentrations of SO2 and CO were 227 and 5.4 μg m–3 in January 2013 at Shijiazhuang (capital city of Hebei Province, 160 km southwest of GC station), almost four times and twice as the concentrations in Beijing, respectively (Wang Y. S. et al., 2014). But the mass concentration of NOx at Shijiazhuang was only 30% higher, indicating that coal combustion was the important emission source in Hebei in winter. The Aitken mode showed a weak correlation with σabs, 637 since it was contributed primarily by the vehicle emissions.

|
| Figure 8 Comparison of absorption coefficient (σabs, 637) vs. number concentration of (a) Aitken mode and (b) accumulation mode particles. |
The condensation sink (CS) is defined as CS =
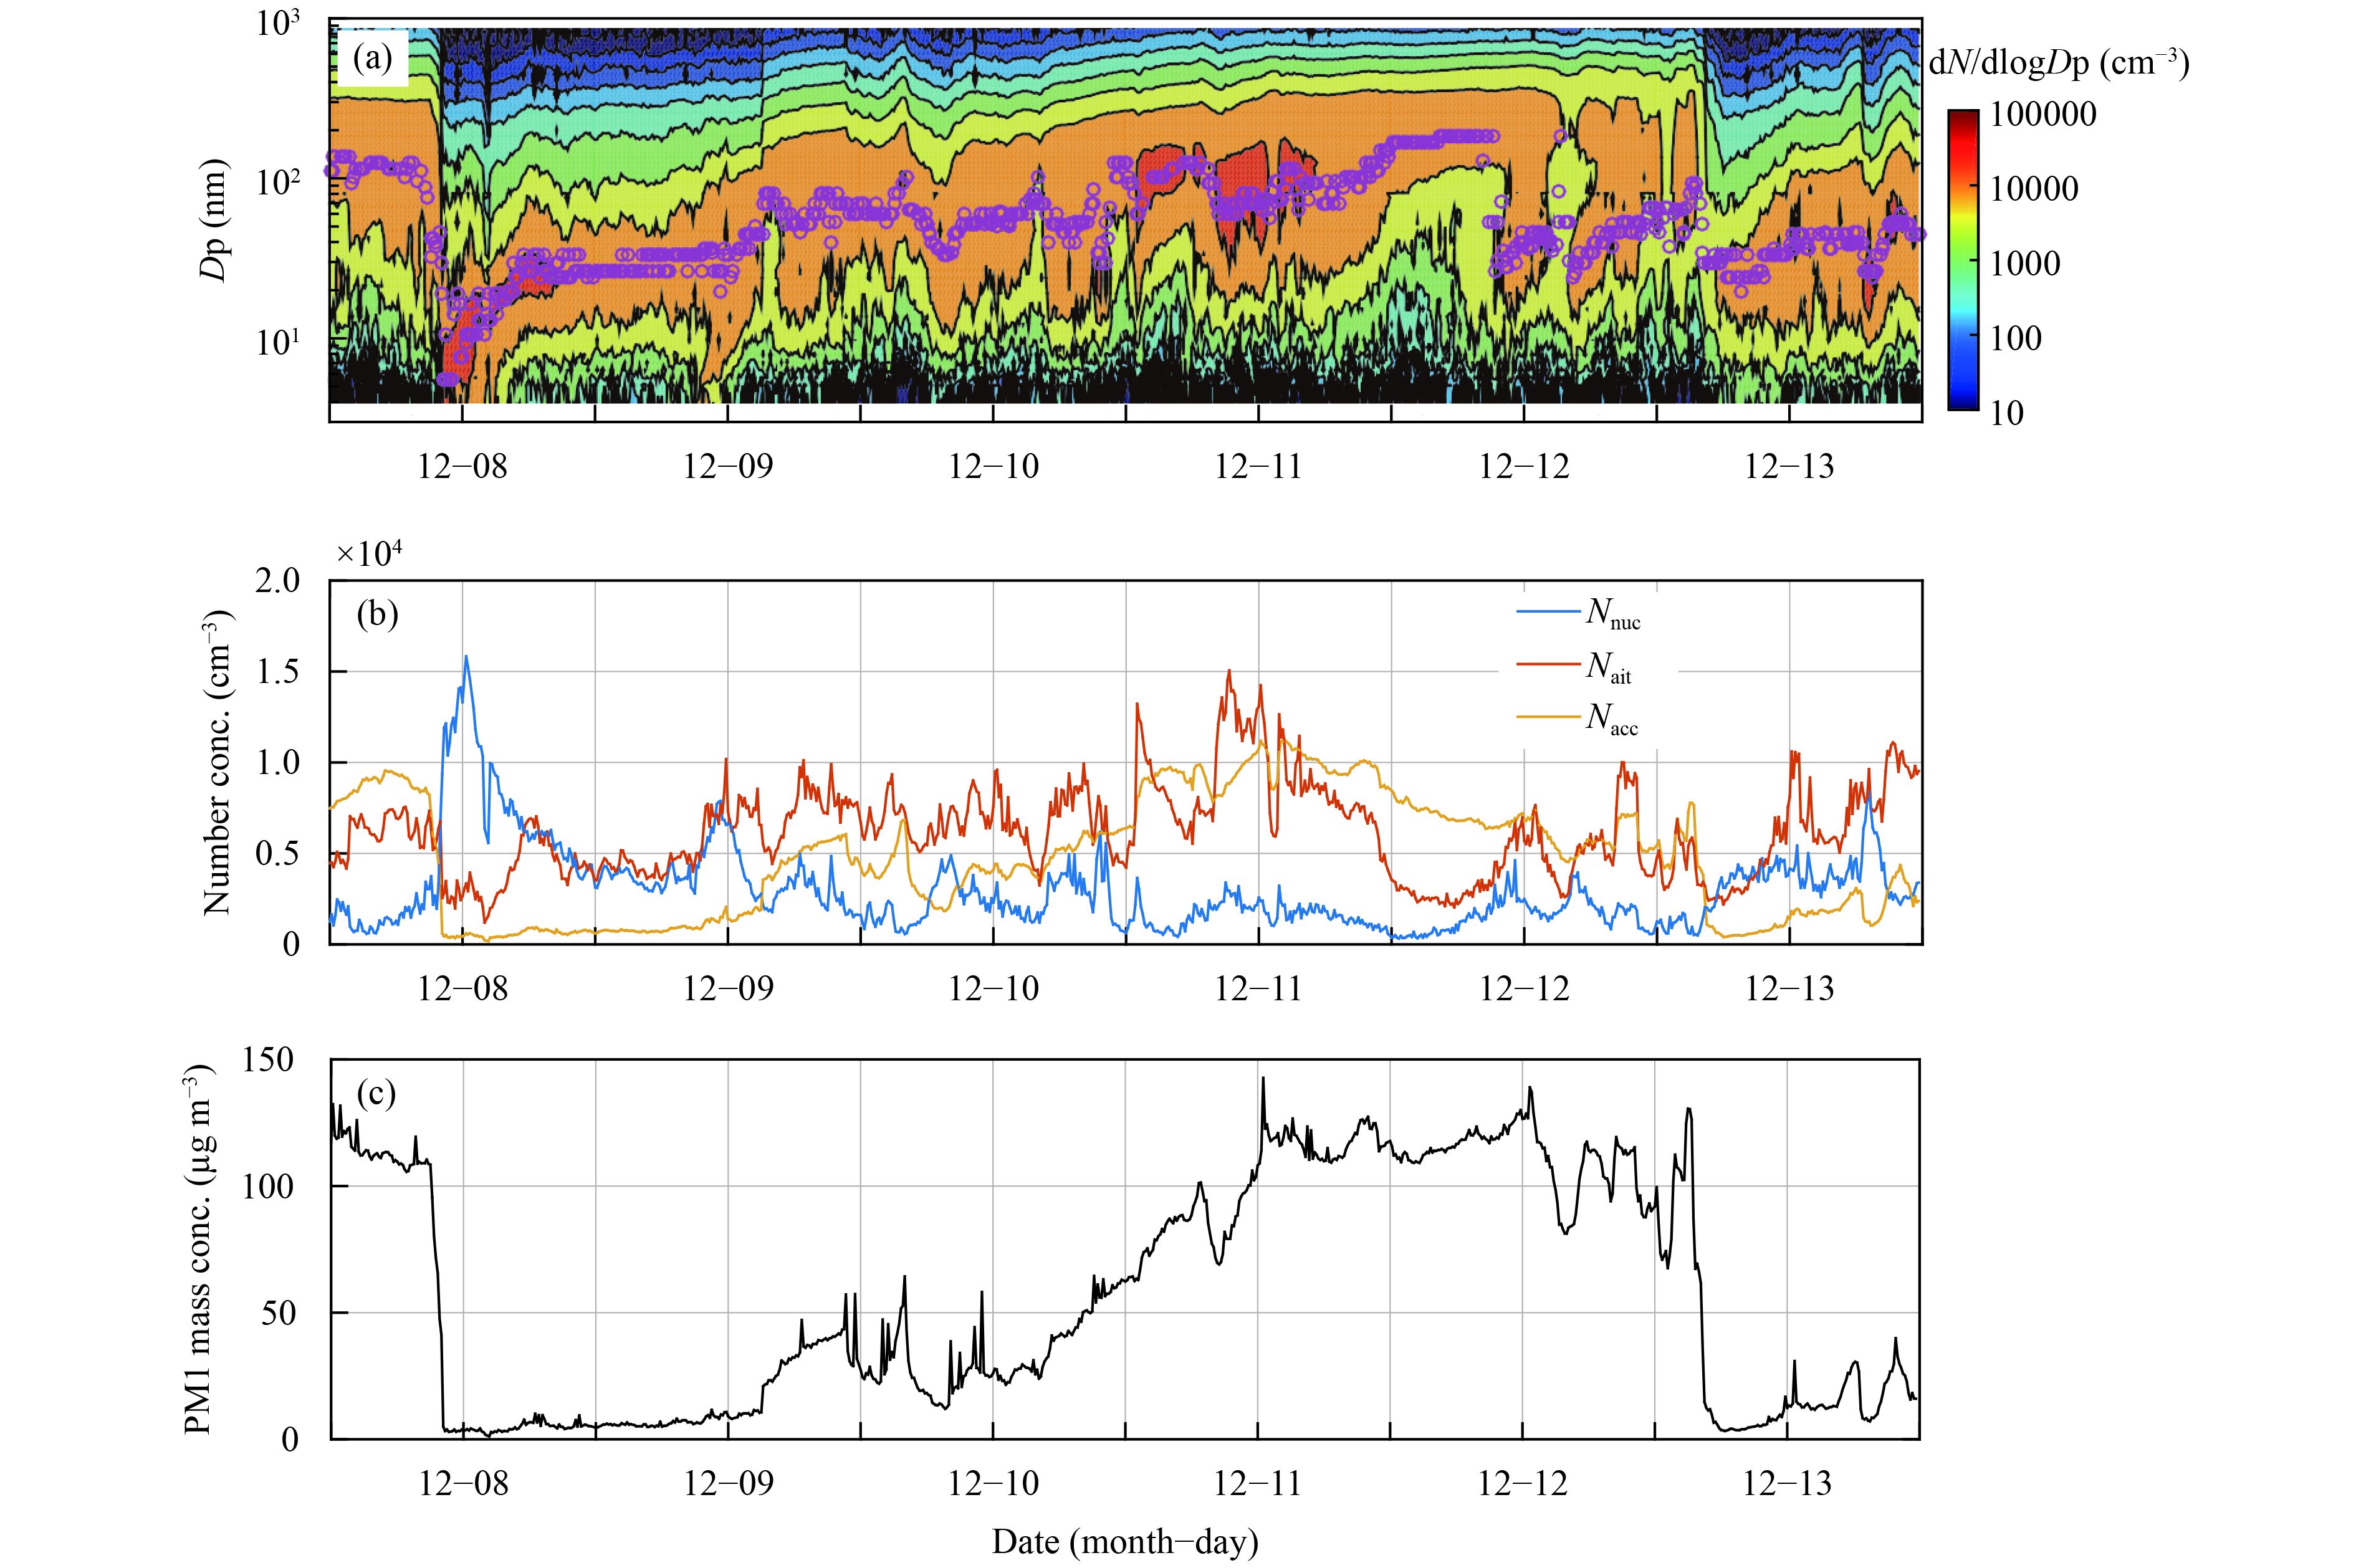
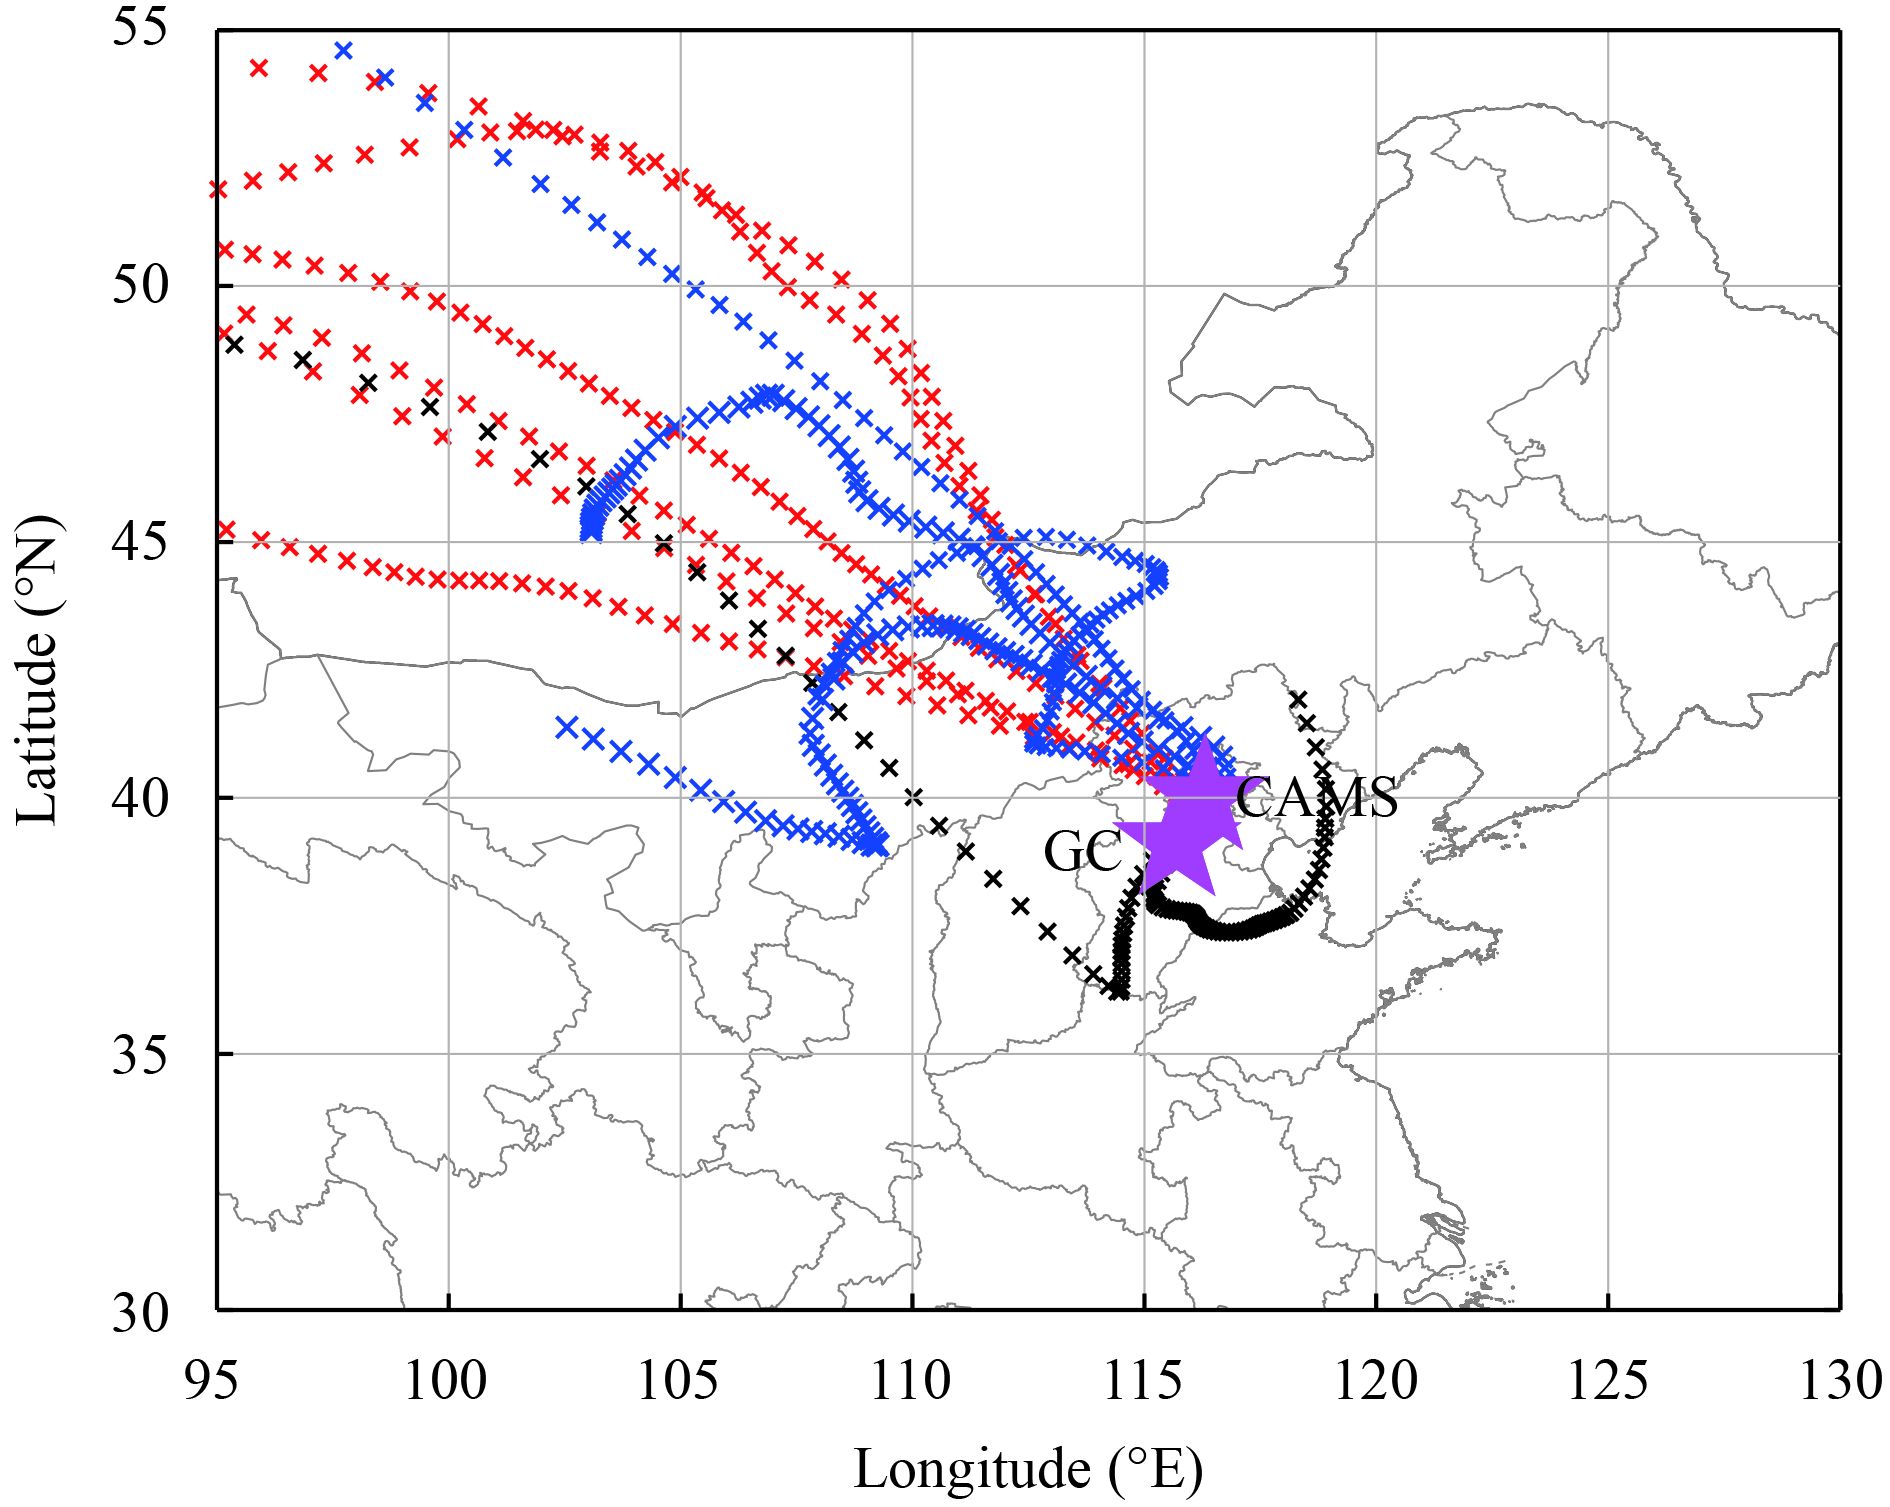
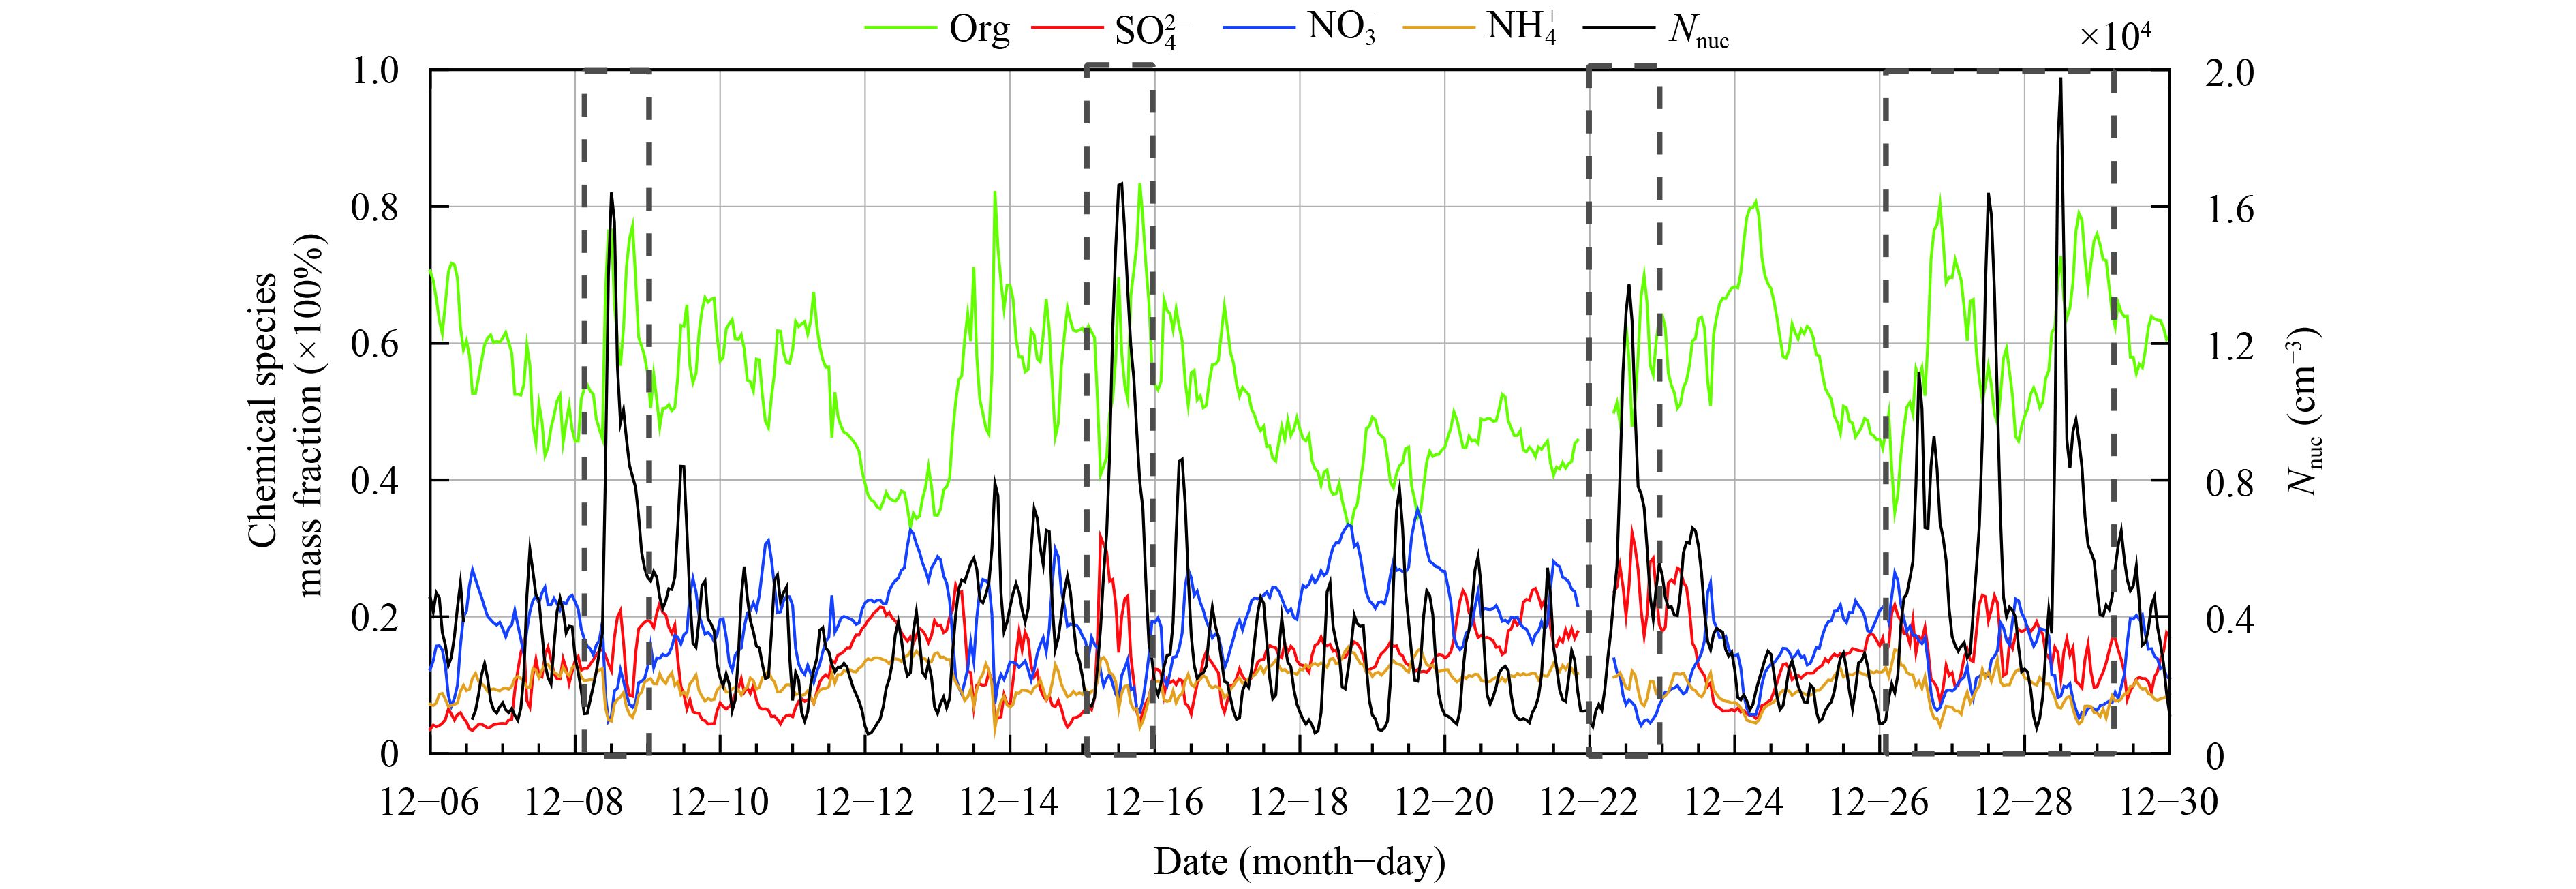
Among the 8 NPF events observed at the CAMS site, there were 6 cases with growth processes lasting over 2–3 days, when the nucleated particles grew to a size of 100 nm. An example of this kind of regional NPF event occurred on 8 December and stopped growing at noon on 11 December (Fig. 9). The 72-h back trajectories arriving at CAMS at 1400 and 2000 BT and at 100 m above ground level in altitude were calculated by using the TrajStat software (Wang et al., 2009). The calculation result of back trajectories during 8–13 December at CAMS showed favorable air mass, with clean and dry air originated from the central East Asia dominating the area from 8 December until noon on 11 December (Fig. 10). Next, the air mass passing through the sourthern North China Plain arrived on 11 December, which favored particle accumulation and could prevent the nucleated particles from growing further. The chemical information of the non-refractory submicron particles, derived by using AMS, was available from 6 to 30 December 2016, and revealed that the organics were the dominant component durring the measurement and its mass fraction also increased during NPF events (Fig. 11). The characteristics of chemical species evolution at CAMS and GC was given in detail in Zhang et al. (2018). For the inorganic components, nitrate provided the largest contribution, except during NPF event days, when sulfate accounted for a larger portion, as shown in Fig. 11. This finding revealed that sulfate and organics could be the dominant precipitant during the NPF process, especially at the stage when nucleated particles have not reached the CCN size of 50–80 nm, where the particles could be activated as CCN under the supersaturation of 0.28%–0.5% in Beijing (Gunthe et al., 2011). As reported in previous studies, the gaseous sulfate acid and organic vapors have been identified as the key component in the nucleation and initial growth process in urban Beijing (Wang et al., 2011). The nucleation mode particles grew into the CCN size continuously and resulted in a mass concentration of over 100 μg m–3 for this case, which potentially led to the observed haze during this period. The influence of NPF events on air pollution had also been reported in a previous study in Beijing by Guo et al. (2014).
|
| Figure 9 An NPF case with a long-lasting growth process that occurred at 1200 BT during 8–13 December 2016 at CAMS. (a) PNSD evolution, (b) number concentration of each mode, and (c) calculated PM1 mass concentration. The purple dots in (a) indicates the geometric mean dia-meter of PNSD. |
|
| Figure 10 72-h back trajectories arriving at CAMS during 8–13 December. The red, black, and blue lines represent the trajectories on 8–10, 11, and 12–13 December, respectively. |
|
| Figure 11 Mass fraction of the chemical species of the non-refractory submicron particles, including organics, sulfate, nitrate, and ammonium on the left axis and nucleation mode concentration on the right axis. The dashed-line gray boxes indicate the NPF events. |
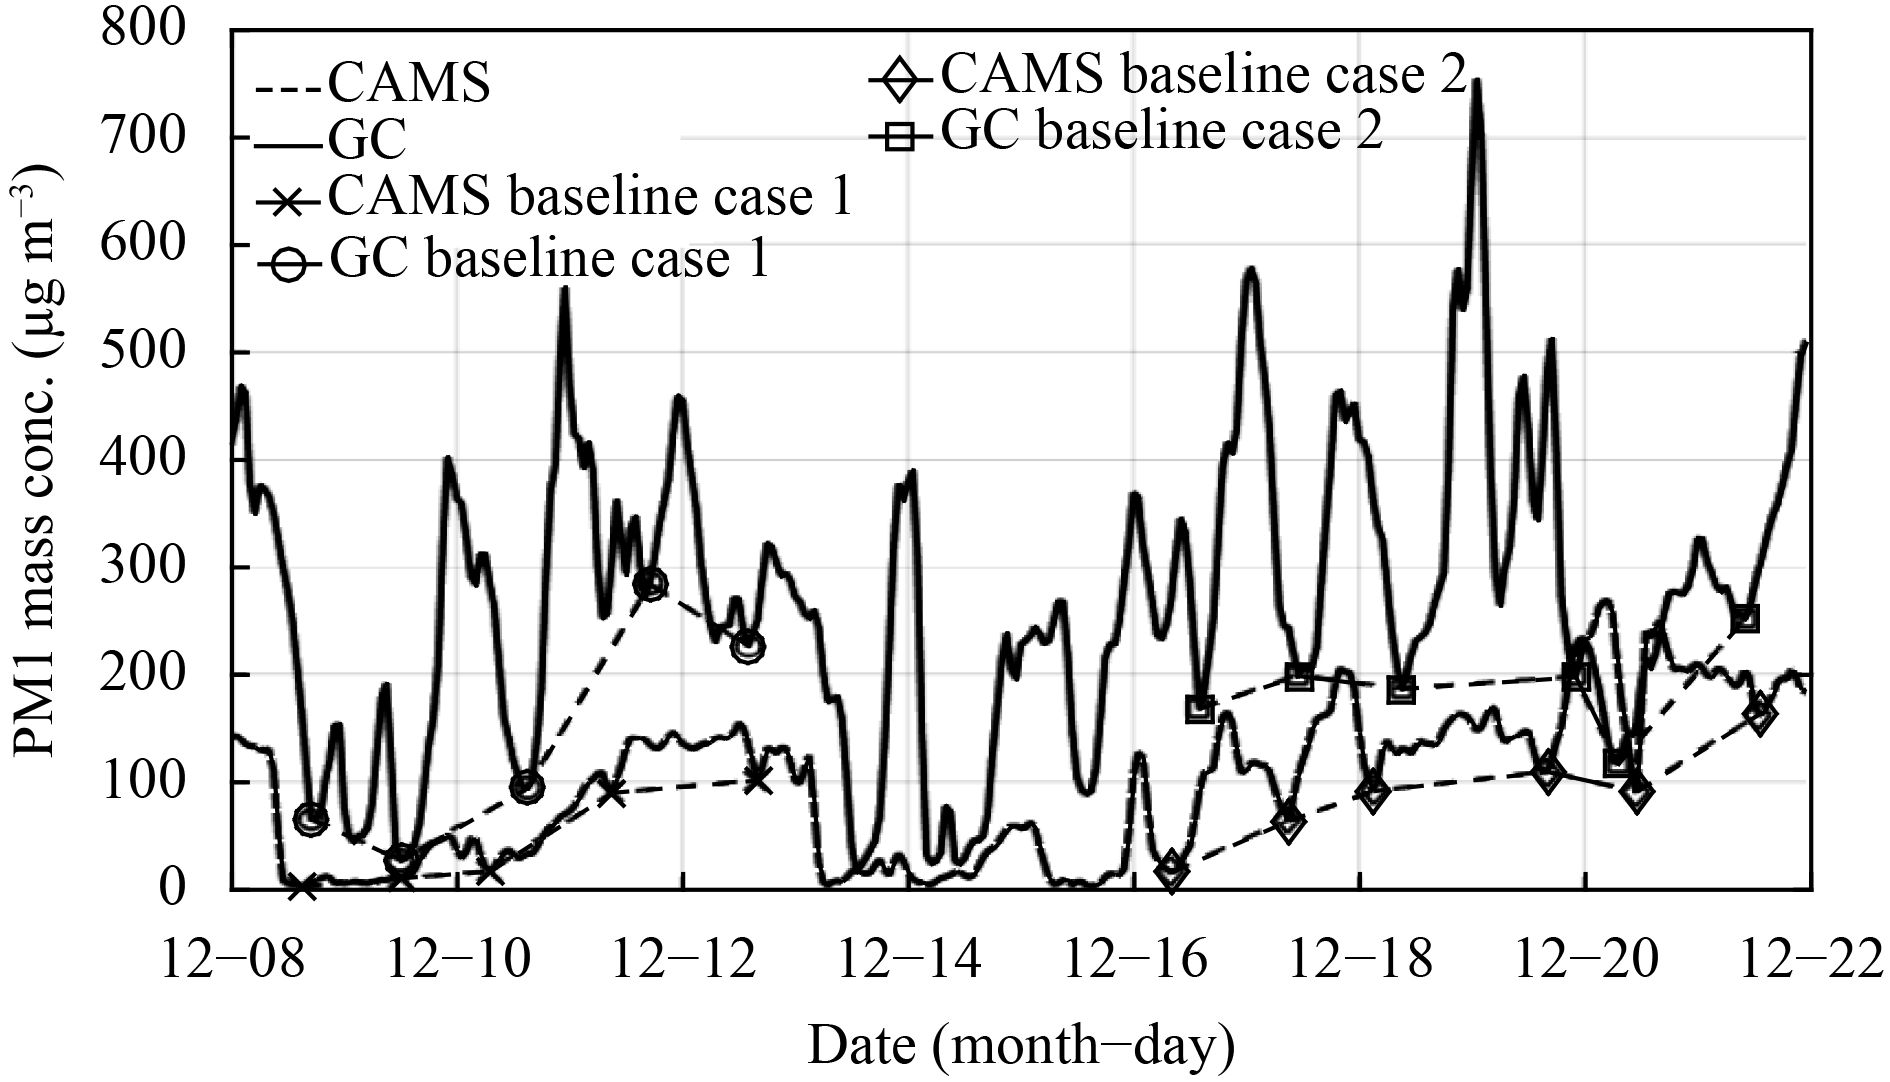
Two sawtooth pollution episodes, case 1 (8–12 Dece-mber) and case 2 (16–21 December), were selected at the two sites to quantify the contribution to the PM1 mass concentration from the regional and local sources. Red alert was issued for case 2 by the Beijing city government due to the severe and long-lasting haze–fog days. During the red alert, high polluting vehicles were not permitted on the roads and other vehicles were restricted based on an odd-or-even license plate rule. Construction sites and certain factories were shut down.
A method developed by Jia et al. (2008) was used to quantify the local and regional contribution to the particle mass concentration. We employed the following procedure: (1) selecting the baseline of the PM1 mass concentration, on which the daily peaks build during the sawtooth pollution process. The baselines were represented by the daily minima mass concentration for simplicity, given that the local aerosols were the most diluted. As shown in Fig. 12, the chosen baselines are represented by the blue dashed line for GC and the pink line for CAMS for case 1, and cyan and orange dashed lines at GC and CAMS for case 2, respectively. (2) Calculating the total area under the curve of PM1 mass concentration for cases 1 and 2, which are represented by St, 1 and St, 2. Next, the area beneath the baseline was calculated for cases 1 and 2, as represented by Sr, 1 and Sr, 2. (3) The next step was to determine the regional and local percentage, as represented by R = Sr / St × 100% and 1 – R, respectively. For case 1 at CAMS, Sr, 1 and St, 1 were 170.3 and 364.8 μg m–3 day, respectively. At GC, Sr, 1 and St, 1 were 551.8 and 1277.0 μg m–3 day, respectively. At CAMS, the regional contribution to PM1 mass concentration was 47%, and the local was 53%. At GC, the contributions were 43% for regional and 57% for local. For case 2, Sr, 2 and St, 2 were 488.7 and 901.5 μg m–3 day at CAMS, respectively. At GC, Sr, 2 and St, 2 were 911.0 and 1918.0 μg m–3 day, respectively. The contribution to PM1 mass concentration at CAMS was determined to be 54% regional and 46% local. At GC, the regional contribution was 47% regional and 53% local. The result was consistent with a previous study in which regional aerosols accounted for 50% of the aerosols in Beijing on average (Jia et al., 2008). It was also comparable with the modeling results of a haze episode in January 2013, when 45%–75% of the aerosols in the Jing–Jin–Ji region was contributed by regional transport (Wang Z. F. et al., 2014). It was also observed that during the red-alert period of case 2, the contribution from regional sources increased at both sites with increments of 7% at CAMS and and 4% at GC, due to the implementation of emission control.
|
| Figure 12 Hourly mean value of PM1 during 8–21 December at CAMS and GC, respectively. The daily minima were chosen as the baseline for case 1 and case 2, marked by lower dashed lines. |
To understand the characteristics and mechanism of regional air pollution in the Jing–Jin–Ji region during the winter of 2016, an extensive measurement campaign of physical, chemical, and optical properties of aerosols was conducted simultaneously at an urban station, CAMS, in Beijing and a rural station, GC, in Hebei Province. The comparison results of particle number size distribution (PNSD) at the two sites showed a considerably higher number concentration and larger geometric mean diame-ter at the GC station. During the measurement, the mass and number concentration of submicron particles at GC were approximately 270 μg m–3 and 28,000 cm–3, respectively. Thus, the PM1 mass concentration at GC was three times the values at CAMS, and the number concentration was twice as large. This finding is especially pronounced for the accumulation mode, which accounted for approximately 65% of the submicron particles. This finding also differs from previous studies, which found that the number concentration was dominated by the ultrafine particles. High concentration of accumulation mode particles at GC was probably related to the coal burning for domestic heating and factory works during winter, as it showed a good relationship with the light-absorbing material mainly containing soot particles.
The mean condensation sink at GC was 0.2 s–1, which was 10 times the value (0.02 s–1) during the nucleation process reported by previous studies in China. Thus, there was no new particle formation (NPF) event observed at GC, whereas eight events occurred at CAMS. At the CAMS site, we found that the organics overwhelmed during the whole measurement and inorganics of submicron particles was dominated by nitrate on non-NPF days, but sulfate constituted a larger proportion on NPF days. This indicates the important role that sulfate and organics played in the nucleation process in this heavy pollution event.
An estimation method was employed to quantify the regional and local aerosol sources at CAMS and GC. The results revealed that the contribution from regional and local sources during two sawtooth polluting periods was approximately 50% at the two sites, with higher regional contribution during the red-alert period because of the emission control. This study also showed that the extreme haze–fog was a regional phenomenon and that the joint prevention and control mechanism in the Jing–Jin–Ji region was necessary.
Acknowledgments. This study was also supported by the CMA Innovation Team for Haze–Fog Observation and Forecasts.
| Birmili, W., L. Tomsche, A. Sonntag, et al., 2013: Variability of aerosol particles in the urban atmosphere of Dresden (Germany): Effects of spatial scale and particle size. Meteor. Z., 22, 195–211. DOI:10.1127/0941-2948/2013/0395 |
| Cheng, Y. F., H. Su, D. Rose, et al., 2012: Size-resolved measurement of the mixing state of soot in the megacity Beijing, China: Diurnal cycle, aging and parameterization. Atmos. Chem. Phys., 12, 4477–4491. DOI:10.5194/acp-12-4477-2012 |
| Cohen, J. B., 2014: Quantifying the occurrence and magnitude of the Southeast Asian fire climatology. Environ. Res. Lett., 9, 114018. DOI:10.1088/1748-9326/9/11/114018 |
| Cohen, J. B., and C. Wang, 2014: Estimating global black carbon emissions using a top-down Kalman filter approach. J. Geophys. Res., 119, 307–323. DOI:10.1002/2013JD019912 |
| Dal, Maso, Kulmala M., Riipinen M., et al., 2005: Formation and growth of fresh atmospheric aerosol: Eight years of aerosol size distribution data from SMEAR II, Hyytiälä, Finland. Boreal Environ. Res., 10, 323–336. |
| Fuks, N. A., and A. G. Sutugin, 1970: Highly Dispersed Aerosols. Ann Arbor Science Publishers, Ann Arbor, London, 47–60. |
| Gunthe, S. S., D. Rose, H. Su, et al., 2011: Cloud condensation nuclei (CCN) from fresh and aged air pollution in the megacity region of Beijing. Atmos. Chem. Phys., 11, 11023–11039. DOI:10.5194/acp-11-11023-2011 |
| Guo, S., M. Hu, M. L. Zamora, et al., 2014: Elucidating severe urban haze formation in China. Proc. Natl. Acad. Sci. USA, 111, 17373–17378. DOI:10.1073/pnas.1419604111 |
| Hussein, Dal Maso, Petäjä T., et al., 2005: Evaluation of an automatic algorithm for fitting the particle number size distributions. Boreal Environ. Res., 10, 337–355. |
| Jia, Y. T., K. A. Rahn, K. B. He, et al., 2008: A novel technique for quantifying the regional component of urban aerosol solely from its sawtooth cycles. J. Geophys. Res., 113, D21309. DOI:10.1029/2008JD010389 |
| Kivekäs, Sun, Zhan N., et al., 2009: Long term particle size distribution measurements at Mount Waliguan, a high-altitude site in inland China. Atmos. Chem. Phys., 9, 5461–5474. DOI:10.5194/acp-9-5461-2009 |
| Kulmala, Dal Maso, M. Mäkelä M., et al., 2001: On the formation, growth and composition of nucleation mode particles. Tellus B, 53, 479–490. DOI:10.3402/tellusb.v53i4.16622 |
| Kulmala, Vehkamäki, Petäjä M., et al., 2004: Formation and growth rates of ultrafine atmospheric particles: A review of observations. J. Aeros. Sci., 35, 143–176. DOI:10.1016/j.jaerosci.2003.10.003 |
| Kulmala, Petäjä, Nieminen M., et al., 2012: Measurement of the nucleation of atmospheric aerosol particles. Nat. Protoc., 7, 1651–1667. DOI:10.1038/nprot.2012.091 |
| Kumar, P., L. Morawska, W. Birmili, et al., 2014: Ultrafine particles in cities. Environ. Int., 66, 1–10. DOI:10.1016/j.envint.2014.01.013 |
| Li, K., H. Liao, Y. H. Mao, et al., 2016: Source sector and region contributions to concentration and direct radiative forcing of black carbon in China. Atmos. Environ., 124, 351–366. DOI:10.1016/j.atmosenv.2015.06.014 |
| Ma, N., and W. Birmili, 2015: Estimating the contribution of photochemical particle formation to ultrafine particle number averages in an urban atmosphere. Sci. Total Environ., 512–513, 154–166. DOI:10.1016/j.scitotenv.2015.01.009 |
| Müller, S. Henzing, de Leeuw T., et al., 2011: Characterization and intercomparison of aerosol absorption photometers: Result of two intercomparison workshops. Atmos. Meas. Tech., 4, 245–268. DOI:10.5194/amt-4-245-2011 |
| Peng, J. F., M. Hu, Z. B. Wang, et al., 2014: Submicron aerosols at thirteen diversified sites in China: Size distribution, new particle formation and corresponding contribution to cloud condensation nuclei production. Atmos. Chem. Phys., 14, 10249–10265. DOI:10.5194/acp-14-10249-2014 |
| Pfeifer, S., W. Birmili, A. Schladitz, et al., 2014: A fast and easy-to-implement inversion algorithm for mobility particle size spectrometers considering particle number size distribution information outside of the detection range. Atmos. Meas. Tech., 7, 95–105. DOI:10.5194/amt-7-95-2014 |
| Qi, X. M., A. J. Ding, W. Nie, et al., 2015: Aerosol size distribution and new particle formation in the western Yangtze River Delta of China: 2 years of measurements at the SORPES station. Atmos. Chem. Phys., 15, 12445–12464. DOI:10.5194/acp-15-12445-2015 |
| Shen, X. J., J. Y. Sun, Y. M. Zhang, et al., 2011: First long-term study of particle number size distributions and new particle formation events of regional aerosol in the North China Plain. Atmos. Chem. Phys., 11, 1565–1580. DOI:10.5194/acp-11-1565-2011 |
| Shen, X. J., J. Y. Sun, X. Y. Zhang, et al., 2016a: Particle climatology in central East China retrieved from measurements in planetary boundary layer and in free troposphere at a 1500-m-high mountaintop site. Aerosol Air Qual. Res., 16, 689–701. DOI:10.4209/aaqr.2015.02.0070 |
| Shen, X. J., J. Y. Sun, X. Y. Zhang, et al., 2016b: Key features of new particle formation events at background sites in China and their influence on cloud condensation nuclei. Front. Environ. Sci. Eng., 10, 5. DOI:10.1007/s11783-016-0833-2 |
| Sun, J. Y., Q. Zhang, M. R. Canagaratna, et al., 2010: Highly time- and size-resolved characterization of submicron aerosol particles in Beijing using an aerodyne aerosol mass spectrometer. Atmos. Environ., 44, 131–140. DOI:10.1016/j.atmosenv.2009.03.020 |
| Vu, T. V., J. M. Delgado-Saborit, and R. M. Harrison, 2015: Review: Particle number size distributions from seven major sources and implications for source apportionment studies. Atmos. Environ., 122, 114–132. DOI:10.1016/j.atmosenv.2015.09.027 |
| Wang, Y. Q., X. Y. Zhang, and R. R. Draxler, 2009: TrajStat: GIS-based software that uses various trajectory statistical analysis methods to identify potential sources from long-term air pollution measurement data. Environ. Modell. Softw., 24, 938–939. DOI:10.1016/j.envsoft.2009.01.004 |
| Wang, Z. B., M. Hu, D. L. Yue, et al., 2011: Evaluation on the role of sulfuric acid in the mechanisms of new particle formation for Beijing case. Atmos. Chem. Phys., 11, 12663–12671. DOI:10.5194/acp-11-12663-2011 |
| Wang, Z. B., M. Hu, J. Y. Sun, et al., 2013: Characteristics of regional new particle formation in urban and regional background environments in the North China Plain. Atmos. Chem. Phys., 13, 12495–12506. DOI:10.5194/acp-13-12495-2013 |
| Wang, H. L., B. Zhu, L. J. Shen, et al., 2014: Number size distribution of aerosols at Mt. Huang and Nanjing in the Yangtze River Delta, China: Effects of air masses and characteristics of new particle formation. Atmos. Res., 150, 42–56. DOI:10.1016/j.atmosres.2014.07.020 |
| Wang, Y. S., L. Yao, L. L. Wang, et al., 2014: Mechanism for the formation of the January 2013 heavy haze pollution episode over central and eastern China. Sci. China Earth Sci., 57, 14–25. DOI:10.1007/s11430-013-4773-4 |
| Wang, Z. F., J. Li, Z. Wang, et al., 2014: Modeling study of regional severe hazes over mid–eastern China in January 2013 and its implications on pollution prevention and control. Sci. China Earth Sci., 57, 3–13. DOI:10.1007/s11430-013-4793-0 |
| Wiedensohler, A., W. Birmili, A. Nowak, et al., 2012: Mobility particle size spectrometers: Harmonization of technical standards and data structure to facilitate high quality long-term observations of atmospheric particle number size distributions. Atmos. Meas. Tech., 5, 657–685. DOI:10.5194/amt-5-657-2012 |
| Wu, Z. J., M. Hu, S. Liu, et al., 2007: New particle formation in Beijing, China: Statistical analysis of a 1-year data set. J. Geophys. Res., 112, D09209. DOI:10.1029/2006jd007406 |
| Wu, Z. J., M. Hu, P. Lin, et al., 2008: Particle number size distribution in the urban atmosphere of Beijing, China. Atmos. Environ., 42, 7967–7980. DOI:10.1016/j.atmosenv.2008.06.022 |
| Yue, D. L., M. Hu, R. Y. Zhang, et al., 2011: Potential contribution of new particle formation to cloud condensation nuclei in Beijing. Atmos. Environ., 45, 6070–6077. DOI:10.1016/j.atmosenv.2011.07.037 |
| Zhang, R. H., Q. Li, and R. N. Zhang, 2014: Meteorological conditions for the persistent severe fog and haze event over eastern China in January 2013. Sci. China Earth Sci., 57, 26–35. DOI:10.1007/s11430-013-4774-3 |
| Zhang, Y. M., Y. Q. Wang, X. Y. Zhang, et al., 2018: Chemical components, variation, and source identification of PM1 during heavy air pollution episodes in Beijing. J. Meteor. Res., 32, 1–13. DOI:10.1007/s13351-018-7051-8 |
| Zheng, G. J., F. K. Duan, H. Su, et al., 2015: Exploring the severe winter haze in Beijing: The impact of synoptic weather, regional transport and heterogeneous reactions. Atmos. Chem. Phys., 15, 2969–2983. DOI:10.5194/acp-15-2969-2015 |
| Zhong, J. T., X. Y. Zhang, Y. Q. Wang, et al., 2017: Relative contributions of boundary-layer meteorological factors to the explosive growth of PM2.5 during the red-alert heavy pollution episodes in Beijing in December 2016 . J. Meteor. Res., 31, 809–819. DOI:10.1007/s13351-017-7088-0 |
| Zhou, Z., K. S., M. Wang P., et al., 2016: High time-resolved elemental components in fine and coarse particles in the Pearl River Delta region of southern China: Dynamic variations and effects of meteorology. Sci. Total Environ., 572, 634–648. DOI:10.1016/j.scitotenv.2016.05.194 |
 2018, Vol. 32


