 2018, Vol. 32
The Chinese Meteorological Society
Article Information
- CHI, Xiyuan, Pengzhen HE, Zhuang JIANG, et al., 2018.
- Acidity of Aerosols during Winter Heavy Haze Events in Beijing and Gucheng, China. 2018.
- J. Meteor. Res., 32(1): 14-25
- http://dx.doi.org/10.1007/s13351-018-7063-4
Article History
- Received April 29, 2017
- in final form August 27, 2017


2. Key Laboratory of Environmental Optics and Technology, Anhui Institute of Optics and Fine Mechanics, Chinese Academy of Sciences, Hefei 230031
The frequency and intensity of haze events in China have increased significantly in recent years as a result of economic development and the acceleration in urbanization. The large amounts of suspended fine particles with aerodynamic diameters of 2.5 μm (PM2.5) or less during haze events not only has the potential to harm human health by penetrating deeply into the lungs and contributing to cardiovascular morbidity and mortality (Brook et al., 2010; Cheng et al., 2013), but may also affect the climate by scattering and absorbing solar radiation (Seinfeld et al., 2004). Severe haze events with particulate matter as the dominant pollutant often occur in China, especially over the North China Plain (He et al., 2014; Jiang et al., 2015; Yang et al., 2015). The rapid increase in PM2.5 over the Beijing–Tianjin–Hebei region is related to stagnant meteorological conditions and regional transport from sources of large anthropogenic emissions (Liu et al., 2013; Sun et al., 2016). PM2.5 pollution during haze events is always contributed from secondary species, including both inorganic and organic species. Secondary inorganic aerosols (mainly SO42–, NO3–, and NH4+) account for a major fraction of PM2.5 and increase with increasing levels of pollution (Quan et al., 2014; Zhang et al., 2014). Secondary inorganic aerosols have been suggested to be the principal driving force for the rapid increase in PM2.5 concentrations (Wang et al., 2006; Zheng B. et al., 2015). The formation of SO42–, NO3–, and NH4+ (SNA) ions in fine particles is important during the evolution of haze.
Aerosol acidity is the aqueous concentration of H+, a crucial parameter in aerosol water. Aerosol acidity may influence the pH-dependent heterogeneous chemical processes that take place on aerosol surfaces, which contribute to the secondary growth of fine particulate matter. SO42– is mainly produced in the aqueous phase via oxidation by H2O2, O3, NO2, and O2 and is catalyzed by transition metals such as Feiii and Mnii in cloud droplets and aerosol water. Aqueous phase reactions are thought to be the dominant pathway for the formation of SO42– (Alexander et al., 2009; Zhang R. Y. et al., 2015), which is highly sensitive to pH (Chameides, 1984; Cheng et al., 2016). Aerosol acidity also directly affects the gas-particle partitioning of semi-volatile species, including NH3 and HNO3 (Keene et al., 2004) and the gas-to-particle conversion of these species (Van Oss et al., 1998; Nemitz et al., 2004). The formation of NO3– via the heterogeneous hydrolysis of N2O5 on the surface of moist aerosols is also influenced by the acidity of the aerosols (Pathak et al., 2009).
A severe haze event with a long duration and strong intensity blanketed North China, East China, and central China from 16 to 22 December 2016, covering an area > 1.0 × 10 6 km2. The peak concentrations of daily PM2.5 reached 500 μg m–3 and above, about 14 times the daily average PM2.5 concentration recommended by the World Health Organization (WHO, 2006). Beijing, located in the northern part of the polluted area in Hebei Province, suffered a periodic cycle of episodes of particulate matter pollution in autumn and winter (Guo et al., 2014) and six haze events occurred in December alone in 2016. Peripheral regions to the south of Beijing in Hebei Province, which are both highly populated and heavily industrialized, experienced more severe air pollution. Studies focused on the ionic composition during this extreme haze event may help to characterize the formation and evolution of secondary inorganic aerosols in PM2.5 and provide observational data for the government to adopt effective measures to improve air quality in the Beijing–Tianjin–Hebei region.
The concentration of water-soluble ions was measured in PM2.5 samples collected from an urban site in Beijing and a rural site in Gucheng, Hebei Province from November 2016 to January 2017. Aerosol acidity was also investigated to provide an insight into the mechanism of formation of secondary species in PM2.5 during winter haze events. To assess the changes in aerosol pH due to the change in SNA under haze conditions, we investigated the sensitivity of pH to changes in SO42–, NO3–, and NH4+ concentrations, focusing on haze data from both sites. The PM2.5 concentrations, meteorologi-cal conditions, and levels of gaseous pollutants, including SO2, NO2, and CO, were collected synchronously.
2 Materials and methods 2.1 SamplingAerosol samples of PM2.5 were collected continuously over 24-h periods from 26 November 2016 to 12 January 2017 by using a high volume air sampler (Model TH-1000C II with PM2.5 impactor, Wuhan Tianhong Instruments, China) at a flow rate of 1.05 m3 min–1. The samples were collected on Whatman quartz microfiber filters (Whatman, UK). After sampling, the filters were placed in aluminum foil bags and sealed in clean plastic bags, which were then stored in a refrigerator at –18 °C until analysis.
The aerosol samples were collected at two sampling sites. The urban site was located on the roof top of the Chinese Academy of Meteorological Sciences (39°57'N, 116°20'E; about 40-m high) in Haidian District of Beijing between the 2nd and 3rd Ring Roads (CMA site). The rural site was located on a platform at the China Meteorological Administration farm (39°09'N, 115°44'E) in the town of Gucheng, Hebei Province, about 100 km southwest of Beijing (GC site).
2.2 Chemical analysis of ionsThe ions were determined chemically with the method reported by Ye et al. (2015). A square sample (2 cm × 2 cm) of each filter was extracted under sonication with 20 mL of Millipore water (≥ 18 MΩ) for 80 min in an ice–water bath. The extracts were filtered through 0.45-μm filters before analysis. Na+, K+, Mg2+ Ca2+, NH4+, SO42–, NO3–, Cl–, and NO2– were determined by using a Dionex ICS-2100 ion chromatography system (Thermo Fisher Scientific, USA). The ion composition of PM2.5 at the CMA and GC sites was determined from 10 and 13 valid samples, respectively.
2.3 Calculation of PM2.5 acidityA thermodynamic equilibrium model (ISORROPIA II; Fountoukis and Nenes, 2007) was used to predict the acidity of the PM2.5 samples for the K+–Ca2+–Mg2+– NH4+–Na+–SO42––NO3––Cl––H2O aerosol system. The model was applied in the forward mode in a metastable state to give the best prediction of the aerosol pH (Hennigan et al., 2015), which required both the aerosol and gas phase concentrations. Gaseous NH3 was not measured in our campaign and therefore we used the average NH3 concentration obtained by Wang et al. (2016) in Beijing during 2015 as the input for gaseous NH3; this varied with different atmospheric conditions. The sum of the concentrations of the gas phase and inorganic ions were input into the model as total concentrations, toge-ther with the relative humidity and temperature.
2.4 Other dataPM2.5, PM10, CO, NO2, and SO2 concentrations were observed at Wanliu station in urban Beijing by the Beijing Municipal Environmental Monitoring Center, about 3 km from the CMA site, and by the Baoding Environmental Protection Bureau at their Baoding monitoring station, about 30 km from the GC site. Meteorologi-cal data—including relative humidity, wind speed, and visibility—were derived from online data (www.wunderground.com) from weather stations located at 40°04'N, 116°35'E) (ZBAA) and 38°17'N, 114°42'E (ZBSJ). The cloud water content at the two sampling sites was observed by the MODIS (Moderate Resolution Imaging Spectroradiometer) instrument onboard the Terra satellite with a resolution of 0.1° × 0.1° on each day of the sample period (data available at http://neo.sci.gsfc.nasa.gov). The time used in this paper is local time (UTC + 8).
3 Results and discussion 3.1 Ambient concentrations of PM2.5, gas pollutants, and SNAFigures 1 and 2 show the PM2.5 concentrations and the concentrations of gaseous pollutants and SNA in Beijing and Gucheng from December 2016 to January 2017. The properties of particulate matter in Beijing have been shown to have a periodic cycle of 4–7 days (Guo et al., 2014). The hourly PM2.5 concentrations in Beijing showed periodic fluctuations from 3 to 585 μg m–3 with a mean of 141 ± 132 μg m–3; similar variations from 13 to 557 μg m–3 with a mean of 193 ± 109 μg m–3 were measured in Gucheng.
Gucheng is located on the transport axis for pollutants from Shijiazhuang and Baoding to Beijing and, as a result, Beijing has less pollution from severe fine particulate matter than Gucheng. Clean air conditions with a PM2.5 concentration < 50 μg m –3 were observed at the start of each cycle at the CMA site in Beijing. PM2.5 concentrations increased sharply and doubled within a very short time. This rapid increase in particulate matter contributed to the decrease in atmospheric visibility and caused haze pollution (He et al., 2014). The ratio of PM2.5 to PM10 during the sample period was about 70% at both sites and increased with PM2.5 concentrations, especially at the urban site in Beijing, suggesting that fine particles accounted for most of the PM10 during the observation period. The statistics also showed that only 38% and 8% of daily PM2.5 concentrations at the CMA and GC site, respectively, were less than the Chinese National Ambient Air Quality Standard for daily PM2.5 (NAAQS, Grade II) of 75 μg m–3, indicating frequent pollution by fine particles during our observation period.

|
| Figure 1 Hourly concentrations of PM10 and PM2.5, the ratio PM2.5/PM10, the 24-h average SNA concentrations, and the hourly gaseous pollutant concentrations at the CMA site during the sampling period. |

|
| Figure 2 As in Fig. 1, but at the GC site. |
During the massive haze event occurring from 16 to 22 December 2016, hourly PM2.5 concentrations > 500 μg m –3 were recorded at both sites. The maximum daily PM2.5 concentrations at sites CMA and GC were 383 and 394 μg m–3, respectively, 5 times higher than the daily average in the standard Chinese regulation. Gaseous pollutants such as NO2, SO2, and CO were also greatly increased at this time, with a peak concentration of 234 μg m–3 for NO2 in Beijing. Over the entire sample period, the NO2 concentrations generally exceeded those of SO2, in agreement with previous studies (Meng et al., 2009). The gaseous pollutants showed similar variations to PM2.5, in particular the high concentrations of NO2 and CO (Figs. 1, 2).
To facilitate comparison, the samples from the CMA site in Beijing were divided into two groups based on the PM2.5 concentrations—namely, clear days (daily PM2.5 < 75 μg m –3) and polluted days (daily PM2.5 ≥ 75 μg m–3). No clear day was observed for the samples collected from the GC site and therefore a concentration of 150 μg m–3 was used to distinguish light–middle polluted days (LMPD) and heavy–severe polluted days (HSPD). Table 1 shows that precursors such as SO2 and NO2 were significantly higher at the CMA site on polluted days than on clear days (t-test, p < 0.05), favoring the formation of SO 42– and NO3–. The concentrations of SNA on polluted days were about six times the levels on clear days, much higher than the increase in the precursors. The ratio of PM2.5 to PM10 was also much higher on polluted days than on clear days, showing that the fine particles made up a larger proportion of PM10 in haze episodes. The only difference for the GC site was that LMPDs had higher concentrations of SO2 and lower concentrations of SO42– (Table 2) compared with HSPDs, implying that more SO42– accumulated under more polluted conditions. The concentration of SNA is therefore suggested to be the principal driving force for the increase in PM2.5 concentrations (Wang Y. X. et al., 2014; Zheng B. et al., 2015).
| Type of days | SO2 | NO2 | CO | SO42– | NO3– | NH4+ | SNA | PM2.5/PM10 (%) |
| Clear | 11.7 ± 4.8 | 52.0 ± 16.9 | 1016.6 ± 583.5 | 3.0 ± 0.9 | 3.7 ± 2.0 | 5.8 ± 2.7 | 12.5 ± 5.4 | 54.3 ± 9.7 |
| Polluted | 20.3 ± 4.89 | 106.6 ± 27.4 | 4231.5 ± 1865.6 | 16.3 ± 2.1 | 25.7 ± 7.9 | 26.7 ± 5.1 | 68.7 ± 14.2 | 89.1 ± 4.4 |
| Type of days | SO2 | NO2 | CO | SO42– | NO3– | NH4+ | SNA | PM2.5/PM10 (%) |
| LMPD | 85.6 ± 22.8 | 92.6 ± 16.7 | 3317.3 ± 1081.1 | 8.9 ± 4.6 | 11.7 ± 5.7 | 19.1 ± 4.1 | 39.7 ± 14.3 | 72.1 ± 8.2 |
| HSPD | 59.9 ± 48.2 | 111.8 ± 22.1 | 5510.6 ± 2205.3 | 15.7 ± 7.1 | 15.0 ± 5.6 | 25.9 ± 8.9 | 56.5 ± 20.0 | 74.0 ± 6.4 |
Table 3 lists the maximum, average, and minimum concentrations of water-soluble inorganic ions in PM2.5 during the sampling period for the two sites. SNA are the predominant inorganic species of PM2.5. The average concentration of SO42– at the CMA site was 8.3 μg m–3, accounting for 21% of the total mass of inorganic ions. This is lower than the previously reported annual or winter average concentrations in Beijing (Wang et al., 2006; Yang et al., 2011; He et al., 2012). At the GC site, SO42– made up 23% of the total inorganic ions, with an average of 14.0 μg m–3. The average NO3– concentrations at sites CMA and GC were 12.5 and 14.2 μg m–3, making up 31% and 24% of the total mass of inorganic ions, respectively. This was higher than the concentrations observed during 2001–06. The average concentrations of NH4+ were 14.1 and 24.2 μg m–3 at sites CMA and GC, accounting for 35% and 40% of the total mass of inorganic ions, much higher than the previously reported data. The sum of the concentrations of Na+, K+, Mg2+, Ca2+, and Cl– contributed about 13% of the total concentration of inorganic ions at these two sites.
| Species | CMA | GC | ||||
| Clear day | Polluted day | Total | LMPD | HSPD | Total | |
| Na+ | 0.4 ± 0.2 | 0.8 ± 0.3 | 0.5 ± 0.3 | 0.6 ± 0.2 | 0.7 ± 0.3 | 0.7 ± 0.3 |
| NH4+ | 5.8 ± 2.7 | 26.7 ± 5.1 | 14.1 ± 11.4 | 19.1 ± 4.1 | 25.9 ± 8.9 | 24.2 ± 8.4 |
| K+ | 0.3 ± 0.2 | 1.3 ± 0.4 | 0.7 ± 0.6 | 2.1 ± 0.2 | 1.6 ± 0.6 | 1.8 ± 0.5 |
| Mg2+ | 0.1 ± 0.1 | 0.1 ± 0.03 | 0.1 ± 0.04 | 0.1 ± 0.1 | 0.1 ± 0.1 | 0.1 ± 0.1 |
| Ca2+ | 1.9 ± 0.8 | 1.0 ± 0.5 | 1.6 ± 0.8 | 0.8 ± 0.8 | 0.7 ± 1.0 | 0.7 ± 0.9 |
| Cl– | 1.3 ± 1.0 | 3.8 ± 0.7 | 2.3 ± 1.5 | 3.6 ± 2.6 | 4.6 ± 2.3 | 4.3 ± 2.3 |
| NO2– | 0.04 ± 0.03 | 0.1 ± 0.02 | 0.04 ± 0.02 | 0.03 ± 0.02 | 0.2 ± 0.2 | 0.1 ± 0.2 |
| SO42– | 3.0 ± 0.9 | 16.3 ± 2.1 | 8.3 ± 7.0 | 8.9 ± 4.6 | 15.7 ± 7.1 | 14.0 ± 7.0 |
| NO3– | 3.7 ± 2.0 | 25.7 ± 7.9 | 12.5 ± 12.3 | 11.7 ± 5.7 | 15.0 ± 5.6 | 14.2 ± 5.6 |
SO42– has previously been reported to be the dominant component of SNA in PM2.5 over Beijing from 2000 to 2006, followed by NO3– and NH4+ (Wang et al., 2006; Yang et al., 2011; He et al., 2012). Our results at both sites showed that NH4+ accounted for the highest proportion of inorganic ions, which was comparable with the proportion contributed by NO3– followed by SO42–. This result may be explained by the variation in SO2 and NOx emissions over the last decade (Sun et al., 2016). SO2 emissions have decreased as a result of desulfurization, whereas NOx emissions have increased as a result of industrialization and an increase in the number of vehicles. At the CMA site, SO42– was linearly correlated with SO2 with a correlation coefficient (r) of 0.77 (p < 0.01). When the concentrations of SO 42– decreased with the decrease in SO2 emissions, free NH3 was released and more NH4+ accumulated in the form of NH4NO3, in addition to the increase resulting from an increase in NOx emissions (Wang et al., 2013).
Recent research has shown that emissions from the burning of fossil fuels (including traffic emissions) and NH3 from fossil fuel power plants contribute most of the air pollution in urban Beijing in the winter months (Pan et al., 2016), which could result in the NH4+-rich aerosols at the CMA site. The high concentrations of NH4+ at the rural GC site may be associated with both agricultu-ral sources and emissions from the burning of fossil fuels in the surrounding highly industrialized areas. The high levels of NH4+ at both sites therefore suggests high emissions of NH3 over the North China Plain, in turn favoring the formation of more NO3–. The findings reported here emphasize the significance of controlling NH3 emissions in the future, given the contribution of NH4+ to aerosol growth in haze events.
Figure 3 shows the variation in PM2.5 with meteorological conditions. At the CMA site, PM2.5 and the ratios of PM2.5 to PM10 increased with increasing relative humidity, whereas the PM2.5 concentrations showed a decreasing trend with wind speed. A high relative humidity may enhance the liquid water content of aerosols and thus enhance the heterogeneous uptake of gas precursors on their surface (Wang X. F. et al., 2012), which favors the increase in PM2.5 concentrations. The stable synoptic conditions (relatively low wind speed) during the polluted period were unfavorable toward the horizontal transport and vertical mixing of pollutants, which played an essential part in the accumulation of pollutants and the formation of haze (Wang Z. F. et al., 2014; Zheng B. et al., 2015; Zheng G. J. et al., 2015).
At the GC site, the patterns of variation in PM2.5 concentrations were different from those in the urban Beijing. The PM2.5 concentrations showed no obvious trend below 75% relative humidity and reached their peak at the highest levels of humidity. A minor increase in the concentration of PM2.5 with increasing wind speed was observed, indicating that atmospheric transport from the surrounding polluted areas had a key role, which corresponded to the location of this site in the NE–SW pollution transport channel. The daily average wind speed reached a maximum of 3.3 m s–1 on 26 November 2016 at site GC, corresponding to turbid air conditions with a 24-h PM2.5 concentration of 222.2 μg m–3. The concentration of Ca2+ reached a maximum of 3.0 μg m–3 on this day, together with high concentrations of SO42–, NO3–, and NH4+ of 27.5, 20.9, and 26.0 μg m–3, respectively. The turbid air conditions at the GC site during the sampling period resulted in less variation in the PM2.5 concentrations than at the urban site in Beijing.

|
| Figure 3 Synoptic conditions of (a, b) relative humidity (RH) and (c, d) wind speed (WS) versus PM2.5 concentrations during the sample period at (a, c) the CMA site and (b, d) the GC site. The error bars represent one standard deviation. |
The mass ratio of NO3–/SO42– in aerosols can be used to evaluate the relative importance of mobile versus stationary sources (Arimoto et al., 1996; Gao et al., 2009). Our results showed that the NO3–/SO42– ratio changed with the PM2.5 concentrations (Fig. 4). The NO3–/SO42– ratio was > 1 in urban Beijing, with an average of 1.6 on the polluted days, suggesting that mobile sources were important sources of emission during haze events in Beijing. On the clear days, the NO 3–/SO42– ratio showed a good positive correlation with PM2.5 (r = 0.85, p < 0.05) and the minimum ratio was 0.7 when the PM 2.5 concentration was 14 μg m–3. Sun et al. (2013) found similar results in Beijing, with NO3–/SO42– ratios as low as 0.52 on a non-haze day with a PM1.8 of 35 μg m–3 (Sun et al., 2013). High wind speeds not only favor the transport of SO2 and SO42– into Beijing, but can also dilute local NOx emissions from vehicles, contributing to the relatively low NO3–/SO42– ratio on windy days (Sun et al., 2013). The NO3–/SO42– ratios (0.7–2.0) were higher than the mean values of 0.58 and 0.67 measured in Beijing during 1999–2000 and 2001–03, respectively, which may demonstrate the response of the particle composition to changes in the precursor emissions (Yao et al., 2002; Wang et al., 2005). For the GC site, the NO3–/SO42– ratio was relatively low, with an average of 1.0 under haze conditions, indicating that the GC site was mainly influenced by stationary emission sources.

|
| Figure 4 NO3–/SO42– ratio, PM2.5 concentration, and wind speed (WS) during the sample period at (a) the CMA site and (b) the GC site. |
The concentrations of SO42–, NO3–, and NH4+ in PM2.5 during haze periods were about 4–6 times those on the non-haze days at the CMA site; similar results were obtained for the GC site (Table 3). The high ratio of SNA on polluted days to that on clear days suggested that more secondary inorganic aerosols were formed under haze conditions, as observed previously in similar campaigns (Shen et al., 2009; Zhang Q. et al., 2015). Figures 5a and b show that there was a good correlation between the NH4+ concentration and the sum of SO42– and NO3– concentrations (r= 0.99 for the CMA site, r= 0.84 for the GC site, p< 0.01), indicating that NH3 had an important role in neutralizing the SO42– and NO3– formed. Figure 5c shows that high SNA concentrations generally occurred under conditions of low visibility and that they decreased sharply when the visibility was < 10 km.
The concentration of OH radicals is strongly dependent on the amount of ultraviolet radiation (Ehhalt and Rohrer, 2000; Lu et al., 2013) and previous results for Beijing have shown that the concentration of OH radicals is low on haze days as a result of the aerosol dimming effect (Zheng B. et al., 2015; Zheng G. J. et al., 2015). Therefore, the increase in SO42– and NO3– concentrations during haze events was unlikely to be driven via gas phase oxidation by OH radicals and the formation of SO42– and NO3– was more likely to be via the aqueous phase pathway.
Aqueous phase reactions may enhance the formation of SO42– and NO3– via heterogeneous reactions in clouds or rain droplets, although there was no precipitation during the sampling period. In addition, the satellite data for the cloud water content (Fig. 6) did not show a significant difference under different atmospheric conditions, suggesting that this could not account for the increase in SO42–, NO3–, the sulfur oxidation ratio [SOR = nSO42–/ (nSO42– + nSO2), where n is the molar concentration] and the nitrogen oxidation ratio [NOR = nNO3–/(nNO3– + nNO2)] from clear days to polluted days. The SOR and the NOR could be used as indicators of secondary transformation (Sun et al., 2006). Figures 7a and b show that the SOR and NOR increased from clear days to polluted days and from LMPD to HSPD. In urban Beijing, the NOR showed a good linear correlation with the relative humidity (r= 0.79, p< 0.01) and the SOR showed a moderate linear correlation with relative humidity (r= 0.67, p< 0.05) (Fig. 7c), consistent with the dependence of heterogeneous reactions on relative humidity. Heterogeneous reactions have been suggested to play an essential part in producing high SO42– and NO3– concentrations during haze pollution events (Wang Y. X. et al., 2014).

|
| Figure 5 Formation of SNA. (a) Concentration of water-soluble NH4– versus the sum of SO42– and NO3– at the CMA site (r= 0.99, p< 0.01). (b) Concentration of water-soluble NH4– versus the sum of SO42– and NO3– at the GC site (r= 0.84, p< 0.01). (c, d) Variation of SO42– and NO3– with visibility (vis) at the CMA and GC site, respectively. |

|
| Figure 6 Cloud water content (CW) on clear and polluted days at CMA site, and on light–middle polluted days and heavy–severe polluted days at GC site. Data are plotted as boxes with the square spot showing mean value and the error bar showing one standard deviation. |

|
| Figure 7 Formation of SNA. (a) SOR and NOR on clear and polluted days at the CMA site. (b) SOR and NOR on light–middle polluted days and heavy–severe polluted days at the GC site. The 25%, 50%, and 75% data are drawn in the box, the square spot is the mean and the error bar represents one standard deviation. (c) Variations of SOR and NOR with relative humidity at the CMA site (NOR: r = 0.79, p < 0.01; SOR: r = 0.67, p < 0.05). (d) Variations of SOR and NOR with relative humidity at the GC site. |
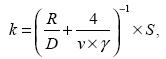
The heterogeneous reaction is usually parameterized in models as follows (Jacob, 2000; Wang K. et al., 2012):
|
(1) |
where k is the rate constant (s–1), R is the radius of the aerosol particles (m), D is the gas phase molecular diffusion coefficient (m2 s–1), vis the mean molecular speed (m s–1), γis the uptake coefficient, and S is the aerosol surface area per unit volume (m2 m–3).
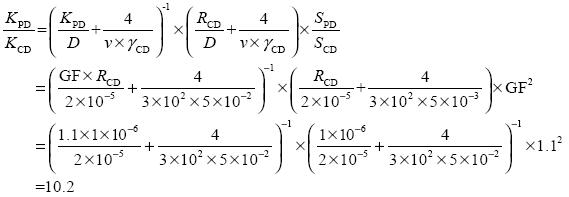
The uptake coefficient γ is assumed to depend on relative humidity in modeling studies (Song and Carmichael, 2001; Wang Y. X. et al., 2014; Zheng B. et al., 2015). For example, the value of γ for SO2 was set between 10–3 and 10–2 by Wang Y. et al. (2014), a γ value of 5 × 10⁻³ was used for SO2 when the relative humidity was < 50%, and 5 × 10 –2 was used when relative humidity was > 50% ( Song and Carmichael, 2001). Taking SO2 as an example, the difference in k between polluted and clear days can be expressed as follows:
|
(2) |
The hygroscopic growth factor (GF) of 1.1 was taken from earlier studies in Beijing (Meier et al., 2009). A γ value of 5 × 10⁻³ for SO2 was used on clear days and a γ value of 5 × 10⁻² was used on polluted days (Song and Carmichael, 2001). Values of D of 2 × 10⁻⁵ m2 s–1 and v of 3 × 10² m s–1 were used (Jacob, 2000) and an RCD value of 1 × 10⁻⁶ m. Equation (2) shows that the heterogeneous reaction of gaseous pollutants may be significantly increased on polluted days.
3.4 Aerosol acidity and sensitivity analysisAerosol acidity is the measurement of the aqueous concentration of H+ and is correlated with the ion distribution and levels of liquid water in particles. Combined with measurements of the in-situ ion composition, the thermodynamic equilibrium model ISORROPIA II (Fountoukis and Nenes, 2007) was used to predict the pH of aerosols. For the CMA site, we obtained mean (range) pH of 5.0 (4.9–5.2) under haze conditions and 6.9 (6.0–7.7) on clear days. The clean aerosol samples seemed to be more alkaline than those formed under haze conditions. All the PM2.5 samples at the GC site were acidic, with an average pH of 5.3 (range 4.6–6.3), in agreement with haze conditions for all observed days. The pH for these two sites under haze conditions agreed with previously reported results of 5.4–6.2 on the North China Plain in winter (Cheng et al., 2016) and exceeded the particle pH of 0–3 in North America (Guo et al., 2015; Xu et al., 2015; Weber et al., 2016), indicating the neutralization of aerosol particles under haze conditions. China has high emissions of NH3 as a result of agricultural activities, especially in Henan, Shandong, and Hebei provinces (Streets et al., 2003; Huang et al., 2012). The high neutralizing capacity of aerosols might be attributed to the high NH3 emissions on the North China Plain, corresponding to high NH4+ concentrations.
We have shown earlier that heterogeneous reactions have an essential role in producing high concentrations of SO42– and NO3– under haze conditions. The acidity of the particles affects the chemical processes in the aerosol water where the heterogeneous reactions occur. Based on the predicted pH, we tried to predict the major pathways for the aqueous phase oxidation of SO2 and NO2. According to recent research, in the range of pH obtained here, dissolved NO2 should be the most effective oxidant in the aerosol water and could generate SO42– and NO2– under haze conditions in Beijing (Cheng et al., 2016). In addition, when the NO3– is correlated with relative humidity and aerosol loadings, the heterogeneous hydrolysis of N2O5 on the acidic surface of aerosols has been shown to be a major route to forming NO3– in Beijing haze (Pathak et al., 2009). Nevertheless, the predicted pH is just one factor affecting the chemical processes in aerosol water and the proposed reaction pathways are speculative and without supporting evidence.
Based on the SNA fractions discussed here, the contribution of SO42– has decreased in the past decade, whereas the concentrations of NO3– and NH4+ have increased. We attempted to assess the sensitivity of the pH of aerosols under haze conditions at both sites to the changes in the concentration of SO42–, NO3–, and NH4+, i.e., the acidic samples. SO42–, NO3–, and NH4+ concentrations were independently changed from 10% to 200% of the initial measured value and were used as inputs to ISORROPIA II. The predicted aerosol pH values are shown in Fig. 8, where the 100% data represent the predicted pH based on the in-situ measurement of the particle bulk composition. The decrease below the measured SO42– levels corresponds to a higher pH value with an amplitude of less than one unit of pH. Similarly, slight decreases in pH were obtained when the SO42– concentration increased up to twice the initial value. In contrast with the changes in SO42–, a higher NH4+ concentration was correlated with higher pH values, indicating greater neutralization of the aerosols, whereas lower pH values were obtained with a reduction in NH4+ concentrations. A similar trend was found for NO3– at the GC site which was less sensitive than NH4+, whereas minor fluctuations were seen at the CMA site. The pH appeared to be more sensitive to SO42– and NH4+ than to NO3–. Specifically, a 50% decrease in NH4+ concentration resulted in a 0.28 unit reduction in pH, whereas a 50% increase in NH4+ concentration resulted in a 0.17 unit increase in pH at the CMA site. For the GC samples, a 0.33 unit increase and a 0.25 unit reduction in pH was seen for a 50% increase and a 50% decrease in SO42– concentration, respectively. These results show the relatively weak sensitivity of pH to a wide range of SO42–, NO3–, and NH4+ concentrations. This is attributed to the buffering effect of NH3 partitioning as result of the semi-volatility of NH4+ and is consistent with similar studies of NH3 and SO42– (Weber et al., 2016; Zhao et al., 2016). The predicted pH varied over a narrow range under haze conditions at both sites.

|
| Figure 8 Sensitivity of PM2.5 pH to changes in the concentration of SO42–, NO3–, and NH4+ at (a) the CMA site and (b) the GC site under typical haze conditions. The 100% data represent the predicted pH based on in-situ measurements of the bulk composition of particles. |
SO42–, NO3–, and NH4+ were the dominant ions in PM2.5 at both an urban Beijing site and a rural site in Gucheng. The average SO42–, NO3–, and NH4+ concentrations during the sampling period were 8.3, 12.5, and 14.1 μg m–3 at the CMA site and 14.0, 14.2, and 24.2 μg m–3 at the GC site. The NO3– concentrations exceeded those of SO42– at both sites, in contrast with the results of previous studies, indicating the variation in SO2 and NOx emissions. The finding that NH4+ was the dominant component of SNA emphasized the importance of controlling future NH3 emissions. The NOR and SOR were linearly correlated with relative humidity (r= 0.79 and r= 0.67) in urban Beijing and were related to the aerosol loadings, suggesting that heterogeneous reactions in the aerosol water played an essential part in the significant increase in SO42– and NO3– in haze pollution. A parameterized model was applied to calculate the rate constant (k) of the heterogeneous reaction. For gaseous SO2, the value of k on polluted days was about 10 times higher than that on clear days.
The aerosol acidity was predicted by using the ISORROPIA II model in the forward mode with a metastable state. Under haze conditions, the pH ranged from 4.9 to 5.2 with a mean of 5.0 at the CMA site and from 4.6 to 6.3 with a mean of 5.3 at the GC site. The aerosol particles in haze were acidic and retained a high neutralizing capacity associated with the high NH3 emissions on the North China Plain. Based on the pH environment, we predicted that oxidation by dissolved NO2 and the hydrolysis of N2O5 on the acidic aerosol surface should be the major pathways for the heterogeneous formation of SO42– and NO3–. Under haze conditions, the sensitivity analysis of aerosol pH suggested a relatively weak sensitivity of pH to a wide range of SO42–, NO3–, and NH4+ concentrations associated with the buffering effect of NH3 partitioning. The pH was more sensitive to SO42– and NH4+ concentrations with opposing trends, than to NO3– concentrations. Future work exploring the mechanisms of the heterogeneous reactions in aerosol water of particles is required to elucidate the reasons for the rapid increase in SNA under haze conditions.
Acknowledgments. We thank Haochi Che of the Chinese Academy of Meteorological Sciences and Sanxue Ren of the China Meteorological Administration farm at Gucheng for carrying out the sampling at the Beijing and Gucheng site, respectively.
| Alexer, B., R. J. Park, D. J. Jacob, et al., 2009: Transition me-tal-catalyzed oxidation of atmospheric sulfur: Global implications for the sulfur budget. J. Geophys. Res., 114, D02309. DOI:10.1029/2008JD010486 |
| Arimoto, R., R. A. Duce, D. L. Savoie, et al., 1996: Relationships among aerosol constituents from Asia and the North Pacific during PEM-West A. J. Geophys. Res., 101, 2011–2023. DOI:10.1029/95JD01071 |
| Brook, R. D., S. Rajagopalan, C. A. Pope, et al., 2010: Particulate matter air pollution and cardiovascular disease: An update to the scientific statement from the American Heart Association. Circulation, 121, 2331–2378. DOI:10.1161/CIR.0b013e3181dbece1 |
| Chameides, W. L., 1984: The photochemistry of a remote marine stratiform cloud. J. Geophys. Res., 89, 4739–4755. DOI:10.1029/JD089iD03p04739 |
| Cheng, Y. F., G. J. Zheng, C. Wei, et al., 2016: Reactive nitrogen chemistry in aerosol water as a source of sulfate during haze events in China. Sci. Adv., 2, e1601530. DOI:10.1126/sciadv.1601530 |
| Cheng, Z., J. K. Jiang, O. Fajardo, et al., 2013: Characteristics and health impacts of particulate matter pollution in China (2001–2011). Atmos. Environ., 65, 186–194. DOI:10.1016/j.atmosenv.2012.10.022 |
| Ehhalt, D. H., and F. Rohrer, 2000: Dependence of the OH concentration on solar UV. J. Geophys. Res., 105, 3565–3571. DOI:10.1029/1999JD901070 |
| Fountoukis, C., and A. Nenes, 2007: ISORROPIA II: A computationally efficient thermodynamic equilibrium model for K+–Ca2+–Mg2+–NH4+–Na+–SO42––NO3––Cl––H2O aerosols . At-mos. Chem. Phys., 7, 4639–4659. DOI:10.5194/acp-7-4639-2007 |
| Gao, J., T. Wang, X. H. Zhou, et al., 2009: Measurement of aerosol number size distributions in the Yangtze River delta in China: Formation and growth of particles under polluted conditions. Atmos. Environ., 43, 829–836. DOI:10.1016/j.atmosenv.2008.10.046 |
| Guo, H., L. Xu, A. Bougiatioti, et al., 2015: Fine-particle water and pH in the southeastern United States. Atmos. Chem. Phys., 15, 5211–5228. DOI:10.5194/acp-15-5211-2015 |
| Guo, S., M. Hu, M. L. Zamora, et al., 2014: Elucidating severe urban haze formation in China. Proc. Natl. Acad. Sci. USA, 111, 17373–17378. DOI:10.1073/pnas.1419604111 |
| He, H., Y. S. Wang, Q. X. Ma, et al., 2014: Mineral dust and NOx promote the conversion of SO2 to sulfate in heavy pollution days . Sci. Rep., 4, 4172. DOI:10.1038/srep04172 |
| He, K., Q. Zhao, Y. Ma, et al., 2012: Spatial and seasonal variability of PM2.5 acidity at two Chinese megacities: Insights into the formation of secondary inorganic aerosols . Atmos. Chem. Phys., 12, 1377–1395. DOI:10.5194/acpd-11-25557-2011 |
| Hennigan, C. J., J. Izumi, A. P. Sullivan, et al., 2015: A critical evaluation of proxy methods used to estimate the acidity of atmospheric particles. Atmos. Chem. Phys., 15, 2775–2790. DOI:10.5194/acp-15-2775-2015 |
| Huang, X., Y. Song, M. M. Li, et al., 2012: A high-resolution ammonia emission inventory in China. Global Biogeochem. Cycles, 26, GB1030. DOI:10.1029/2011GB004161 |
| Jacob, D. J., 2000: Heterogeneous chemistry and tropospheric ozone. Atmos. Environ., 34, 2131–2159. DOI:10.1016/S1352-2310(99)00462-8 |
| Jiang, J. K., W. Zhou, Z. Cheng, et al., 2015: Particulate matter distributions in China during a winter period with frequent pollution episodes (January 2013). Aerosol Air Qual. Res., 15, 494–503. DOI:10.4209/aaqr.2014.04.0070 |
| Keene, W. C., A. A. P. Pszenny, J. R. Maben, et al., 2004: Closure evaluation of size-resolved aerosol pH in the New England coastal atmosphere during summer. J. Geophys. Res., 109, D23307. DOI:10.1029/2004JD004801 |
| Liu, X. G., J. Li, Y. Qu, et al., 2013: Formation and evolution mechanism of regional haze: A case study in the megacity Beijing, China. Atmos. Chem. Phys., 13, 4501–4514. DOI:10.5194/acp-13-4501-2013 |
| Lu, K. D., A. Hofzumahaus, F. Holl, et al., 2013: Missing OH source in a suburban environment near Beijing: Observed and modeled OH and HO2 concentrations in summer 2006 . Atmos. Chem. Phys., 13, 1057–1080. DOI:10.5194/acp-13-1057-2013 |
| Meier, J., B. Wehner, A. Massling, et al., 2009: Hygroscopic growth of urban aerosol particles in Beijing (China) during wintertime: A comparison of three experimental methods. Atmos. Chem. Phys., 9, 6865–6880. DOI:10.5194/acp-9-6865-2009 |
| Meng, Z. Y., X. B. Xu, P. Yan, et al., 2009: Characteristics of trace gaseous pollutants at a regional background station in northern China. Atmos. Chem. Phys., 9, 927–936. DOI:10.5194/acp-9-927-2009 |
| Nemitz, E., M. A. Sutton, G. P. Wyers, et al., 2004: Gas-particle interactions above a Dutch heathland: I. Surface exchange fluxes of NH3, SO2, HNO3 and HCl . Atmos. Chem. Phys., 4, 989–1005. DOI:10.5194/acp-4-989-2004 |
| Pan, Y. P., S. L. Tian, D. W. Liu, et al., 2016: Fossil fuel combustion-related emissions dominate atmospheric ammonia sources during severe haze episodes: Evidence from 15N-stable isotope in size-resolved aerosol ammonium . Environ. Sci. Technol., 50, 8049–8056. DOI:10.1021/acs.est.6b00634 |
| Pathak, R. K., W. S. Wu, and T. Wang, 2009: Summertime PM2.5 ionic species in four major cities of China: Nitrate formation in an ammonia-deficient atmosphere . Atmos. Chem. Phys., 9, 1711–1722. DOI:10.5194/acp-9-1711-2009 |
| Quan, J. N., X. X. Tie, Q. Zhang, et al., 2014: Characteristics of heavy aerosol pollution during the 2012–2013 winter in Beijing, China. Atmos. Environ., 88, 83–89. DOI:10.1016/j.atmosenv.2014.01.058 |
| Seinfeld, J. H., G. R. Carmichael, R. Arimoto, et al., 2004: ACE-ASIA: Regional climatic and atmospheric chemical effects of Asian dust and pollution. Bull. Amer. Meteor. Soc., 85, 367–380. DOI:10.1175/BAMS-85-3-367 |
| Shen, Z. X., J. J. Cao, R. Arimoto, et al., 2009: Ionic composition of TSP and PM2.5 during dust storms and air pollution episodes at Xi’an, China . Atmos. Environ., 43, 2911–2918. DOI:10.1016/j.atmosenv.2009.03.005 |
| Song, C. H., and G. R. Carmichael, 2001: A three-dimensional modeling investigation of the evolution processes of dust and sea-salt particles in East Asia. J. Geophys. Res., 106, 18131–18154. DOI:10.1029/2000JD900352 |
| Streets, D. G., T. C. Bond, G. R. Carmichael, et al., 2003: An inventory of gaseous and primary aerosol emissions in Asia in the year 2000. J. Geophys. Res., 108, 8809. DOI:10.1029/2002jd003093 |
| Sun, Y. L., G. S. Zhuang, A. H. Tang, et al., 2006: Chemical characteristics of PM2.5 and PM10 in haze–fog episodes in Beijing . Environ. Sci. Technol., 40, 3148–3155. DOI:10.1021/es051533g |
| Sun, Y. L., Z. F. Wang, O. Wild, et al., 2016: " APEC Blue”: Secondary aerosol reductions from emission controls in Beijing. Sci. Rep., 6, 20668. DOI:10.1038/srep20668 |
| Sun, Z. Q., Y. J. Mu, Y. J. Liu, et al., 2013: A comparison study on airborne particles during haze days and non-haze days in Beijing. Sci. Total Environ., 456–457, 1–8. DOI:10.1016/j.scitotenv.2013.03.006 |
| Van, Oss, Duyzer R., and Wyers J., 1998: The influence of gas-to-particle conversion on measurements of ammonia exchange over forest. Atmos. Environ., 32, 465–471. DOI:10.1016/S1352-2310(97)00280-X |
| Wang, Y., G. S. Zhuang, A.H. Tang, et al., 2005: The ion chemistry and the source of PM2.5 aerosol in Beijing . Atmos. Environ., 39, 3771–3784. DOI:10.1016/j.atmosenv.2005.03.013 |
| Wang, Y., G. S. Zhuang, Y. L. Sun, et al., 2006: The variation of characteristics and formation mechanisms of aerosols in dust, haze, and clear days in Beijing. Atmos. Environ., 40, 6579–6591. DOI:10.1016/j.atmosenv.2006.05.066 |
| Wang, K., Y. Zhang, A. Nenes, et al., 2012: Implementation of dust emission and chemistry into the Community Multiscale Air Quality modeling system and initial application to an Asian dust storm episode. Atmos. Chem. Phys., 12, 10209–10237. DOI:10.5194/acp-12-10209-2012 |
| Wang, X. F., W. X. Wang, L. X. Yang, et al., 2012: The secondary formation of inorganic aerosols in the droplet mode through heterogeneous aqueous reactions under haze conditions. Atmos. Environ., 63, 68–76. DOI:10.1016/j.atmosenv.2012.09.029 |
| Wang, Y., Q. Q. Zhang, K. He, et al., 2013: Sulfate-nitrate-ammonium aerosols over China: Response to 2000–2015 emission changes of sulfur dioxide, nitrogen oxides, and ammonia. Atmos. Chem. Phys., 13, 2635–2652. DOI:10.5194/acp-13-2635-2013 |
| Wang, Y. X., Q. Q. Zhang, J. K. Jiang, et al., 2014: Enhanced sulfate formation during China’s severe winter haze episode in January 2013 missing from current models. J. Geophys. Res., 119, 10425–10440. DOI:10.1002/2013JD021426 |
| Wang, Z. F., J. Li, Z. Wang, et al., 2014: Modeling study of regional severe hazes over mid–eastern China in January 2013 and its implications on pollution prevention and control. Sci. China Earth Sci., 57, 3–13. DOI:10.1007/s11430-013-4793-0 |
| Wang, G. H., R. Y. Zhang, M. E. Gomez, et al., 2016: Persistent sulfate formation from London Fog to Chinese haze. Proc. Natl. Acad. Sci. USA,, 113, 113630–113635. DOI:10.1073/pnas.1616540113 |
| Weber, R. J., H. Y. Guo, A. G. Russell, et al., 2016: High aerosol acidity despite declining atmospheric sulfate concentrations over the past 15 years. Nat. Geosci., 9, 282–285. DOI:10.1038/ngeo2665 |
| WHO, 2006: Air Quality Guidelines. Global Update 2005. Particulate Matter, Ozone, Nitrogen Dioxide, and Sulfur Dioxide. Geneva, World Health Organization. |
| Xu, L., H. Y. Guo, C. M. Boyd, et al., 2015: Effects of anthropogenic emissions on aerosol formation from isoprene and monoterpenes in the southeastern United States. Proc. Natl. Acad. Sci. USA, 112, 37–42. DOI:10.1073/pnas.1417609112 |
| Yang, F., J. Tan, Q. Zhao, et al., 2011: Characteristics of PM2.5 speciation in representative megacities and across China . Atmos. Chem. Phys., 11, 5207–5219. DOI:10.5194/acp-11-5207-2011 |
| Yang, Y. R., X. G. Liu, Y. Qu, et al., 2015: Characteristics and formation mechanism of continuous hazes in China: A case study during the autumn of 2014 in the North China Plain. Atmos. Chem. Phys., 15, 8165–8178. DOI:10.5194/acp-15-8165-2015 |
| Yao, X. H., C. K. Chan, M. Fang, et al., 2002: The water-soluble ionic composition of PM2.5 in Shanghai and Beijing, China . Atmos. Environ., 36, 4223–4234. DOI:10.1016/S1352-2310(02)00342-4 |
| Ye, P. P., Z. Q. Xie, J. Yu, et al., 2015: Spatial distribution of methanesulphonic acid in the Arctic aerosol collected during the Chinese Arctic Research Expedition. Atmosphere, 6, 699–712. DOI:10.3390/atmos6050699 |
| Zhang, J. K., Y. Sun, Z. R. Liu, et al., 2014: Characterization of submicron aerosols during a month of serious pollution in Beijing. 2013. Atmos. Chem. Phys., 14, 2887–2903. DOI:10.5194/acp-14-2887-2014 |
| Zhang, Q., Z. X. Shen, J. J. Cao, et al., 2015: Variations in PM2.5, TSP, BC, and trace gases (NO2, SO2, and O3) between haze and non-haze episodes in winter over Xi’an, China . Atmos. Environ., 112, 64–71. DOI:10.1016/j.atmosenv.2015.04.033 |
| Zhang, R. Y., G. H. Wang, S. Guo, et al., 2015: Formation of ur-ban fine particulate matter. Chem. Rev., 115, 3803–3855. DOI:10.1021/acs.chemrev.5b00067 |
| Zhao, M.-J., S.-X. Wang, J.-H. Tan, et al., 2016: Variation of ur-ban atmospheric ammonia pollution and its relation with PM2.5 chemical property in winter of Beijing, China . Aerosol Air Qual. Res., 16, 1378–1389. DOI:10.4209/aaqr.2015.12.0699 |
| Zheng, B., Q. Zhang, Y. Zhang, et al., 2015: Heterogeneous chemistry: A mechanism missing in current models to explain secondary inorganic aerosol formation during the January 2013 haze episode in North China. Atmos. Chem. Phys., 15, 2031–2049. DOI:10.5194/acp-15-2031-2015 |
| Zheng, G. J., F. K. Duan, H. Su, et al., 2015: Exploring the severe winter haze in Beijing: The impact of synoptic weather, regional transport and heterogeneous reactions. Atmos. Chem. Phys., 15, 2969–2983. DOI:10.5194/acp-15-2969-2015 |