The Chinese Meteorological Society
Article Information
- SHU, Yu, Jisong SUN, and Yinong PAN, 2017.
- Characteristics of Mesoscale Vortices over China in 2015. 2017.
- J. Meteor. Res., 31(6): 1149-1160
- http://dx.doi.org/10.1007/s13351-017-7639-4
Article History
- Received March 15, 2017
- in final form August 24, 2017
2. State Key Laboratory of Severe Weather, Chinese Academy of Meteorological Sciences, Beijing 100081;
3. Institute of Earth Sciences, University of Chinese Academy of Sciences, Beijing 100049;
4. School of Atmospheric Sciences, Nanjing University, Nanjing 210093;
5. Key Laboratory for Mesoscale Severe Weather of Ministry of Education, Nanjing University, Nanjing 210093
A cyclonic circulation with a size of tens or hundreds of kilometers, referred to as a mesoscale vortex, can often be found at low levels of rainstorms. Mesoscale vortices have a direct impact on rainstorms and play an important part in their formation (Ge et al., 2011; Dong et al., 2013). The simulation of Cheng and Feng (2001) showed that excessive storms are closely related to the meso-β-scale vortices at 700 hPa. Lu et al. (2002) suggested that the intensive development of mesoscale vortices is due to upward motion and the accompanying mesoscale transport of physical quantities. Sun et al. (2004) analyzed the evolution of mesoscale vortices in the 973 excessive rainstorms. The non-uniform vertical distribution of condensational heating and the impact of vertical vorticity are responsible for the development of mesoscale systems in rainstorms (Chen et al., 2007). Mesoscale vortices also have a close relationship with tropical cyclones. The interaction between mesoscale vortices and tropical cyclones often enhances the intensity of the latter (Chen and Luo, 2004). In addition, the bias of the track of tropical cyclones caused by mesoscale vortices is not negligible (Luo et al., 2011).
The mesoscale vortices that are related to rainstorms or tropical cyclones are all wet vortices. One category of wet vortices, which forms within mesoscale convective systems (MCSs), is referred to as mesoscale convective vortices (MCVs). Many studies on MCSs have been carried out in China in recent years, summarizing the temporal and spatial distribution of MCSs (Ma et al., 1997; Tao et al., 1998). MCVs can initiate the generation of new MCSs in the vicinity and the new MCSs breed new MCVs. The convective activities last for a long time, with the consequent occurrence of a rainstorm. Much recent research has been carried out on MCVs, including their basic characteristics, mechanism of formation, and their initiating effect on secondary convection.
MCVs form at the middle levels within the stratiform rain region of MCSs (Bartels and Maddox, 1991) and tend to appear between the mature and dissipation stages of the parent MCS. The diameter of an MCV is usually about 100–300 km (Davis and Galarneau Jr, 2009). The main part of an MCV is usually located in the middle and lower levels, with its vertical extension approaching several kilometers (Fritsch et al., 1994; Davis and Trier, 2007; Davis and Galarneau Jr, 2009). MCVs sometimes extend to the surface—for instance, the MCV overlaps with the line-end vortex near the surface (Rogers and Fritsch, 2001; Davis et al., 2002; Davis and Galarneau Jr, 2009).
Bartels and Maddox (1991) pointed out that latent heat feedback is crucial in the formation of MCVs. Xie (1978, 1984) indicated, in an argument about the “moist baroclinic” in the early 1980s, that the phase transition of water vapor can cause mesoscale perturbations, which is an important initiator in the development of mesoscale weather systems. Raymond and Jiang (1990) presented a theoretical framework for the generation of MCVs. The diabatic heating anomaly in the vertical direction caused by MCS activity is the primary reason for the formation of a mid-level mesoscale cyclonic circulation. The results from the ideal numerical simulation given by Chen and Frank (1993), in which a conceptual model for the generation of MCVs was presented, are similar to the conclusions of Raymond and Jiang (1990). Fritsch et al. (1994) verified and completed the conceptual model with observational data and discovered that MCVs formed and developed in the stratiform region of MCSs. The size and duration of MCVs may exceed that of the parent MCS.
Many studies have been carried out on the triggering action of MCVs on secondary convection. Raymond and Jiang (1990) showed theoretically why MCVs can trigger new convection. They considered MCVs to be an important self-sustaining mechanism of MCSs and summarized two conceptual models, which were improved by Fritsch et al. (1994). Using observational data, Davis et al. (2002) certified the relationship between the position of MCVs and the upward motion necessary for secondary convection. They indicated that the immediate cause of upward motion was the up gliding of the airflow along an isentropic surface in the down-shear direction. Trier and Davis (2007) studied five examples of MCVs and their results showed that two MCVs in strong vertical shear did not trigger deep convections and two MCVs in moderate to strong vertical shear triggered local deep convections, whereas the MCV in the weak vertical shear had widespread secondary convections. The right-hand side of the down-shear direction—that is, to the southeast of the MCV—is the most beneficial to deep convection. A study by Lai et al. (2011) also indicated that the southerly current related to MCVs benefits potential instability and convective activities.
One category of mesoscale vortex that is not closely related to convection is referred to as dry vortices. Dry vortices tend to generate on the leeward side of mountains and the dynamic downward motion of airflow caused by the topography is essential in their formation (Kuo et al., 2001). Zhong et al. (2014) pointed out that a large portion of the southwest vortices in China are dry vortices when they are generated. The smallest number of southwest vortices occurs in summer, with the largest possibility of the vortex moving out of the source region.
Previous studies of mesoscale vortices have achieved deep insights into their influence on tropical cyclones, as well as the interactions between MCVs and MCSs. However, there have been few studies on the climatology of mesoscale vortices in China and there is a shortage of basic statistics on the characteristics of mesoscale vortices. Our understanding of secondary convection triggered by mesoscale vortices is also insufficient. These issues are both fundamental scientific problems in the study of mesoscale vortices and the core problem in the fine forecasting of severe weather. We present here a census of mesoscale vortices occurring over China in 2015 and analyze the characteristics of different categories of mesoscale vortex. It is hoped that our results will provide other researchers with a basis for the numerical simulation and statistics of mesoscale vortices.
2 Data and methodology 2.1 DataThe ERA-Interim reanalysis dataset for 2015 was used to identify the mesoscale vortices. The data are available every 6 hours with a horizontal grid spacing of 0.125° × 0.125°. The region investigated is located at 0–45°N, 90°–130°E and covers most of China. The variables used are the relative vorticity and the relative humidity at different levels and the time is given as UTC.
To define its properties, it is necessary to confirm whether a vortex is generated from an MCS. A census of MCSs in 2015 was carried out using satellite data in the infrared region from the Japanese meteorology satellites MTSAT and HMW8. These data are available every hour with a grid spacing of 0.05° × 0.05°. The coverage of the observational data is 20°S–70°N, 70°–160°E, which includes the mesoscale vortex region under investigation.
2.2 MethodologyThe mesoscale vortex census is carried out by both the method of Davis et al. (2002, hereafter referred to as the DAT method) and an automatic vortex-tracking method developed by the authors. To make the results more representative, the average relative vorticity between 500 and 600 hPa is used in the method for identifying the mesoscale vortices. Accordingly, the vortices within 600–700 and 700–800 hPa are also analyzed. Four steps are needed to identify a mesoscale vortex. The first three steps in the DAT method find the vortices in each time period and the fourth step is used to track the vortex automatically from its initiation to dissipation.
The first step in the DAT method is to define the vorticity maxima (
The Laplacian must be negative to pass the first step. Note that this condition is not identical to the condition that the vorticity is a relative maximum with respect to the other surrounding grid points. The Laplacian condition is more general and allows the detection of vorticity anomalies embedded within large-scale gradients of vorticity. In practice, however, our condition finds vorticity maxima. For brevity, the cyclonic vorticity maxima will be referred to as vortices in the following sections.
In the second step, we compute the radial distribution of vorticity by averaging the vorticity over all the grid points that lie within one of a contiguous set of range bins 0.125° in radius. In practice, the average vorticity (
In the third step, within the radius R, the average vorticity of each bin must decrease monotonically from the center to R. In addition, within each bin of radius R, the ratio of
After the three steps of the DAT method, the mesoscale vortex points at each time are available. The fourth step is then used to track the mesoscale vortex from its initiation to dissipation. The M factor is used to track the mesoscale vortex and is defined as:
where D is the distance between the mesoscale vortex locations at two continuous time steps, R1 and I1 are the radius and intensity at the earlier time, respectively, and R2 and I2 correspond to the later time. Among all the mesoscale vortices in the later time step, the mesoscale vortex to be tracked will move to the place with the smallest M factor. The movement of the mesoscale vortex in the actual environment is controlled by the westerly steering flow (Zhong et al., 2014) and the distance moved is a limited value. Two conditions are therefore required. First, the mesoscale vortex should move eastward. Second, the distance D must be less than a certain threshold. Considering the speed of the steering flow at different levels, 40, 28, and 18 grid intervals are chosen as the thresholds within 500–600, 600–700, and 700–800 hPa, respectively.
After identifying mesoscale vortices using these four steps, we still need to classify the mesoscale vortices by their properties and by whether they can trigger a secondary MCS. To distinguish the properties of mesoscale vortices, they are first divided into dry and wet vortices. Vortices with a relative humidity > 90% at the time of formation are termed wet vortices, otherwise, they are termed as dry vortices. Wet vortices are closely related to the latent heating process, whereas dry vortices are related to dynamics, topography, and sensible heating. A special category of mesoscale vortex, named MCV, is then derived from the wet vortices. If the wet vortex is generated from an MCS, which requires the distance between the mesoscale vortex and its parent MCS to be < 300 km, then it is regarded as an MCV. Otherwise, the wet vortex will be regarded as a mesoscale stratiform vortex (MSV). The distance of 300 km is chosen to make sure that the mesoscale vortex is generated within the circulation of the MCS. Mesoscale vortices can be classified into three categories: mesoscale dry vortex (MDV), MSV, and MCV.
To investigate secondary MCSs, it is necessary to check whether any MCS is forming within the mesoscale vortex circulation during its lifecycle. If the distance between the mesoscale vortex and a newly generated MCS is < 300 km, then the mesoscale vortex is considered to have a secondary MCS. Otherwise, the mesoscale vortex will be considered not to have a secondary MCS. Because information on MCSs is available each hour and information on mesoscale vortices is available every six hours, hourly vortex information can be obtained by interpolation. The position where the MCS is generated and the position of the mesoscale vortex can then be compared. It is then easy to estimate whether a mesoscale vortex has a secondary MCS.
An automatic method of identifying MCSs (Shu and Pan, 2010) is also used to obtain the MCSs in 2015, according to the definition in Table 1. The MCS profiles in each time step are found first, and then the whole MCS lifecycle from initiation to dissipation is found after tracking the profiles.
| MCS category | Size | Duration | Eccentricity |
| MαCCS | Cold cloud region ≤ –52°C with area ≥ 50000 km2 | Size definition satisfied ≥ 3 h | ≥ 0.5 |
| MαECS | 0.2–0.5 | ||
| MβCCS | Cold cloud region ≤ –52°C with area ≥ 30000 km2 and maximum size ≥ 50000 km2 |
≥ 0.5 | |
| MβECS | 0.2–0.5 | ||
| Note: MαCCS, MαECS, MβCCS, and MβECS correspond to meso-α circular convective systems, meso-α elongated convective systems, meso-β circular convective systems, and meso-β elongated convective systems, respectively. | |||
Table 2 shows the census results for mesoscale vortices over China in 2015. The number of vortices increases on moving to lower levels. There are 3660, 6382, and 10692 vortices within 500–600, 600–700, and 700–800 hPa, respectively. At each level, the number of wet vortices is much larger than that of dry vortices. This indicates that the majority of mesoscale vortices cannot form without moisture and that phase transition or latent heating plays an important part in the formation of mesoscale vortices. The proportion of MDVs is about one-fifth of the total number of mesoscale vortices and is even lower at low levels, making up about 10% of the total number of mesoscale vortices within 700–800 hPa. MCVs make up only a small proportion of the total and the numbers of MCVs are 63, 72, and 88 from high to low levels, respectively. Davis et al. (2002) recorded 43 MCVs within 500–600 hPa over the USA from May to August 1999, which is of the same order of magnitude as our results.
| Height (hPa) | MCV | MDV | MSV | Total |
| 500–600 | 63 (5) | 745 (3) | 2852 (49) | 3660 (57) |
| 600–700 | 72 (0) | 1194 (2 | 5116 (66) | 6382 (68) |
| 700–800 | 88 (3) | 1107 (2) | 9497 (64) | 10692 (69) |
The numbers in parentheses in Table 2 refer to the number of mesoscale vortices with secondary convection. Secondary convection as defined here refers to a secondary MCS that satisfies the definitions in Table 1. This condition is strict and leads to a small number of secondary convections. From high to low levels, the number of mesoscale vortices with secondary convection is 57, 68, and 69. MDVs almost never trigger secondary convection, suggesting that moisture is essential in the formation of secondary convection. The probability of triggering secondary convection increases in the sequence MCV, MSV, and MDV within 500–600 hPa.
The MCS census over China in 2015 is carried out according to the definitions in Table 1 and the results are given in Table 3. A total of 2658 MCSs are identified, of which 682 are MαCCSs, 805 are MαECSs, 376 are MβCCSs, and 795 are MβECSs (see Table 1 for definitions). The number of MαCSs is larger than that of MβCSs, and the number of elongated MCSs is larger than that of circular MCSs. According to the previous studies, a mesoscale vortex is typical of 500–600 hPa. Mesoscale vortices within 500–600 hPa are therefore chosen for discussion here to aid comparisons with previous investigations.
| MCS category | MαCCS | MαECS | MβCCS | MβECS | Total |
| Number | 682 | 805 | 376 | 795 | 2658 |
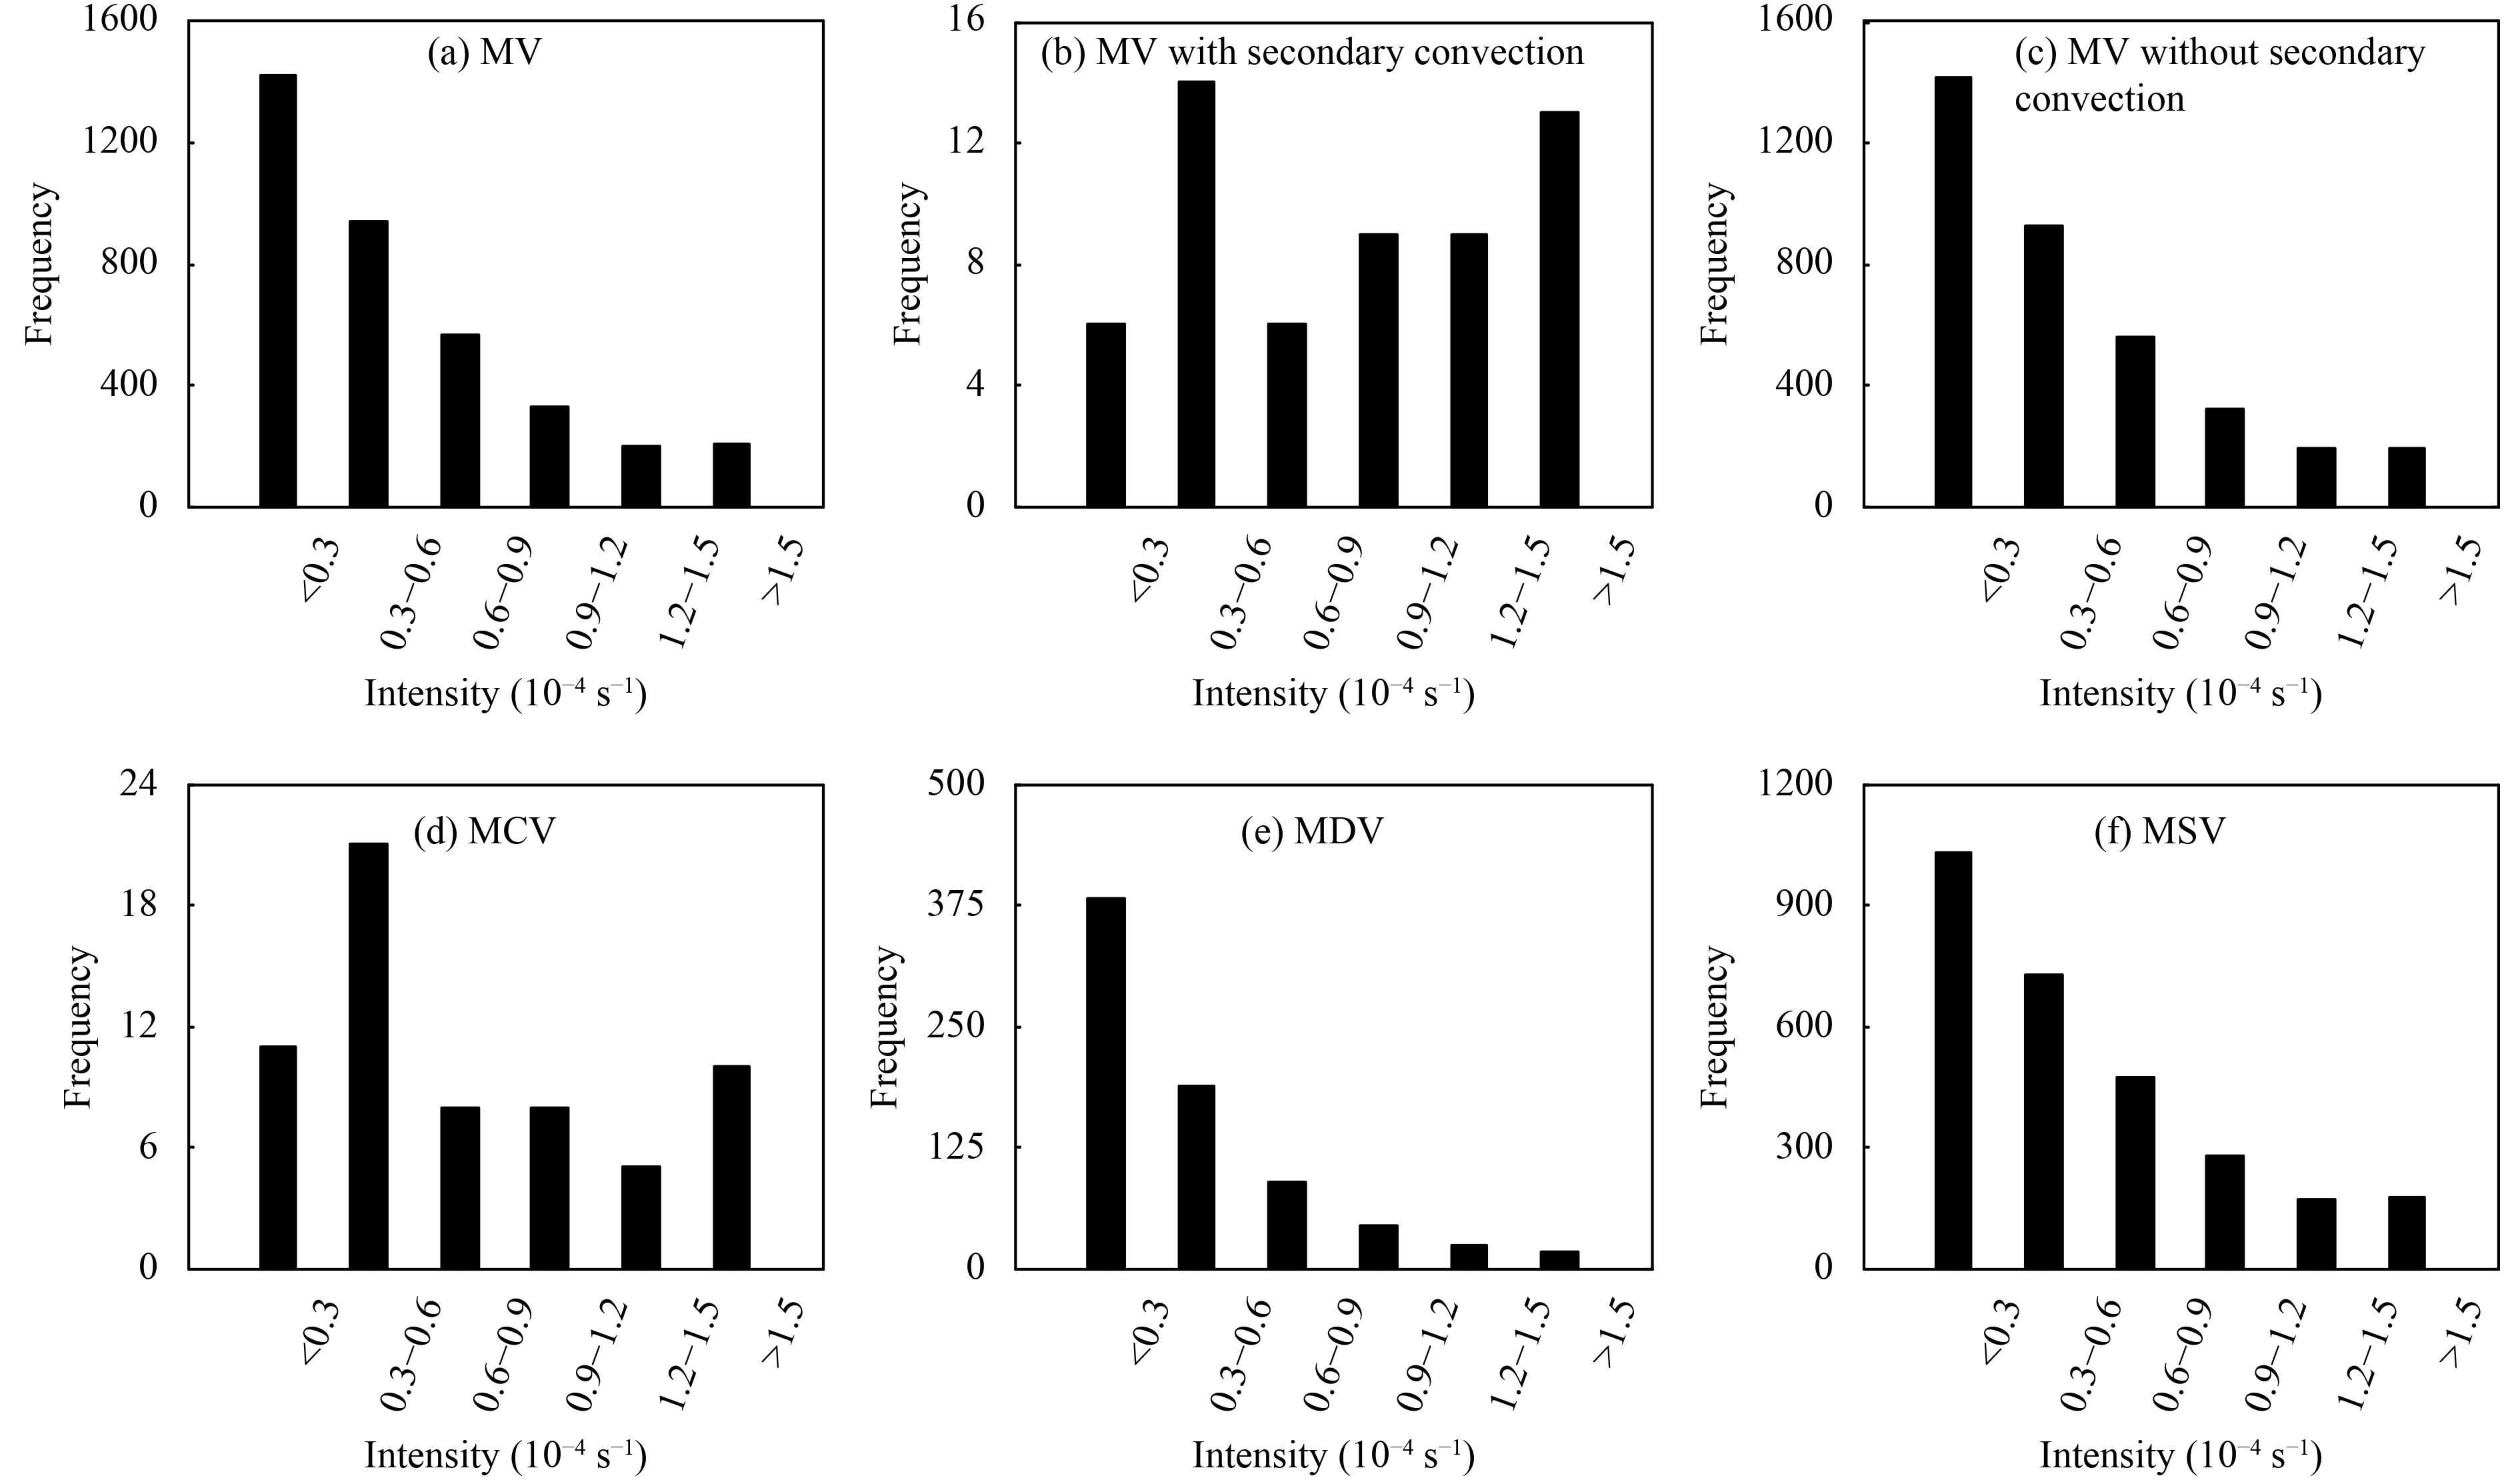
Figure 1 shows the intensity of different categories of mesoscale vortex and Table 4 summarizes the average intensity, radius, and duration. All the data for the intensity and size of mesoscale vortices in this section refer to the values obtained when the mesoscale vortex has the largest intensity, which is referred to as the time of maturity. Table 4 and Fig. 1a show that the average intensity for all mesoscale vortices is 0.56 × 10⁻⁴ s–1. Many vortices are weaker than 1 × 10⁻⁴ s–1. The number of vortices decreases with increasing intensity. The example with the largest intensity, about 3.6 × 10⁻⁴ s–1, is an MCV. The mesoscale vortices with secondary convection (1.02 × 10⁻⁴ s–1) are almost twice the intensity of the mesoscale vortices without secondary convection (0.55 × 10⁻⁴ s–1), suggesting that the larger intensity, the larger the probability of secondary convection. Comparing the intensities among MCVs, MDVs, and MSVs, MCVs are the most intense, followed by MSVs, whereas MDVs are the weakest. Ten MCVs are stronger than 1.5 × 10⁻⁴ s–1. MDVs are usually weak, with an average intensity of 0.42 × 10⁻⁴ s–1. It is unusual to observe MDVs stronger than 1 × 10⁻⁴ s–1.
|
| Figure 1 Distributions of mesoscale vortex intensity. The abscissa shows intensity (10–4 s–1) and the vertical axis gives the number of mesoscale vortices. (a) Mesoscale vortices, (b) mesoscale vortices with secondary convection, (c) mesoscale vortices without secondary convection, (d) MCVs, (e) MDVs, and (f) MSVs. |
| Category | All mesoscale
vortices |
Mesoscale vortex
with secondary MCS |
Mesoscale vortex
without secondary MCS |
MCV | MDV | MSV |
| Number | 3660 | 57 | 3603 | 63 | 745 | 2852 |
| Intensity (10–4 s–1) | 0.56 | 1.02 | 0.55 | 0.89 | 0.42 | 0.59 |
| Radius (km) | 142.9 | 172.6 | 142.4 | 169.8 | 144.0 | 142.0 |
| Duration (h) | 10.1 | 21.6 | 9.9 | 12.0 | 8.9 | 10.3 |
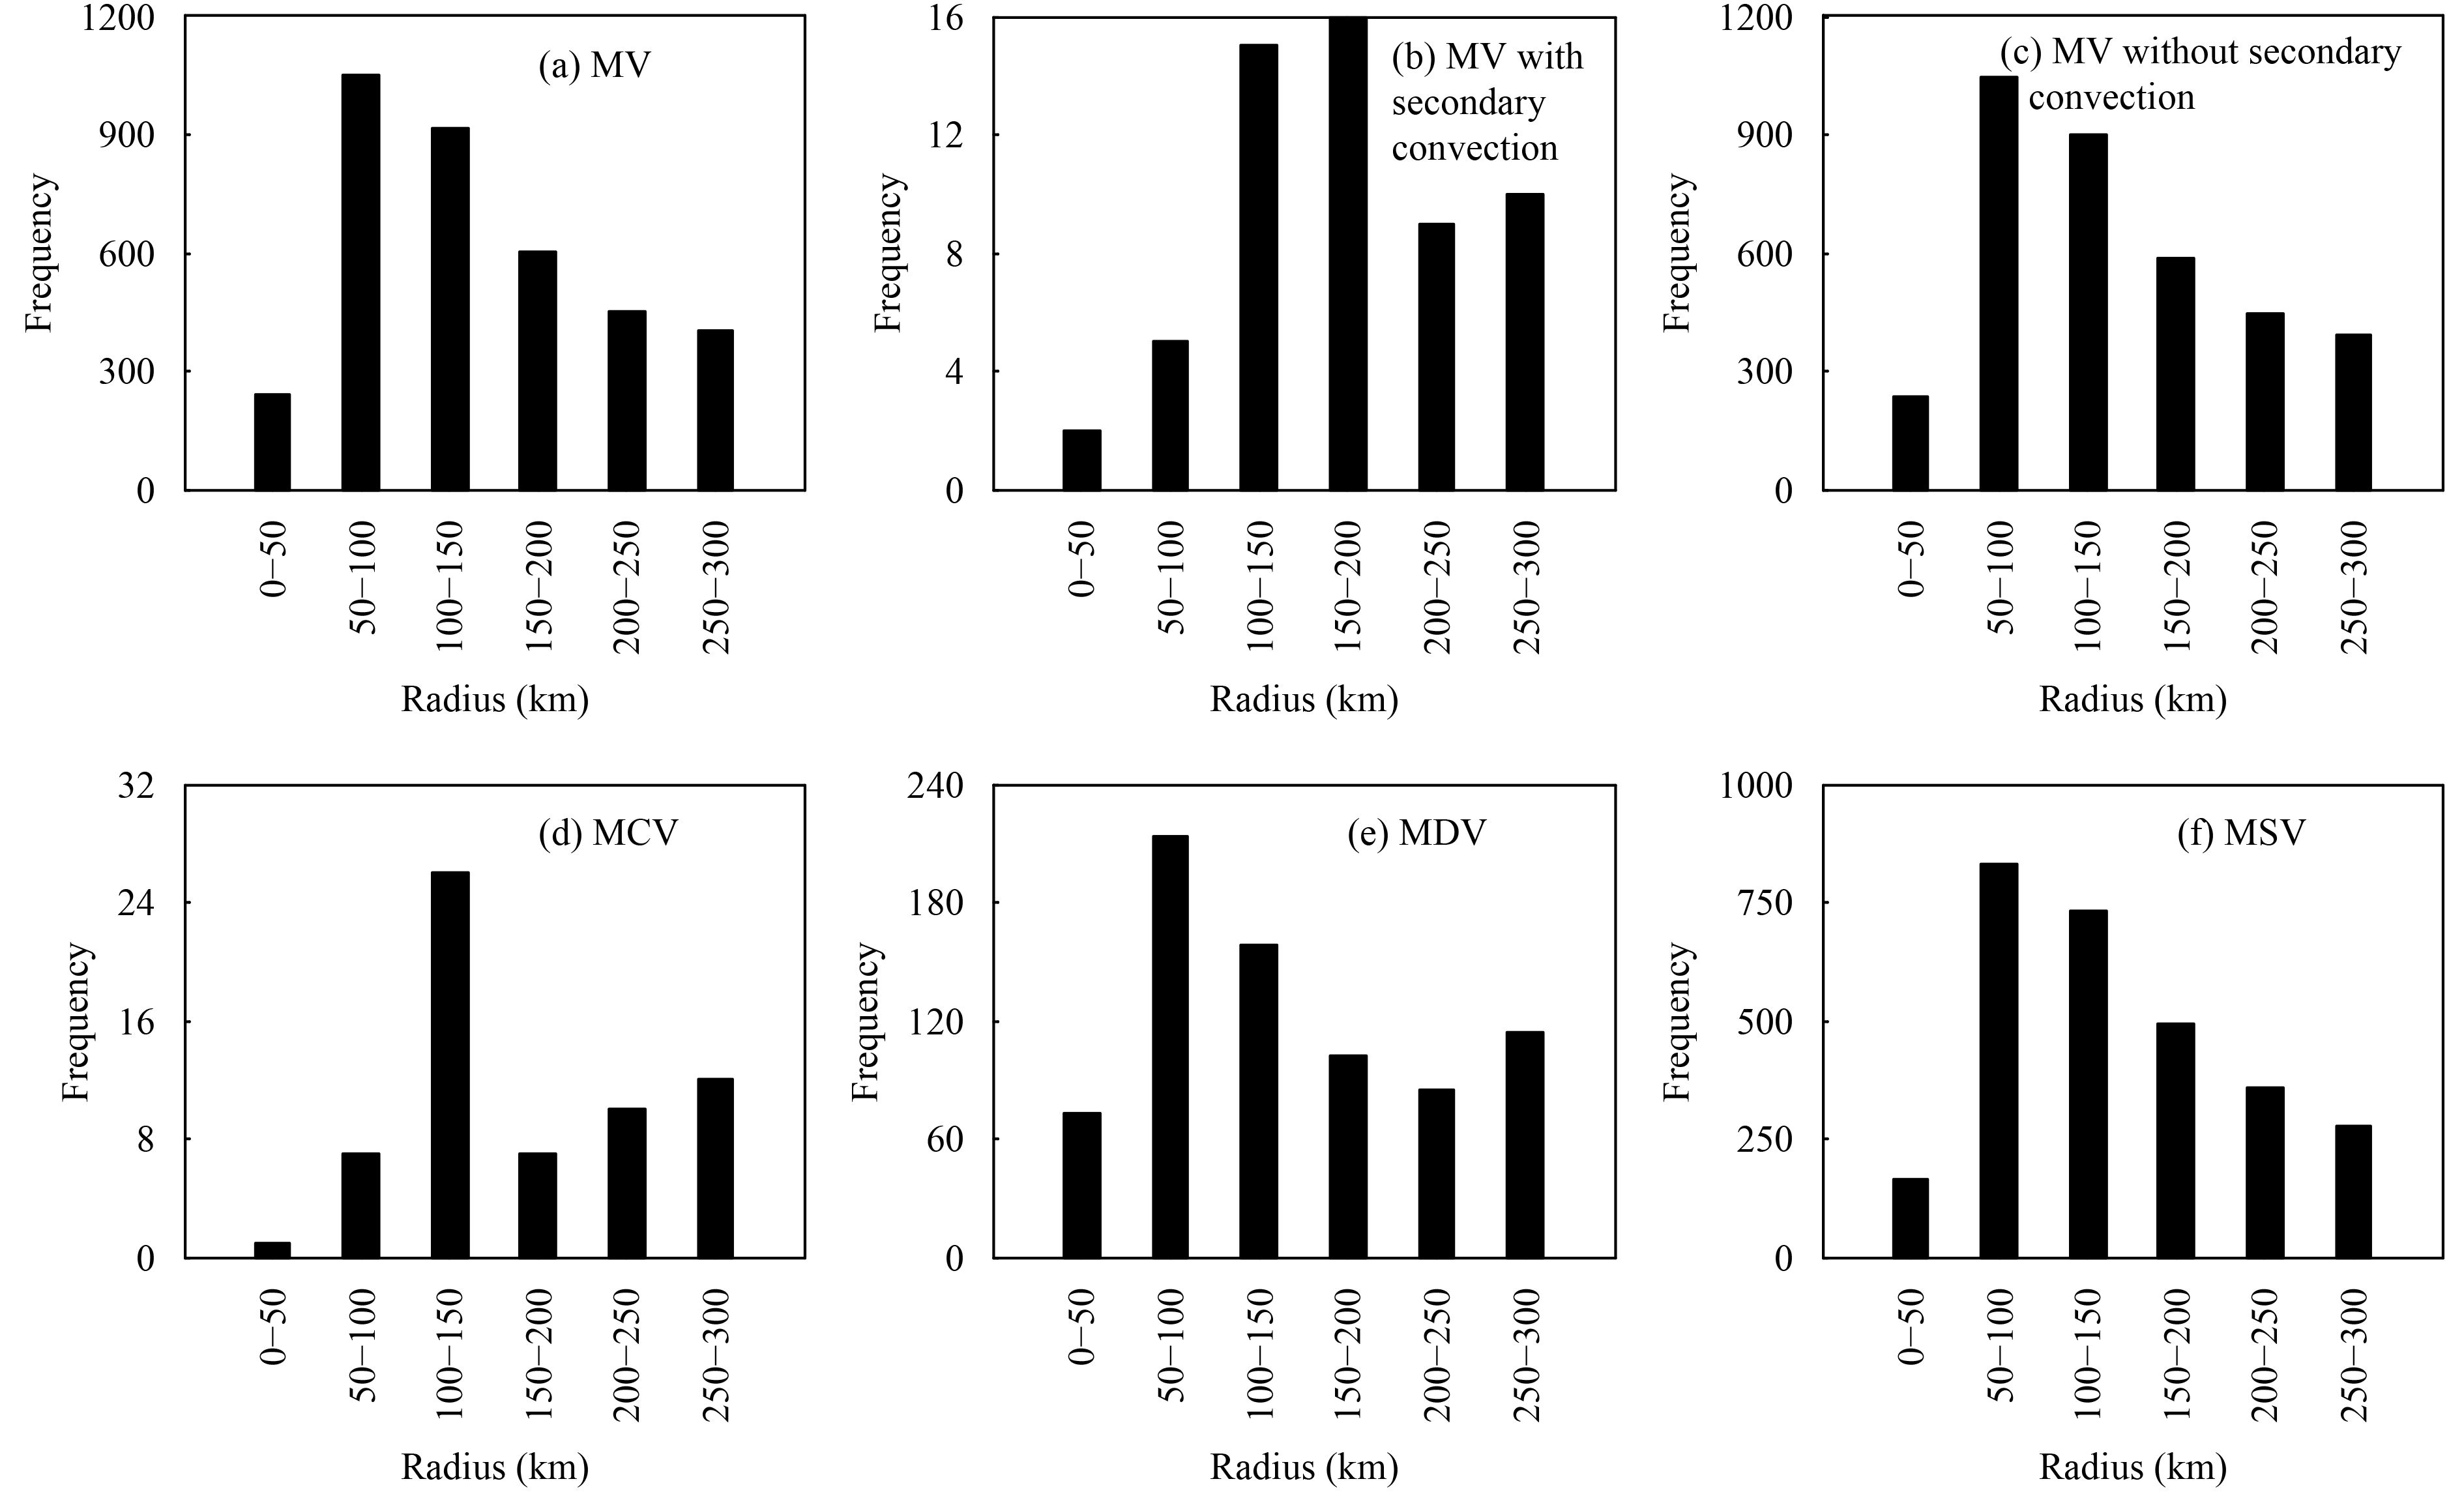
Figure 2 shows the size distributions of mesoscale vortices. Note that the upper limit of the radius of mesoscale vortices is set as 300 km and therefore systems with a radius > 300 km are excluded from our database. Figure 2a shows that mesoscale vortices are typically meso-β-scale systems, with an average radius of 142.9 km. Most of the vortices have a radius < 150 km. The number of vortices decreases as their size increases, in agreement with previous studies on mesoscale systems. There are few vortices with a radius < 50 km, however, which does not seem to reflect reality. This distortion is related to the data and method used in the identification of mesoscale vortices. As a result of the grid spacing of the data, there are few points within the 50-km range, which makes it difficult to capture the smaller vortices. As indicated in Fig.1, vortices that can trigger secondary convection are more intense. Similarly, Figs. 2b and 2c show that mesoscale vortices with secondary convection are much larger. MDVs and MSVs have nearly the same average size, whereas MCVs are larger (Table 4; Figs. 2d–f). The average radius of MCVs is about 170 km and > 20% of MCVs have a radius > 250 km.
|
| Figure 2 Size distributions of mesoscale vortices. The abscissa is the vortex radius (km) and the vertical axis gives the number of mesoscale vortices. (a) Mesoscale vortices, (b) mesoscale vortices with secondary convection, (c) mesoscale vortices without secondary convection, (d) MCVs, (e) MDVs, and (f) MSVs. |
Detailed analysis in Table 4 shows that there are positive correlations among the intensity, size, and duration of mesoscale vortices. Larger vortices tend to have a greater intensity and longer duration, and vice versa. On average, MCVs have the largest intensity, size, and duration, whereas MDVs have the smallest intensity, size, and duration. Mesoscale vortices with secondary convection have a larger intensity, size, and duration than vortices without secondary convection. These observations are useful guidance for operational weather forecasters. If a mesoscale vortex has a large intensity or has triggered secondary convection, it can be predicted that it will last for a long time and affect a wide area.
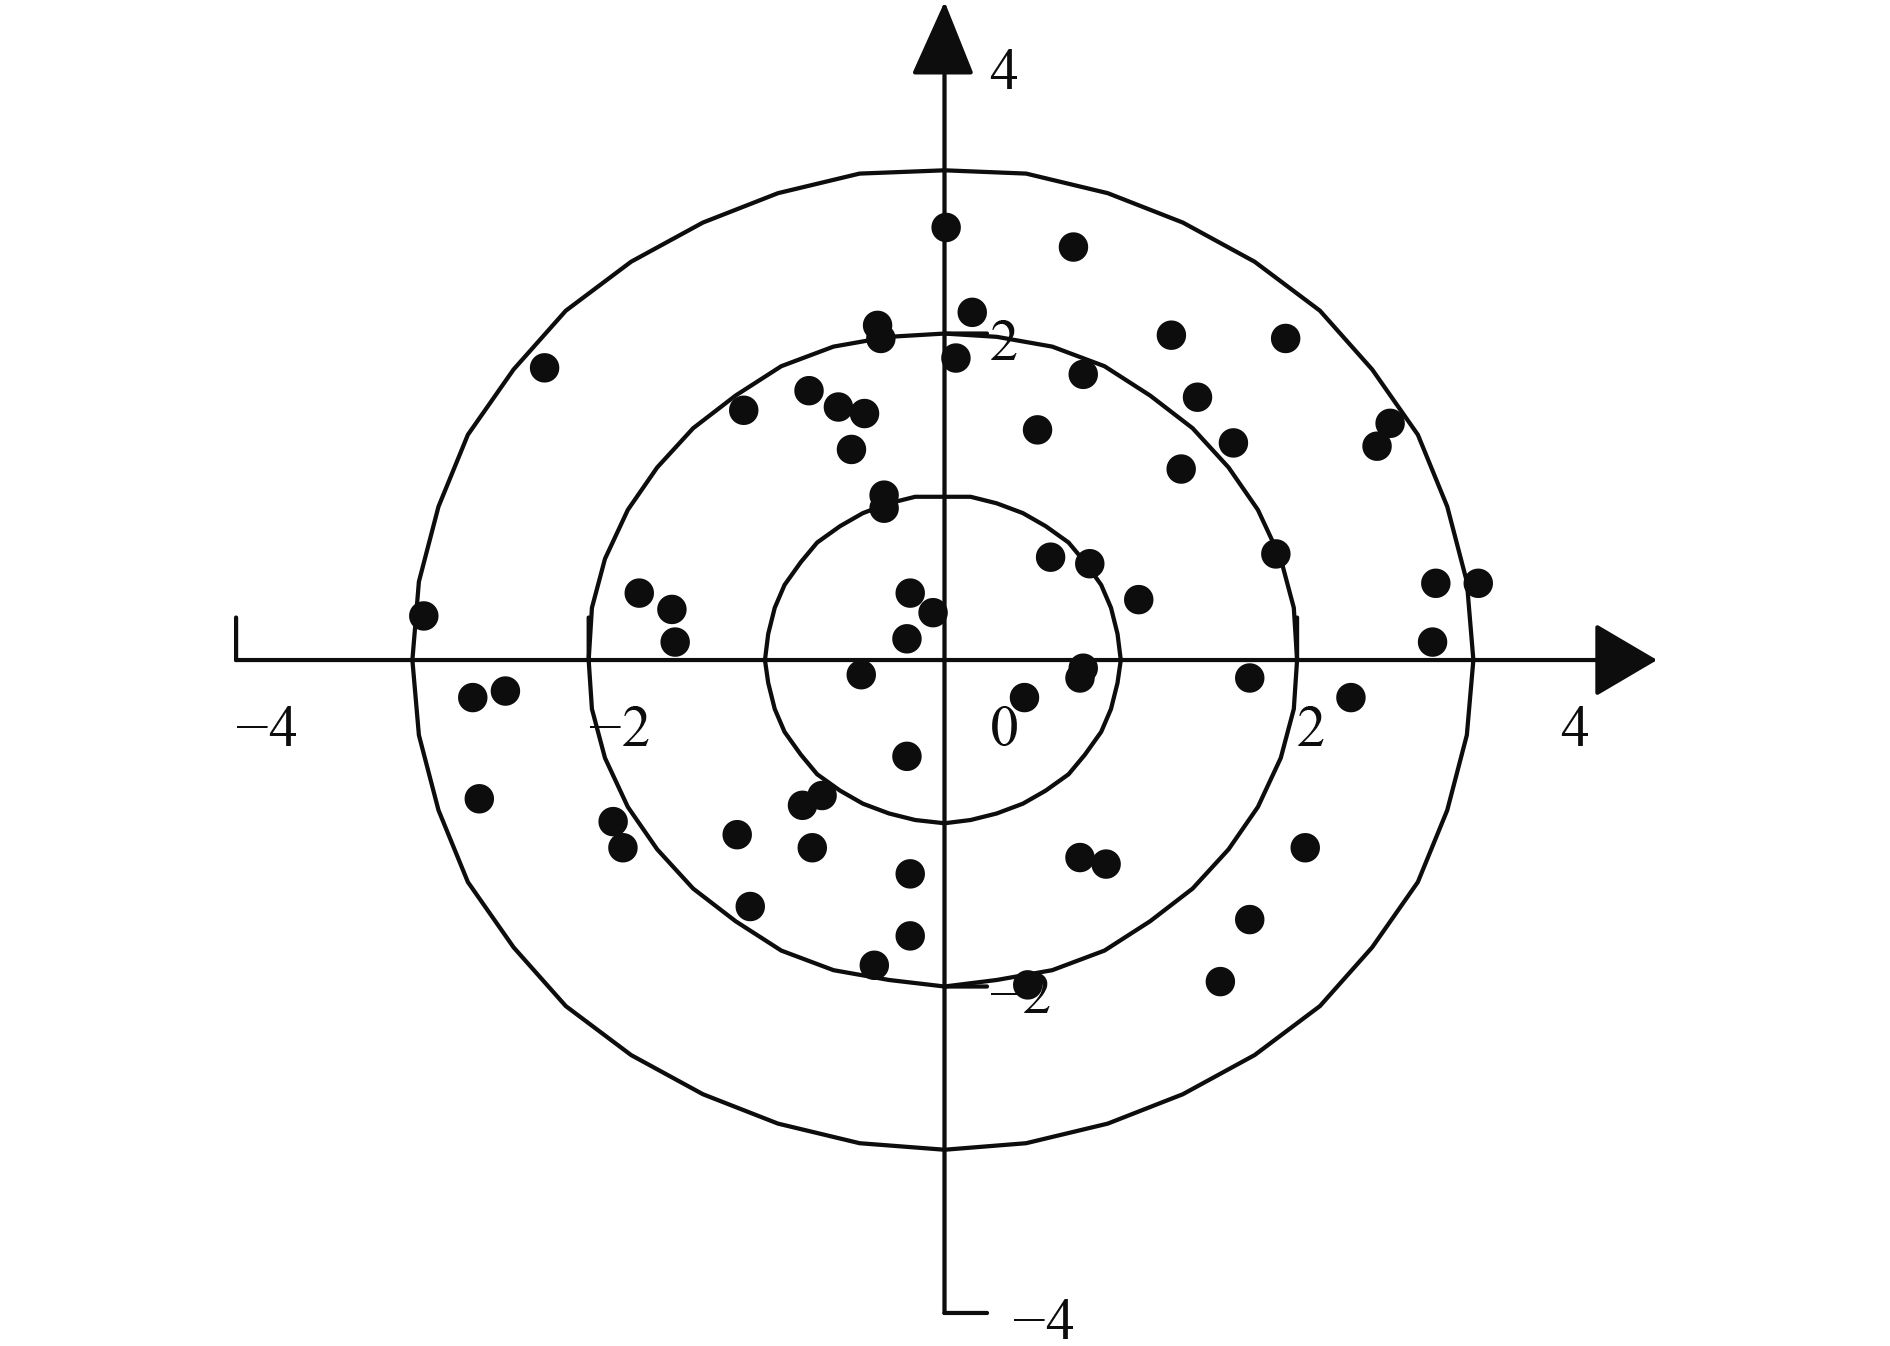
3.2 Relative position between mesoscale vortices and MCSsFigure 3 shows the distribution of the position of MCVs relative to the parent MCS. Sixty-three MCVs are distributed in the four quadrants with almost equal probability, meaning that no location is favorable for the formation of MCVs and they do not appear in any particular direction of MCSs. However, MCVs tend to generate between one and two intervals of longitude from the parent MCS; 29 (46%) MCVs form within this region. Twenty-four (38%) MCVs form between two and three intervals of longitude, although fewer MCVs are formed within one interval of longitude or at more than three intervals of longitude.
|
| Figure 3 Relative position between MCVs and their parent MCS. The origin denotes the center of the MCS. The black points denote the center of the MCV relative to the center of the MCS. The units of the axes are intervals of longitude. |
Figure 4 shows the relative positions of the mesoscale vortices and the secondary MCSs. Five of the 63 MCVs trigger secondary MCSs, which are mainly located to the south and east of the MCVs. This result is similar to that of Trier and Davis (2007), in which they reported that secondary convection is most likely to occur to the southeast of the MCV. The interaction between the circulation of MCVs and vertical shear can trigger vertical upward motion southeast of the MCVs. MDV rarely trigger secondary MCSs; only three of 745 MDVs triggered secondary MCSs, with two of the MCSs appearing south of the vortex and one to the northwest. Figure 4c shows that secondary MCSs occur in every direction of the MSVs. This may be because MSVs occur in very moist environments, favoring secondary convection in all directions. However, detailed analysis shows that more secondary MCSs appear to the south (29) than to the north (20) of MSVs, suggesting more favorable conditions for secondary MCSs to the south of MSVs.

|
| Figure 4 Relative positions between mesoscale vortices and secondary MCSs. The origin denotes the center of the mesoscale vortex and the black points are the positions of secondary MCSs. The units of the axes are intervals of longitude. (a) MCVs, (b) MDVs, and (c) MSVs. |
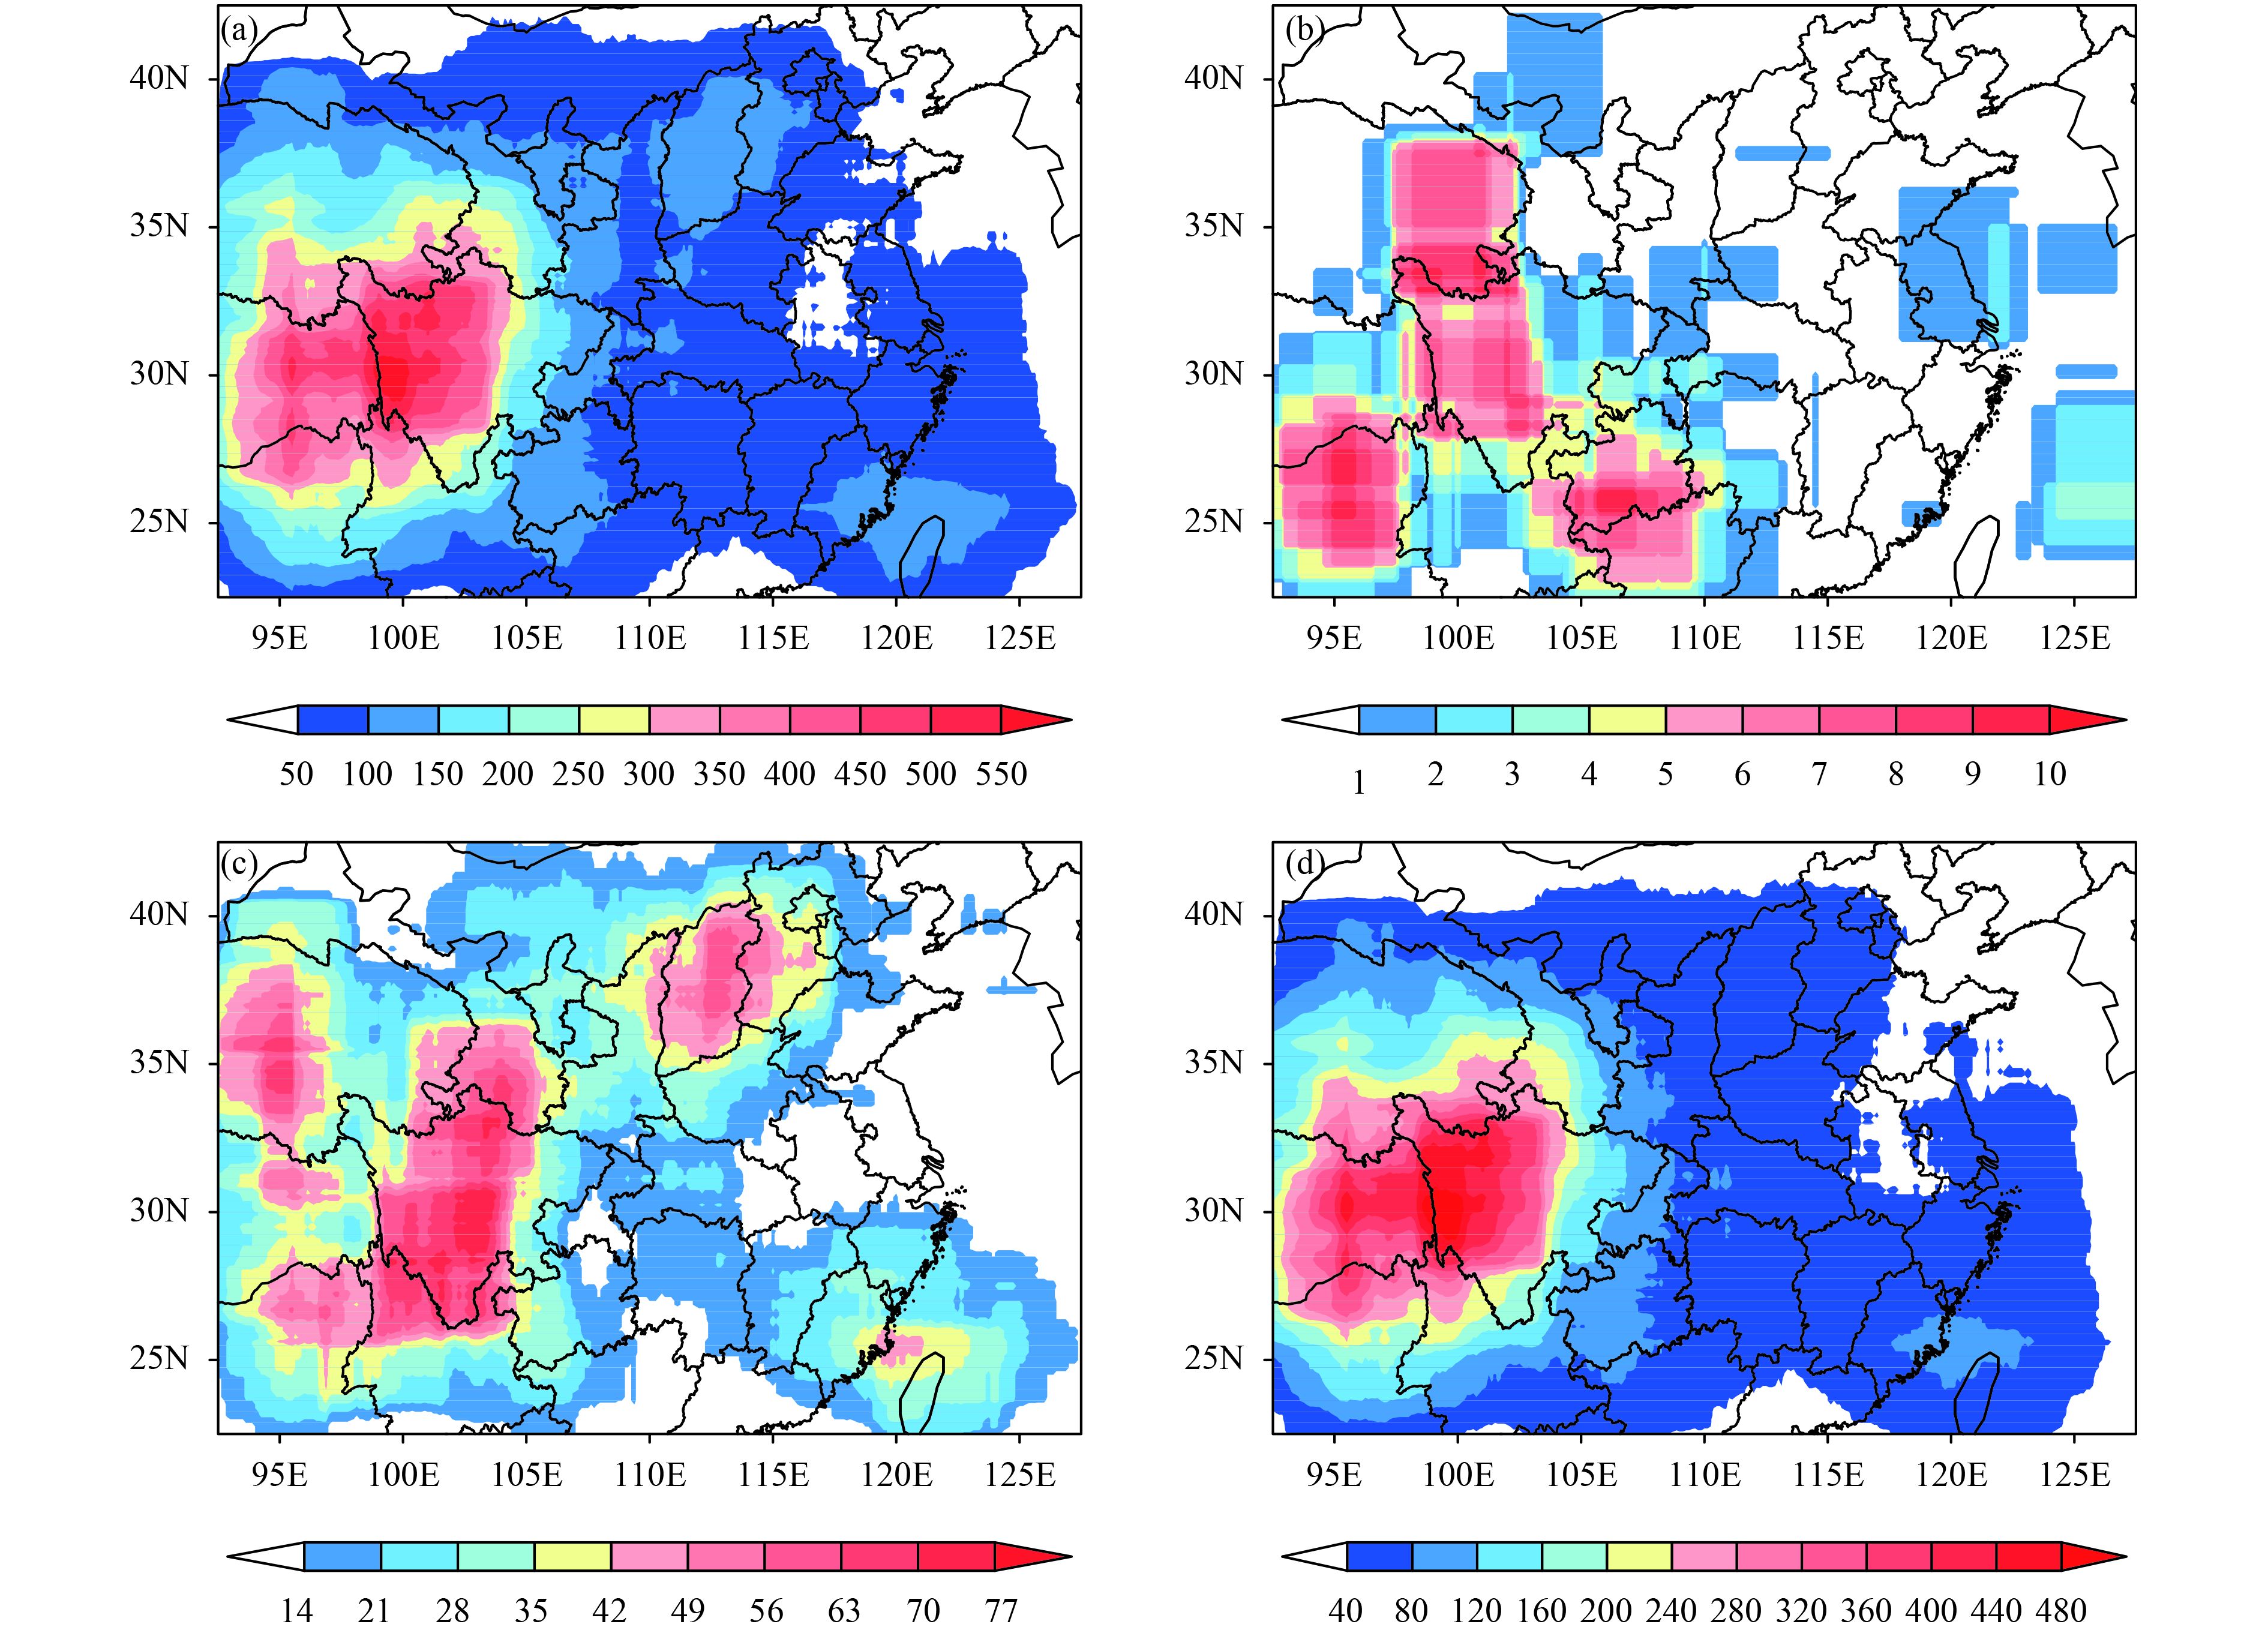
Figure 5 shows the geographical distributions of mesoscale vortices within 500–600 hPa. The position data are gathered at the time when the mesoscale vortex is born. Figure 5a shows that the leeward side of the Tibetan Plateau, located between 99° and 103°E, is the main source of mesoscale vortices. The concentration of mesoscale vortices in this region is related to the dynamic effects of topography. The downward flow on the leeward side of the plateau leads to the growth of cyclonic vorticity and the formation of mesoscale vortices. The westerly winds are then split by the plateau and the southern branch of these winds may cause a cyclonic vortex to the east of the Tibetan Plateau. In addition, this region is affected by the southwest monsoon, which provides plentiful water vapor and momentum for the formation of mesoscale vortices. The mesoscale vortex in this region is called the Southwest China vortex, the eastward movement of which can cause severe convective weather in the middle and lower reaches of the Yangtze River. The eastern Tibetan Plateau between 95° and 99°E has the second highest frequency of mesoscale vortices. Both the thermal and dynamic effects of topography contribute to the concentration of mesoscale vortices in this region.
The frequency of mesoscale vortices is relatively low in other areas. Shanxi and Hebei provinces north of 35°N and the Taiwan Strait near 25°N are two other relatively active regions. Figure 5c shows that the mesoscale vortices in Shanxi and Hebei provinces are mainly MDVs. This region is a region of transition between the Loess Plateau and the North China Plain, and the change in elevation causes the high frequency of mesoscale vortices. However, the amount of moisture in this region is usually insufficient to generate wet vortices and mainly dry vortices occur here. Both MDVs and MSVs are active in the Taiwan Strait region (Figs. 5c, d). This region lies on the leeward side of the Wuyi Mountains and the mesoscale vortices here are favored by both the dynamic effects of topography and the warm wet flow of air. Figure 5c shows a concentration of MDVs near 35°N, 95°E at the transition from the Kunlun Mountains to the Qaidam basin. Both the downward flow and low moisture content lead to a high frequency of dry vortices in this region. The distribution of mesoscale vortices shown in Fig. 5b is not representative due to the lower number of MCVs. Theoretically, the geographical distribution of MCVs should be similar to the distribution of MSVs. Figure 5b shows that MCVs are mainly concentrated in the east of the Tibetan Plateau, the east of the Yunnan–Guizhou Plateau, and eastern Qinghai Province.
Figure 5 shows that all three categories of mesoscale vortex tend to occur in the transition areas from high to low elevations. The downward flow caused by change in elevation benefits the formation of mesoscale vortices. MSVs and MCVs tend to form in the areas where there is sufficient moisture, whereas MDVs usually form in the areas with less moisture.
|
| Figure 5 Geographical distributions of mesoscale vortices within 500–600 hPa at the time of occurrence. (a) Mesoscale vortices, (b) MCVs, (c) MDVs, and (d) MSVs. The shading denotes the number of vortices counted in the 5° × 5° rectangular box with the grid point as the center. |
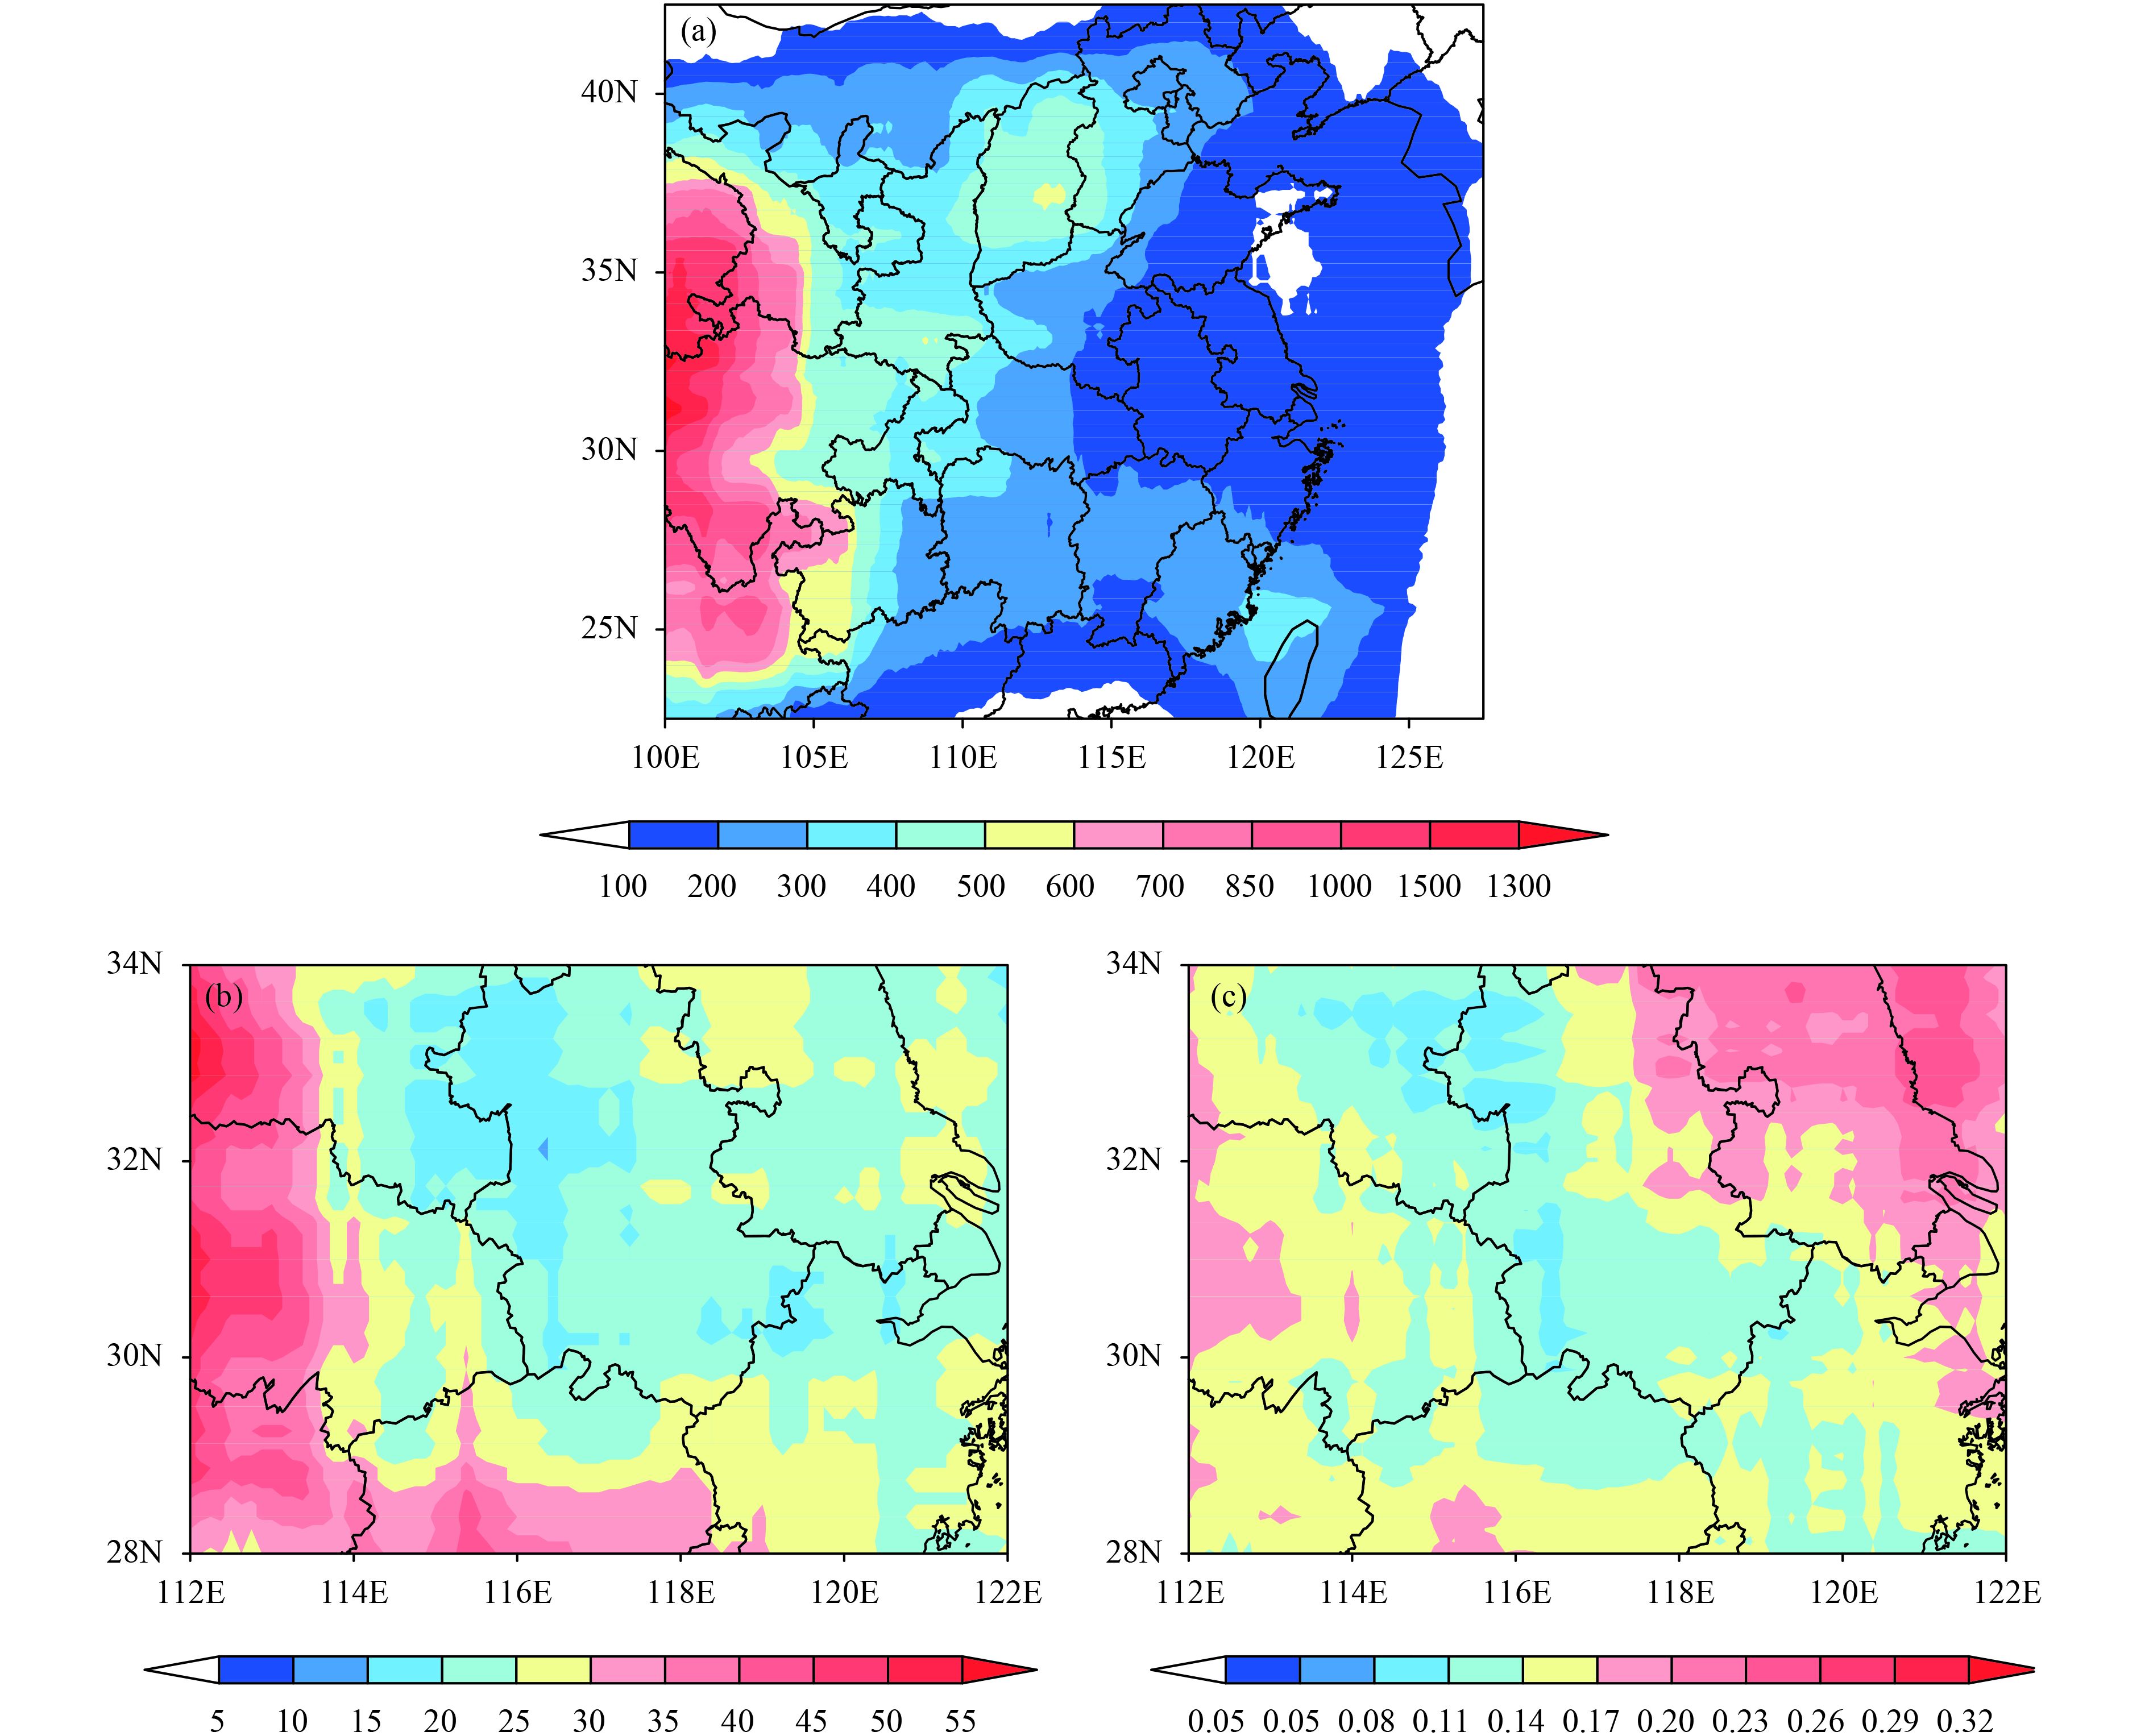
Previous studies (Sun et al., 2010; Zhang et al., 2013) have demonstrated that the vortices in the Meiyu front are active at low levels. Figure 6 shows the geographical distributions of mesoscale vortices within 700–800 hPa. The transition zone from the Tibetan Plateau toward the basin (Southwest China) has the highest frequency of mesoscale vortices, whereas the plain areas of East China have relatively fewer mesoscale vortices because the dynamic effect of topography is lower. The statistics for mesoscale vortices at lower levels in the Tibetan Plateau region are meaningless because its real height is > 700 hPa. Figure 6a shows the number of mesoscale vortices to the east of 100°E.
A comparison of Fig. 6a and Fig. 5a shows that the number of mesoscale vortices in East China within 700–800 hPa is much larger than within 500–600 hPa. This result is both acceptable and reasonable. Figure 6b shows the geographical distribution of mesoscale vortices over the Yangtze–Huaihe River basin in June and July and Fig. 6c shows the ratio of the number of mesoscale vortices in June and July to the number of mesoscale vortices in 2015. Figure 6b shows that a large number of mesoscale vortices gather in the upper reaches of the Yangtze–Huaihe River basin to the west of 114°E in the transition region from the mountain areas to the plains. There are relatively few mesoscale vortices in the plain areas, where they are mainly formed by large-scale weather systems, such as the Meiyu front. Parts of Jiangsu Province have many mesoscale vortices, whereas there are relatively fewer mesoscale vortices in the boundary area between Anhui and Henan provinces. A detailed analysis of Fig. 6c shows that the ratio of the number of mesoscale vortices in June and July relative to those in the year 2015 is > 25% in Jiangsu Province. This shows that mesoscale vortices are active during the Meiyu season in Jiangsu Province. In the boundary area between Anhui and Henan provinces, however, this ratio is relatively low, suggesting that mesoscale vortices in the Meiyu front are inactive over this region.
|
| Figure 6 Geographical distributions of mesoscale vortices within 700–800 hPa in (a) the whole year, and (b) June and July 2015. Shading denotes the number of vortices. (c) Ratio of the number of vortices in June and July to the number of vortices in the whole year. |
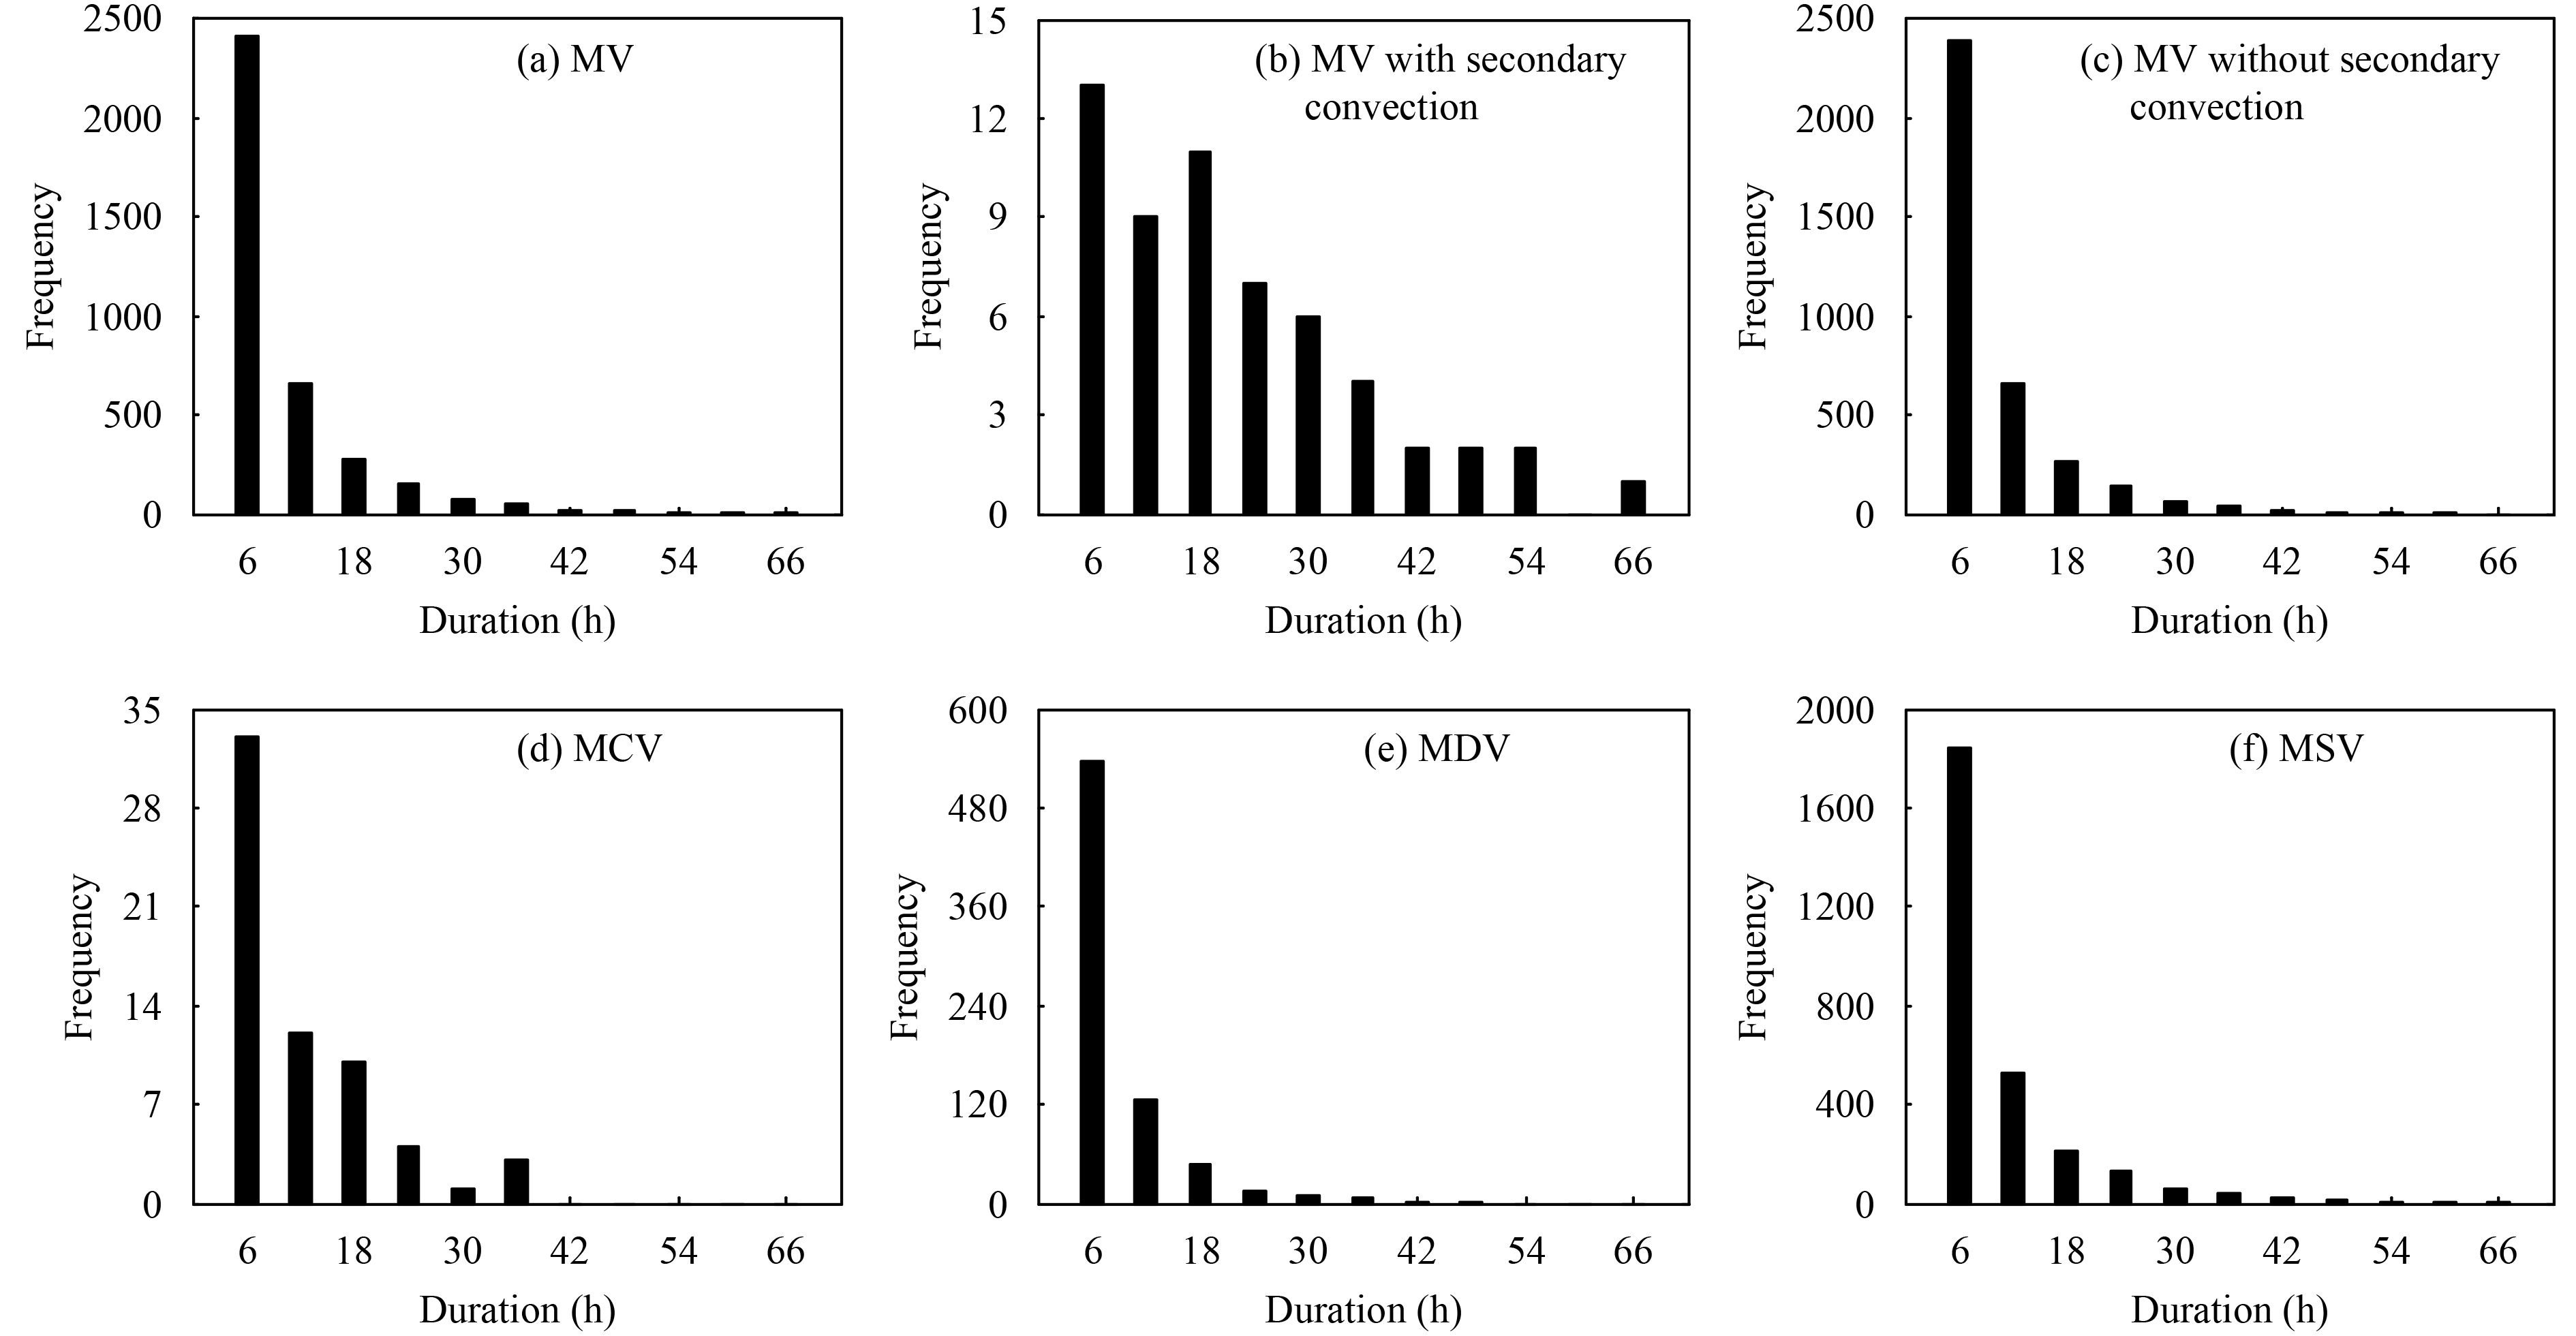
Figure 7 shows the distributions of the duration of each category of mesoscale vortex and Table 4 gives the average duration of each category. As a result of the 6-h temporal resolution of the data, if a mesoscale vortex appears in only one time step, it is said to have a duration of 6 h. If a mesoscale vortex appears in two continuous time steps, it is said to have a duration of 12 h, and so on. Figure 7a and Table 4 show that the average duration of all mesoscale vortices is 10.1 h. Most of mesoscale vortices have a duration of 6 h. The number of mesoscale vortices decreases exponentially as their duration increases. The example with the longest duration (66 h) is an MSV with a secondary MCS (Figs. 7b, f). It is clear that mesoscale vortices with a secondary MCS last much longer than mesoscale vortices without a secondary MCS. Their average duration is 21.6 and 9.9 h, respectively. This result makes sense because the secondary MCS can either intensify the original mesoscale vortex or trigger new mesoscale vortices. As a result, the duration of the original mesoscale vortex will be extended.
On average, MCVs have the longest average duration (12.0 h), MSVs the second longest duration (10.3 h), and MDVs the shortest duration (8.9 h). This reflects the important part that water vapor plays in the evolution of mesoscale vortices. The phase change of the water vapor or latent heating increases the duration of the mesoscale vortex. In general, MDVs have a short lifecycle and few examples last for > 24 h ( Fig. 7e), whereas 50% of MCVs last for 12 h or longer (Fig. 7d).
|
| Figure 7 Distributions of the duration of mesoscale vortices. |
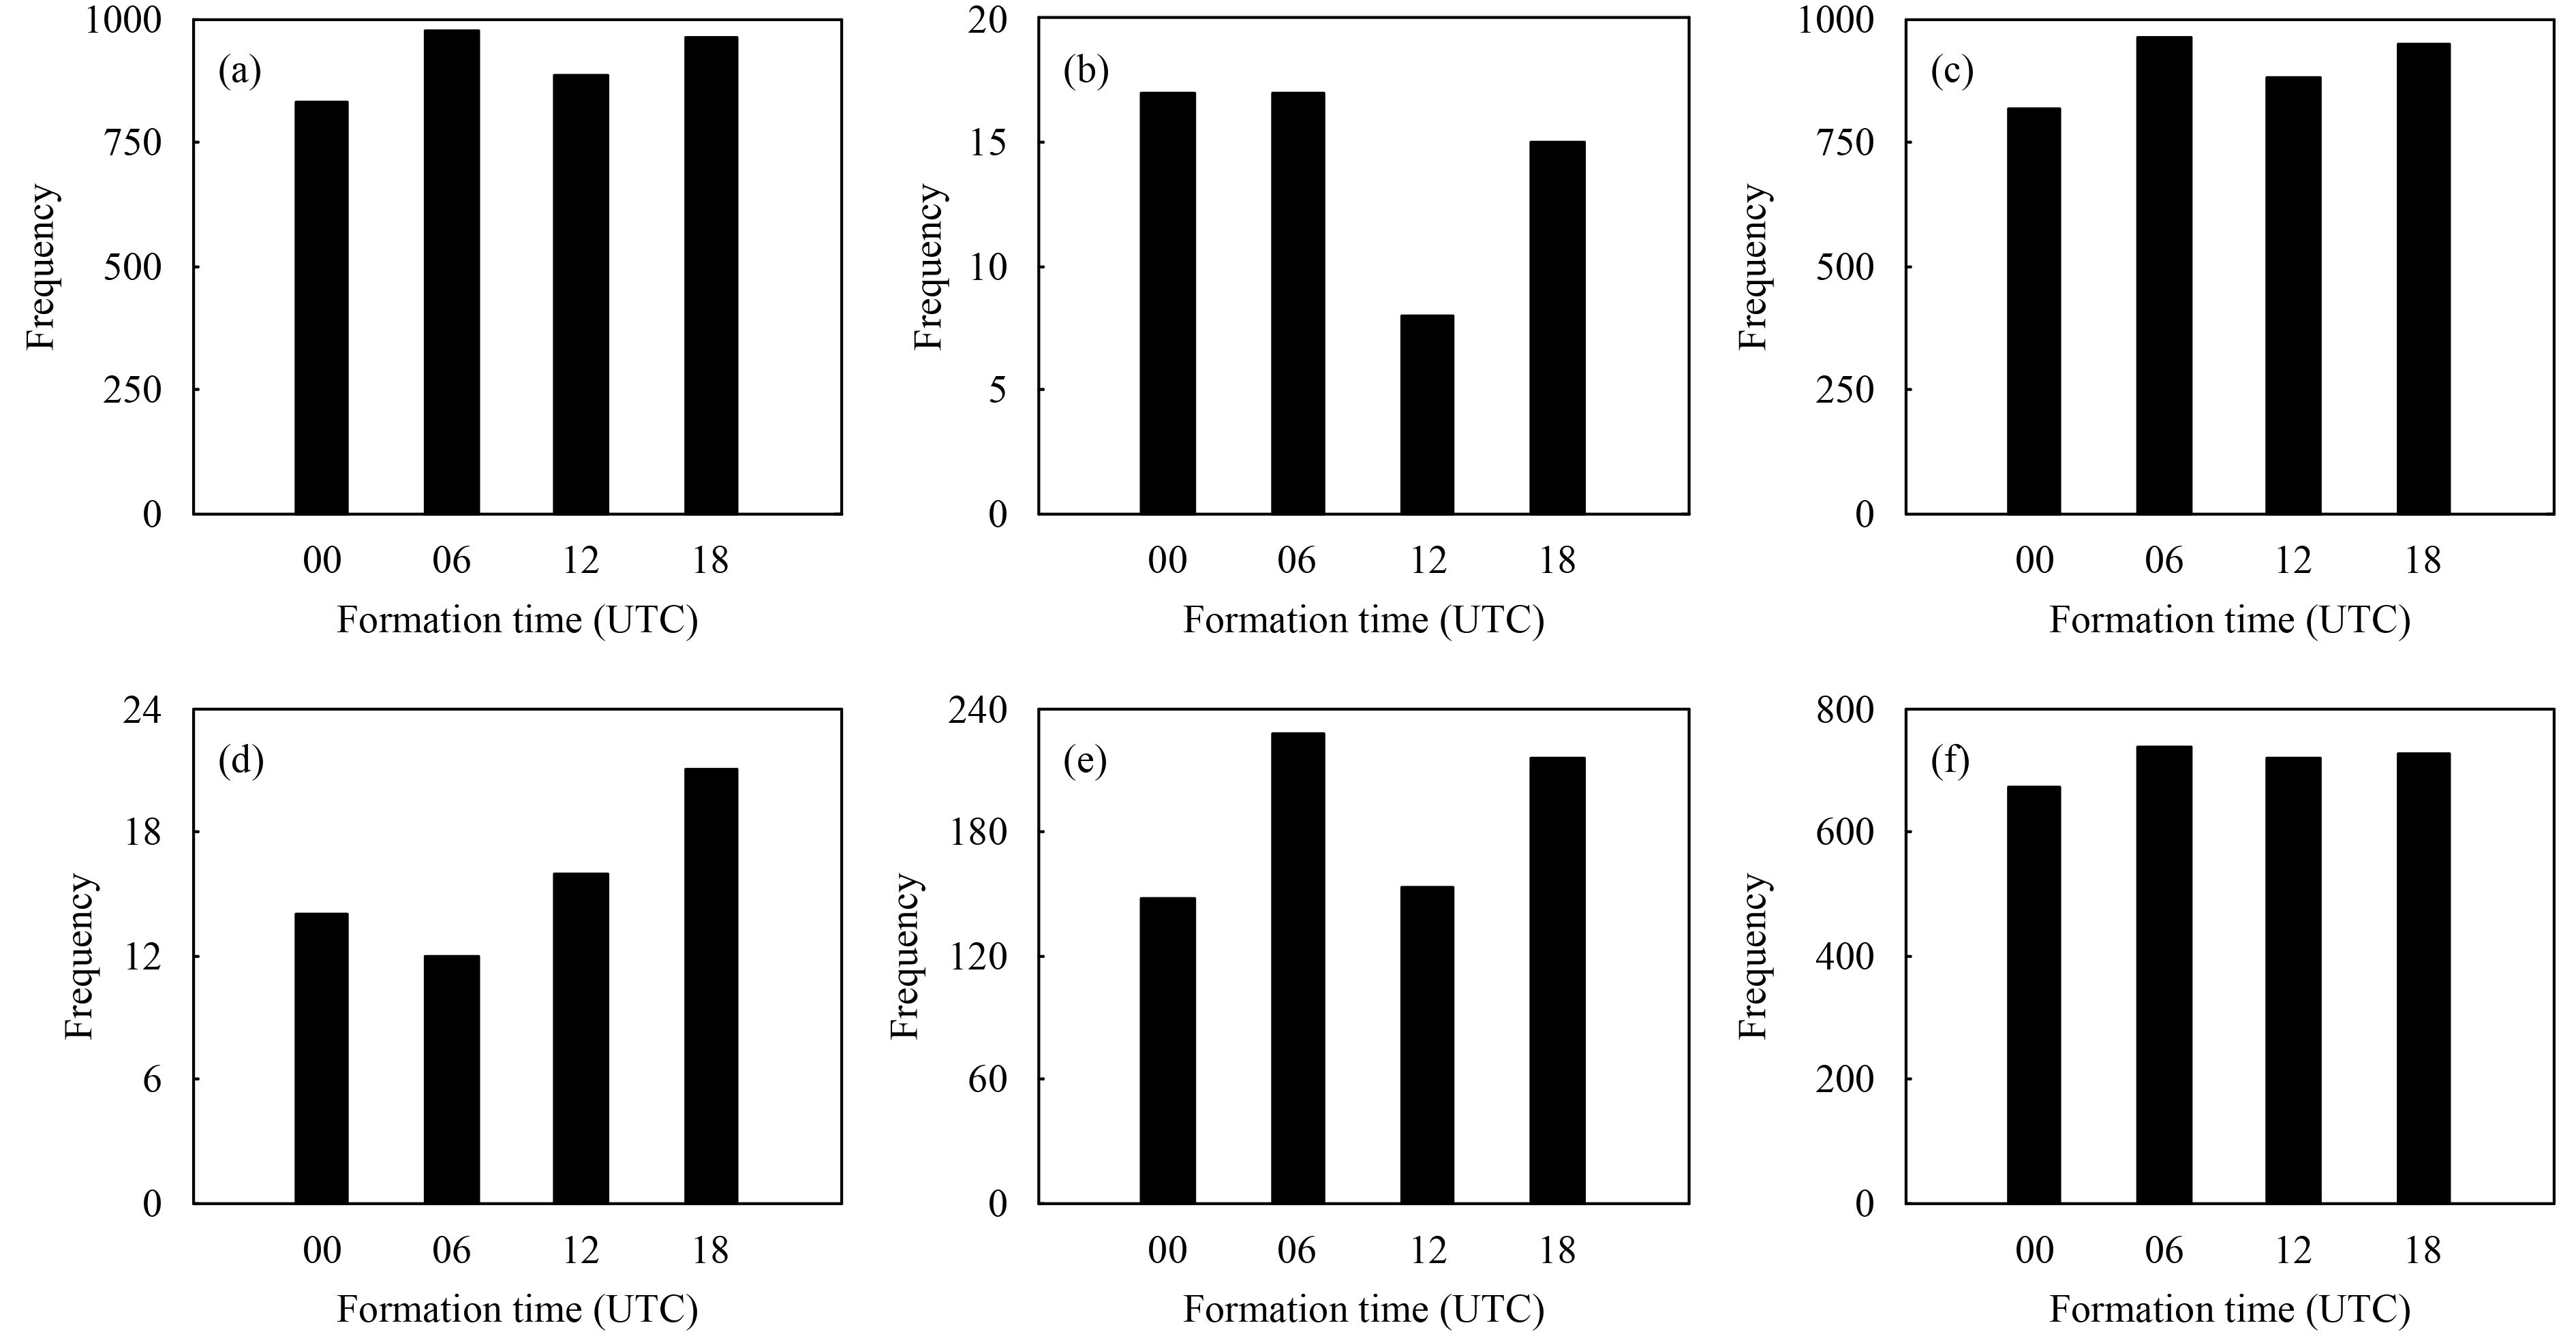
Figure 8a summarizes the formation time of each category of mesoscale vortex and shows that the formation probability of all types of mesoscale vortex is similar in each time interval. The numbers of mesoscale vortices at 0000, 0600, 1200, and 1800 UTC are 833, 977, 887, and 963, respectively. The mesoscale vortices at 0600 and 1800 UTC are relatively active, which means that more mesoscale vortices form in the afternoon and at midnight (local time). As expected, the two peaks correspond to the peaks of MCS formation (Shu et al., 2013). The features of mesoscale vortices without a secondary MCS (Fig. 8c) are similar to those for all mesoscale vortices. Mesoscale vortices with a secondary MCS (Fig. 8b) form in almost equal numbers at 0000, 0600, and 1800 UTC, although fewer form at 1200 UTC (nightfall, local time). Figure 8d shows that MCVs have an obvious diurnal cycle; they tend to form during the night (1800 UTC) and rarely occur in the afternoon (0600 UTC). MDVs have two obvious peaks of formation, i.e., afternoon and midnight, whereas there is no preferred formation time for MSVs.
|
| Figure 8 Distributions of the formation time of mesoscale vortices. The abscissa is the formation time of the mesoscale vortices (UTC). The vertical axis shows the number of vortices. (a) All mesoscale vortices, (b) mesoscale vortices with secondary convection, (c) mesoscale vortices without secondary convection, (d) MCVs, (e) MDVs, and (f) MSVs. |
Figure 9 shows the frequency of mesoscale vortices in each month. Figure 9a shows that the activity of mesoscale vortices peaks in summer. The average number of mesoscale vortices is 397 from May to September and 239 from October to April. This result is in agreement with previous studies. The thermal and dynamic conditions in summer favor convective activities, which will lead to more mesoscale vortices. A comparison between Fig. 9b and Fig. 9c shows that the active season is May to September, irrespective of the presence of a secondary MCS. Mesoscale vortices rarely trigger secondary MCSs in the inactive season. Only nine mesoscale vortices have a secondary MCS from October to April. This result is reasonable because the thermal conditions in cold seasons are not favorable toward convective activity.

|
| Figure 9 Monthly distribution of the frequency of mesoscale vortices. The abscissa shows the month. The vertical axis shows the number of vortices. (a) All mesoscale vortices, (b) mesoscale vortices with secondary convection, (c) mesoscale vortices without secondary convection, (d) MCVs, (e) MDVs, and (f) MSVs. |
Figure 9f shows that the active season for MSVs is from May to September and the monthly number of MSVs during this period is about 344, which is about 2.1 times the average number of MSVs in the inactive season. Moisture is very important in the formation of MSVs. The summer monsoon from the south can provide wet vortices with sufficient moisture and momentum. The potential instability then increases, favoring wet vortices. The monthly activity of MCVs is similar to that of the MSVs, with the active season from May to September. However, MCVs are more active in August and September, with these two months accounting for more than half of the MCV activity. By contrast, the probability of MCV activity is very low from October to March. Figure 9e shows that the active season for MDVs is opposite to that of MCVs. MDVs tend to form in the winter and the active season is from October to March. The winter monsoon from the north brings dry air to mesoscale vortices and the humidity is too low for the formation of wet vortices.
The duration, diurnal cycle, and monthly variation of mesoscale vortices between the 700–800- and 500–600-hPa levels show no obvious difference (figures omitted). Therefore, the temporal evolution of mesoscale vortices is consistent at different levels of the middle and lower troposphere.
4 Summary and conclusionsThis paper has presented a census of mesoscale vortices over China in 2015 based on the ERA-interim dataset and satellite data. A total of 3660 mesoscale vortices were found within 500–600 hPa, including 63 MCVs, 745 MDVs, and 2852 MSVs. A detailed statistical analysis of the mesoscale vortices was carried out and the main conclusions are as follows.
(1) The size, intensity, and duration of mesoscale vortices are closely related. More intense mesoscale vortices have a larger radius and longer duration. On average, MCVs have the greatest intensity, size, and duration, whereas MDVs have the smallest. Mesoscale vortices that can trigger new convection have a larger size and longer duration.
(2) MCVs occur in any direction of the parent MCS and tend to form at a distance between one and two intervals of longitude. Secondary convection tends to appear to the southeast of the parent MCV and the south of the parent MSV. MDVs rarely trigger new MCSs.
(3) Mesoscale vortices tend to generate in the area of transition from high to low altitudes. The downward flow caused by a change in elevation favors the formation of mesoscale vortices. MSVs and MCVs tend to form in areas with sufficient moisture, whereas MDVs usually form in areas without sufficient moisture. The leeward side of the Tibetan Plateau is the main source region for mesoscale vortices in China.
(4) MCVs have the longest duration, MSV the second longest duration, and MDVs the shortest duration. Water vapor plays an important part in the evolution of mesoscale vortices. The phase change of water vapor or latent heating increases the duration of mesoscale vortices.
(5) MCVs tend to form during the night and seldom occur in the afternoon. MDVs have two obvious peaks of formation in the afternoon and at midnight.
(6) MCV and MSV activities peak in summer, whereas the active season of MDVs is winter.
Based on this census, we compared the statistical characteristics of the different categories of mesoscale vortex. Our results have deepened our insight into mesoscale vortices and improved our rainstorm forecasting skills. These statistics for mesoscale vortices provide other researchers with a base for the further statistical analysis or numerical simulation of mesoscale vortices. However, the time span is a little too short and the basic characteristics lack meaning in terms of the climate. These weakness need to be improved in the future.
| Bartels, D. L., and R. A. Maddox, 1991: Midlevel cyclonic vortices generated by mesoscale convective systems. Mon. Wea. Rev., 119, 104–118. DOI:10.1175/1520-0493(1991)119<0104:MCVGBM>2.0.CO;2 |
| Chen, L. S., and Z. X. Luo, 2004: Interaction of typhoon and mesoscale vortex. Adv. Atmos. Sci., 21, 515–528. DOI:10.1007/BF02915719 |
| Chen, S. S., and W. M. Frank, 1993: A numerical study of the genesis of extratropical convective mesovortices. PartⅠ: Evolution and dynamics. J. Atmos. Sci., 50, 2401–2426. DOI:10.1175/1520-0469(1993)050<2401:ANSOTG>2.0.CO;2 |
| Chen, Z. M., W. B. Min, and C. G. Cui, 2007: Diagnostic analysis on the formation and development of mesoscale vortex systems. Torrential Rain and Disasters, 26, 29–34. |
| Cheng, L. S., and W. H. Feng, 2001: Analyses and numerical simulation on an abrupt heavy rainfall and structure of a mesoscale vortex during July 1998. Chinese J. Atmos. Sci., 25, 465–478. |
| Davis, C. A., and S. B. Trier, 2007: Mesoscale convective vortices observed during BAMEX. Part I: Kinematic and thermodynamic structure. Mon. Wea. Rev., 135, 2029–2049. DOI:10.1175/MWR3398.1 |
| Davis, A., and J. Galarneau Jr C., 2009: The vertical structure of mesoscale convective vortices. J. Atmos. Sci., 66, 686–704. DOI:10.1175/2008JAS2819.1 |
| Davis, C. A., D. A. Ahijevych, and S. B. Trier, 2002: Detection and prediction of warm season mid-tropospheric vortices by the rapid update cycle. Mon. Wea. Rev., 130, 24–42. DOI:10.1175/1520-0493(2002)130<0024:DAPOWS>2.0.CO;2 |
| Dong, G. H., S. Q. Han, Y. W. Liu, et al., 2013: Characteristic analysis on the mesoscale vortex system of an excessive heavy rain event. Torrential Rain and Disasters, 32, 97–104. |
| Fritsch, J. M., J. D. Murphy, and J. S. Kain, 1994: Warm core vortex amplification over land. J. Atmos. Sci., 51, 1780–1807. DOI:10.1175/1520-0469(1994)051<1780:WCVAOL>2.0.CO;2 |
| Ge, J. J., W. Zhong, and H. C. Lu, 2011: A diagnostic analysis of vorticity-divergence effects and the quasi-balanced flow in a mesoscale vortex during the process of flash-flood-producing rainstorm. Acta Meteor. Sinica, 69, 277–288. |
| Kuo, H.-C., R. T. Williams, J.-H. Chen, et al., 2001: Topographic effects on barotropic vortex motion: No mean flow. J. Atmos. Sci., 58, 1310–1327. DOI:10.1175/1520-0469(2001)058<1310:TEOBVM>2.0.CO;2 |
| Lai, H.-W., C. A. Davis, and B. J.-D. Jou, 2011: A subtropical Oceanic mesoscale convective vortex observed during SoWMEX/TiMREX. Mon. Wea. Rev., 139, 2367–2385. DOI:10.1175/2010MWR3411.1 |
| Lu, H. C., W. Cheng, M. Zhu, et al., 2002: Mechanism study meso-β scale vortex system of heavy rain in Meiyu front. J. PLA Univ. Sci. Technol., 3, 70–76. |
| Luo, Z. X., Z. A. Sun, and F. Ping, 2011: Statistical characteristics of mesoscale vortex effects on the track of a tropical cyclone. Chinese Phys. B, 20, 049201. DOI:10.1088/1674-1056/20/4/049201 |
| Ma, Y., X. Wang, and Z. Y. Tao, 1997: Geographic distribution and life cycle of mesoscale convective system in China and its vicinity. Prog. Nat. Sci., 7, 701–706. |
| Raymond, D. J., and H. Jiang, 1990: A theory for long-lived mesoscale convective systems. J. Atmos. Sci., 47, 3067–3077. DOI:10.1175/1520-0469(1990)047<3067:ATFLLM>2.0.CO;2 |
| Rogers, R. F., and J. M. Fritsch, 2001: Surface cyclogenesis from convectively driven amplification of midlevel mesoscale convective vortices. Mon. Wea. Rev., 129, 605–637. DOI:10.1175/1520-0493(2001)129<0605:SCFCDA>2.0.CO;2 |
| Shu, Y., and Y. N. Pan, 2010: Self-identification of mesoscale convective system from satellite infrared imagery. Journal of Nanjing University (Natural Sciences), 46, 337–348. |
| Shu, Y., Y. N. Pan, and J. X. Wang, 2013: Diurnal variation of MCSs over Asia and the western Pacific region. Acta Meteor. Sinica, 27, 435–445. DOI:10.1007/s13351-013-0305-6 |
| Sun, J. H., X. L. Zhang, L. L. Qi, et al., 2004: A study of vortex and its mesoscale convective system during China heavy rainfall experiment and study in 2002. Chinese J. Atmos. Sci., 28, 675–691. |
| Sun, J. H., S. X. Zhao, G. K. Xu, et al., 2010: Study on a mesoscale convective vortex causing heavy rainfall during the Meiyu season in 2003. Adv. Atmos. Sci., 27, 1193–1209. DOI:10.1007/s00376-009-9156-6 |
| Tao, Z. Y., H. Q. Wang, X. Wang, et al., 1998: A survey of meso-α-scale convective systems over China during 1995. Acta Meteor. Sinica, 56, 166–177. |
| Trier, S. B., and C. A. Davis, 2007: Mesoscale convective vortices observed during BAMEX. Part Ⅱ: Influences on secondary deep convection. Mon. Wea. Rev., 135, 2051–2075. DOI:10.1175/MWR3399.1 |
| Xie, Y. B., 1978: Dynamical issues on moist baroclinic atmosphere. Heavy Rain Research Papers Collection. Jilin People’s Press, Changchun, 1–15. (in Chinese) |
| Xie, Y. B., 1984: Observational and theoretical studies of the moist baroclinic atmosphere. Adv. Atmos. Sci., 1, 141–149. DOI:10.1007/BF02678127 |
| Zhang, Y. C., J. H. Sun, G. K. Xu, et al., 2013: Analysis on the structure of two mesoscale convective vortices over the Yangtze–Huai River basin. Climatic Environ. Res., 18, 271–287. |
| Zhong, R., L.-H. Zhong, L.-J. Hua, et al., 2014: A climatology of the southwest vortex during 1979–2008. Atmos. Oceanic Sci. Lett., 7, 577–583. DOI:10.1080/16742834.2014.11447227 |
 2017, Vol. 31


