The Chinese Meteorological Society
Article Information
- WANG, Xuezhong, Banghui HU, Hong HUANG, et al., 2017.
- Error Inhomogeneity in the Computation of Spherical Mean Displacement. 2017.
- J. Meteor. Res., 31(6): 1133-1148
- http://dx.doi.org/10.1007/s13351-017-6848-1
Article History
- Received April 28, 2016
- in final form September 5, 2017
2. School of Atmospheric Science and Key Laboratory of Mesoscale Severe Weather of Ministry of Education, Nanjing University, Nanjing 210093;
3. Key Laboratory of Meteorological Disaster of Ministry of Education, Nanjing University of Information Science & Technology, Nanjing 210044
The atmosphere is constantly in motion and the computation of the displacement of an air particle is important in both trajectory analysis and the designation of numerical models. The Lagrangian approach was developed to trace the motion of air flow by following a fluid parcel as it moves with the flow (Bowman et al., 2013). The fluid parcel can be either air or seawater (van Sebille et al., 2014; Qin et al., 2015). The four-dimensional trajectory of the fluid parcel represents the temporal and spatial motion of the fluid. Passive tracers that are carried by and/or dispersed with the fluid parcels have also received the attention of researchers. These tracers may be radioactive pollution (Stohl et al., 2012; Fei et al., 2014), volcanic ash (Webster et al., 2012), CO2 emissions (Trusilova et al., 2010), dust (Guo et al., 2013; Notaro et al., 2013), vapor (Zhang and Li, 2014; Li and Dolman, 2016) or ozone in the atmosphere, or tracers (Smith et al., 2016) and drifters (Shchekinova et al., 2016) in the ocean.
The meridional–zonal resultant displacement method (MRDM) is the simplest computation model used in trajectory studies. Bowman et al. (2013) reviewed six trajectory models. Of these models, only the Stochastic Time-Inverted Lagrangian Transport Model (STILT; Lin et al., 2003) is designed for the regional domain and the other models—including the Flexible Particle Dispersion Model (FLEXPART; Stohl et al., 2005), the Hybrid Single Particle Lagrangian Integrated Trajectory Model (HYSPLIT; Draxler and Hess, 1997, 1998; Draxler, 1999), the Lagrangian Analysis Tool Trajectory Model (LAGRANTO; Wernli and Davies, 1997), the Next-Generation Atmospheric Dispersion Model (NAME; Jones et al., 2007), and the Three-Dimensional Trajectory Model (TRAJ3D; Bowman, 1993; Bowman and Carrie, 2002)—have been developed for both the regional and global domains. The MRDM model in spherical coordinates is a convenient selection with which to investigate the trajectories of fluid particles in middle and lower latitudes. In such a coordinate, the latitude circles have a large curvature and the longitude lines are convergent at high latitudes.
It is essential to compute the mean displacement of fluid particles accurately when their motion trajectories are traced. The MRDM model is a traditional method of computing the arrival position of an air particle on a sphere. An air particle without meridional motion will move in a curvilinear manner rather than along a straight line if its displacement at high latitudes is examined by the MRDM. This motion is completely different from Newtonian inertial motion, in which a particle physically moves along a straight line. Similar problems arise when the mean displacement is solved under curved grid coordinates. To solve this polar singularity problem, a plane tangent to the sphere at the pole measured from the map projection is used (Harris and Kahl, 1994) and an exact latitude spacing within 0.25° of the pole has been proposed (Draxler and Hess, 1997).
The sources of error in trajectory models have been investigated by a number of researchers. Stohl (1998) reviewed the Lagrangian trajectory model in terms of the calculation method, precision, and application. The trajectory error varies between examples and a position error of 20% of the travel distance is considered to be typical, limiting the general applicability of the calculated trajectories; errors of the order of 30% are typical of the forecast trajectories. In general, the accuracy of the trajectory computation had been steadily increasing. Bowman et al. (2013) suggested that the input data for trajectory model will affect the accuracy of the model. One of the requirements is for an increased output frequency to match the continuing increase in spatial resolution. This is because the accuracy is highly dependent on the time interval: changing the wind sampling interval from 3 to 1 h reduces the error by about one order of magnitude (Bowman et al., 2013, their Fig. 1). Because the truncation errors from an approximate scheme to solve the particle’s new position are generally small (Bowman et al., 2013), the dominant errors in the trajectory calculations typically arise from errors in the wind velocities themselves or from the limited spatial and temporal resolution of the gridded wind fields (Stohl et al., 2001).
Costa and Blanke (2004) assessed the trajectory errors in the North Atlantic Ocean current and found that the errors increased roughly linearly with the travel time. As a general rule, three-dimensional trajectories limited the trajectory errors and neglecting the vertical velocity component yielded results with unacceptably large errors of about 40% or more of the travel distance. In this case, the vertical shear of the horizontal velocity was the dominant cause of deviations in the horizontal trajectory. Riddle et al. (2006) reviewed many studies and reported errors between 2% and 30% of the total trajectory length for trajectories between several hours and several days in duration. During the International Consortium for Atmospheric Research on Transport and Transformation 2004 campaign, the mean trajectory errors for the balloon trajectory over 2 and 12 h were about 26% and 34% of the flight distance for ECMWF-based and GFS-based trajectories, respectively. An important feature of using balloons is that they allow horizontal trajectory errors to be isolated from the more complex problem of accurately determining the vertical trajectory motion because they do not follow the vertical motion of air. Thus, the two trajectory error percentages given here can be regarded as errors relative to the horizontal trajectory.
The displacement of air particles is also important in numerical semi-Lagrangian schemes for the computation of the departure position of the fluid particle (e.g., Bates et al., 1990; Ritchie and Beaudoin, 1994; Melvin et al., 2010). Many researchers have used rotation matrices to compute the departure position (e.g., Temperton et al., 2001; Staniforth et al., 2010; Wood et al., 2010). As reviewed by Wood et al. (2010), most of these methods are applied in scenarios assuming a shallow atmosphere, although Staniforth et al. (2010) and Wood et al. (2010) achieved a uniform departure point scheme for the assumption of a deep atmosphere.
A general routine to compute the departure point has been designed that uses iterative methods and two- or three-time level schemes (e.g., Temperton et al., 2001; Staniforth et al., 2010; Wood et al., 2010). The procedure is similar to each iterative step and the estimated departure point and mean velocity of displacement tend to be more accurate with each step of the iteration. The accuracy of the iteration is thought to depend on the accuracy of each step within the iterative circle. If only one iterative step is considered, then the circling procedure is simplified to a one-step problem to isolate the impact of other sources—for example, in the MRDM and great circle displacement computing method (GCDM), the initial wind might be considered as a one-step wind during the iteration in which the wind gives more accurate trajectory as iterative step amount increases. The “error” in the MRDM seen by the GCDM is the difference between them, which is not the real error. We evaluated the error inhomogeneity of the MRDM with the GCDM in non-iterative examples and then compared the performance of the MRDM and GCDM using the trajectories of Temperton et al. (2001) as the “real” reference trajectories.
This paper is arranged as follows. In Section 2, the GCDM is deduced through geometric relations and the evaluation elements are introduced. Section 3 presents the non-iterative case, wherein the mean displacement inhomogeneity of the MRDM is accessed through the GCDM with the NCEP/NCAR long-term mean monthly wind fields (Kalnay et al., 1996) and idealized wind fields. In Section 4, the iterative versions of the MRDM and GCDM are compared based on the “real” trajectories from a three-time level trajectory scheme (see Temperton et al., 2001, their appendix). The discussion and conclusions are presented in Section 5.
2 Deduction of the GCDM and evaluation elements 2.1 Deduction of GCDMUnder the approximation of a shallow atmosphere, assuming that an air particle moves above the spherical surface at a one-step speed of
| (1) |
where λ, φ, and h are the longitude, latitude, and height above mean surface sea level and u, v, and w are the zonal, meridional, and vertical components of air velocity, respectively, and R, the distance from A to the center of the earth, is the summation of the radius of the earth and h1.
The GCDM assumes that the air particle moves horizontally along the great circle that is tangential to its horizontal wind velocity vectors at the departure position and that the arc length between the departure and arrival positions is equal to the mean displacement defined by the product of the horizontal wind speed of the departure position and lapse time. The coordinates of A are transformed from spherical to rectangular coordinates with the origin point at the center of the earth, the z-axis along the axis of the earth through the North Pole, and the x-axis along the radius with λ = 0, φ = 0 pointing away from the earth. The position A in the rectangular coordinate
| (2) |
Each spherical velocity component causes a displacement along the three directions of the rectangular coordinate.
| (3) |
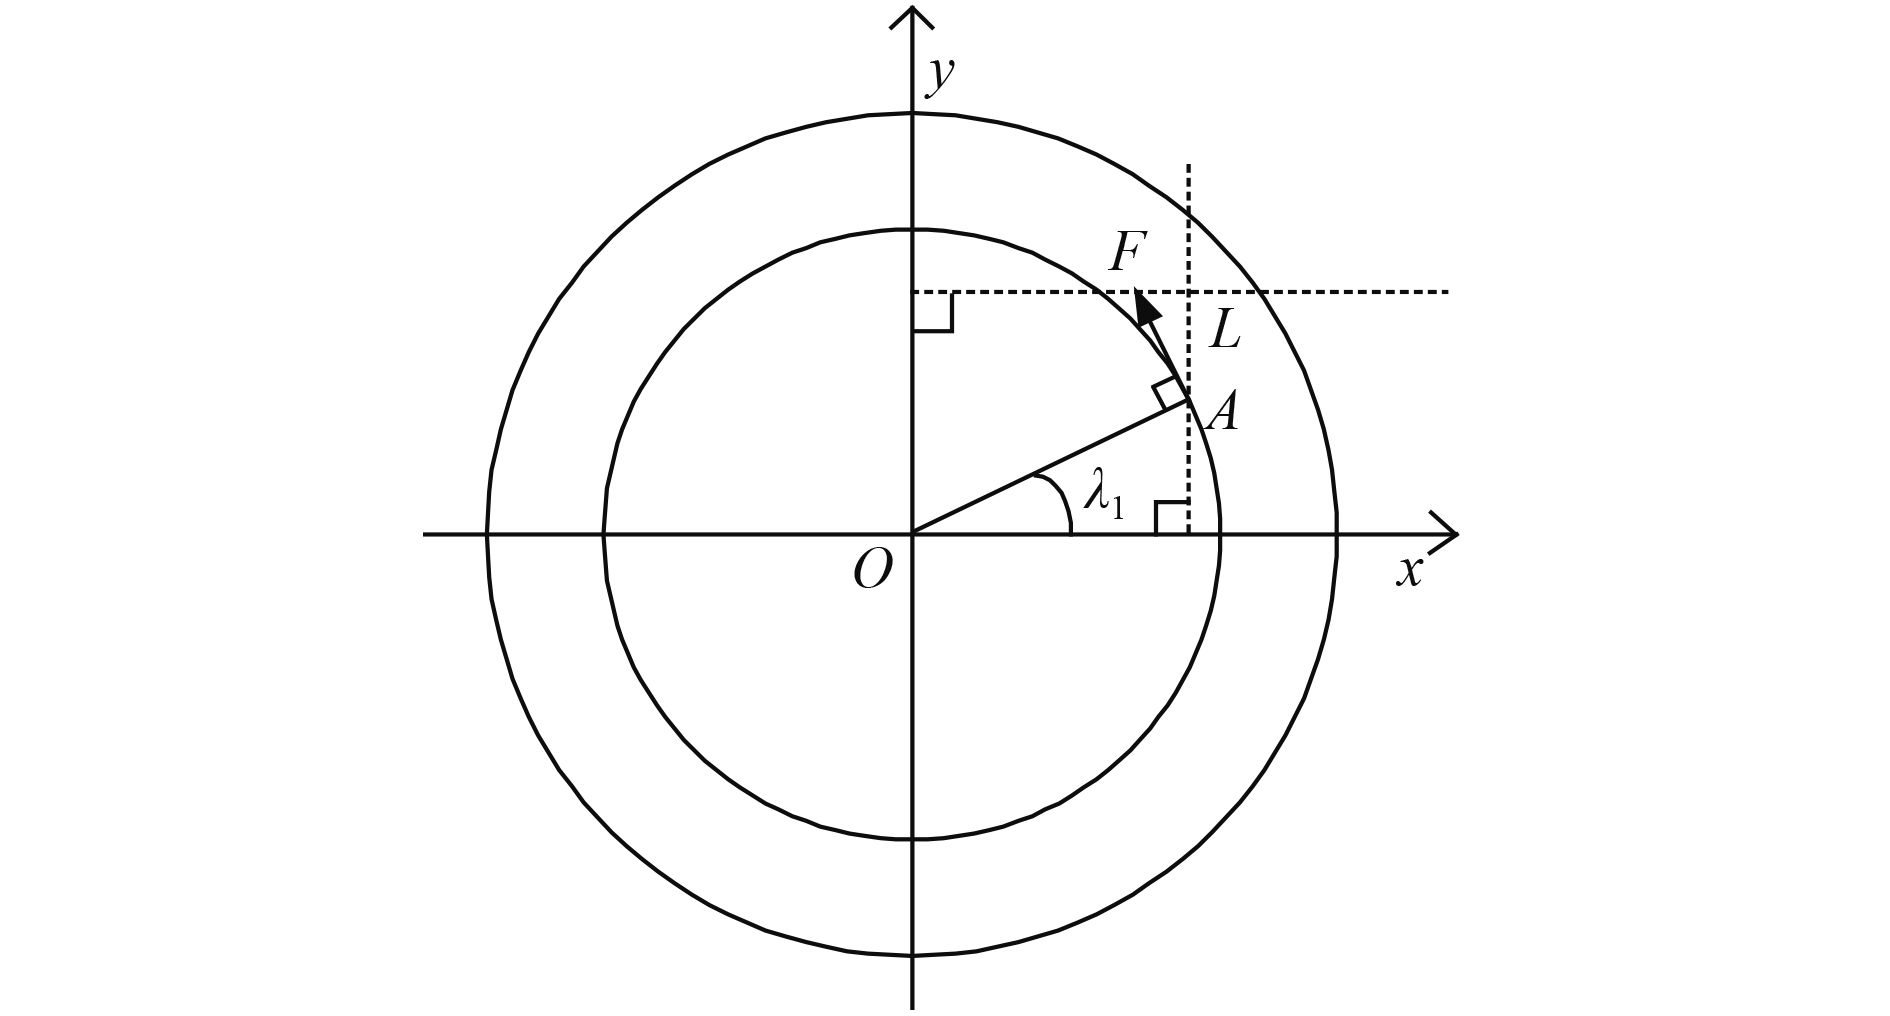
We first considered the contribution of the zonal wind to the rectangular displacement. Figure 1 is a sketch map of the latitude circle plane in spherical coordinates. The plane is parallel to the x–y plane in rectangular coordinates. The zonal wind
| (4) |
| (5) |
| (6) |
|
| Figure 1 An air particle’s zonal motion on the latitude circle plane. |
The contributions of the meridional wind were investigated in a similar manner. Figure 2 is a sketch map of a longitude great circle. The meridional wind
| (7) |
| (8) |
| (9) |
The contribution of the vertical velocity w can also be demonstrated in Fig. 2.
| (10) |
| (11) |
| (12) |

|
| Figure 2 Meridional and vertical motion of an air particle on the longitude great circle plane. |
According to Eq. (3) and Eqs. (4)–(12), the displacements in the rectangular coordinate are:
| (13) |
| (14) |
| (15) |
Equations (13)–(15) are consistent with the unit vector forms of Ritchie and Beaudoin (1994). These equations satisfy the relationship for displacement, velocity, and lapse time as follows:
| (16) |
If the air particle is traveling along a straight line, then its arrival position B in the rectangular coordinate can be expressed as:
| (17) |
The rectangular coordinate has been temporarily introduced to calculate the arrival position. Position B is then further transformed back to the spherical coordinate using the inverse relation of Eq. (2). If the radius of B is:
| (18) |
then the arrival position of
| (19) |
| (20) |
| (21) |
Equations (19)–(21) are the analytical mathematical solution of the arrival position of the air particle after a straight line displacement. The vertical height of the air particle, as shown in Eqs. (18) and (19), is determined by the vertical speed (w) and the horizontal speeds (u, v). The vertical displacement caused by the horizontal movement is large. It is estimated that a horizontal movement at the equator of 2.5° causes about 6 km of vertical displacement. If this were true, then the air particles at high levels in the troposphere would all penetrate the tropopause. This scenario is never observed and is inconsistent with the horizontal movement characteristics of the atmosphere. In the traditional MRDM, Eq. (1) shows that the horizontal motion of the air particle has the following features: when the air particle is anywhere on the earth apart from the polar points with u = 0 or along the equator with v = 0, it moves along a great circle with its distance of movement equal to the length of the arc instead of the tangent line of the great circle. The displacement along the great circle is more reasonable than the displacement along a tangent. Therefore, the displacement is corrected to the great circle displacement. As a first step, following the treatment of the MRDM in Eq. (1), the vertical height is determined by the vertical speed only:
| (22) |
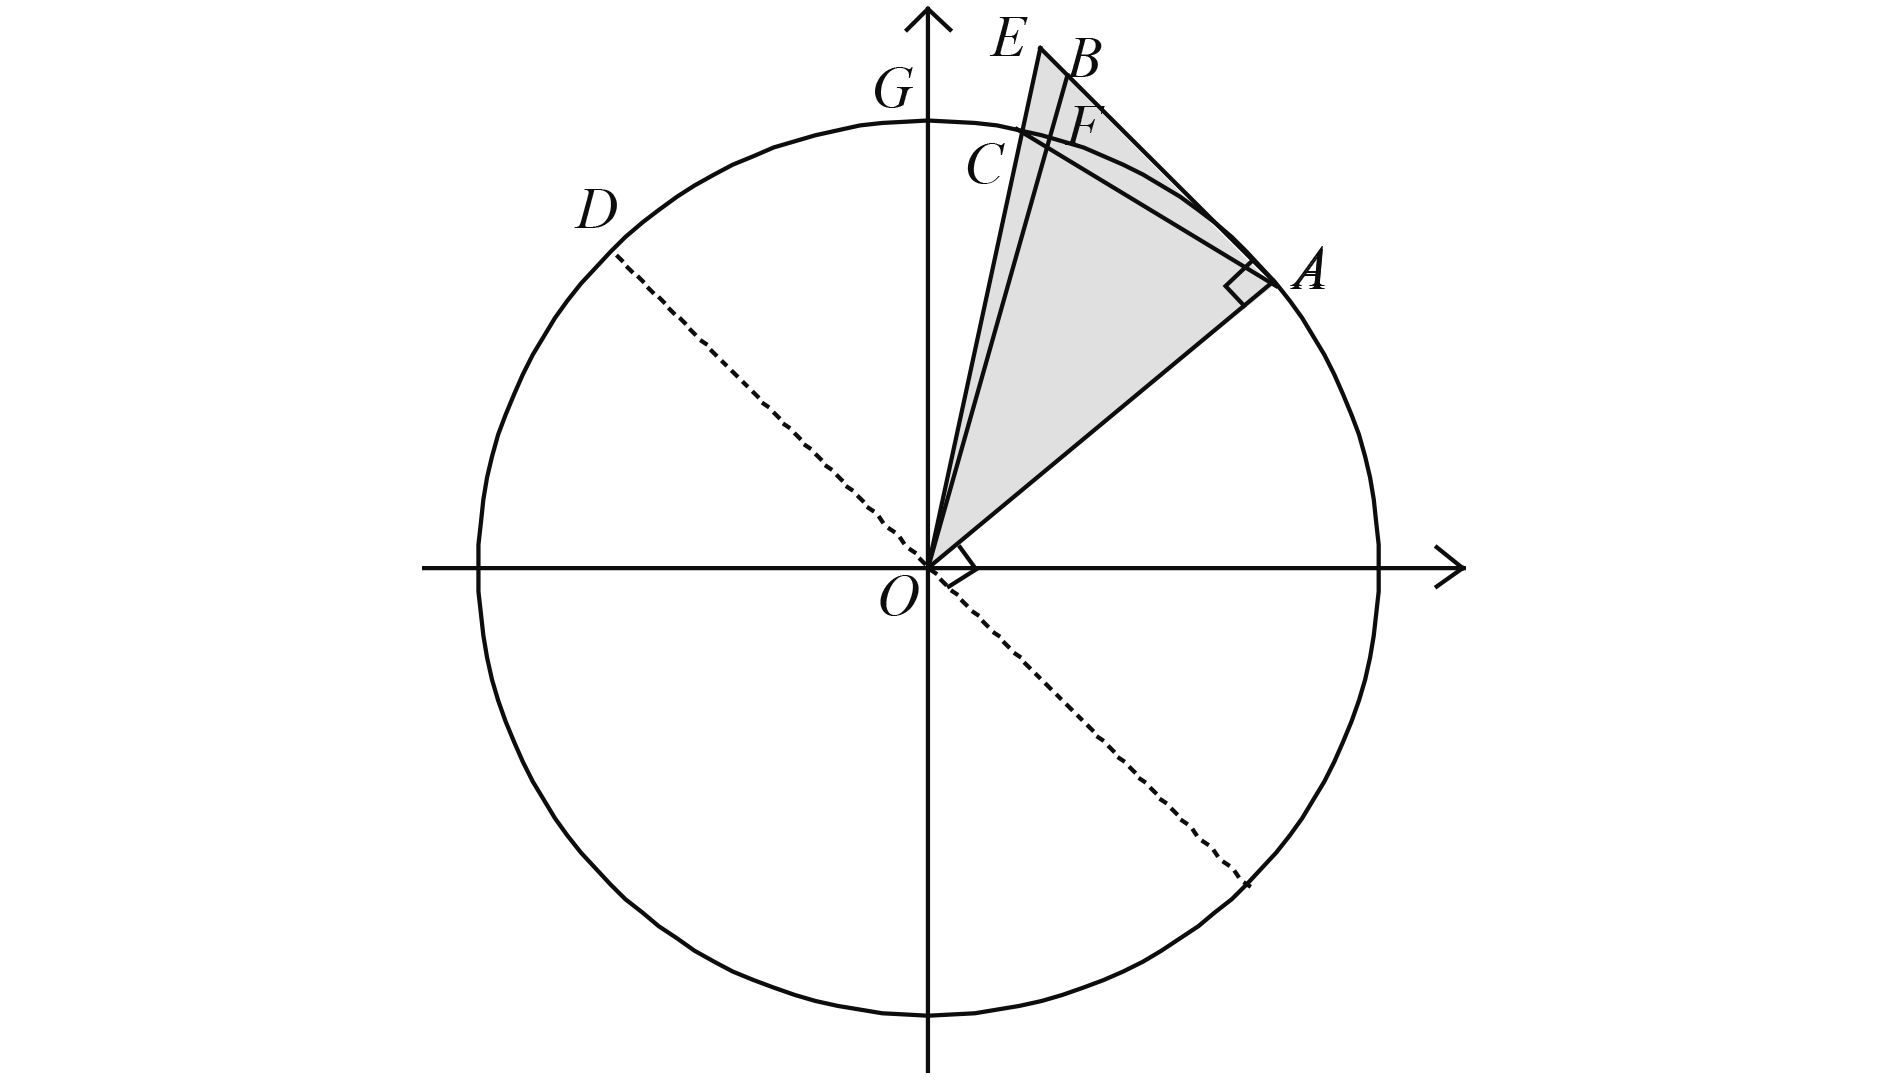
The horizontal displacement is then corrected from the tangent line length to the arc length and the arrival position in the GCDM is corrected. Figure 3 is a sketch map of the great circle tangential to the horizontal velocity vector. The great circle is OAG; A is the departure point, and B is the arrival point,
| (23) |
The following relation is shown in Fig. 3 (the key triangle is shaded gray), i.e.,
| (24) |
The coefficient of Eq. (24) has a limitation,
|
| Figure 3 An air particle moving on the plane of a great circle. |
Thus, the GCDM is deduced. The straight line displacements in the rectangular coordinate are computed with Eqs. (13)–(15). The displacements are then corrected to the arc length definition using Eq. (24). The arrival position in rectangular coordinates is successively computed by adding the corrected displacements to the departure position through Eq. (17). The coordinates of the arrival position are then transformed back to spherical coordinates, the horizontal positions of which are calculated by using Eqs. (18), (20), and (21) and the vertical height is obtained from Eq. (22).
2.2 Evaluation elements of the MRDMThe contribution of vertical winds to horizontal displacement is negligible in the one-step computation of trajectories. Under the approximation of a shallow atmosphere, the movement of an air particle from A to Bmay be separated into two steps: first, horizontal movement from points A to M, then vertical movement from points M to B. The ratio of the horizontal displacement caused by the vertical speed of the particle equals the ratio between the vertical displacement and the distance to the center of the earth with a ceiling value of 1/300. However, if each step of the computation is the same, then it is unclear why the three-dimensional wind field causes such a large change in the trajectory. The reason is that the vertical wind transports the air particle to the position of the new horizontal wind, i.e., the vertical shear of the horizontal wind is an essential factor in the trajectory (Costa and Blanke, 2004). Thus, assuming that the air particle moves horizontally along the earth’s surface, i.e., w = 0, h1 = 0, then the departure position is
| (25) |
where m = 2 and 3, respectively. Correspondingly, the magnitude of the displacement error is defined as:
| (26) |
Using Eq. (2), three positions of the air particle are transformed to rectangular coordinates, i.e.,
| (27) |
In this equation, if
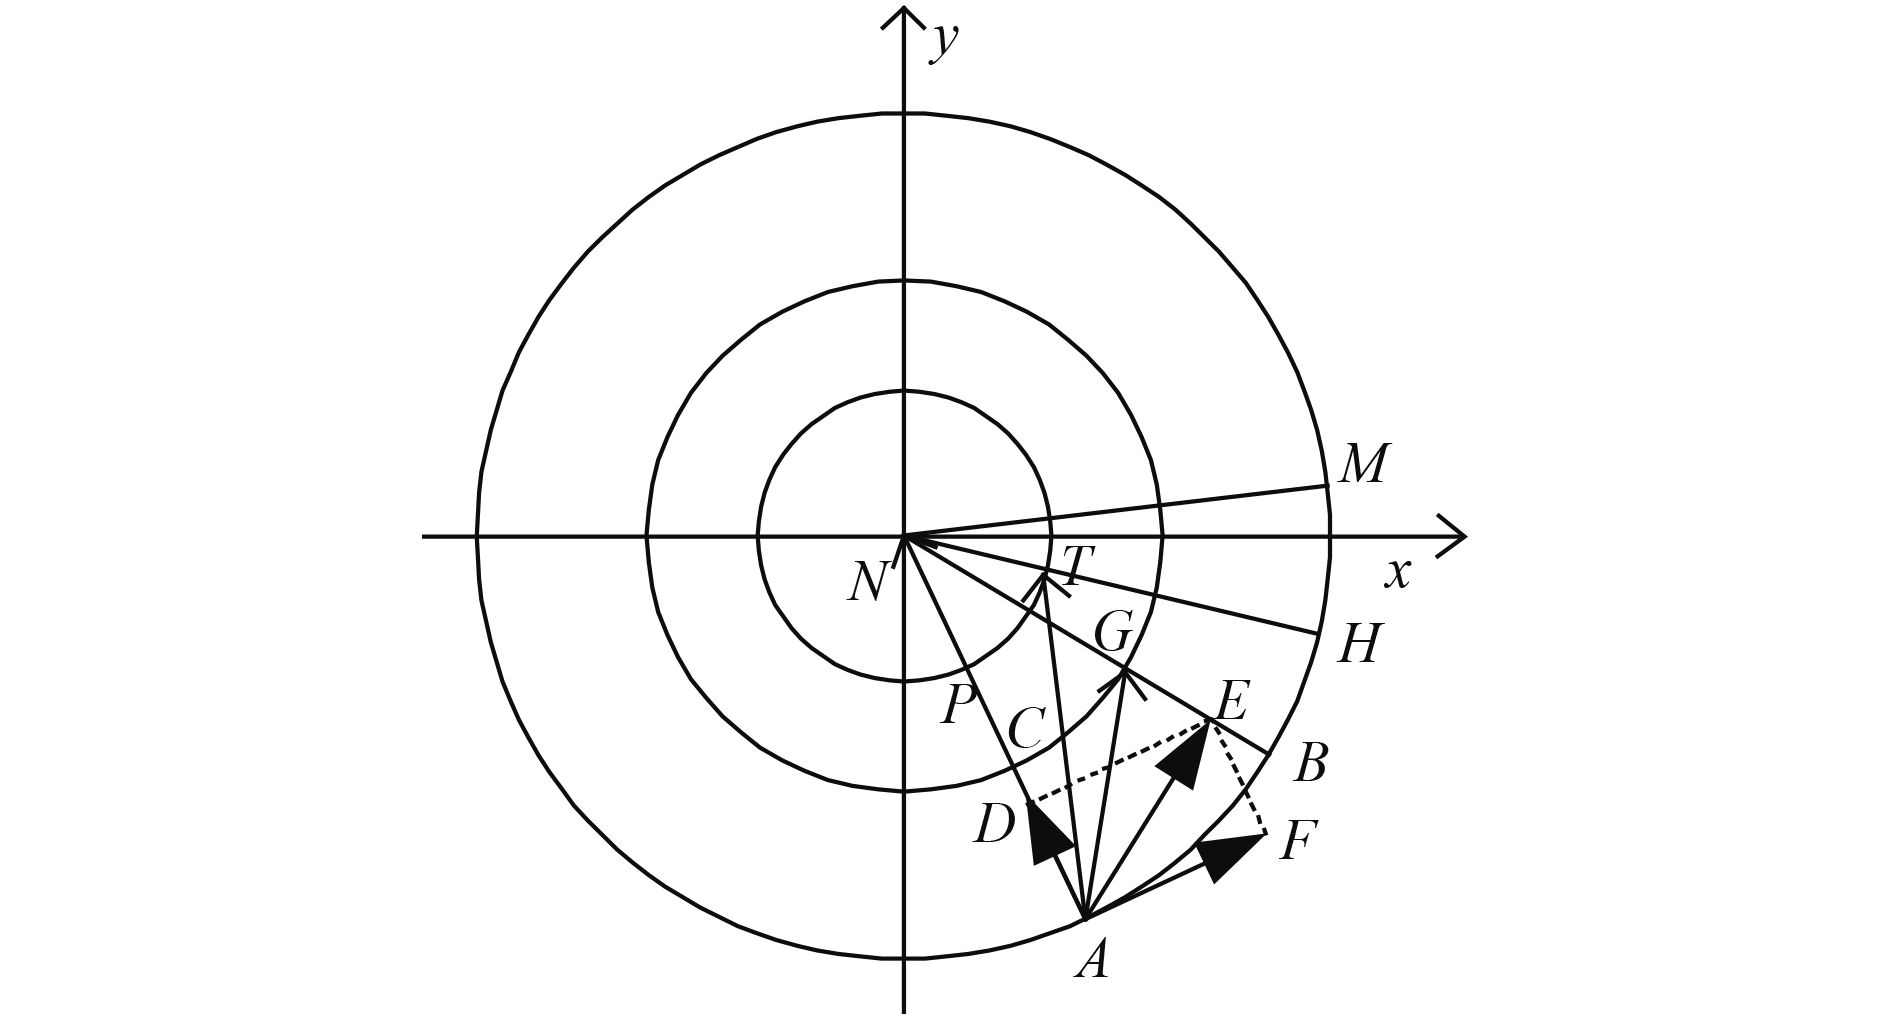
The geometrical image of the displacement errors and difference in angle are shown in Fig. 4, where N is the North Pole, x–y are lines of longitude and the concentric circles are circles of latitude. The departure point for the air particle is A. The horizontal velocity vector is
|
| Figure 4 Motion of an air particle under MRDM physics. |
To give a notional result, three parameters were set as constant in the following computations: w = 0 m s–1, h1 = 0 m, and R = 6370 km at each grid point.
3 Evaluation of MRDM: Non-iterative caseIn Section 2, Eq. (16) shows that when the air particle moves along the tangent line of a great circle, its physical progress satisfies the velocity–time–displacement relation. Equation (24) indicates that when the ratio between the displacement of the air particle and the radius of the earth is small, then the GCDM generally satisfies the relation. Because the mean horizontal displacement between the departure and arrival positions is assumed to be equal to the real displacement defined by the velocity multiplied by the lapse time in the deduction of the GCDM, the displacement computed through the GCDM is accurate in theory and its displacement error is only a computational error. However, the displacement computed through the MRDM has both analytical and computational errors (Fig. 4). In the following discussion, the MRDM is evaluated in terms of the distance error [Eq. (26)] and the angle difference [Eq. (27)] using long-term monthly mean wind field and ideal wind field datasets.
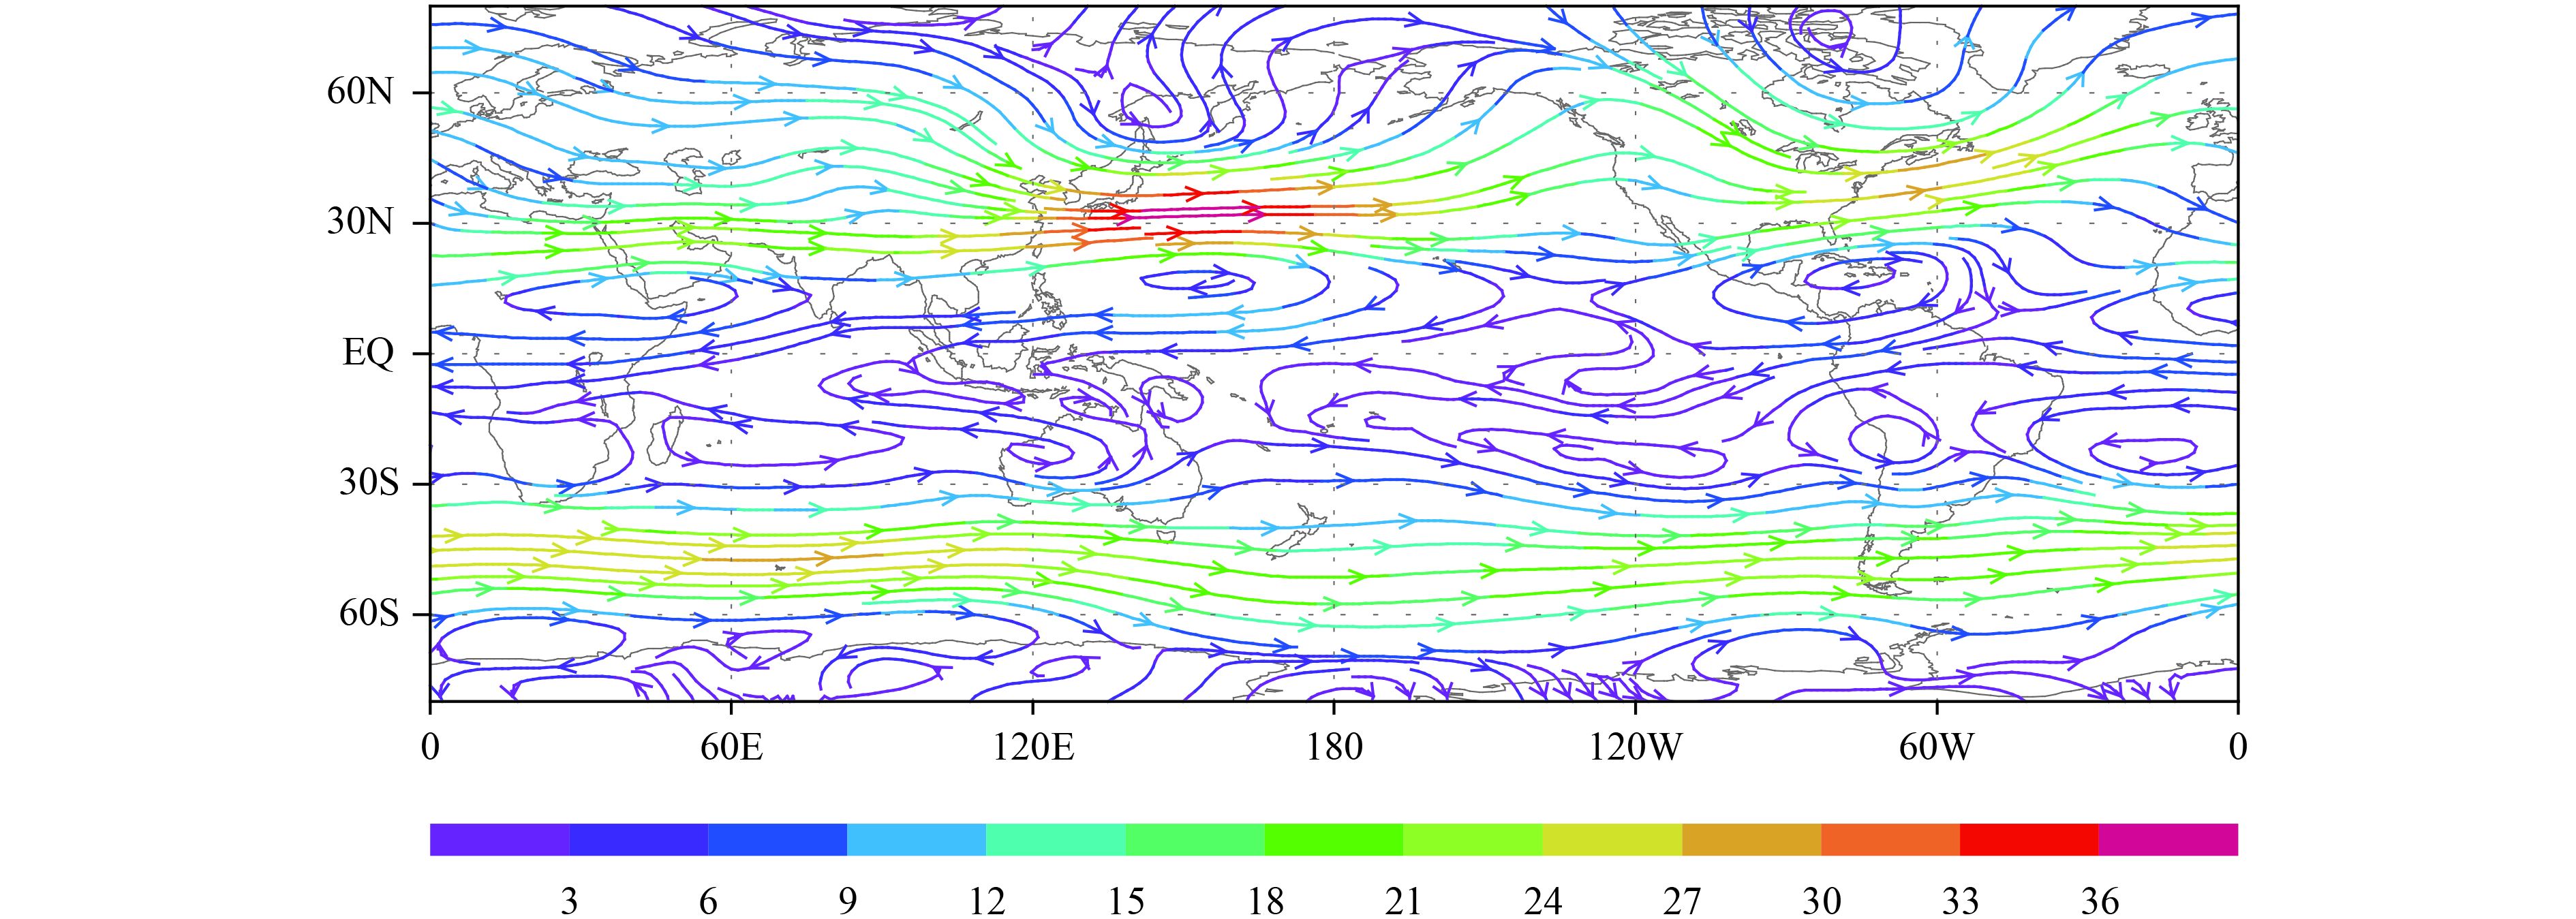
3.1 Long-term mean monthly wind fieldThe NCEP/NCAR long-term mean monthly wind field is derived from data during 1981–2010 (Kalnay et al., 1996). The dataset includes all 12 months of the year and the horizontal resolution is 2.5° × 2.5° with a global coverage. It contains 17 standard pressure levels in the vertical direction. January is selected to represent the boreal winter and July to represent the boreal summer. The 850-, 500-, and 200-hPa levels are selected to represent the low, middle, and top levels of the troposphere, respectively. The polar region is excluded and the region within 80°S–80°N is selected. The general circulation of the atmosphere in the boreal winter shows that there are strong westerly winds over East Asia at 500 hPa (Fig. 5), with a maximum wind speed > 36 m s –1 (about 130 km h–1); the wind speed at 200 hPa is higher and there are more vortexes at 850 hPa.
|
| Figure 5 NCEP/NCAR long-term January mean 500-hPa wind stream (m s–1). |
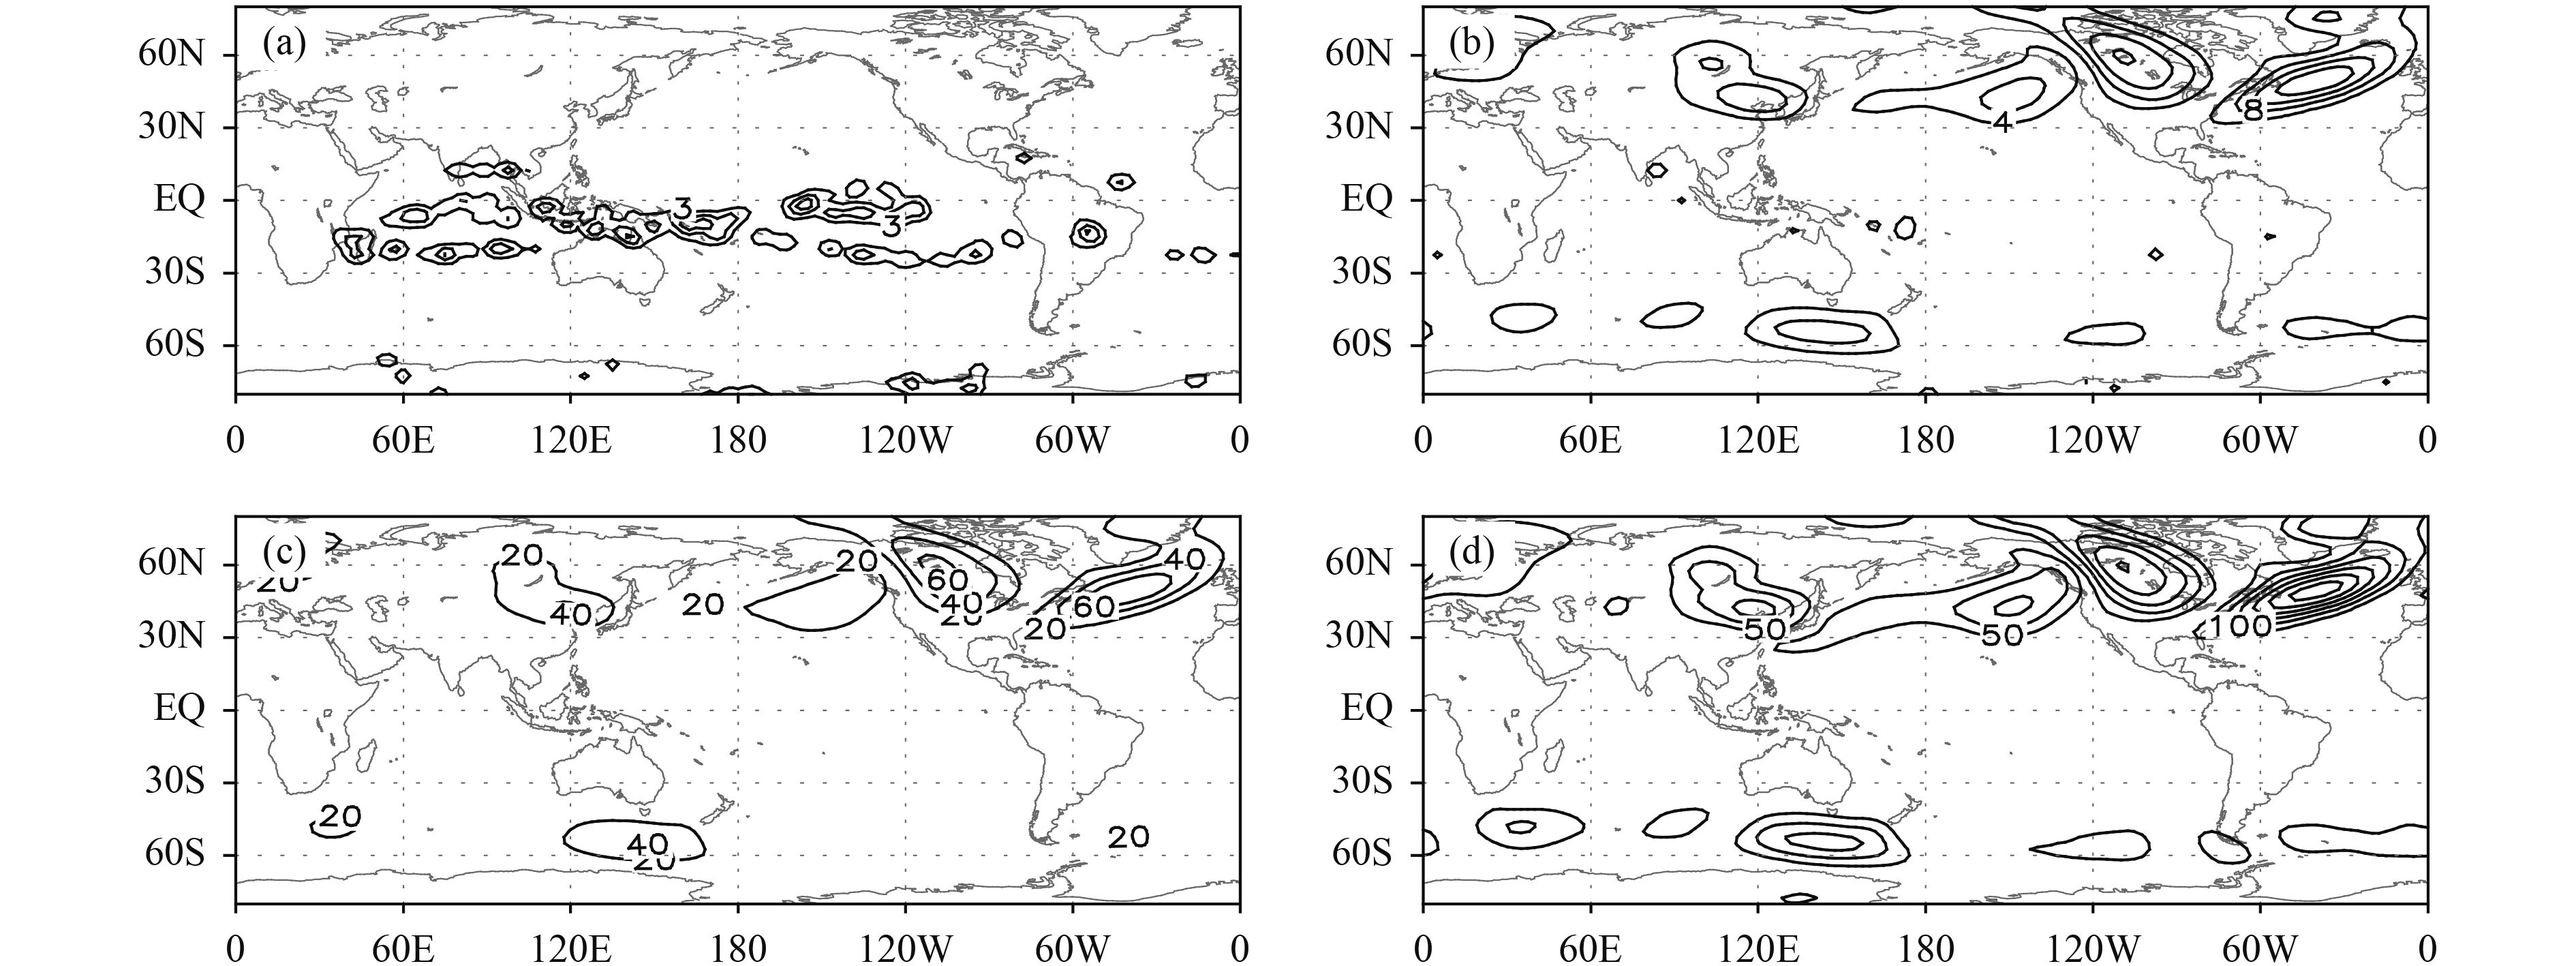
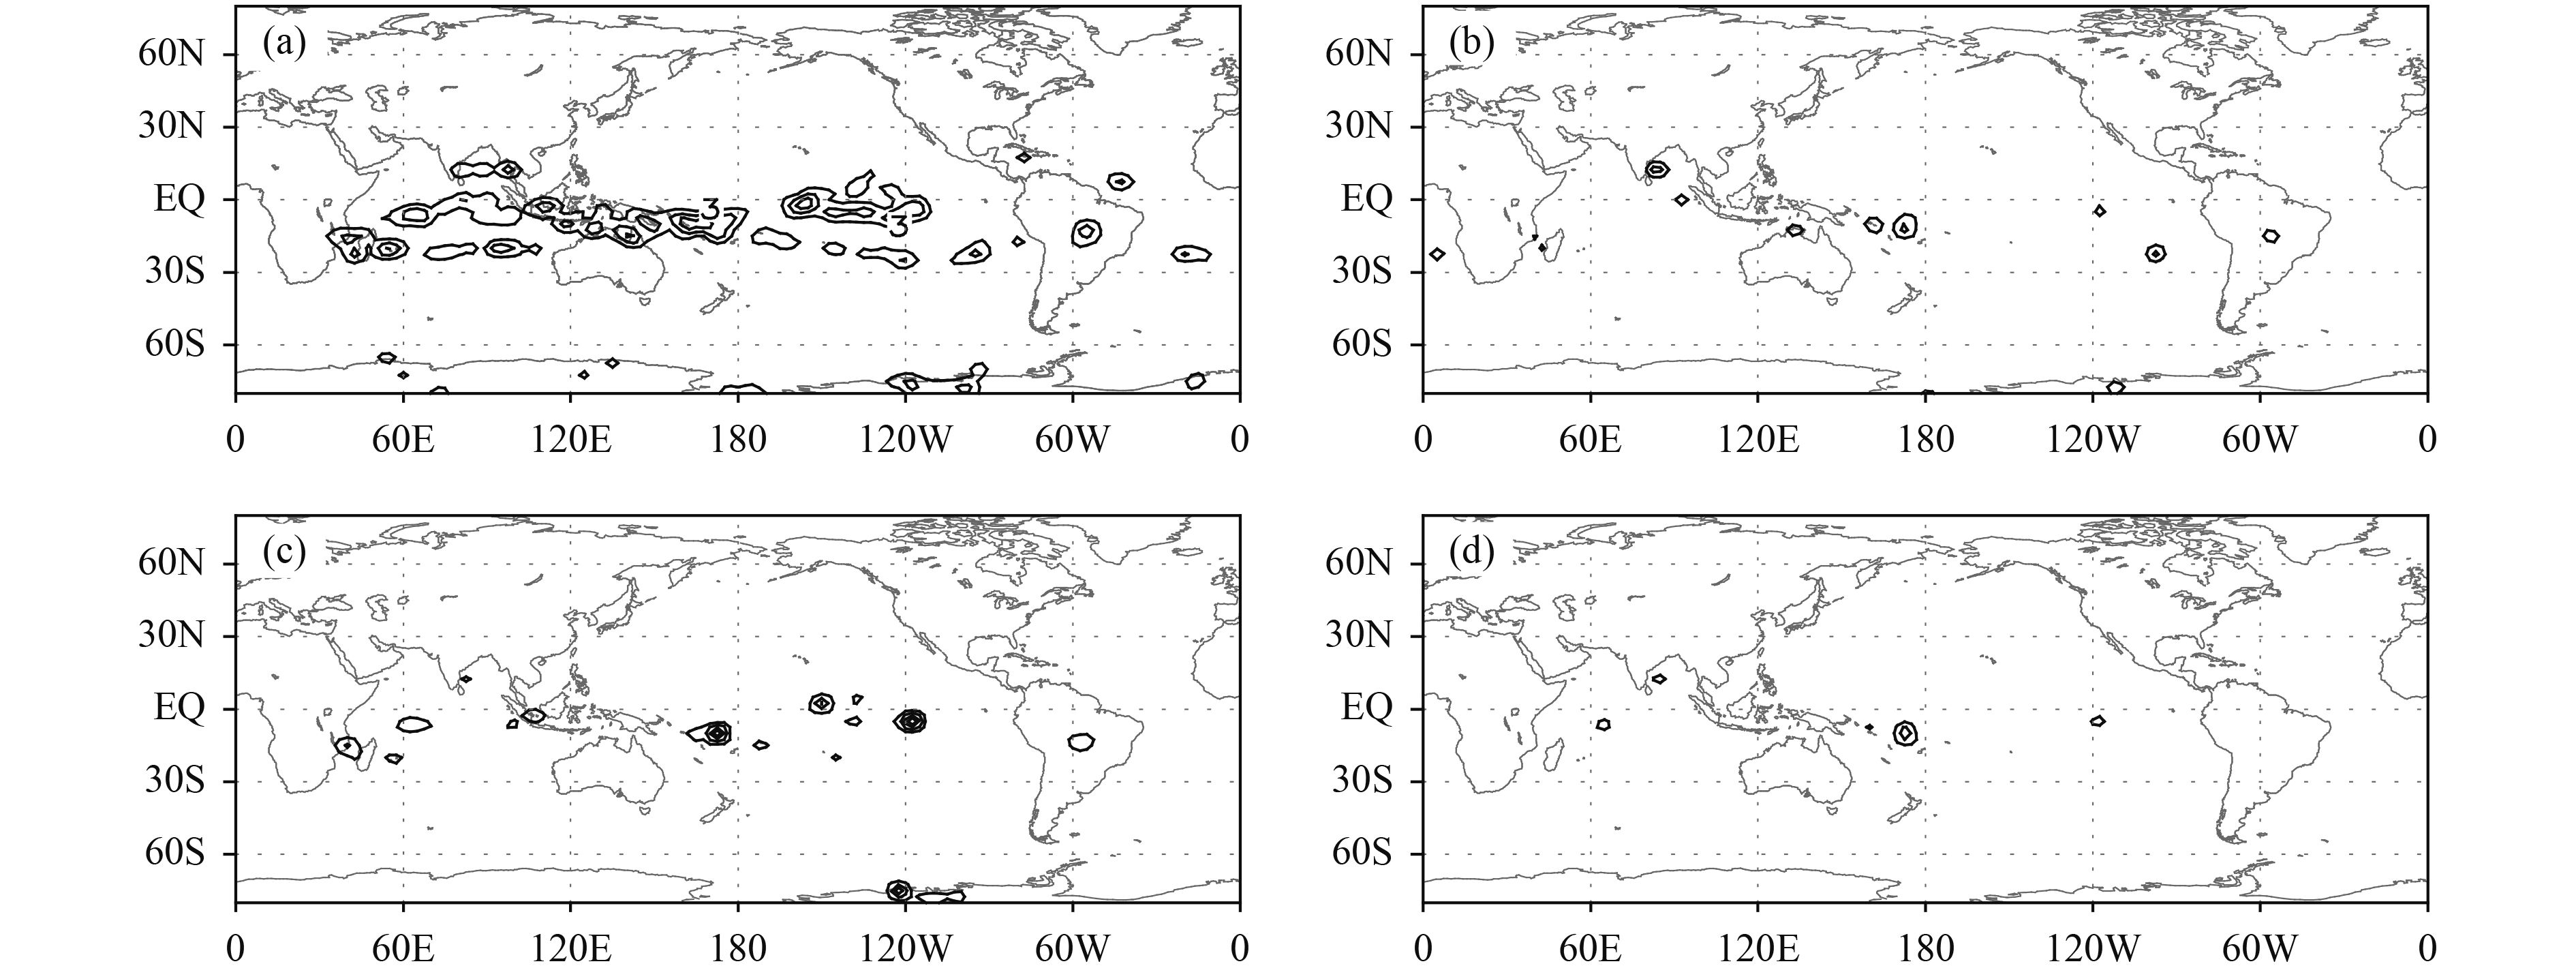
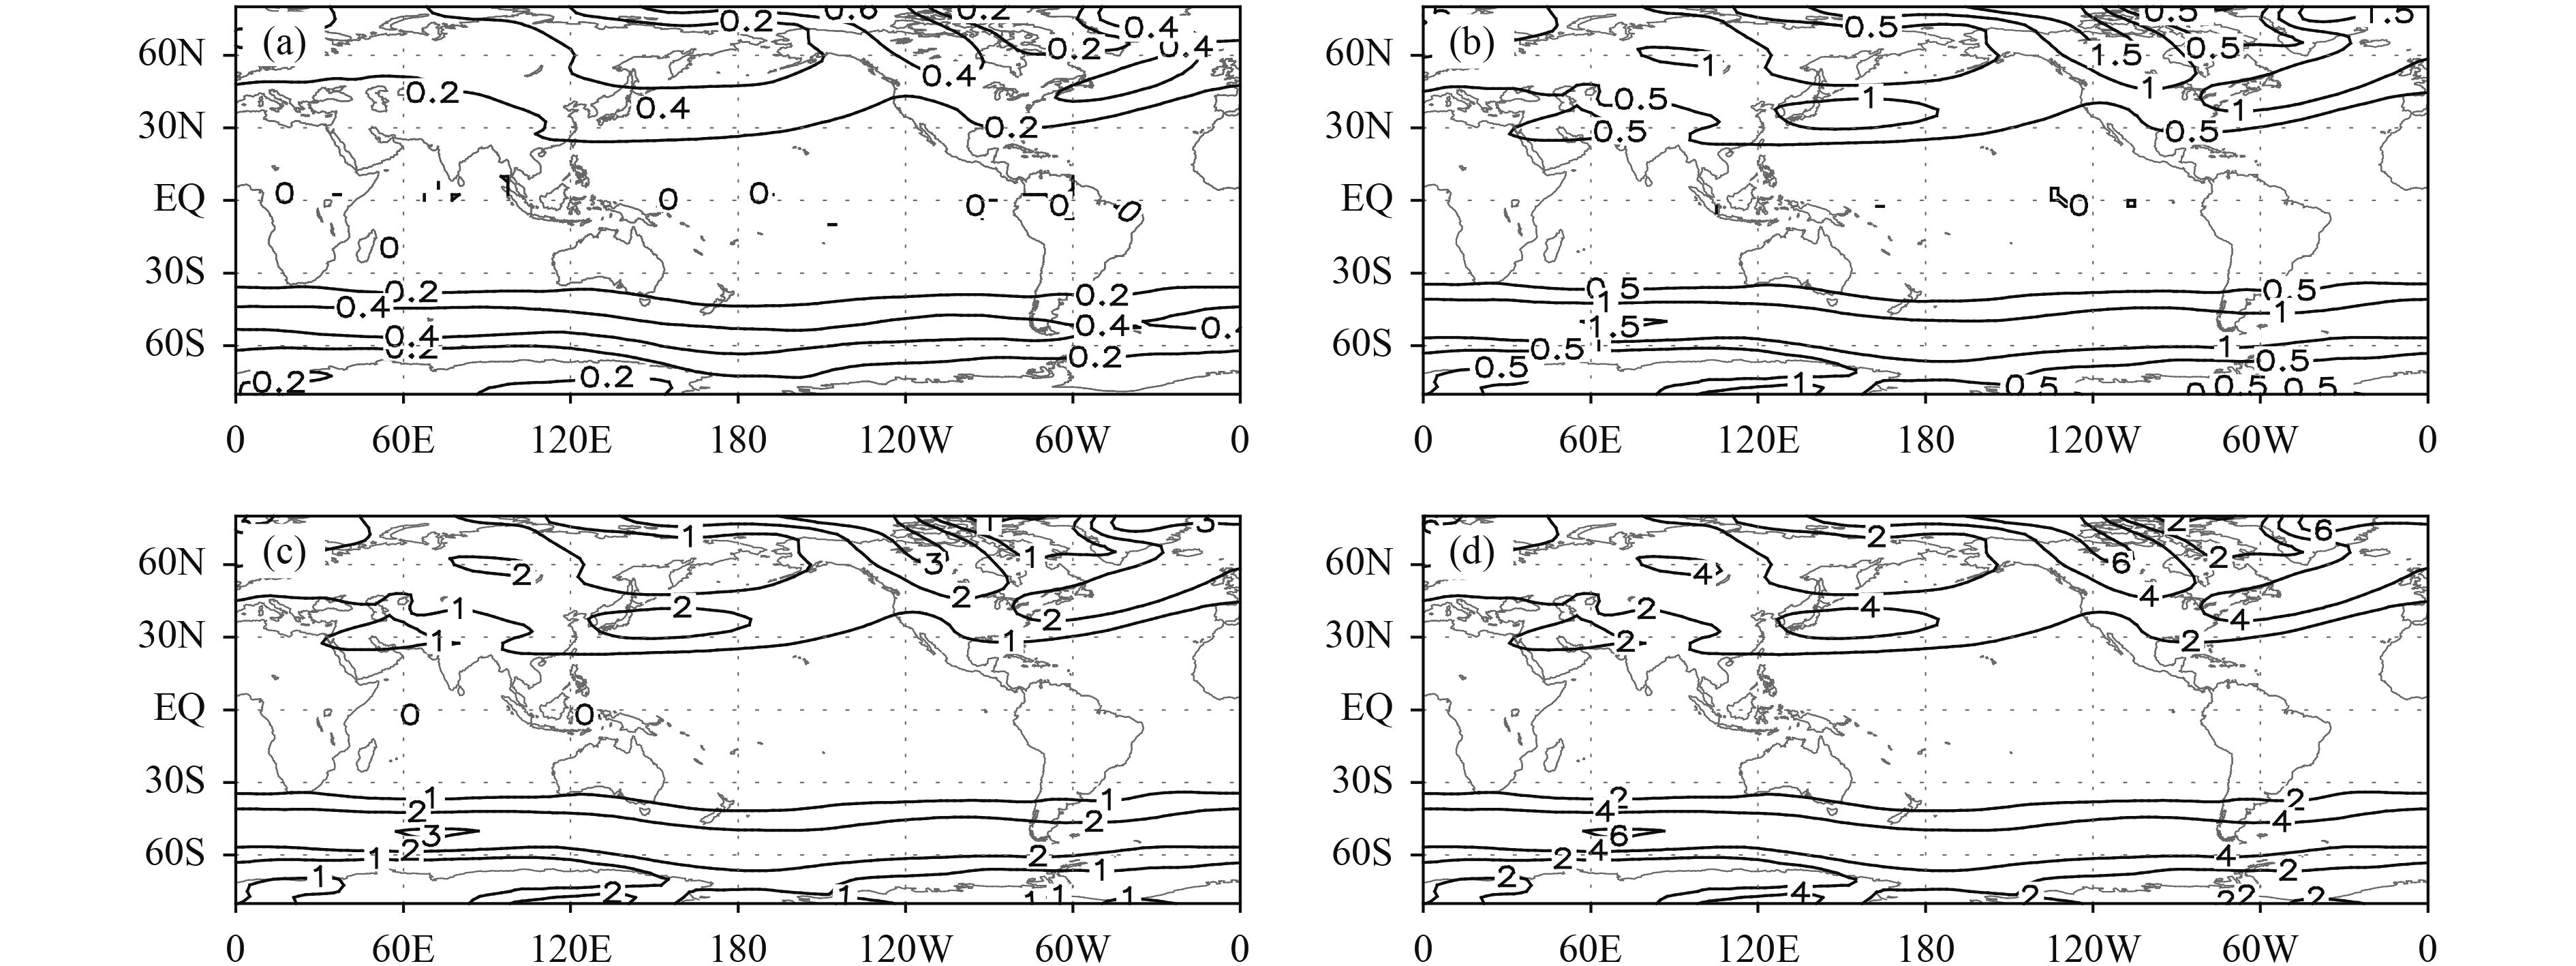
In the region of interest, each grid point is treated as the departure position of the air particle, which moves at the wind speed at this location. For the one-step displacement is small compared with the midlatitude wavelength on the climate mean chart (Fig. 5) and the detailed structure is only slightly distorted under scale consideration. The mean displacements and their errors and the angle difference between the MRDM and GCDM are calculated and set at the departure grid. Thus, the distribution pattern of these variables can be plotted. The displacement lapse times are set to 1, 3, 6, and 12 h. The mean distance errors of the MRDM, the mean distance errors of the GCDM, and the angle differences between the displacements computed by the MRDM and GCDM for the 500-hPa wind in January are shown in Figs. 6–8. To give general information, the data are smoothed once by nine points before being plotted. When the lapse time is 1 h, the displacement errors computed by the MRDM and GCDM have similar distribution patterns (Figs. 6a, 7a). Because the displacement error of the GCDM (Fig. 7a) is only a computational error and Figs. 6a and 7a are similar, it might be conjectured that the 1-h displacement errors of the MRDM are dominated by computational errors. The displacement error of the GCDM has a decreasing trend with increasing lapse times (Figs. 7a–d), whereas that of the MRDM has an increasing trend (Figs. 6a–d). The GCDM displacement error has a decreasing trend because the GCDM displacement is corrected by Eq. (24), in which the correction coefficient is related to the magnitude of displacement. The mathematically accurate form is
|
| Figure 6 Long-term NCEP/NCAR January mean 500-hPa displacement errors computed by the MRDM with lapse times of (a) 1, (b) 3, (c) 6, and (d) 12 h. The units are 100 m. The data are smoothed once to give general information, and the contour intervals are 3, 4, 20, and 50 (× 100 m), respectively. |
|
| Figure 7 As in Fig. 6, but for the GCDM. The units are 100 m, and the data are smoothed once to give general information and the contour intervals are 3, 3, 1, and 1 (× 100 m), respectively. |
|
| Figure 8 Long-term NCEP/NCAR January mean 500-hPa angle difference in degrees between displacement vectors computed by using the MRDM and GCDM with lapse times of (a) 1, (b) 3, (c) 6, and (d) 12 h. The contour intervals are 0.2°, 0.5°, 1°, and 2°, respectively. |
To include the whole layer and seasonal information, the confinement of the vertical wind field is extended to include the low, middle, and upper troposphere, and the temporal coverage is expanded to cover both the boreal winter and summer. The mean and maximum regional displacement errors and the maximum angle differences are shown in Table 1. The maximum displacement errors of both methods are small with the 1-h lapse time and the GCDM is slightly better than the MRDM for the mean displacement error. The displacement error of the MRDM increases with the lapse time. To determine the acceptable upper limit of the displacement error, Scheele and Siegmund (2001) applied the Royal Netherlands Meteorological Institute TRAJKS trajectory model (Scheele et al., 1996) to compute the three-dimensional displacement during the 12-h interval of the ECMWF ensemble predictions using an iterative scheme. A horizontal distance between neighboring iterative steps of < 300 m is one of the preconditions that stops the iteration. Therefore, 300 m was regarded as the maximum acceptable displacement error in this study. Table 1 shows that the regional mean displacement error of the MRDM is > 300 m for lapse times at 200, 500, and 850 hPa of 3/3, 6/6, and 12 h/6 h in the boreal winter (January)/summer (July), respectively. This result indicates that the MRDM should be applied with caution when the lapse time is > 3 h. For the MRDM, the 12-h regional maximum displacement errors at 200 hPa are about 70 and 50 km in January and July, respectively, with corresponding regional mean errors of about 8 and 5 km. The maximum angle difference is up to about 10° in July with a lapse time of 12 h. However, the regional mean (maximum) displacement error of the GCDM is < 100 m (< 3 km) for all time lapses.
| ∆t (h) | Month | Level (hPa) | MRDM | GCDM | |||
| MaxDE | MeanDE | MaxAD | MaxDE | MeanDE | |||
| 1 | January | 850 | 2343.6 | 97.5 | 0.5 | 2664.6 | 97.0 |
| 500 | 2786.6 | 94.7 | 0.7 | 2763.4 | 80.8 | ||
| 200 | 2050.8 | 72.9 | 1.0 | 2050.8 | 30.6 | ||
| July | 850 | 2365.7 | 98.2 | 1.0 | 2276.3 | 94.2 | |
| 500 | 2314.3 | 77.0 | 2.9 | 2562.5 | 69.3 | ||
| 200 | 2136.0 | 58.3 | 1.0 | 2136.0 | 33.1 | ||
| 3 | January | 850 | 2059.0 | 79.4 | 1.5 | 2059.0 | 32.2 |
| 500 | 2449.7 | 199.8 | 2.0 | 2449.7 | 28.0 | ||
| 200 | 3515.8 | 473.7 | 3.1 | 1779.4 | 10.5 | ||
| July | 850 | 2319.1 | 99.5 | 3.1 | 1873.2 | 31.4 | |
| 500 | 2008.5 | 148.0 | 2.2 | 2339.1 | 23.0 | ||
| 200 | 2741.5 | 322.5 | 2.9 | 2046.0 | 11.8 | ||
| 6 | January | 850 | 2624.7 | 236.6 | 3.1 | 2460.9 | 16.3 |
| 500 | 8289.1 | 723.7 | 4.0 | 1889.6 | 13.8 | ||
| 200 | 15068.5 | 1888.5 | 6.2 | 255.2 | 5.3 | ||
| July | 850 | 9109.6 | 317.1 | 6.3 | 1879.9 | 15.6 | |
| 500 | 5814.9 | 542.8 | 4.4 | 2048.1 | 12.3 | ||
| 200 | 11285.2 | 1276.4 | 5.7 | 492.1 | 5.9 | ||
| 12 | January | 850 | 10566.2 | 918.4 | 6.1 | 264.7 | 8.0 |
| 500 | 34241.8 | 2871.0 | 8.0 | 619.5 | 7.3 | ||
| 200 | 69731.0 | 7632.7 | 12.4 | 167.7 | 3.1 | ||
| July | 850 | 36937.9 | 1239.4 | 12.7 | 347.4 | 8.0 | |
| 500 | 24037.2 | 2162.0 | 8.8 | 1896.9 | 6.5 | ||
| 200 | 47680.5 | 5158.6 | 11.4 | 984.2 | 3.5 | ||
To test the dependence of the trajectory error on the latitude and the definition range of the wind direction, an ideal wind field is designed for the one-step trajectory problem. There are two centers of large MRDM displacement errors in front of and behind the large North American trough (Figs. 6b–d). As discussed in Section 2.2, the displacement error of the MRDM is determined not only by the magnitude, but also by the wind direction at the departure position. Moreover, the latitude bound is limited to 80°S–80°N. The wind speed in this region is consistently 10 m s–1 and the defined range of the wind direction is 0°–360°. Thus, the ideal wind field is constructed in the space of latitude and wind direction. The 0°–80°N and 0°–360° wind direction region is selected for the symmetrical pattern of the Northern and Southern Hemispheres (Fig. 9). The lapse times are still 1, 3, 6, and 12 h. The displacement errors of the MRDM and GCDM are investigated, together with the angle difference. As the displacement is the product of the wind speed and lapse time, the idealized error distribution figures are similar to a look-up table using the relation between the displacement vector and the latitude.

|
| Figure 9 Streamline of the idealized wind field in a latitude–wind direction section. |
The displacement error of the GCDM also decreases with the lapse time. The displacement error of the MRDM (Fig. 10) and the angle difference (Fig. 11) increase with the lapse time (Figs. 10 and 11 are smoothed as in Figs. 6–8). The displacement error of the MRDM has a four-wave distribution pattern in the defined range of wind direction, with maximum values at 45°, 135°, 225°, and 315° and sharp wave peaks (Fig. 10). The angle difference has a two-wave feature, the pure meridional displacements have zero angle differences, and there are two flat peaks between them in two sections of wind direction (0°–180° and 180°–360°) (Fig. 11). Table 2 gives the variation of the displacement errors and angle differences with the lapse time. The characteristics are similar to those in Table 1. As the ideal wind field is used, the error is more orderly distributed. For example, the maximum angle differences increase with the lapse time. For the given region (here 0°–80°N), the regional maximum angle difference is larger for larger displacements. The differences in angle increase nonlinearly with latitude (Fig. 11).

|
| Figure 10 Ideal wind field computed displacement errors by the MRDM with lapse times of (a) 1, (b) 3, (c) 6, and (d) 12 h. The units are 100 m, and the data are smoothed once to give general information and the contour intervals are 1, 4, 20, and 50 (× 100 m), respectively. |

|
| Figure 11 Ideal wind field computed angle difference in degrees between displacement vectors computed by using the MRDM and GCDM with lapse times of (a) 1, (b) 3, (c) 6, and (d) 12 h. The contour intervals are 0.2°, 0.5°, 1°, and 2°, respectively. |
| ∆t (h) | MRDM | GCDM | |||
| MaxDE | MeanDE | MaxAD | MaxDE | MeanDE | |
| 1 | 272.7 | 38.9 | 1.0 | 129.6 | 19.0 |
| 3 | 2041.2 | 248.0 | 3.0 | 38.5 | 10.3 |
| 6 | 8294.8 | 987.6 | 6.0 | 17.5 | 5.9 |
| 12 | 34357.6 | 3949.6 | 12.0 | 13.1 | 2.8 |
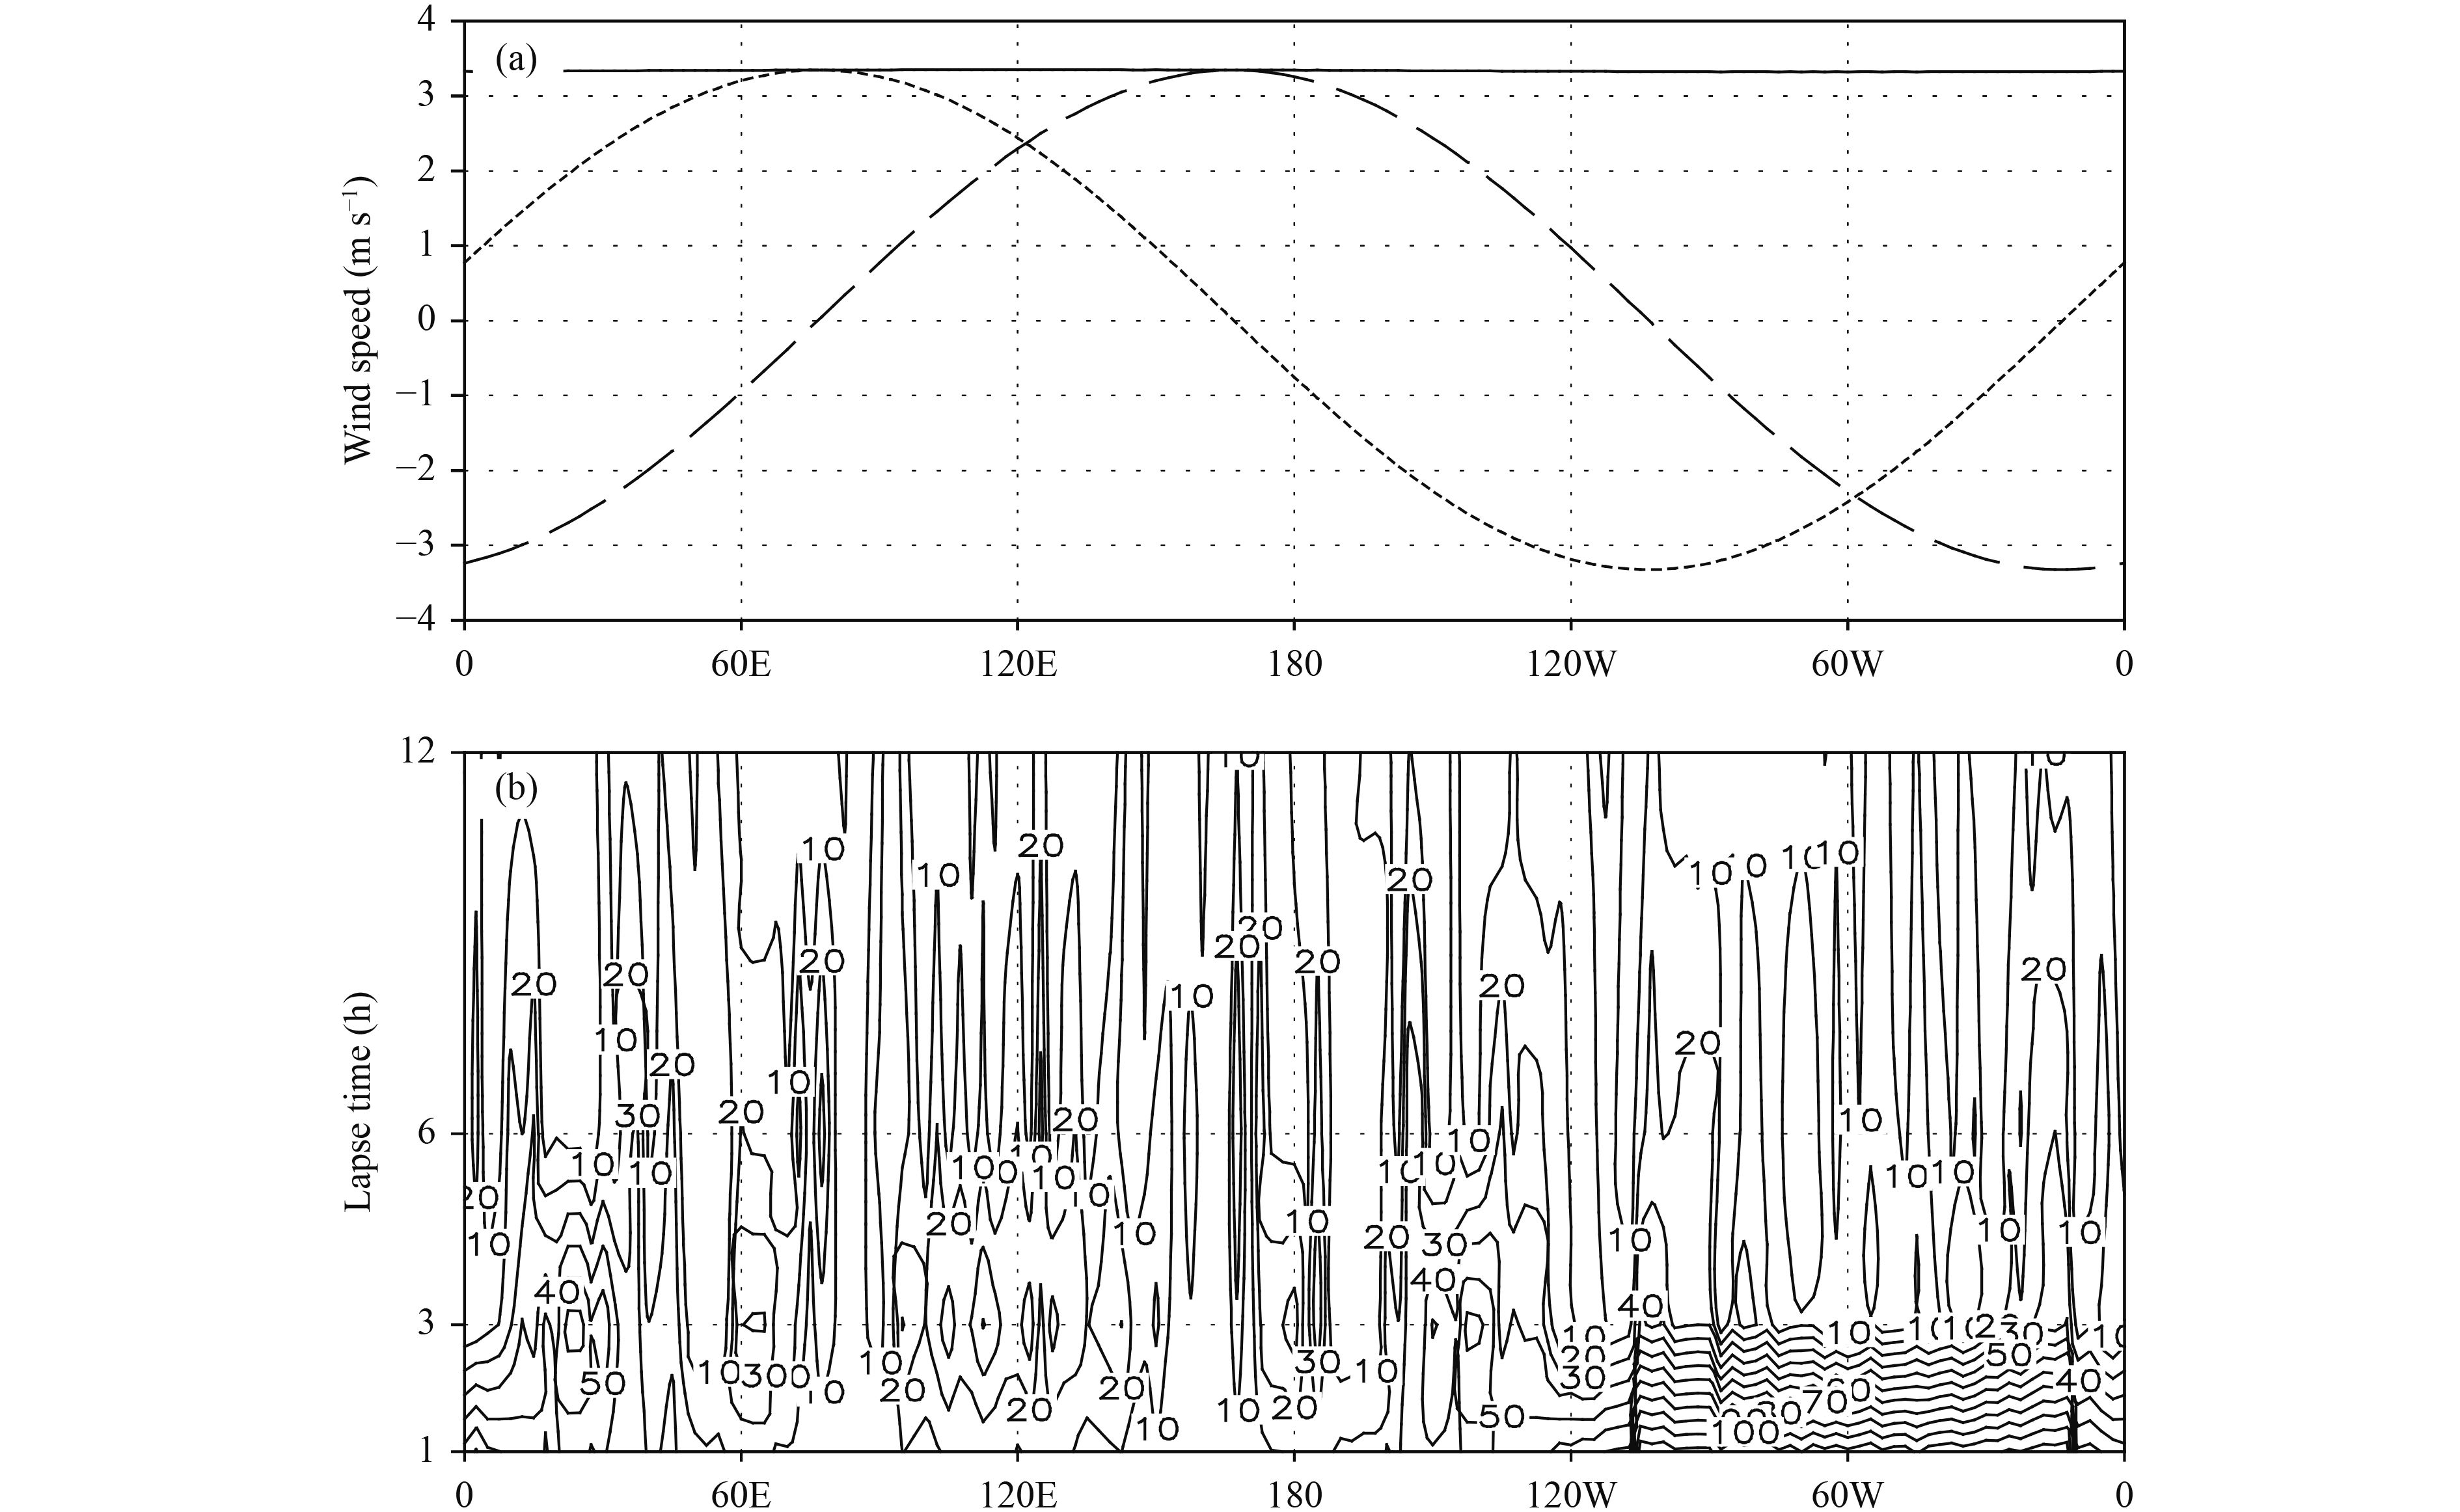
The applicability of GCDM at the North Pole is investigated. The data used are the long-term monthly mean NCEP/NCAR wind field at the North Pole. The wind field data consist of the wind components at 144 grid points overlapping at the North Pole. The wind speed is almost constant and the wind components vary with longitude as a sine or cosine function (Fig. 12a). The distribution of the displacement error in the space of longitude and lapse time is shown in Fig. 12b. The distribution pattern of the displacement error and its statistical information is similar to the examples discussed in the preceding sections. A close study of the data shows that the mean wind speeds at 850 hPa in January are not strictly equivalent at the North Pole, with a difference of about 0.03 m s–1 between the maximum and minimum values. The difference will result in 108, 324, 648, and 1296 m of displacement with lapse times of 1, 3, 6, and 12 h, respectively; the corresponding maximum displacement errors of the GCDM are 127.0, 64.3, 37.9, and 17.8 m, respectively. They are of the same magnitude with a time lapse of 1 h, but the errors in the GCDM are much smaller when the time interval is > 3 h. This result suggests that the GCDM is applicable in the polar region.
|
| Figure 12 (a) Long-term January mean wind fields at 850 hPa at the Nort Pole and (b) the displacement error (m) of the GCDM. In part (a), the long-dashed line is the zonal wind, the short-dashed line is the meridional wind, and the solid line is the wind speed (m s–1). |
In the preceding section, the trajectory is only dependent on the “initial” wind and the GCDM acts as the “real” trajectory when assessing the angle difference with the MRDM. In fact, there is no exact arrival position of the air particle when only the initial wind vector of the departure position is given. For example, a Northern Hemisphere air particle with a wind speed of u = 10 m s–1 and v = 0.0 m s–1 will move to the east with some northward deviation if it is to the south of a small low pressure center, but some southward shift will occur if it is to the north of a small high. That is to say, all the trajectories are dependent on the wind field. To solve this dependence, iterative methods are introduced to compute the displacement more accurately: not only the initial wind vectors, but also the iterative wind vectors at the other (departure) position are used. Because of the different physical conditions, a one-step trajectory cannot be evaluated by an iterative method. This section compares the MRDM and GCDM using iteration.
4.1 Introduction of test designationIterative procedure. The iterative procedure can significantly improve the computational accuracy of the trajectory (Stohl, 1998). The general form of iteration is:
| (28) |
where X is the position vector,
Avoidance of interpolation errors. In general, the interpolation errors include both spatial and temporal interpolation errors (Bowman et al., 2013) and both are major sources of error in the computation of trajectories. The temporal variation of the analytical wind field of cases 1–3 of Nair and Lauritzen (2010) are introduced to avoid interpolation errors:
Case 1:
| (29) |
Case 2:
| (30) |
And case 3:
| (31) |
The analytical wind fields of Nair and Lauritzen (2010) are theoretical and the parameters are re-appointed according to the atmospheric conditions. The flow parameter k is roughly the scale of wind component globally and is taken as 30 m s–1. Parameter T is the timescale of wind revision and is taken as 72 h (3 days).
Reference method. The method of Temperton et al. (2001) is used as the reference method. The three-time level trajectory scheme of Temperton et al. (2001) had been used as a standard method in the ECWMF operational model. Their algorithm is so accurate and robust that its modifications are still used by world-leading weather forecast centers. Thus, the trajectories computed by using the method of Temperton et al. (2001) are treated as the “real” trajectories.
Test designation. Because the MRDM is not suitable for high latitudes, the test region for the departure position is set as the spherical band between the ±80° latitudes. The departure positions are distributed evenly with a resolution of 1° × 1°. A one-step trajectory is tested from t = 0 with lapse times of 1, 3, 6, and 12 h, respectively. To avoid the computational singularity of Eq. (24), the correction coefficient is set to 1 when the displacement is <1 mm (corresponding angle α approximately 10–10). The assessment factors are same as the preceding errors in magnitude and angle, but the “real” trajectory is that of Temperton et al. (2001).
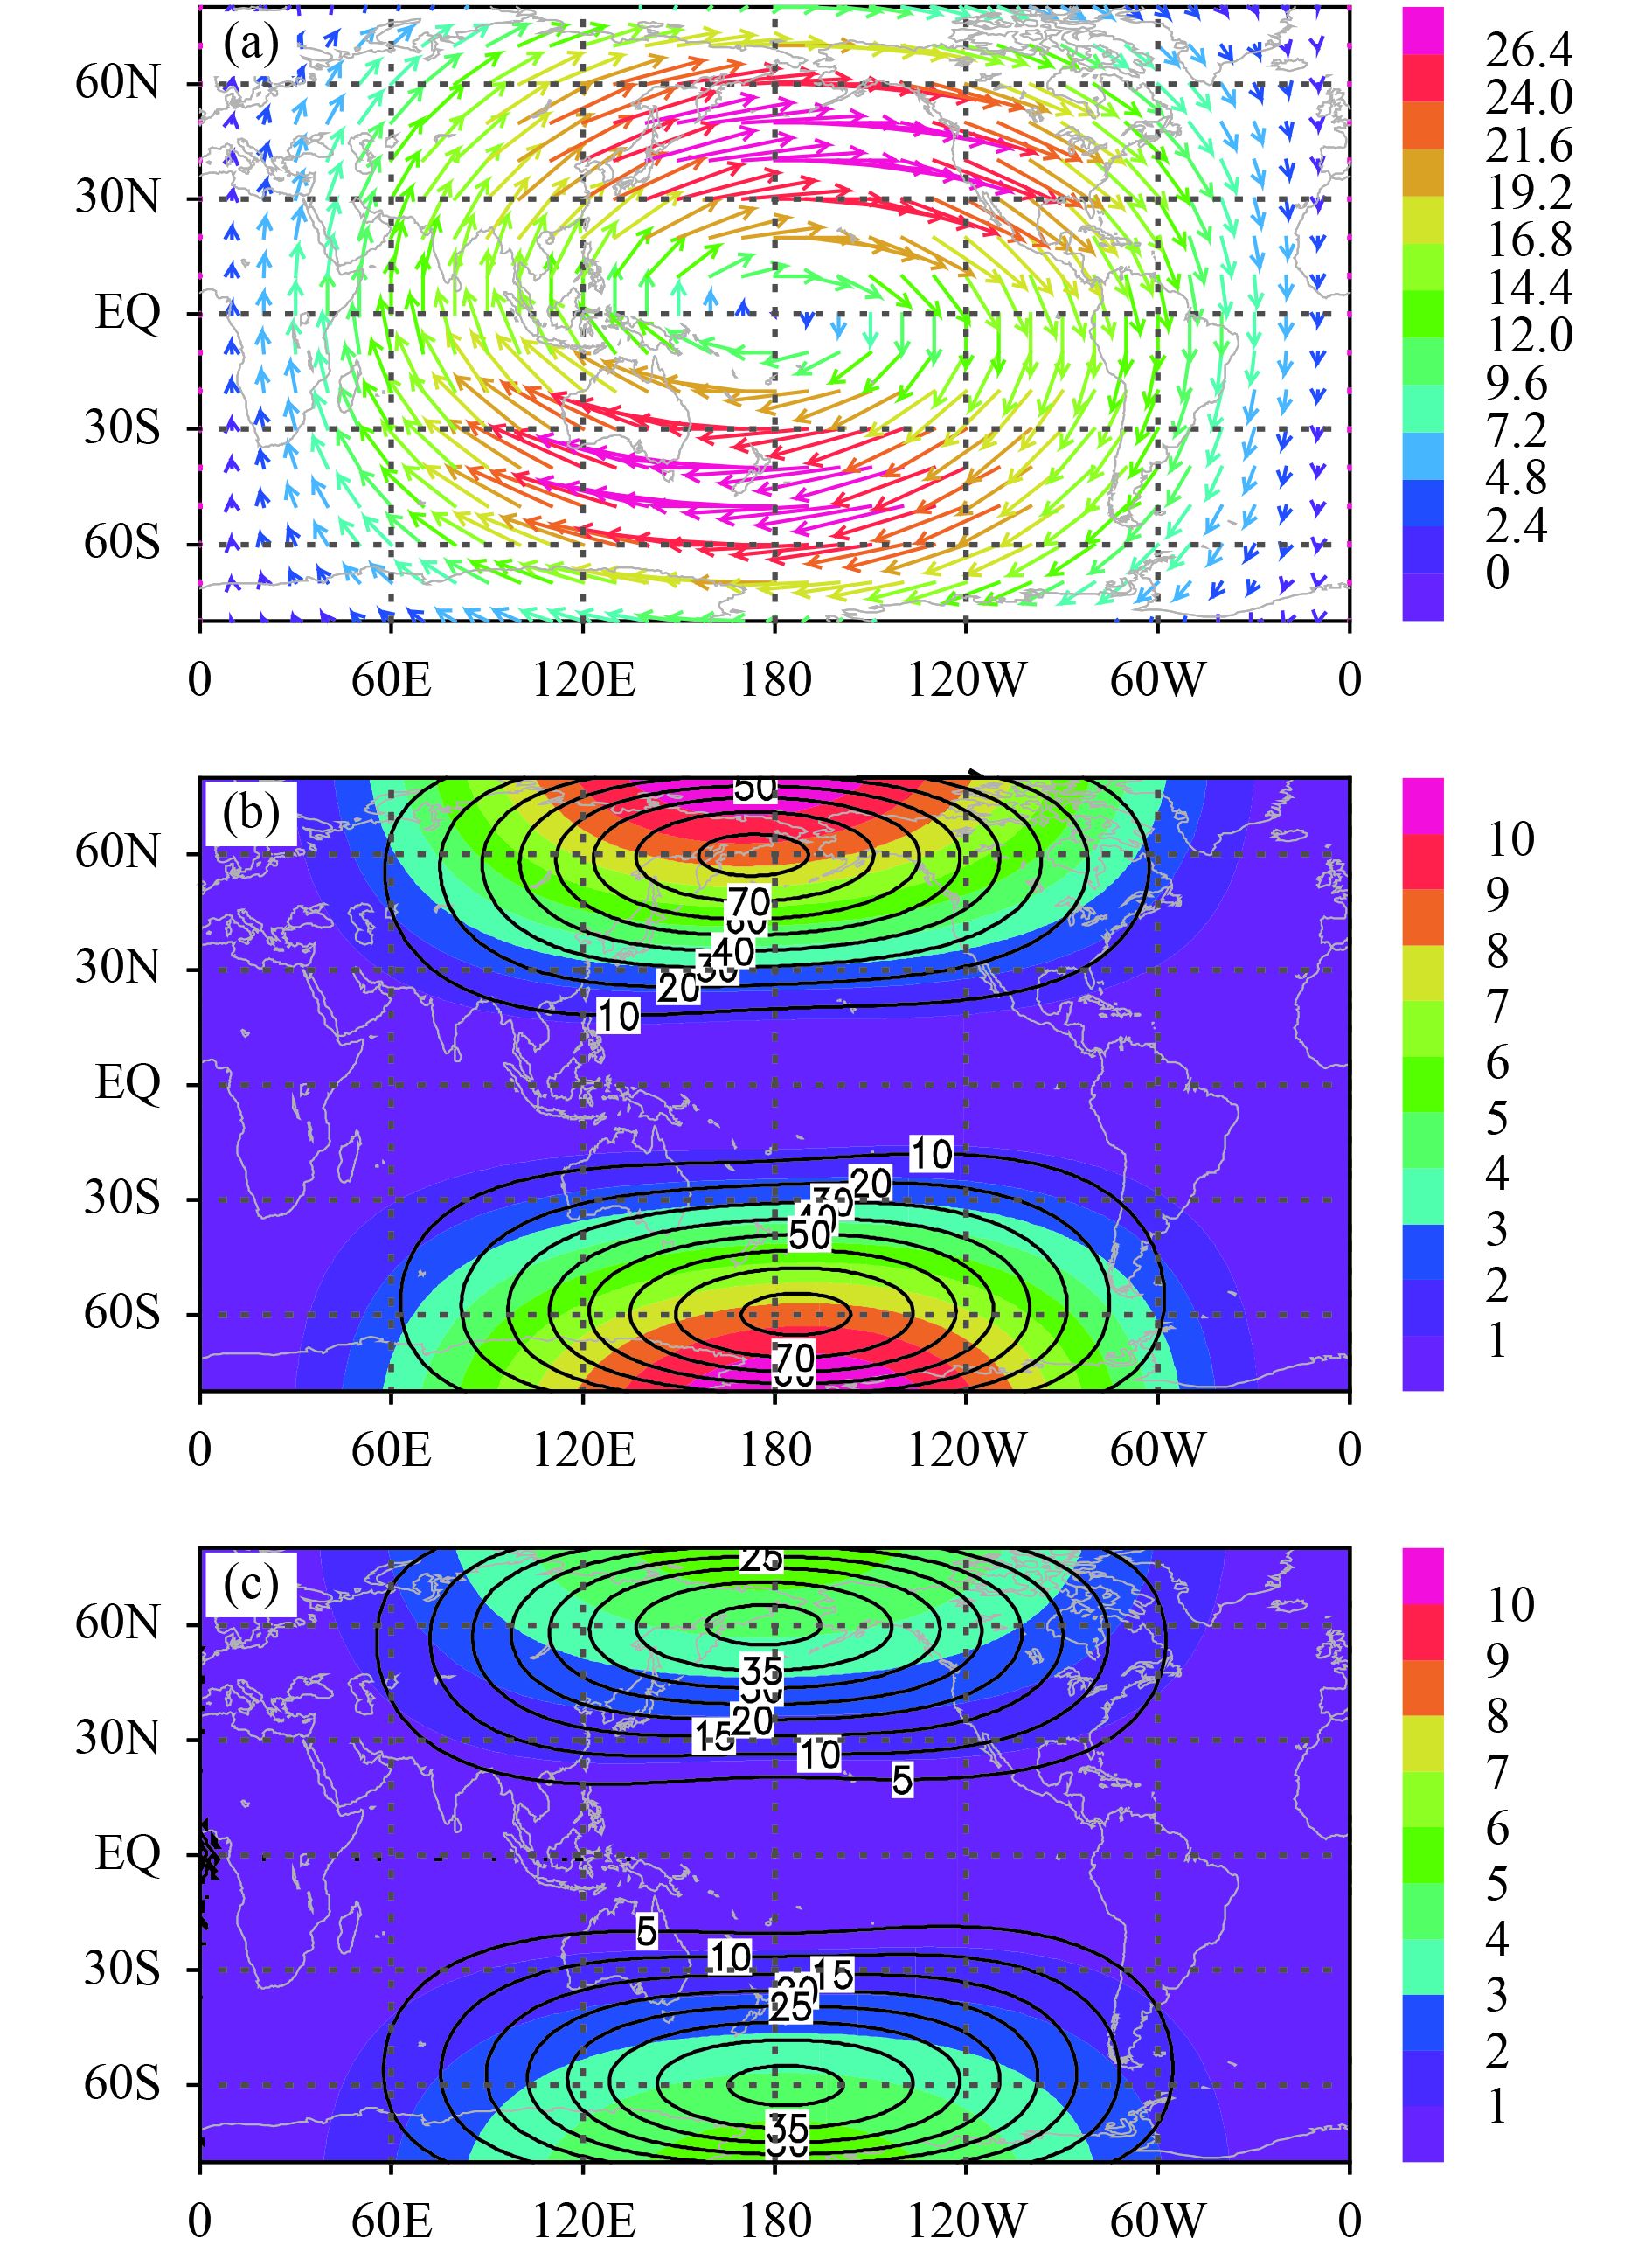
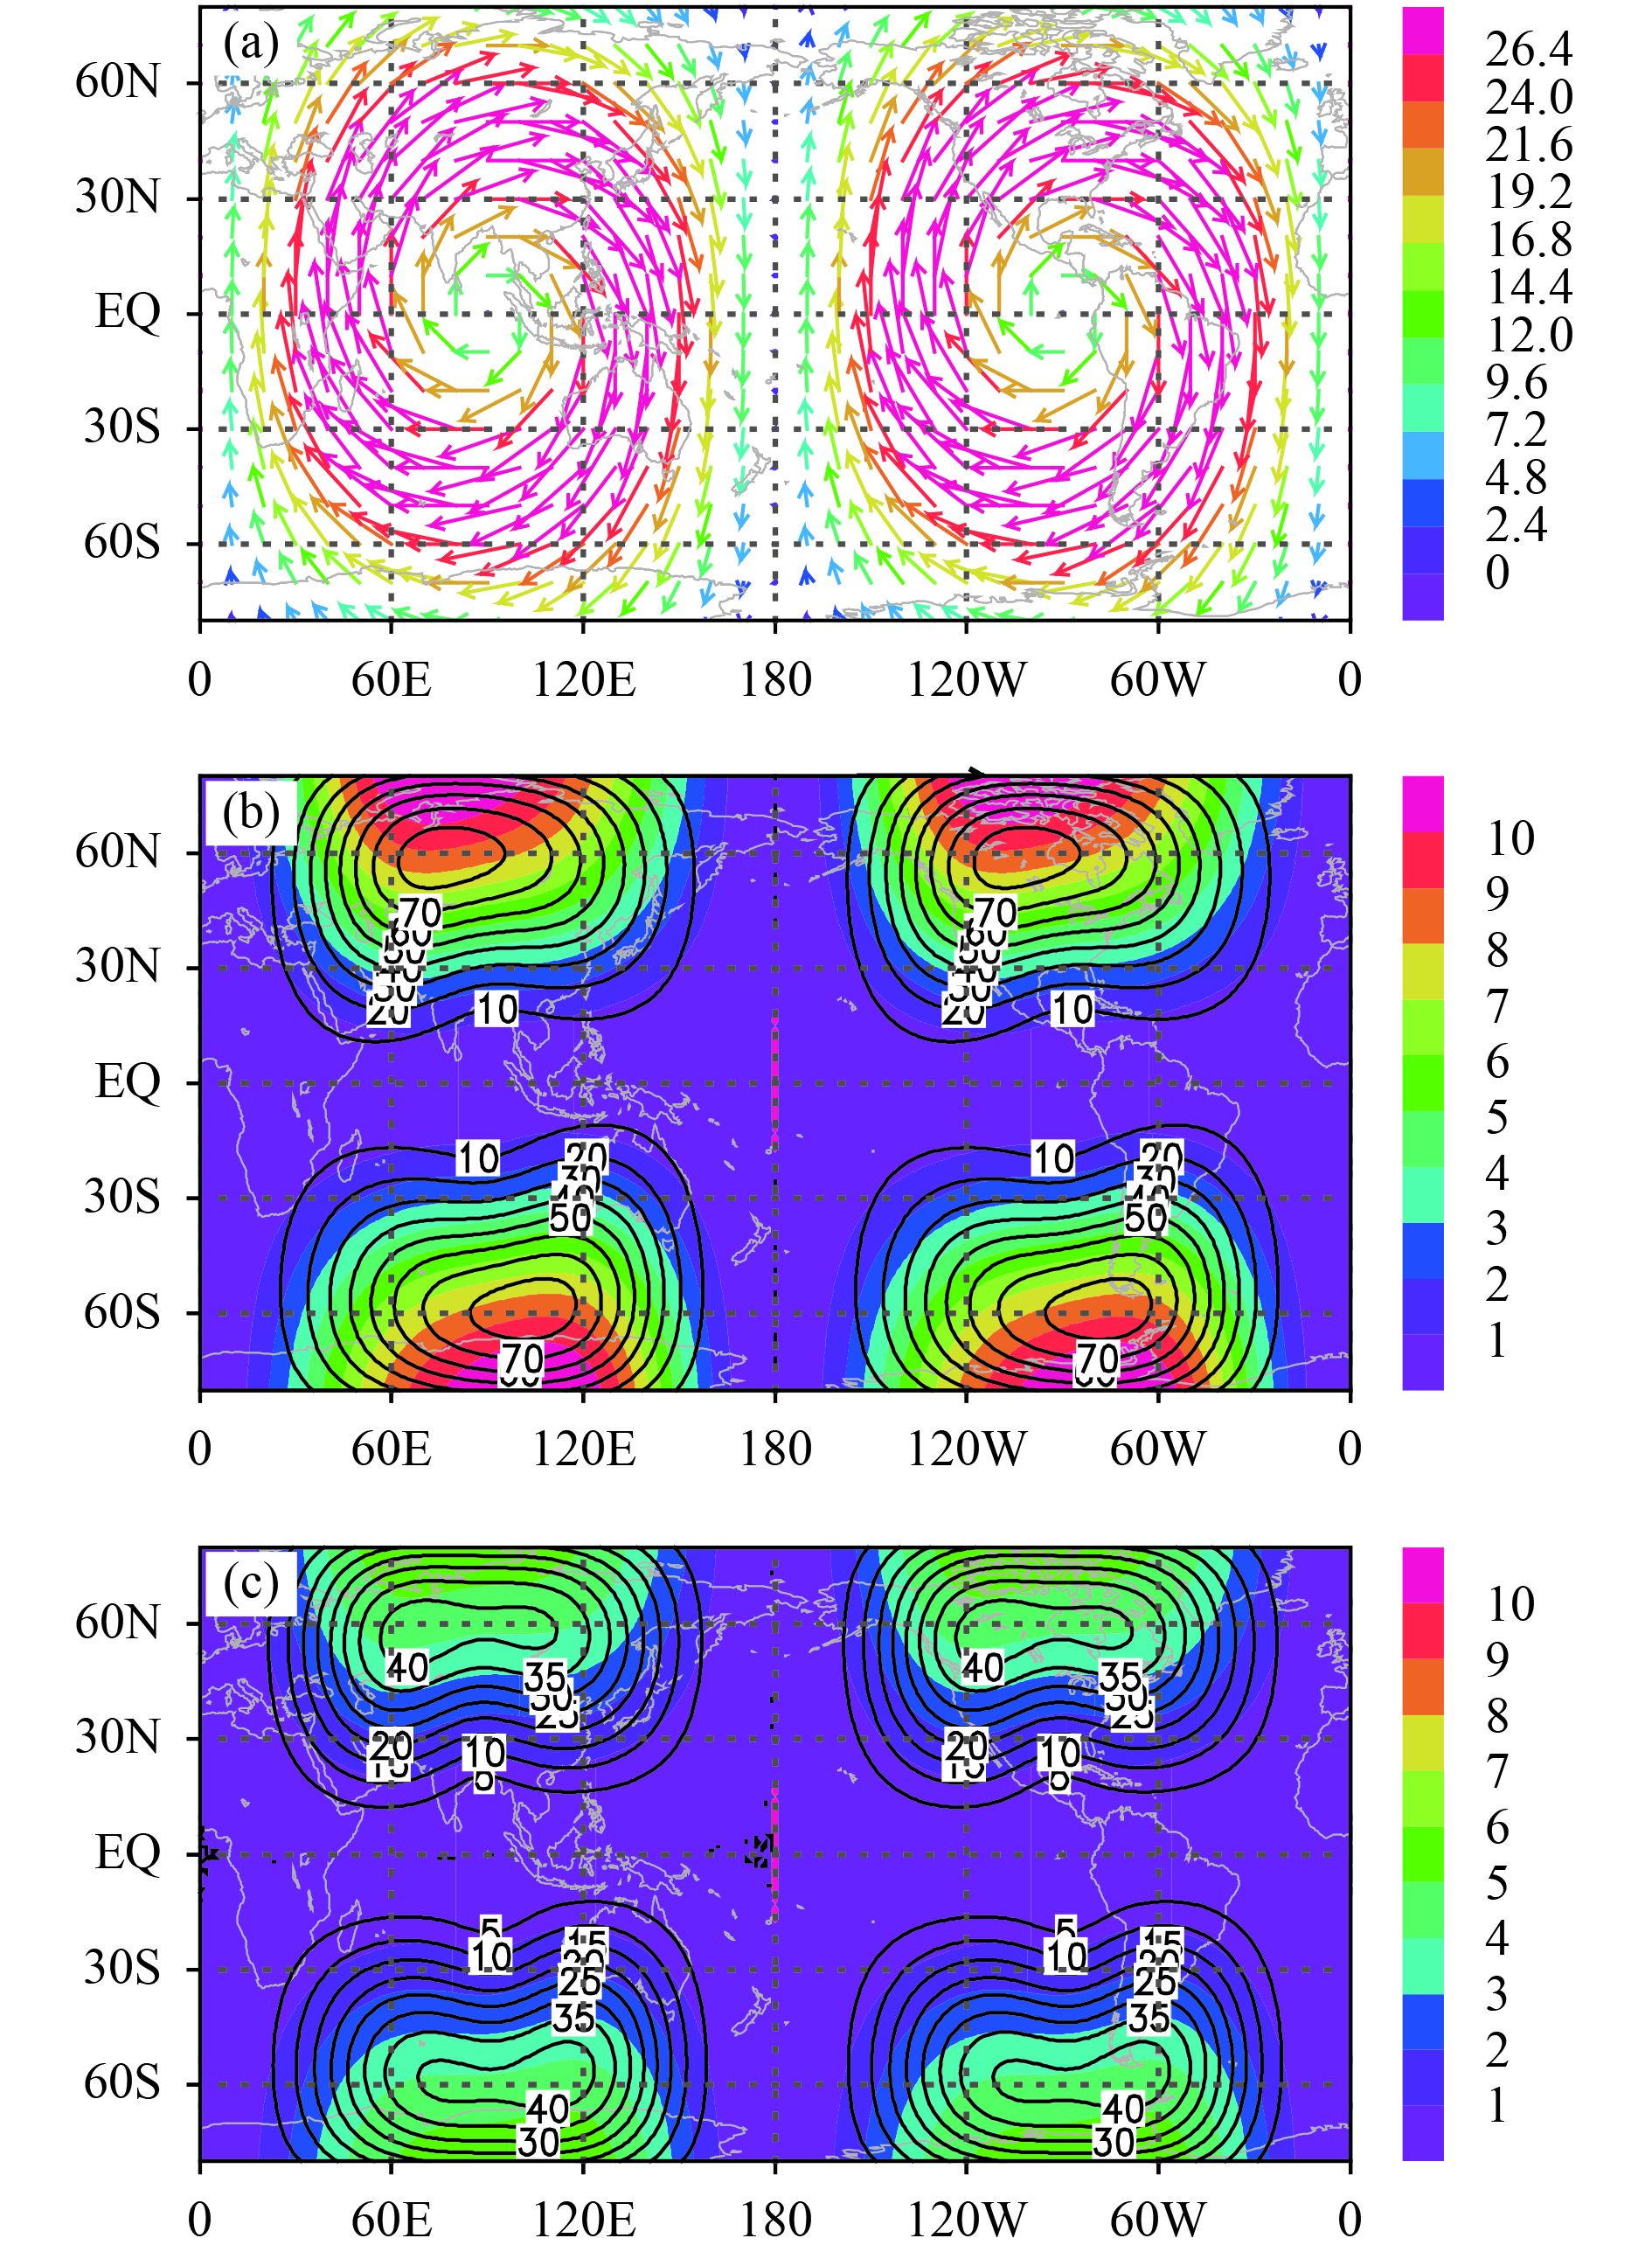
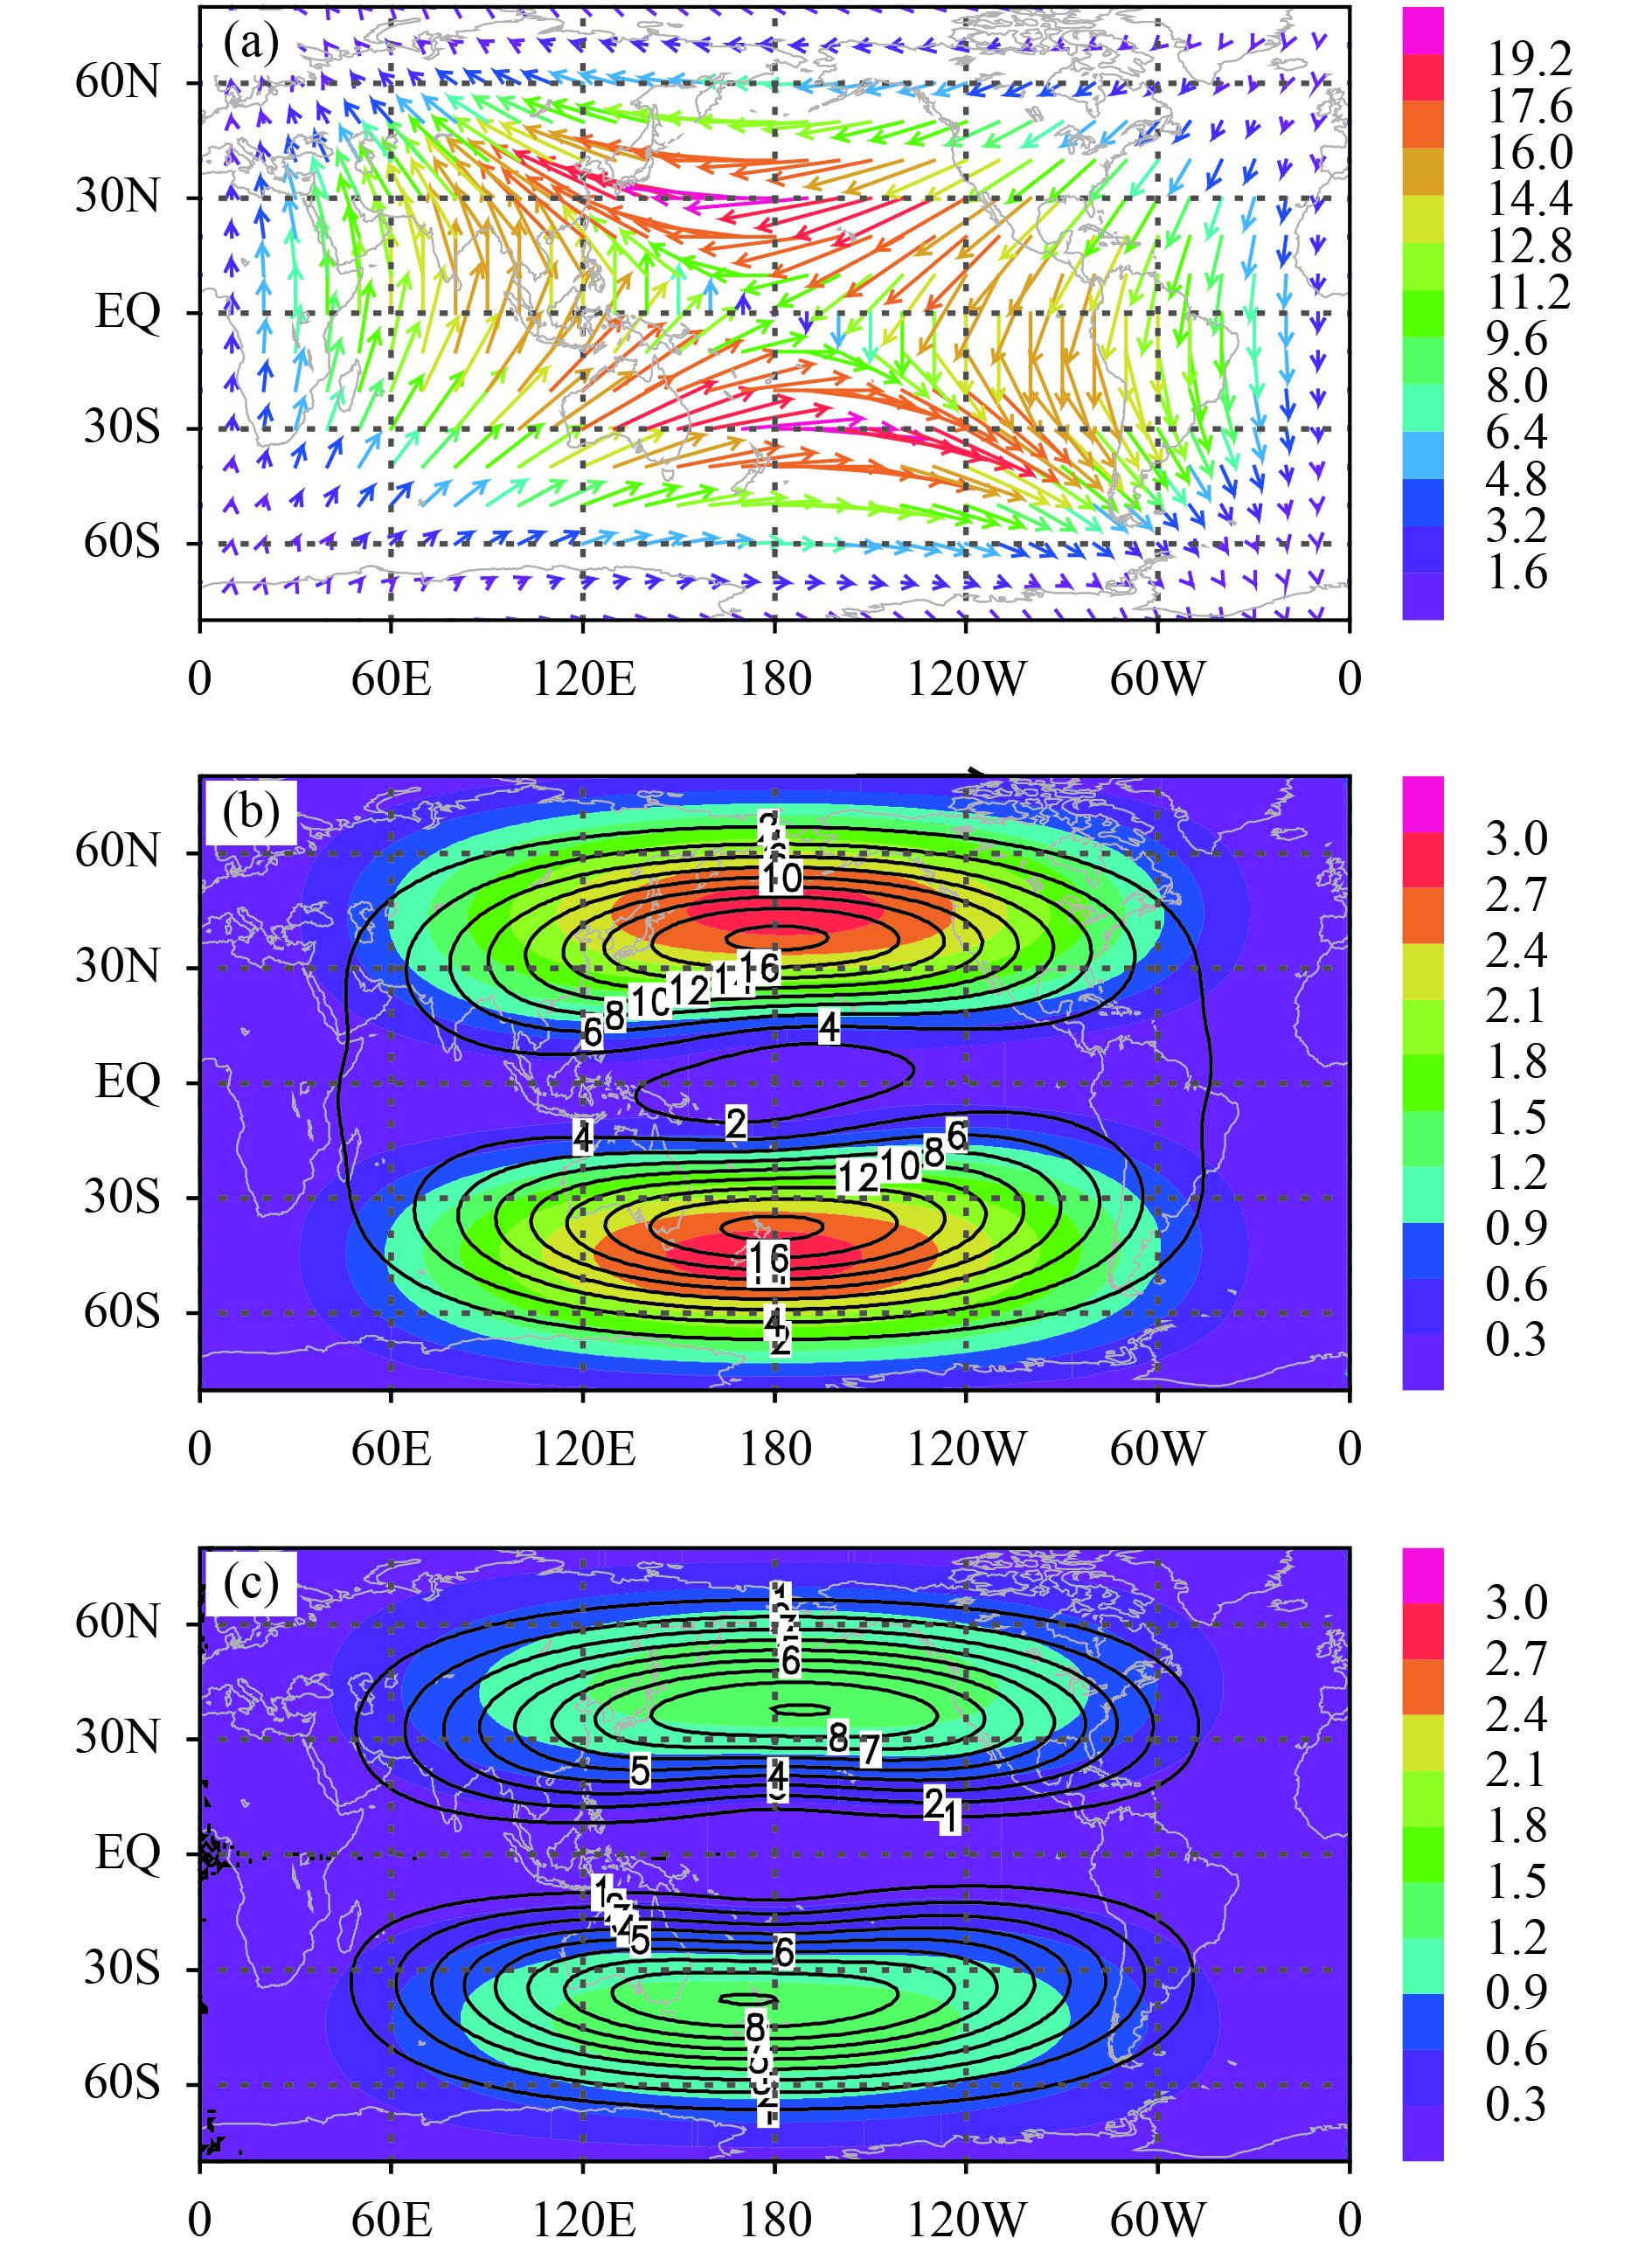
4.2 MRDM and GCDM error distributionsThe magnitude error and angle error of the MRDM and GCDM are computed with respect to the results of Temperton et al. (2001). Cases 1 and 2 are examples of non-divergent deformation flow and case 1 presents a large gyre centered at 180° of the equator view in a latitude–longitude map projection [Eq. (29) and Fig. 13a]. Case 2 presents two gyres centered at 90° and 270° from the equator, respectively [Eq. (30) and Fig. 14a]. Case 3 is an example of divergent deformation flow, a saddle-form system in meteorology with a singular point at 180° from the equator [Eq. (31) and Fig. 15a].
In each case of the ideal wind field, the distribution patterns of both errors are unchanged with the lapse time, although their magnitudes increase. Considering the 6-h lapse time for wind field in case 1, two centers of angle error of the MRDM (Fig. 13b) are located at the most northern and southern boundaries where the winds are at their maximum along the boundary latitudes. Because of computational errors, there may be singular values of the angle error at positions where the winds tend to zero. The singular angle error is characterized by one or more extremely large angle errors (≤ 180°) surrounded by angle error regions with smaller values; the angle errors change abruptly spatially. Figure 13b shows a singular angle error of 180° at 0° N, 180°. The singular values of angle difference are related to computational errors and are not discussed further. The magnitude error of the MRDM has two close maximum centers at 60° N and 60° S due to the shape of the sphere and the two centers shift in the upwind direction. The GCDM errors have a similar distribution pattern to the MRDM (Fig. 13b), but only half the magnitude (Fig. 13c). The error distribution of case 2 is very similar to that of case 1, except that two gyres are introduced (Figs. 14b, c). The magnitudes of the change in wind direction along the southern and northern boundaries are doubled (one gyre in Fig. 13a to two gyres in Fig. 14a) and the upwind shift in the centers of the angle and magnitude errors are more obvious than those in case 1. The angle error distribution pattern in both cases 1 and 2 is similar to the ideal test in Fig. 11; the maximum values are located poleward of the gyre centers and the difference in the distance of the northeast/southwest wind shown in Fig. 10 is not obvious. For case 3, the wind speed is small at high latitudes (Fig. 15a) and the maximum angle error and magnitude error are much less than those of cases 1 and 2. The error centers are located between 30° and 60° in the Southern/Northern Hemisphere and the error centers slightly shift in the upwind direction (Figs. 15b, c). All cases 1–3 indicate that the errors of both methods are related to latitudinal location, wind speed, and wind direction.
|
| Figure 13 (a) Initial idealized wind field (m s–1; grid skipped to 5° interval) of case 1, (b) 6-h time lapse angle error (shaded; °) and magnitude error (contour; km) of the MRDM, and (c) 6-h time lapse angle error (shaded; °) and magnitude error (contour; km) of the GCDM. |
The general information about the MRDM and GCDM errors in Table 3 shows that the magnitude error and angle error are related to the wind pattern. In case 2, both methods have the largest error, and in case 3, both methods have the least error. Unlike the prior non-iterative cases, the magnitude error of the GCDM, together with all the other errors, increases with the lapse time. For a lapse time of 1 h, the global mean distance errors of GCDM are 282.4, 380.2, and 56.8 m for cases 1, 2, and 3. The last mean distance error is a little larger than the preceding 300 m critical value. In general, the GCDM result is close to the trajectory of Temperton et al. (2001) at a timescale of 1 h. If a shorter time lapse is given, the trajectory of the GCDM is even closer to the trajectory of Temperton et al. (2001) than the MRDM. The magnitude and angle errors of the MRDM are about twice as large as the corresponding errors of the GCDM.
|
| Figure 14 As in Fig. 13, but for case 2. |
|
| Figure 15 As in Fig. 13, but for case 3. |
| ∆t (h) | Nair and Lauritzen (2010)
example |
MRDM | GCDM | ||
| MeanDE | MeanAE | MeanDE | MeanAE | ||
| 1 | 1 | 528.5 | 0.47 | 282.4 | 0.25 |
| 2 | 660.7 | 0.53 | 380.2 | 0.30 | |
| 3 | 101.6 | 0.16 | 56.8 | 0.09 | |
| 3 | 1 | 4769.1 | 1.39 | 2527.9 | 0.74 |
| 2 | 6017.4 | 1.58 | 3392.8 | 0.89 | |
| 3 | 949.1 | 0.45 | 497.8 | 0.24 | |
| 6 | 1 | 19106.3 | 2.76 | 9857.3 | 1.47 |
| 2 | 24652.8 | 3.10 | 13185.0 | 1.72 | |
| 3 | 4077.2 | 0.89 | 1936.7 | 0.48 | |
| 12 | 1 | 75476.7 | 5.38 | 35503.1 | 2.78 |
| 2 | 103740.6 | 6.31 | 47006.2 | 3.25 | |
| 3 | 18915.4 | 1.73 | 6964.5 | 0.91 | |
We investigated the one-step computation problem of trajectories on a sphere with and without iteration. For the non-iteration cases, the inhomogeneity error of the computation of displacement using the MRDM was shown to depend on the wind speed and direction and the latitude of the departure position. The error increases with wind speed and absolute latitude. The magnitude of the error and the direction difference has four- and two-wave patterns in the definition range of the wind direction. In terms of the general circulation of the atmosphere, the wind field has a pattern in which westerly wind bands alternate with easterly wind bands, especially at high levels. When the displacement is large, the displacement computed by the GCDM has a component toward the equator in pure westerly/easterly wind bands, but the MRDM ensures that the air particle moves along the circle of latitude in this situation. Thus, the general circulation of the atmosphere favors the MRDM through its circulation pattern. When the displacement is close to zero, the GCDM and MRDM give the same results under this extreme condition (Figs. 4, 6a, 7a). At the lower levels of the atmosphere, winds may occur with arbitrary directions, and the GCDM gives better results.
The clearest difference between the MRDM and GCDM is the dependence of the displacement error of the MRDM on the wind direction and the latitude location of the air particle. Under some special situations, the physical concepts of the GCDM and MRDM are similar and the displacements computed by the two methods are equivalent. The comparison between the GCDM and MRDM is thus a comparison between the physical figure of the MRDM under special and common situations. The comparison explains why the displacement error of the MRDM depends on the wind direction. The GCDM improves the MRDM by extending its physical figure from examples with a few special wind directions and locations to all wind directions and the global domain. The GCDM has a consistent physical figure and is a suitable reference method for assessing the inhomogeneity of the MRDM.
As the displacement computed by the MRDM is different in both magnitude error and angle differences from the GCDM, it is natural to ask under what conditions the MRDM can be used to compute the displacement. The MRDM can be used when the displacement is small and the region of displacement is far from the pole. The Courant number is a criterion for the legality of displacement computation (Kuo et al., 1985; Innocentini, 1999). The precondition is a Courant number that is much smaller than unity. In spherical coordinates, the meridional grid space decreases rapidly away the equator and the precondition is hard to satisfy at high latitudes. Thus, the MRDM has a polar singularity problem and the GCDM is an alternative method of computing the mean displacement in polar regions.
For the iterative cases, temporal variations in the analytical ideal wind fields are introduced to avoid interpolation errors. The magnitude errors and angle errors of the MRDM and GCDM with respect to the trajectories of Temperton et al. (2001) are compared. The results show that the GCDM is closer to the trajectories of Temperton et al. (2001) than the MRDM, their corresponding errors have a similar distribution pattern and the mean GCDM errors are half those of the MRDM. The lapse time is usually set to a critical value at which an air particle cannot move across more than one grid space. The chosen stream factor is 30 m s–1 and the 1-h displacement is about 108 km, which is on the scale of the ideal wind grid spaces near the equator. The error distribution with a lapse time of 6 h is given in the iterative section because the other three-time lapse examples have similar error distribution patterns.
The results of this study indicate that the curvilinear coordinate itself might be a source of error in trajectory models when the displacement is computed through a velocity resultant method (e.g., the MRDM). The error is not negligible in the region where at least one of the coordinates has a large curvature (e.g., the polar region of spherical coordinates) and/or the displacement is large. The GCDM is an alternative displacement computation method with less error than the MRDM and can be used to solve the trajectory at high latitudes.
Acknowledgments. The authors thank the anonymous reviewers for their thoughtful critiques and suggestions, which substantially improved the paper. The NCEP/NCAR reanalysis data are provided by the NOAA/OAR/ESRL PSD, Boulder, Colorado, USA, at www.esrl.noaa.gov/psd/.
| Bates, J. R., F. H. M. Semazzi, R. W. Higgins, et al., 1990: Integration of the shallow water equations on the sphere using a vector semi-Lagrangian scheme with a multigrid solver. Mon. Wea. Rev., 118, 1615–1627. DOI:10.1175/1520-0493(1990)118<1615:IOTSWE>2.0.CO;2 |
| Bowman, K. P., 1993: Large-scale isentropic mixing properties of the Antarctic polar vortex from analyzed winds. J. Geophys. Res., 98, 23013–23027. DOI:10.1029/93JD02599 |
| Bowman, K. P., and G. D. Carrie, 2002: The mean-meridional transport circulation of the troposphere in an idealized GCM. J. Atmos. Sci., 59, 1502–1514. DOI:10.1175/1520-0469(2002)059<1502:TMMTCO>2.0.CO;2 |
| Bowman, K. P., J. C. Lin, A. Stohl, et al., 2013: Input data requirements Lagrangian trajectory models. Bull. Amer. Meteor. Soc., 94, 1051–1058. DOI:10.1175/BAMS-D-12-00076.1 |
| Da Costa, M. V., and B. Blanke, 2004: Lagrangian methods for flow climatologies and trajectory error assessment. Ocean Model., 6, NOAA Technical Memorandum. ERL ARL-224. NOAA Air Resources Laboratory, Silver Spring, 25 pp. |
| Draxler, R. R., 1999: HYSPLIT_4 User’s Guide. NOAA Technical Memorandum. ERL ARL-230. NOAA Air Resources Laboratory, Silver Spring, 35 pp. (Available at www.arl.noaa.gov/documents/reports/hysplit_user_guide.pdf) |
| Draxler, R. R., and G. D. Hess, 1997: Description of the HYSPLIT_4 modeling system. NOAA Technical Memorandum. ERL ARL-224, NOAA Air Resources Laboratory, Silver Spring, 25 pp. |
| Draxler, R. R., and G. D. Hess, 1998: An overview of the HYSPLIT_4 modelling system for trajectories, dispersion, and deposition. Aust. Meteor. Mag., 47, 295–308. |
| Fei, J. F., P. F. Wang, X. P. Cheng, et al., 2014: A regional simulation study on dispersion of nuclear pollution from the damaged Fukushima nuclear power plant. Sci. China: Earth Sci., 57, 1513–1524. DOI:10.1007/s11430-013-4811-2 |
| Guo, J. P., T. Niu, F. Wang, et al., 2013: Integration of multi-source measurements to monitor sand-dust storms over North China: A case study. Acta Meteor. Sinica, 27, 566–576. DOI:10.1007/s13351-013-0409-z |
| Harris, J. M., and J. D. W. Kahl, 1994: Analysis of 10-day isentropic flow patterns for Barrow, Alaska: 1985–1992. J. Geophys. Res., 99, 25845–25855. DOI:10.1029/94JD02324 |
| Innocentini, V., 1999: A successive substitution method for the evaluation of trajectories approximating the parcel path by a linear function of space and time. Mon. Wea. Rev., 127, 1639–1650. DOI:10.1175/1520-0493(1999)127<1639:ASSMFT>2.0.CO;2 |
| Jones, A. R., D. J. Thomson, M. Hort, et al., 2007: The U.K. Met Office’s Next-Generation atmospheric dispersion model, NAME III. Air Pollution Modeling and Its Application XVII, Borrego, C., and A.-L. Norman, Eds., Springer, Heidelberg, 580–589. |
| Kalnay, E., M. Kanamitsu, R. Kistler, et al., 1996: The NCEP/NCAR 40-year reanalysis project. Bull. Amer. Meteor. Soc., 77, 437–472. DOI:10.1175/1520-0477(1996)077<0437:TNYRP>2.0.CO;2 |
| Kuo, Y.-H., M. Skumanich, P. L. Haagenson, et al., 1985: The accuracy of trajectory models as revealed by the observing system simulation experiments. Mon. Wea. Rev., 113, 1852–1867. DOI:10.1175/1520-0493(1985)113<1852:TAOTMA>2.0.CO;2 |
| Li, L. T., and A. J. Dolman, 2016: A synoptic overview and moisture trajectory analysis of the " 7.21” heavy rainfall event in Beijing. J. Meteor. Res., 30, 103–116. DOI:10.1007/s13351-016-5052-z |
| Lin, J. C., C. Gerbig, S. C. Wofsy, et al., 2003: A near-field tool for simulating the upstream influence of atmospheric observations: The stochastic time-inverted Lagrangian transport (STILT) model. J. Geophys. Res., 108, 4493. DOI:10.1029/2002JD003161 |
| Melvin, T., M. Dubal, N. Wood, et al., 2010: An inherently mass-conserving iterative semi-implicit semi-Lagrangian discretization of the non-hydrostatic vertical-slice equations. Quart. J. Roy. Meteor. Soc., 136, 799–814. DOI:10.1002/qj.603 |
| Nair, R. D., and P. H. Lauritzen, 2010: A class of deformational flow test cases for linear transport problems on the sphere. J. Computat. Phys., 229, 8868–8887. DOI:10.1016/j.jcp.2010.08.014 |
| Notaro, M., F. Alkolibi, E. Fadda, et al., 2013: Trajectory analysis of Saudi Arabian dust storms. J. Geophys. Res. Atmos., 118, 6028–6043. DOI:10.1002/jgrd.50346 |
| Qin, R., Sen Gupta X., and van Sebille A., 2015: Variability in the origins and pathways of Pacific equatorial undercurrent water. J. Geophys. Res. Oceans, 120, 3113–3128. DOI:10.1002/2014JC010549 |
| Riddle, E. E., P. B. Voss, A. Stohl, et al., 2006: Trajectory model validation using newly developed altitude-controlled balloons during the international consortium for atmospheric research on transport and transformations 2004 campaign. J. Geophys. Res., 111, D23S57. DOI:10.1029/2006JD007456 |
| Ritchie, H., and C. Beaudoin, 1994: Approximations and sensitivity experiments with a baroclinic semi-Lagrangian spectral model. Mon. Wea. Rev., 122, 2391–2399. DOI:10.1175/1520-0493(1994)122<2391:AASEWA>2.0.CO;2 |
| Scheele, M. P., and P. C. Siegmund, 2001: Estimating errors in trajectory forecasts using ensemble predictions. J. Appl. Meteor., 40, 1223–1232. DOI:10.1175/1520-0450(2001)040<1223:EEITFU>2.0.CO;2 |
| Scheele, P., C. Siegmund M., and F. J. van Velthoven P., 1996: Sensitivity of trajectories to data resolution and its dependence on the starting point: In or outside a tropopause fold. Meteor. Appl., 3, 267–273. |
| Shchekinova, E. Y., Y. Kumkar, and G. Coppini, 2016: Numerical reconstruction of trajectory of small-size surface drifter in the Mediterranean Sea. Ocean Dyn., 66, 153–161. DOI:10.1007/s10236-015-0916-9 |
| Smith, K. M., P. E. Hamlington, and B. Fox-Kemper, 2016: Effects of submesoscale turbulence on ocean tracers. J. Geophys. Res. Oceans, 121, 908–933. DOI:10.1002/2015JC011089 |
| Staniforth, A., A. White A., and Wood N., 2010: Treatment of vector equations in deep-atmosphere, semi-Lagrangian models. I: Momentum equation. Quart. J. Roy. Meteor. Soc., 136, 497–506. DOI:10.1002/qj.562 |
| Stohl, A., 1998: Computation, accuracy, and applications of trajectories—A review and bibliography. Atmos. Environ., 32, 947–966. DOI:10.1016/S1352-2310(97)00457-3 |
| Stohl, A., L. Haimberger, M. P. Scheele, et al., 2001: An intercomparison of results from three trajectory models. Meteor. Appl., 8, 127–135. DOI:10.1017/S1350482701002018 |
| Stohl, A., C. Forster, A. Frank, et al., 2005: Technical note: The Lagrangian particle dispersion model FLEXPART version 6.2. Atmos. Chem. Phys., 5, 2461–2474. DOI:10.5194/acp-5-2461-2005 |
| Stohl, A., P. Seibert, G. Wotawa, et al., 2012: Xenon-133 and caesium-137 releases into the atmosphere from the Fukushima Dai-ichi nuclear power plant: Determination of the source term, atmospheric dispersion, and deposition. Atmos. Chem. Phys., 12, 2313–2343. DOI:10.5194/acp-12-2313-2012 |
| Temperton, C., M. Hortal, and A. Simmons, 2001: A two-time-level semi-Lagrangian global spectral model. Quart. J. Roy. Meteor. Soc., 127, 111–127. DOI:10.1002/qj.49712757107 |
| Trusilova, Rödenbeck, Gerbig K., et al., 2010: Technical note: A new coupled system for global-to-regional downscaling of CO2 concentration estimation . Atmos. Chem. Phys., 10, 3205–3213. DOI:10.5194/acp-10-3205-2010 |
| van, Sebille, Sprintall E., U. Schwarzkopf J., et al., 2014: Pacific-to-Indian Ocean connectivity: Tasman leakage, Indonesian Throughflow, and the role of ENSO. J. Geophys. Res. Oceans, 119, 1365–1382. DOI:10.1002/2013JC009525 |
| Webster, H. N., D. J. Thomson, B. T. Thomson, et al., 2012: Operational prediction of ash concentrations in the distal volcanic cloud from the 2010 Eyjafjallajökull eruption. J. Geophys. Res., 117, D00U08. DOI:10.1029/2011JD016790 |
| Wernli, B. H., and H. C. Davies, 1997: A Lagrangian-based analysis of extratropical cyclones. I: The method and some applications. Quart. J. Roy. Meteor. Soc., 123, 467–489. DOI:10.1002/(ISSN)1477-870X |
| Wood, N., A. A. White, and A. Staniforth, 2010: Treatment of vector equations in deep-atmosphere, semi-Lagrangian models. II: Kinematic equation. Quart. J. Roy. Meteor. Soc., 136, 507–516. DOI:10.1002/qj.565 |
| Zhang, C., and Q. Li, 2014: Tracking the moisture sources of an extreme precipitation event in Shandong, China in July 2007: A computational analysis. J. Meteor. Res., 28, 634–644. DOI:10.1007/s13351-014-3084-9 |
 2017, Vol. 31


