The Chinese Meteorological Society
Article Information
- NATH, Debashis, Wen CHEN, and Xiaoqing LAN, 2017.
- Long-Term Trend in Potential Vorticity Intrusion Events over the Pacific Ocean: Role of Global Mean Temperature Rise. 2017.
- J. Meteor. Res., 31(5): 906-915
- http://dx.doi.org/10.1007/s13351-017-7021-6
Article History
- Received February 13, 2017
- in final form August 14, 2017
Subtropical Rossby wave breakings and the equatorward transport of stratospheric dry air have a significant impact on the dynamics of the tropics, particularly in the Pacific Ocean (Waugh and Polvani, 2000). Usually, the westerly ducts in the equatorial upper troposphere (UT; approximately 200 hPa) are the preferred locations for the stratosphere–troposphere interactions (Waugh and Polvani, 2000), particularly in the Pacific Ocean and during December–March (winter to spring months). A similar duct can be seen over the Atlantic Ocean; however, it is much weaker than the Pacific one. Rossby wave propagation is predominant within the westerlies, and wave breaking takes place if the amplitude is sufficiently large (McIntyre and Palmer, 1983). This will reduce the equatorial mixing and propagation of air masses in the meridional plane (Waugh et al., 1994; Brunet and Haynes, 1996). These wave breakings can be mapped on the potential vorticity (PV) field with high PV tongues intruding along the extratropical tropopause (Kiladis and Weickmann, 1992). These subtropical intrusions transport stratospheric air deep and will affect the budget of UT ozone, water vapor, and other trace constituents (Waugh and Polvani, 2000). Over the central–eastern Pacific Ocean, these PV intrusions can trigger deep convection in the tropics and are linked with the variability in ozone concentration near the subtropical tropopause.Waugh and Funatsu (2003) and Waugh (2005) analyzed the impact of intrusions on convection, tropospheric ozone distribution, and subtropical humidity, using outgoing longwave radiation, Hilo ozonesonde, and Microwave Limb Sounder satellite measurements, respectively.
Using NCEP–NCAR reanalysis data, Waugh and Polvani (2000) showed that the intrusions occur predominantly within the westerly ducts in the Pacific and the Atlantic oceans. On the interannual timescale, the intrusion frequency over the Pacific Ocean correlates strongly with the Niño3.4 index. The occurrence is lower (higher) during El Niño (La Niña), with weaker (stronger) westerly ducts in the equatorial UT. The correlation coefficient between the number of PV intrusion events and the Niño3.4 index is –0.84 (Waugh and Polvani, 2000), with stronger westerlies in the cold phase of ENSO and vice versa in the warm phase. Additionally, the interannual variability of the subtropical jet (STJ) further modulates the magnitude and frequency of the subtropical intrusion events. Nath et al. (2016) showed that the intrusion frequency has increased monotonously in recent decades and that the distribution shifted westwards towards the tropical central Pacific Ocean. The long-term trend becomes clearer once ENSO is linearly removed from the intrusion time series. The increased frequency of the intrusion events are closely related to the decadal trend in equatorial westerly ducts and the STJ, which result from the SST warming in the western Pacific Ocean and the cooling in the tropical central–eastern Pacific Ocean, respectively (Ashok et al., 2007; Zhang et al., 2010).
In recent decades, the Pacific Ocean has undergone several dynamical changes. On the interdecadal timescale, the Pacific SST experienced a shift during 1976/77 (Miller et al., 1994; Wang, 1995), and this regime shift was associated with a significant warming and cooling in the tropics and the midlatitudes, respectively. The equatorial Pacific Ocean then experienced another regime shift around 1998/99 (e.g., McPhaden et al., 2011), and the El Niño warming center has shifted from the tropical eastern to the central Pacific Ocean (Chung and Li, 2012; Xiang et al., 2013). These interdecadal changes in the SST drive long-term changes in tropical circulations (i.e., Walker and Hadley circulations) and the UT zonal wind across the Pacific Ocean.
In the Pacific Ocean, the Walker circulation overturns large-scale tropical air masses with rising motion over Indonesia (low sea level pressure) and sinking motion over the eastern Pacific (high sea level pressure) (Bjerknes, 1969; Gill, 1980). Changes in the Pacific Walker circulation anomalies can be attributed to the variabilities in position and intensity of SST in the tropics (Horel and Wallace, 1981; Kousky et al., 1984). Interannual variability of the Walker circulation is linked with ENSO; however, its longer-term trend could be driven by anthropogenic climate change (Vecchi et al., 2006; Tokinaga et al., 2012). One argument is that on the multi-decadal timescale, the strengthening of the Walker circulation is linked with the global mean temperature rise due to anthropogenic warming (L’Heureux et al., 2013).
On the other hand, the strength of the STJ is determined by the Hadley circulation, which has diverse characteristics in different geographical locations. Warm and moist air rises upwards in the western Pacific Ocean, then diverges to either side of the equator and descends in the subtropics (Wang, 2005). On the contrary, the situation is opposite in the central–eastern Pacific Ocean. The upper branch of the Hadley circulation, i.e., at 200 hPa, conserves the angular momentum as air masses spiral inwards toward the earth’s axis of rotation, dumping angular momentum into the STJ stream. The Hadley circulation determines the strength of the subtropical jet (STJ) and STJ is important for the PV intrusions. Therefore, the strength of Hadley circulation over western Pacific and central–eastern Pacific is related to the upper tropospheric STJ, which controls the frequency of the PV intrusions to a great extent. Discussion on the Hadley circulation helps to understand how SST may influence the Hadley circulation and hence the STJ on regional scale.
The previous study (Nath et al., 2016) stated a long-term increasing trend in UT zonal wind and PV intrusions; however, it remains unclear whether the long-term trend is driven by the natural internal climatic variability, e.g., Pacific Decadal Oscillation (PDO), or anthropogenic climate change. It is very challenging to separate the natural variability and anthropogenic warming trend from the observation data or from a single model simulation. It is essential to have large ensemble datasets with different initial values and identical radiative forcings.
In the present study, we investigate the role of global mean temperature rise, which may have driven the long-term increasing trend in PV intrusion frequency over the Pacific Ocean, using several reanalysis datasets and general circulation model simulation results. As mentioned before, the interannual variability of PV intrusion frequency is strongly linked with the ENSO, and by applying an ENSO fit and 1–7-yr filtering, we reduce the contribution of ENSO to a greater extent (refer to Section 2.2). Therefore, the residual timeseries largely contains the contribution from the external forcing factors, which may be linked with anthropogenic warming and related to global mean temperature rise. Section 2 describes the data and methods used. The results are analyzed in Section 3, and conclusions are given in Section 4.
2 Data and methodology 2.1 DataFor daily PV analysis (200-hPa/350-K isentropic level), we use the 40-yr ECMWF Re-Analysis (ERA-40; Uppala et al., 2005), Interim ECMWF Re-Analysis (ERA-Interim; Dee and Uppala, 2009), NCEP-1 (Kalnay et al., 1996), 55-yr Japanese Reanalysis Project (JRA-55; Kobayashi et al., 2015), and 25-yr Japanese Reanalysis Project (JRA-25; Onogi et al., 2007) data. For UT (200-hPa/350-K isentropic level) wind analysis, we use monthly mean ERA-40 (1958–2002), ERA-Interim (1979–2012), NCEP-1 (1958–2012), JRA-55 (1958–2012), JRA-25 (1979–2012), MERRA (Modern-Era Retrospective Analysis for Research and Applications; 1979–2012; Rienecker et al., 2011), 20CR (20th Century Reanalysis; 1958–2012; Compo et al., 2011), and CFSR (Climate Forecast System Reanalysis; 1958–2007; Saha et al., 2010) data. Additionally, to compare with model-based reanalysis data, we use ECHAM5 (a general circulation model developed by the Max Planck Institute) (1958–2007; Roeckner et al., 2003) data. For global mean surface temperature, we use data from the land and ocean merged datasets of the Goddard Institute of Space Studies (GISS) surface temperature (GISTEMP), Hadley Center Global Sea Ice and Sea Surface Temperature (HadISST), and National Oceanic and Atmospheric Administration Extended Reconstructed Sea Surface Temperature (ERSST.v3b). More details on the data are available in L’Heureux et al. (2013).
2.2 MethodsFirstly, the subtropical intrusions are defined from the PV field at 200 hPa and for each of the reanalysis datasets (with |PV| > 2 PVU over 10°N–10°S; 1 PVU = 10 –6 K s2 kg–1). More details on the method can be found in Nath et al. (2016). The Pacific intrusions are then characterized by the number of events within 150°E–80°W.
Secondly, least-squares linear regression is performed on the intrusion frequency and zonal wind, based on Nath et al. (2016). Decadal trends are estimated for all the reanalysis datasets and over the entire available time period. We detrended the PV intrusion frequency and global mean temperature by removing the mean from the timeseries. Then, the residual time series uncorrelated with ENSO is extracted by subtracting the ENSO fitted (i.e. part of intrusion timeseries correlated with Niño3.4) time series from the actual one (L’Heureux et al., 2013). In the next step, we applied a 1–7-yr smoothing polynomial filtering (order 2) on the residual timeseries, which further reduced the contribution of ENSO to a greater extent. Therefore, the residual timeseries largely contains the contribution from the external forcing factors, which is linked with anthropogenic warming.
Finally, to obtain the dominant orthogonal modes of UT zonal wind, empirical orthogonal function (EOF) analysis (North, 1984) is employed and applied to the nine datasets. The first principal component (PC1) time series is standardized by dividing the mean-removed trend by the standard deviation. The variance explained by PC1 is expressed as a percentage. The equations related to the linear fit, trend analysis, ENSO fit, and EOF analysis can be referred to in Nath et al. (2016).
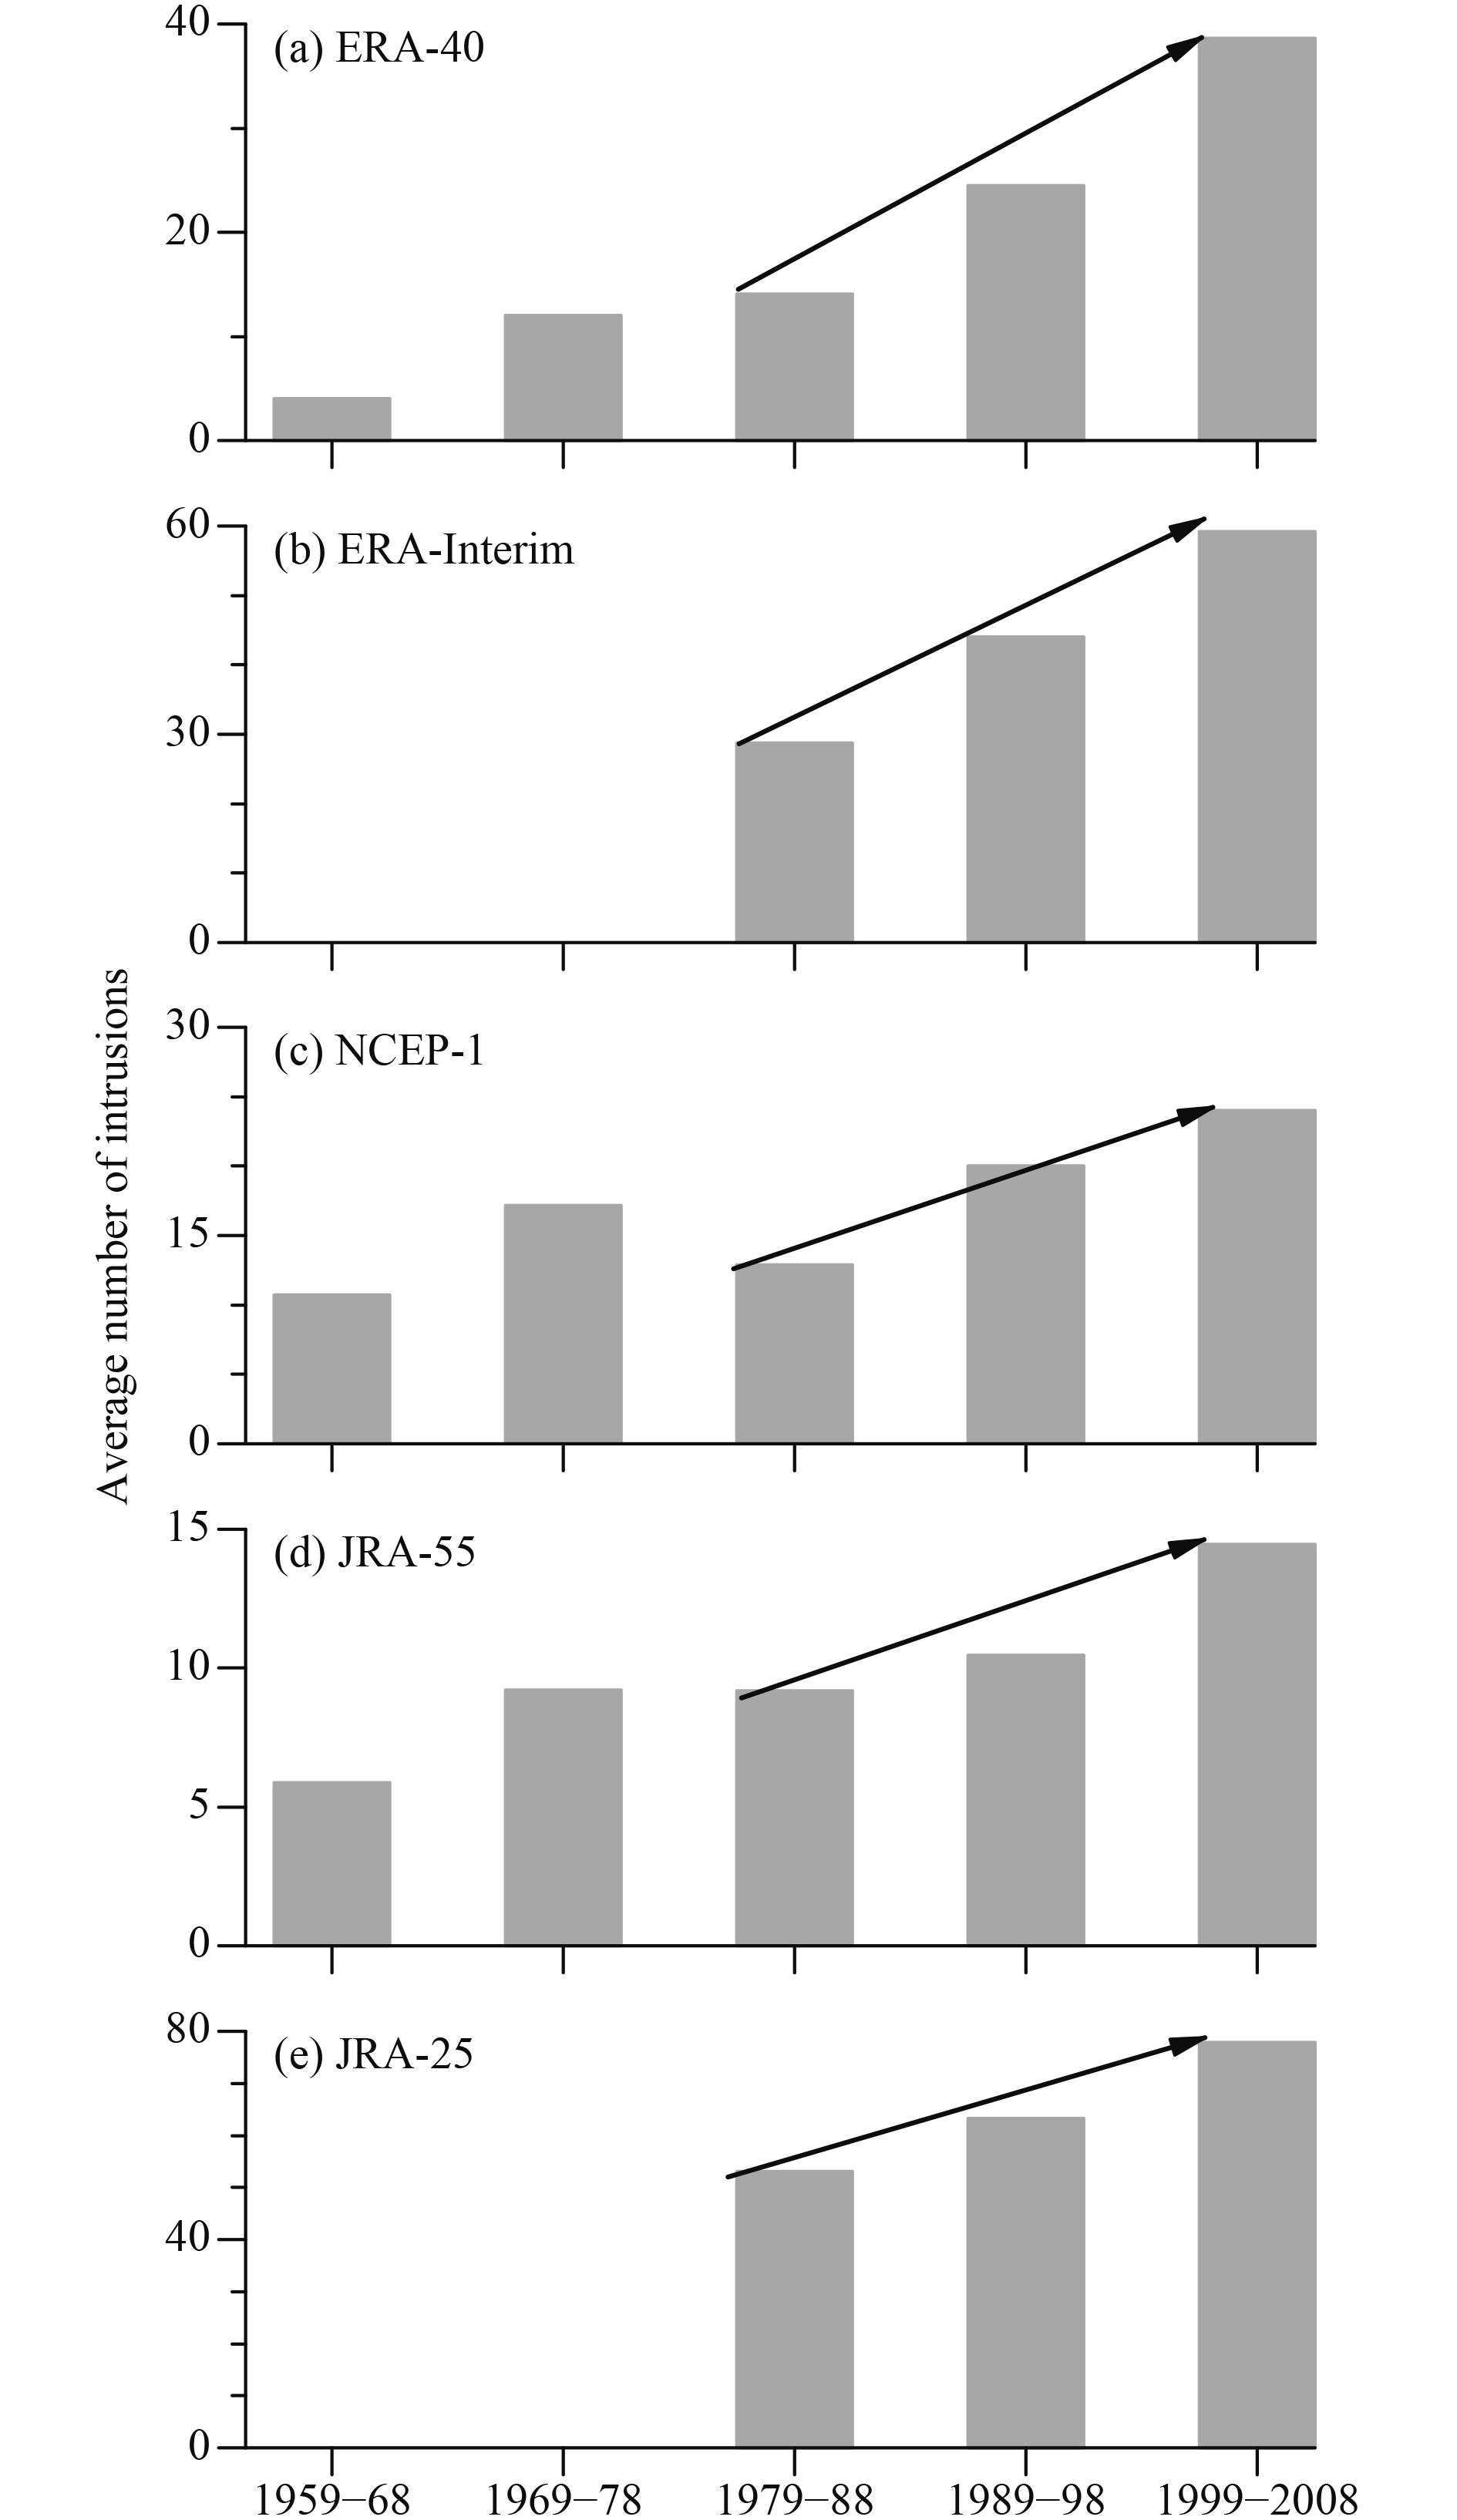
3 Results 3.1 Long-term trends of PV intrusion eventsOver the Pacific Ocean, Nath et al. (2016) reported an increasing trend in the PV intrusion frequencies. The increasing trend in the subtropical intrusion frequency per decade is unequivocal in the five reanalysis products (ERA-40, ERA-Interim, NCEP-1, JRA-55, and JRA-25), and over five distinct time frames (1959–68, 1969–78, 1979–88, 1989–98, and 1999–2002/12). The long-term trends in PV intrusion frequency for each of the above five datasets are shown in Figs. 1a–e, respectively.
|
| Figure 1 Decadal trend of the winter (December–March) mean number of PV intrusions over the Pacific Ocean, based on (a) ERA-40, (b) ERA-Interim, (c) NCEP-1, (d) JRA-55, and (e) JRA-25. |
In the UT, due to stronger equatorial westerly wind and weaker STJ, the number of Pacific PV intrusions is less during El Niño and more during La Niña years. Apart from the interannual variability, the intrusion frequencies exhibit a strong increasing trend on the longer time-scale. The long-term trend becomes clearer once the variability due to ENSO is removed linearly from the original time series (Nath et al., 2016). The ENSO uncorrelated residual time series shows a consistent increasing trend (between 1979 and 2012) in all five datasets, particularly at 10°N. The intrusion frequency at 10°N exhibits a long-term increase of 6.1, 6.0, 4.0, 1.8, and 4.9 (10 yr)–1 from the above five reanalysis datasets (Nath et al., 2016).
The increasing trend in PV intrusion frequency is linked with the interdecadal trend in UT zonal wind over the tropics (Nath et al., 2016). The strengthening and weakening of the westerly duct and the STJ are driven by the SST warming in the western Pacific Ocean and cooling in the eastern Pacific Ocean, respectively (e.g., Ashok et al., 2007; Zhang et al., 2010). However, the exact mechanism driving the long-term trend is unexplored, i.e., the role of natural climatic variability versus anthropogenic global warming is unknown. On the multi-decadal timescale, the Walker circulation exhibits a strengthening trend (L’Heureux et al., 2013) and the features resemble a La Niña–type circulation in the Pacific Ocean. This multi-decadal strengthening in the Walker circulation is consistent with the global mean temperature rise and is closely associated with the strengthening in UT zonal wind and intrusion frequency over the Pacific Ocean.
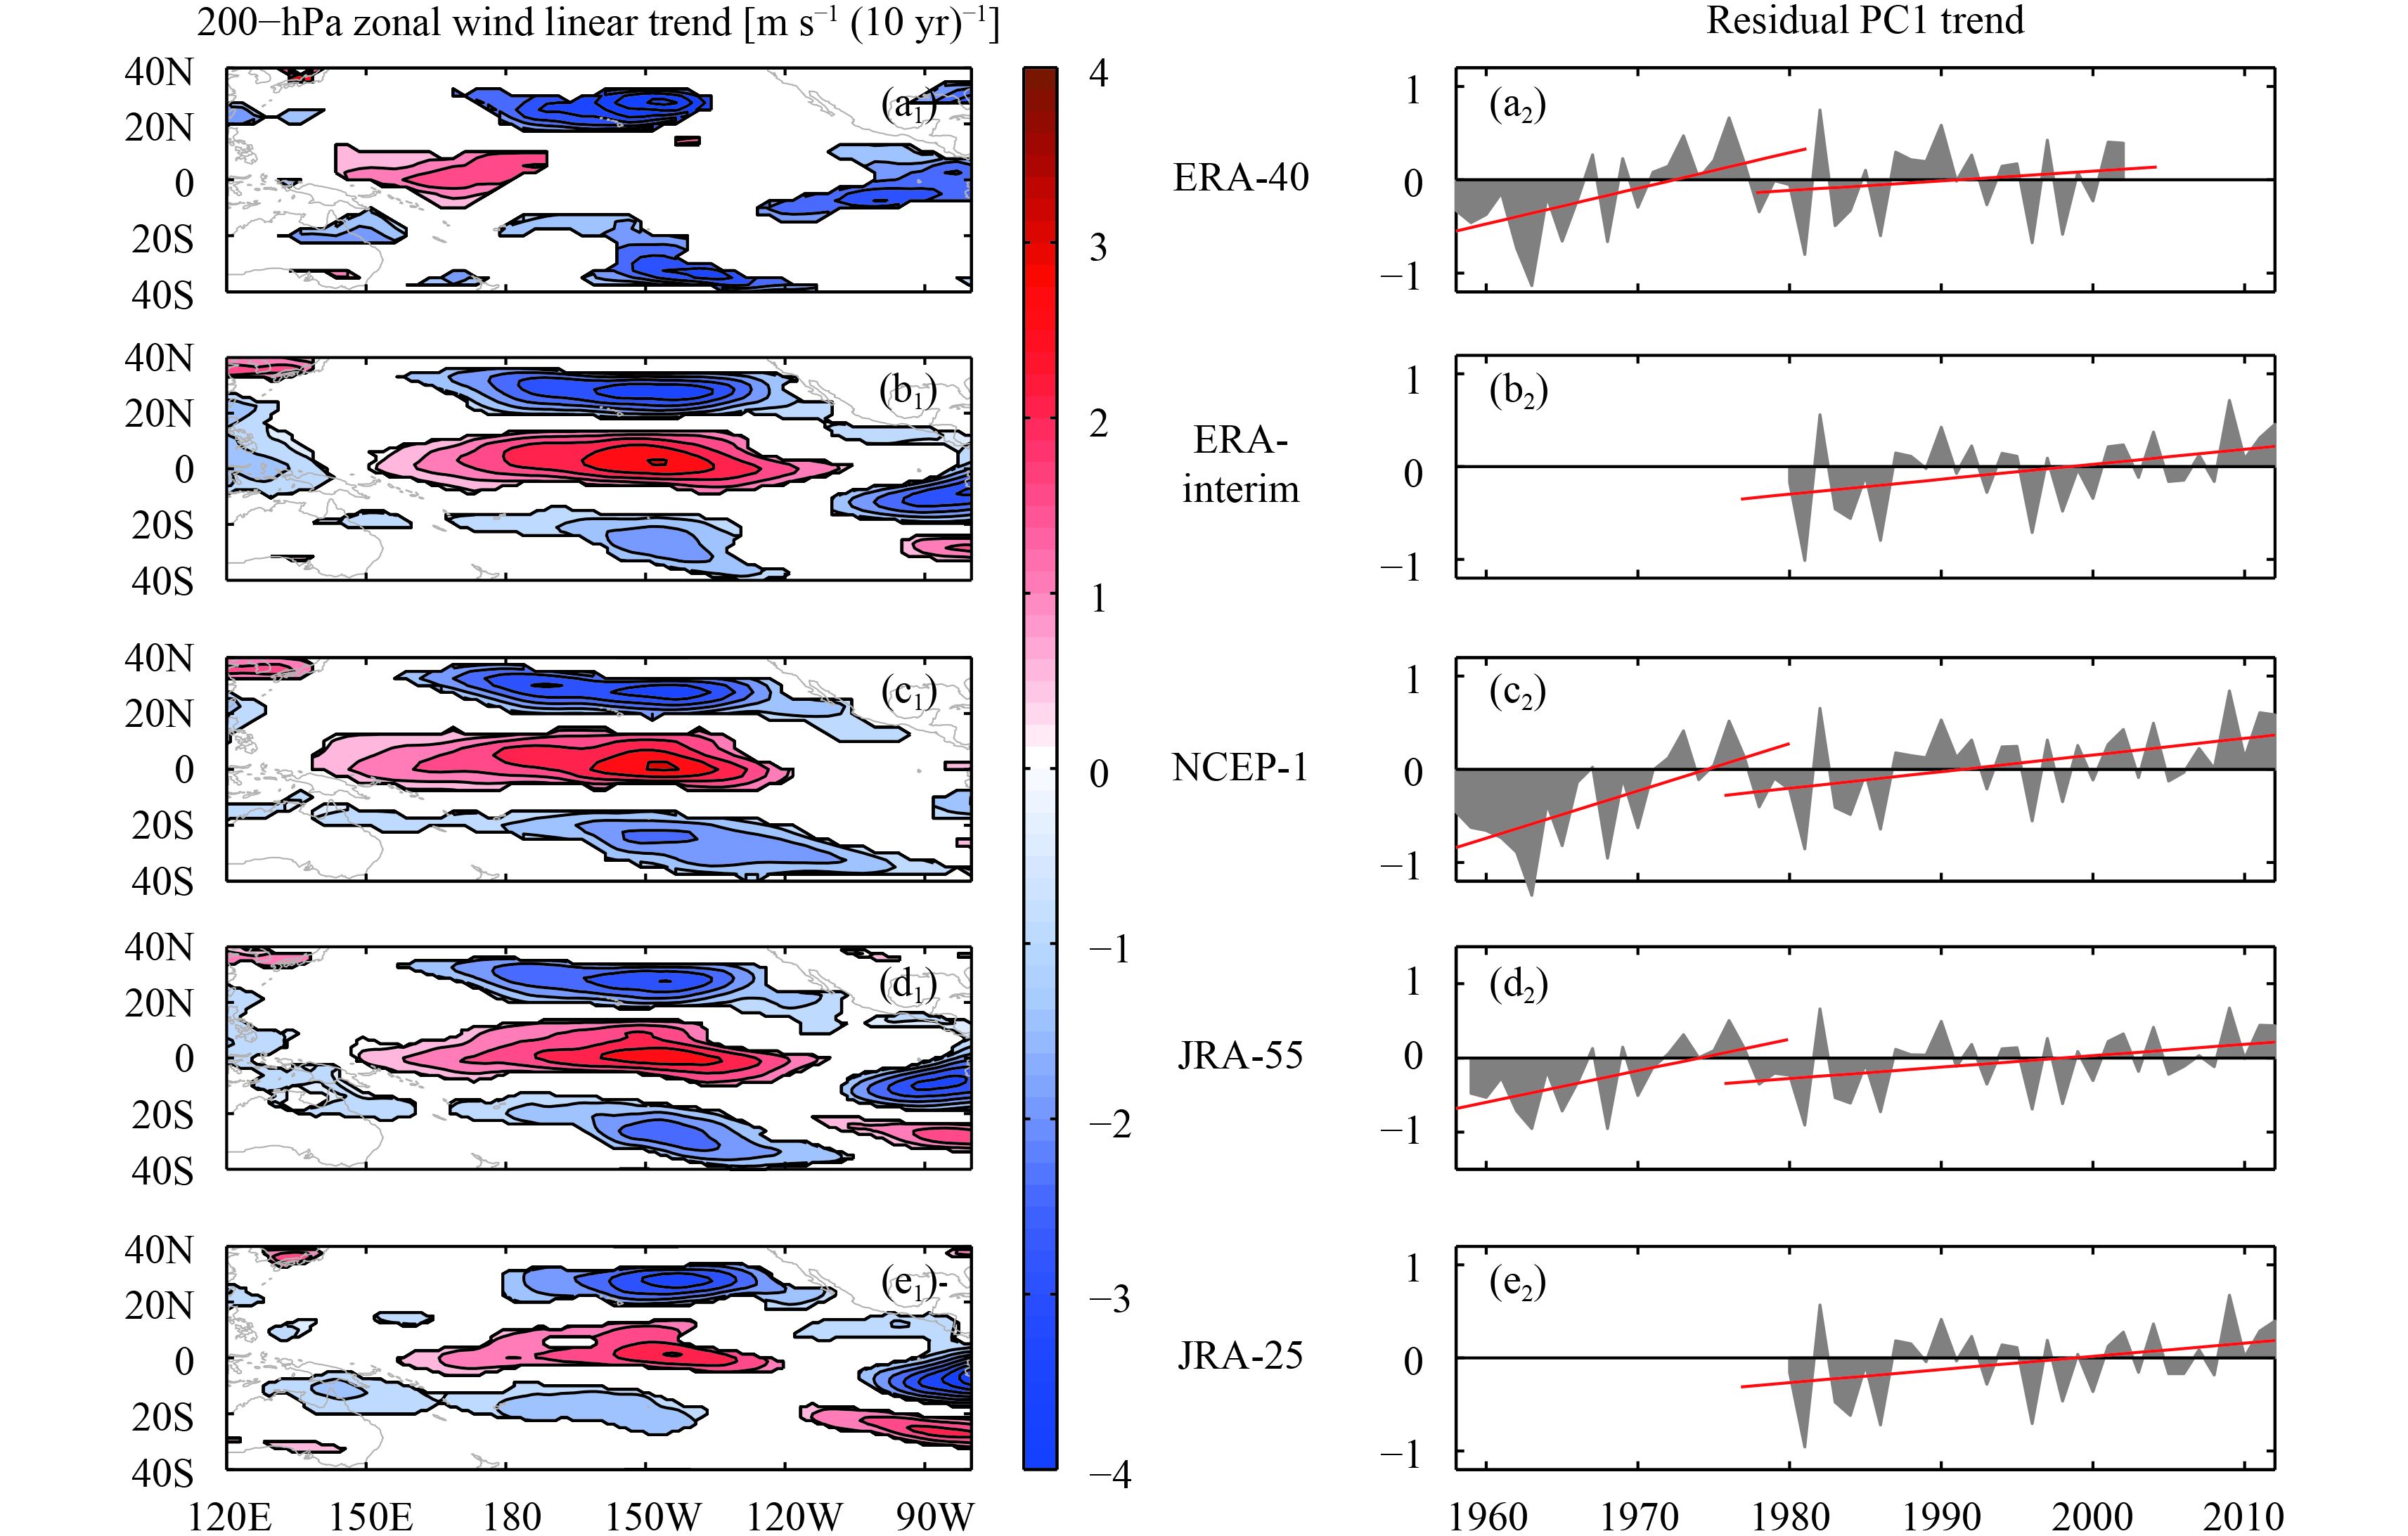
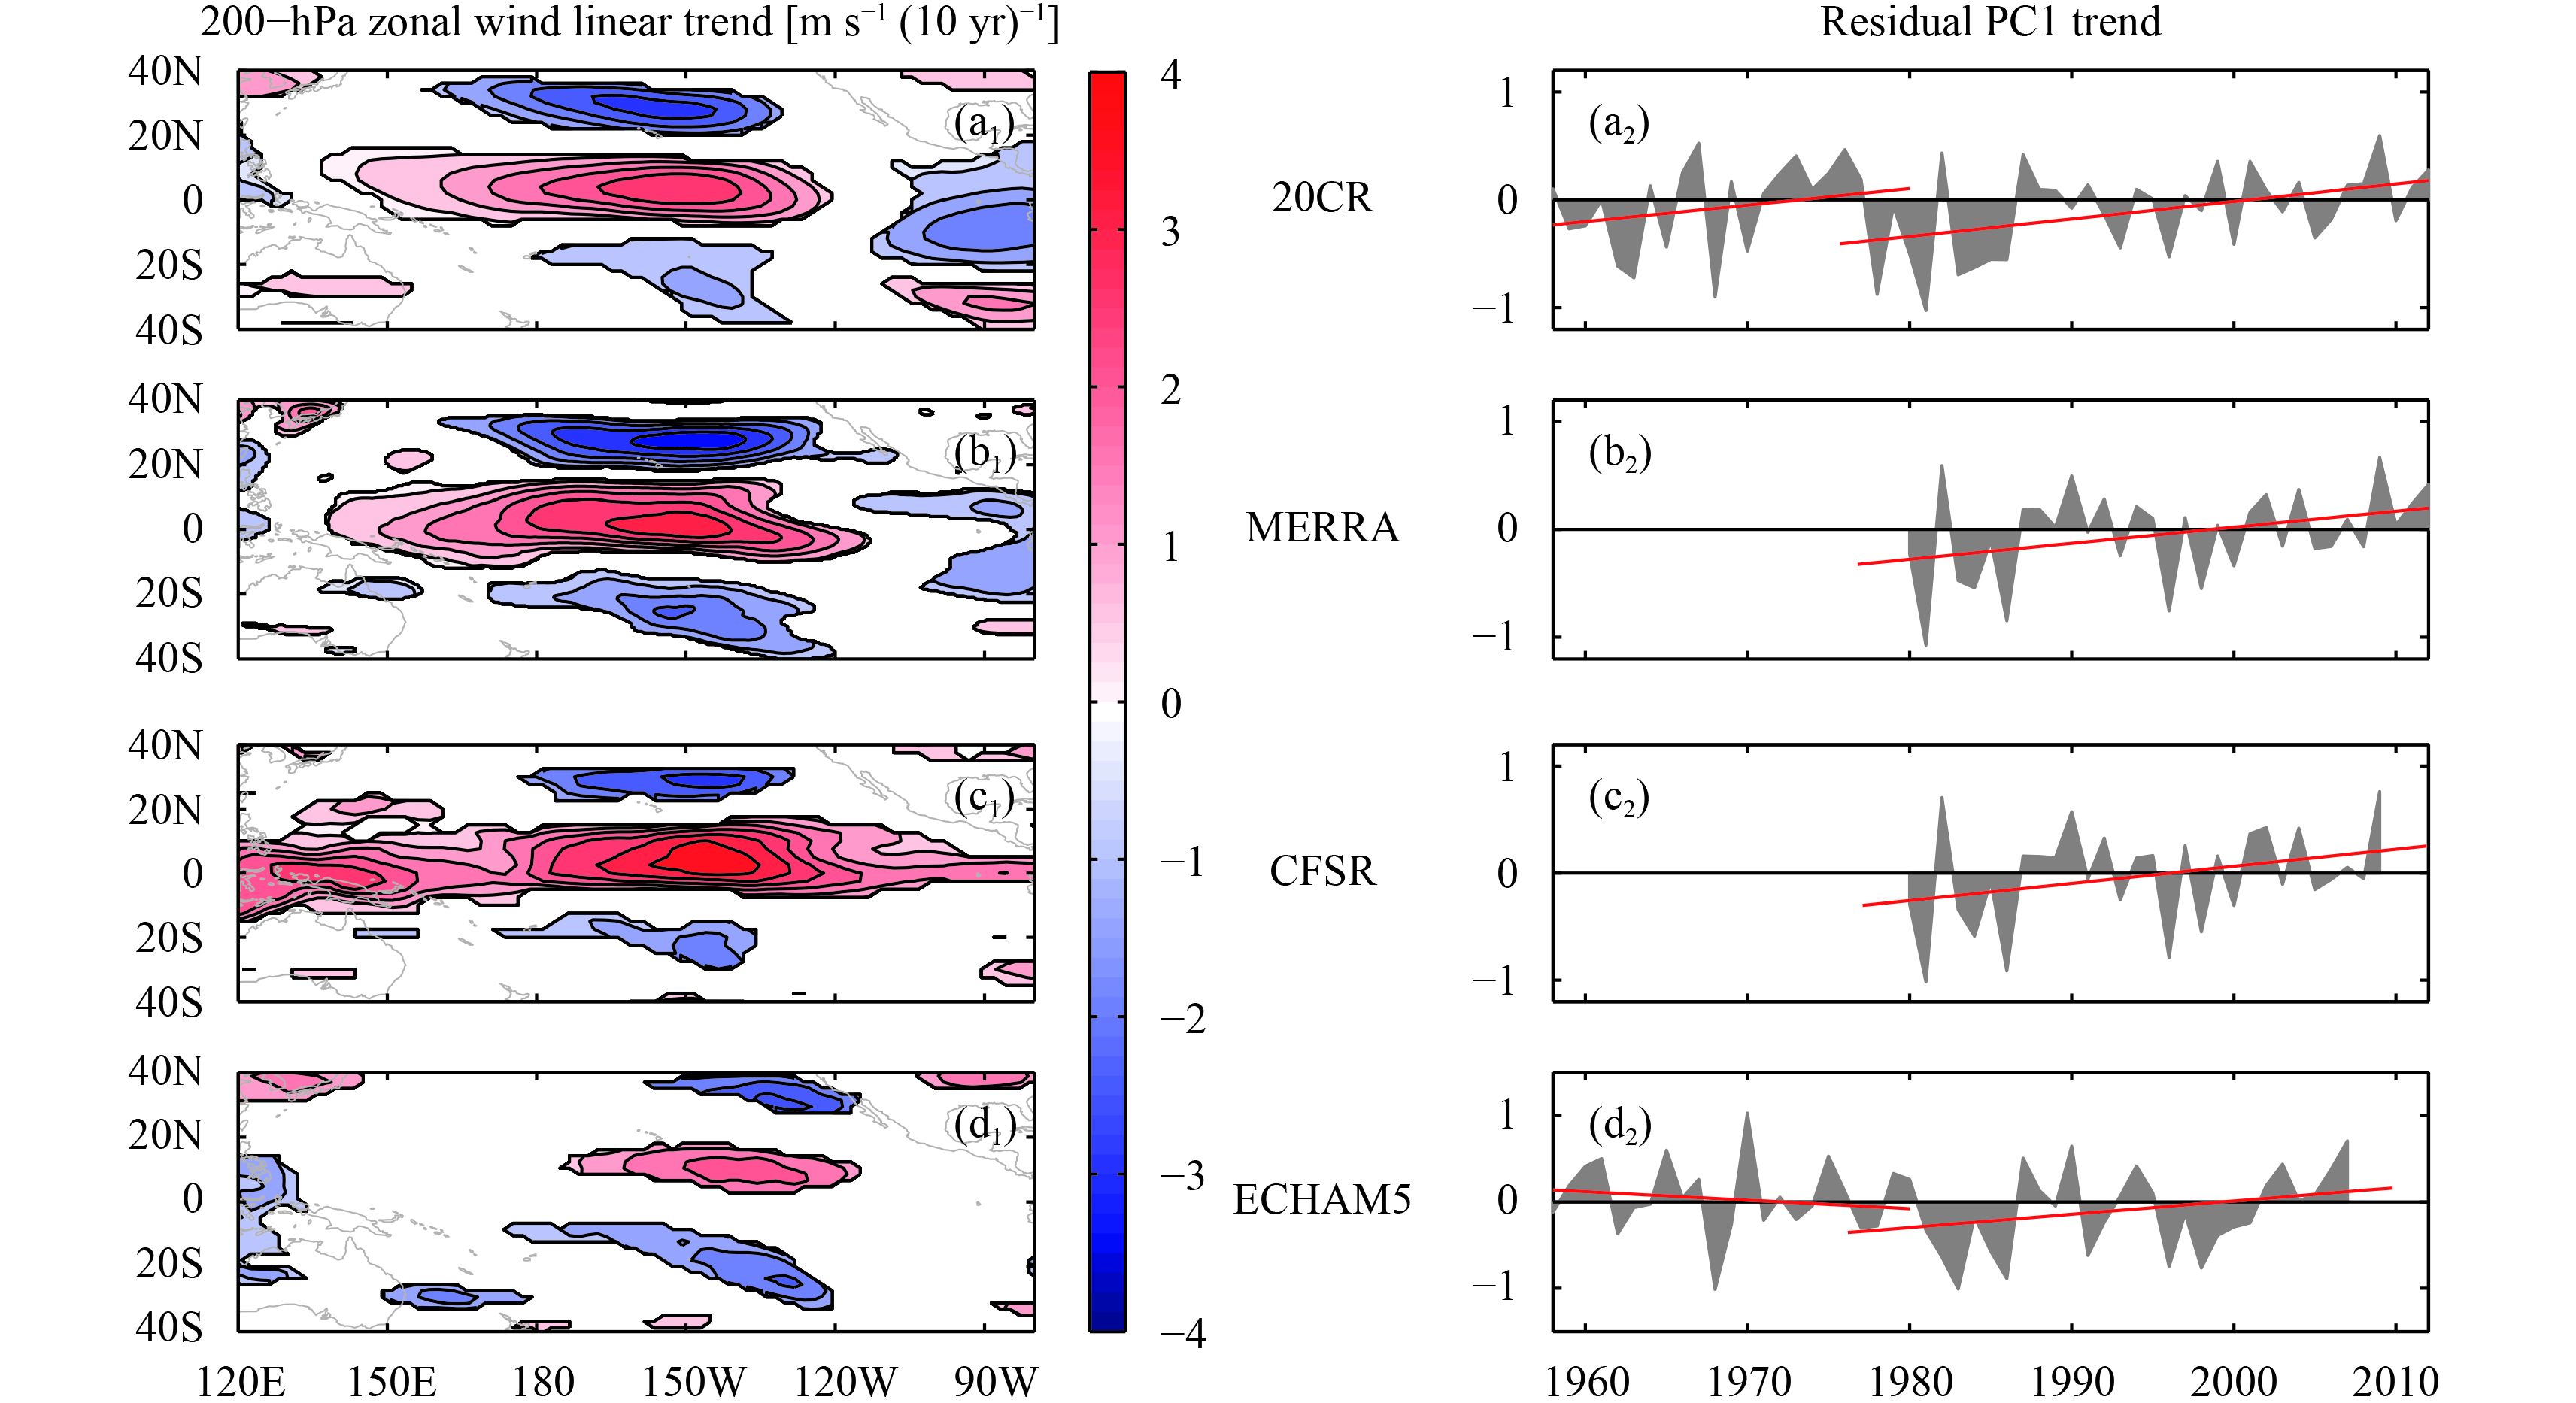
3.2 Long-term trend in UT zonal wind and EOF analysisThe winter mean long-term zonal wind trends (1979–2002/12) in the UT are shown in the left-hand panels of Fig. 2 for ERA-40, ERA-Interim, NCEP-1, JRA-55, and JRA-25. In the central Pacific Ocean, the STJ and the equatorial westerly duct exhibit a weakening and strengthening trend, respectively, and the tendency is unequivocal and consistent in all the reanalysis datasets. Moreover, 20CR, MERRA, CFSR, and ECHAM5 simulations display a similar trend (Fig. 3, left-hand panels). Therefore, in the last quarter of the 20th century, the Walker circulation and regional Hadley circulation over the Pacific Ocean drove an overall strengthening of the westerly duct and weakening of the STJ, respectively, and the results are robust in all of the datasets.
|
| Figure 2 Winter (December–March) mean trend (> 95% significance) in UT wind (left-hand panels) and PC1 (right-hand panels; 40°S–40°N, 120°E–80°W), based on (a1, a2) ERA-40, (b1, b2) ERA-Interim, (c1, c2) NCEP-1, (d1, d2) JRA-55, and (e1, e2) JRA-25. The red lines in the right-hand panels indicate the pre-1979 and post-1979 trend, separately. |
|
| Figure 3 Winter (December–March) mean trend (> 95% significance) in UT wind (left-hand panels) and PC1 (right-hand panels; 40°S–40°N, 120°E–80°W), based on (a1, a2) 20CR, (b1, b2) MERRA, (c1, c2) CFSR, and (d1, d2) ECHAM5. The red lines in the right-hand panels indicate the pre-1979 and post-1979 trend, separately. |
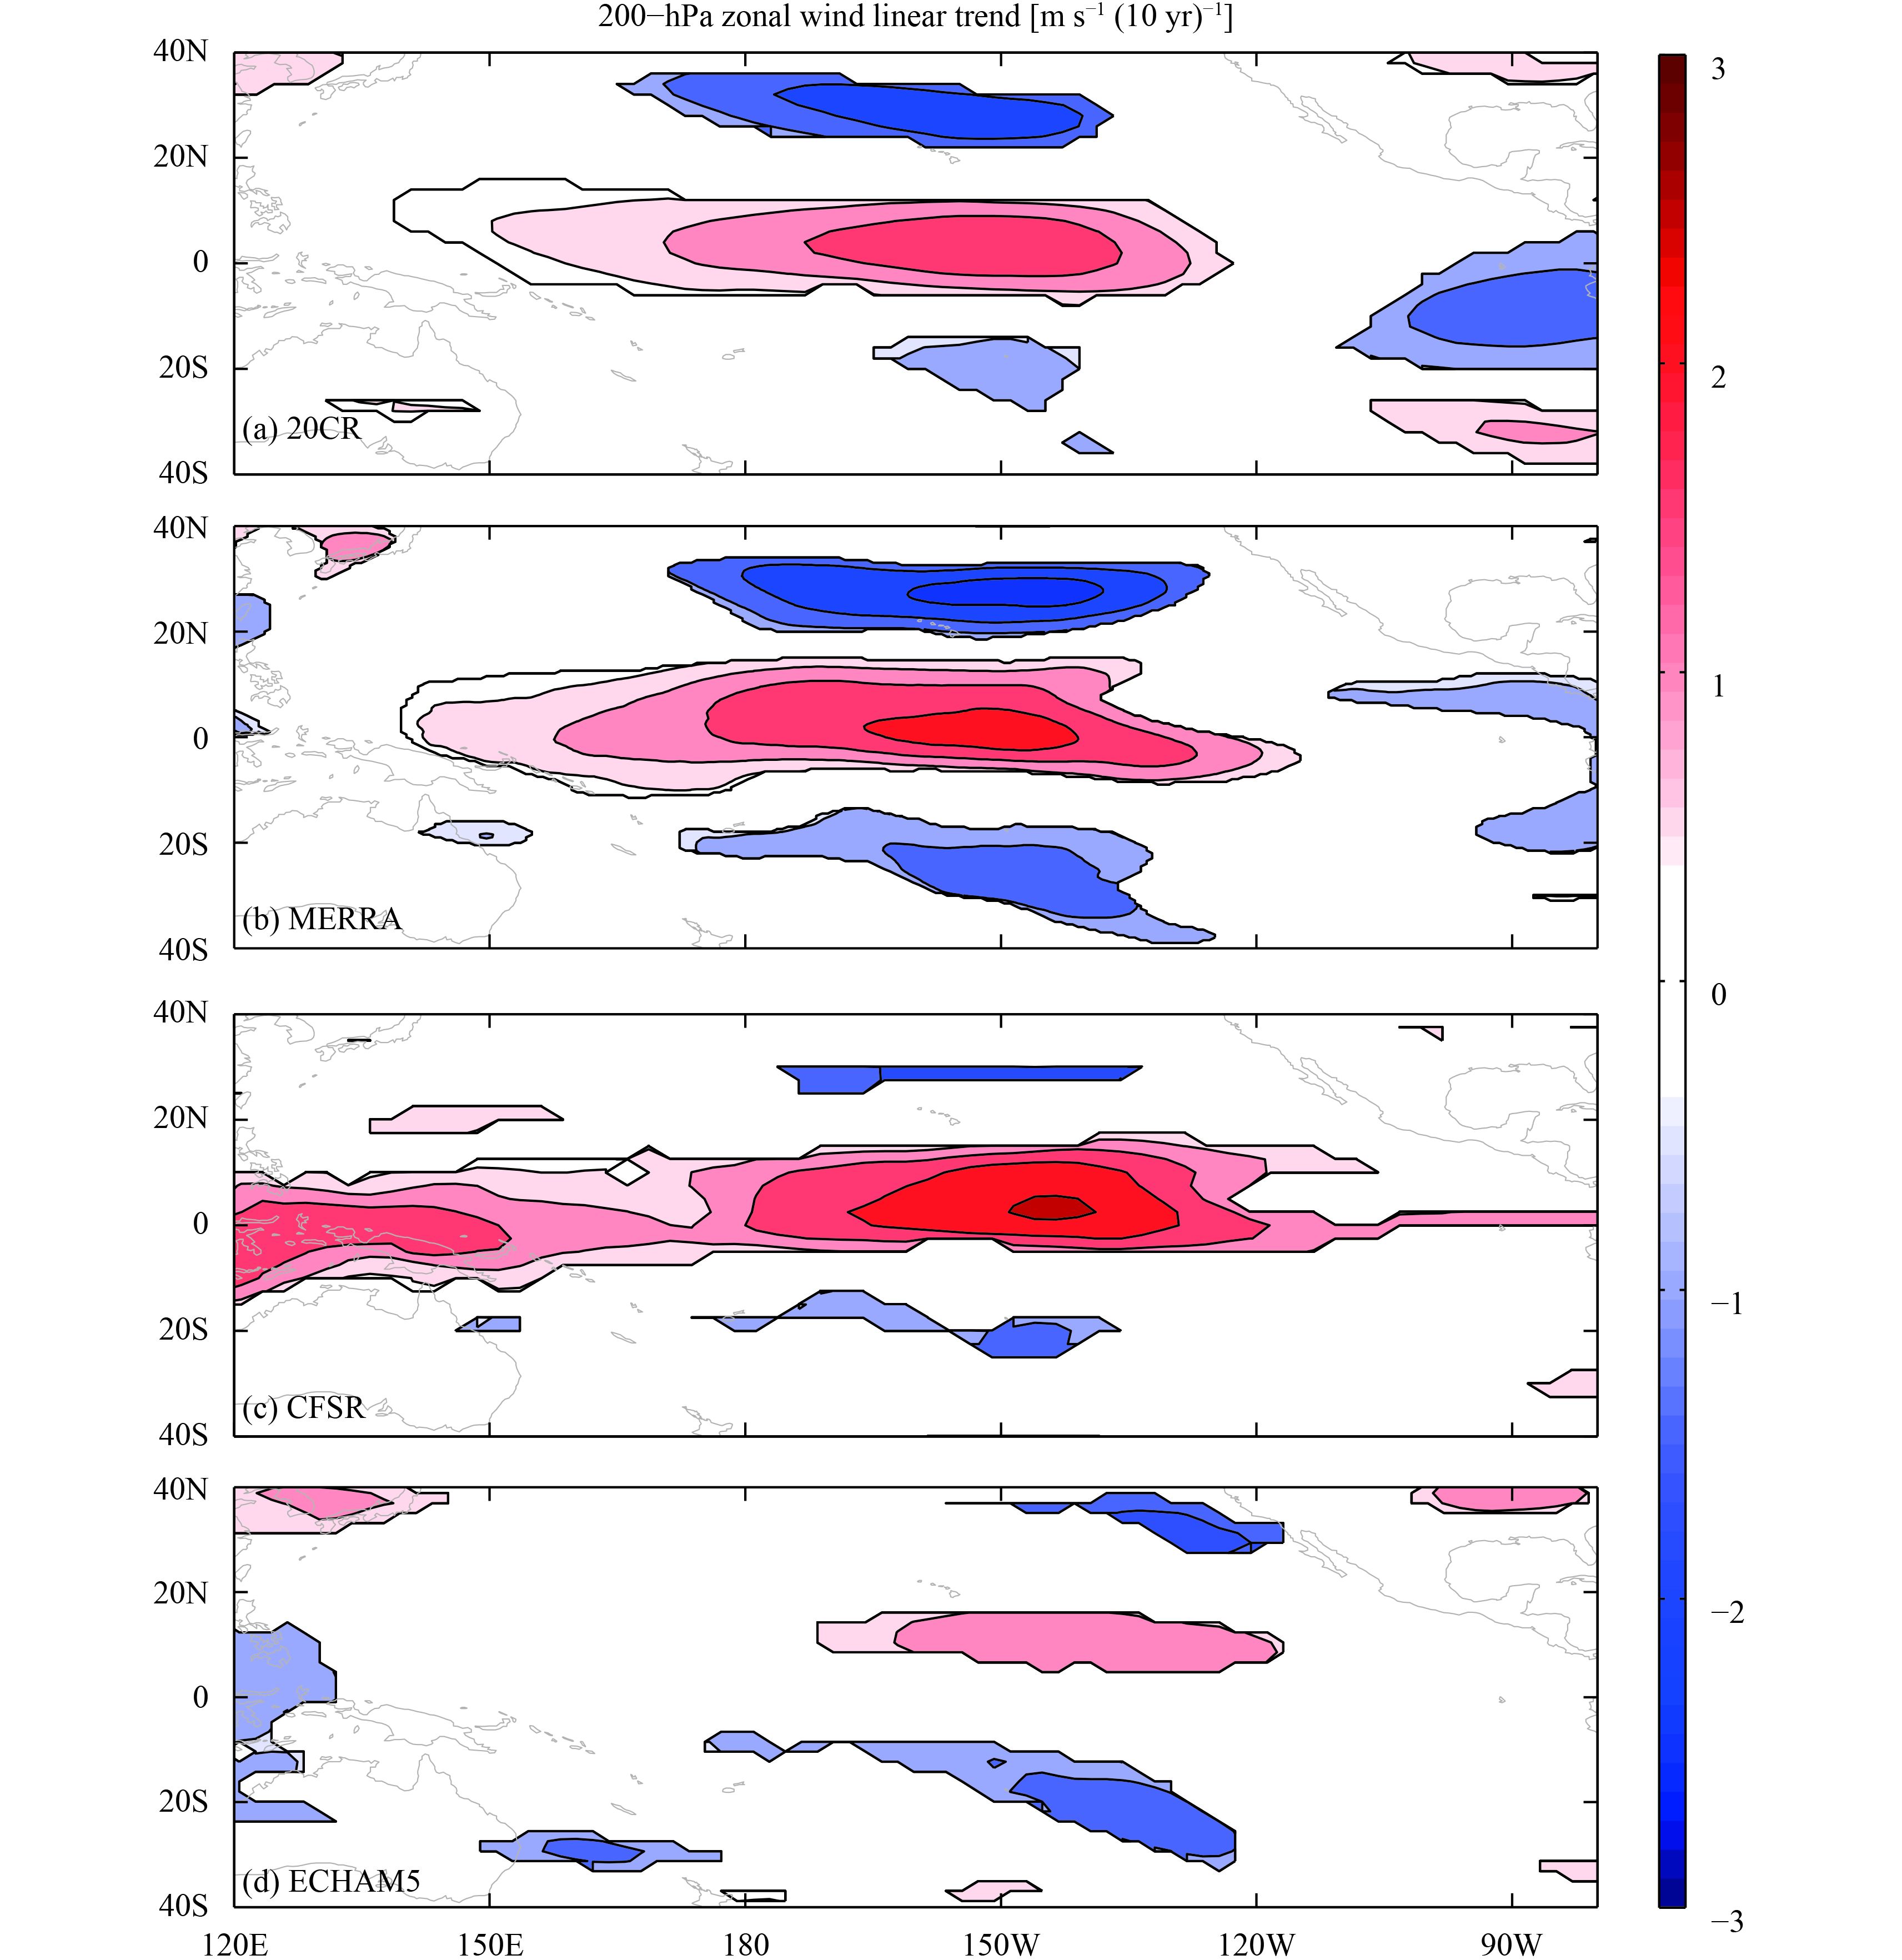
We also carry out the trend analysis for residual (actual minus ENSO correlated, i.e., with ENSO signal removed) UT zonal wind for all 9 datasets, the results of which are shown in Figs. 4, 5. The tendency towards a stronger equatorial westerly wind and weaker STJ is identical to that in Figs. 2, 3; however, the patterns are more prominent and the results are unequivocal in all datasets.

|
| Figure 4 Winter (December–March) mean trend (> 95% significance) in ENSO fit removed UT wind (left-hand panels) and PC1 (right-hand panels; 40°S–40°N, 120°E–80°W), based on (a) ERA-40, (b) ERA-Interim, (c) NCEP-1, (d) JRA-55, and (e) JRA-25. |
|
| Figure 5 Winter (December–March) mean trend (> 95% significance) in ENSO fit removed UT wind (left-hand panels) and PC1 (right-hand panels; 40°S–40°N, 120°E–80°W), based on (a) 20CR, (b) MERRA, (c) CFSR, and (d) ECHAM5. |
To analyze the spatial pattern of the UT zonal wind, we apply EOF analysis (see Section 2.2) to the winter (December–March) seasonal mean zonal wind anomalies for the 9 different datasets. The corresponding dominant principle component (PC1) is then regressed on the actual wind anomaly field to represent the dominant spatial pattern (EOF1) in the domain (40°S–40°N, 120°–280°E), and the results of which are shown inFigs. 6a–i for ERA-40, ERA-Interim, NCEP-1, MERRA, JRA-55, JRA-25, 20CR, CFSR, and ECHAM5, respectively.

|
| Figure 6 Spatial EOF1 (40°S–40°N, 120°E–80°W) regression pattern of UT zonal wind (December–March) for (a) ERA-40, (b) ERA-Interim, (c) NCEP-1, (d) MERRA, (e) JRA-55, (f) JRA-25, (g) 20CR, (h) CFSR, and (i) ECHAM5. The labeled percentages indicate the percentage of the total variance explained by PC1, the most dominant one. |
In all nine datasets, the EOF1 pattern is characterized by a tripolar pattern with dominant positive centers over the equatorial central–eastern Pacific Ocean, which is almost identical to the position of the strengthened westerly ducts. On the other hand, a Gill-like negative pattern over the western Pacific Ocean stretching on either side of the equator is consistent with the weakened STJ center. This EOF1 explains 45.4%, 54.2%, 44.6%, 53.3%, 46.7%, 51.2%, 41.9%, 52.9%, and 40.0% of the total variance of UT zonal wind for ERA-40, ERA-Interim, NCEP-1, MERRA, JRA-55, JRA-25, 20CR, CFSR, and ECHAM5, respectively. A certain increasing trend in PC1 is noticeable, but the long-term increasing tendency becomes clearer after the UT wind relationship with ENSO is linearly removed. Therefore, like the long-term trend in PV intrusion frequency inNath et al. (2016), we too plot the residual (actual minus ENSO correlated) PC1 trend for ERA-40, ERA-Interim, NCEP-1, JRA-55, and JRA-25, in the right-hand panels of Fig. 2, respectively. Additionally, we plot the same but for 20CR, MERRA, CFSR, and ECHAM5, in the right-hand panels of Fig. 3, respectively.
Overall, the long-term trends in the Pacific UT zonal wind suggest increasingly frequent PV intrusions during the last half of the 20th century. We also apply EOF analysis to residual (actual minus ENSO correlated) UT zonal wind (figure omitted); however, the PC1 patterns and the observed variances do not differ much from Fig. 6. Since the quality of most of the reanalysis datasets has improved since 1979, owing to the inclusion of satellite-borne measurements, this may influence the temporal trend. Therefore, in the right-hand panels of Figs. 2, 3, we plot the linear trend in PC1 for the pre-1979 and post-1979 data periods, demonstrating that the long-term increasing trend is unequivocal in both periods and for all datasets.
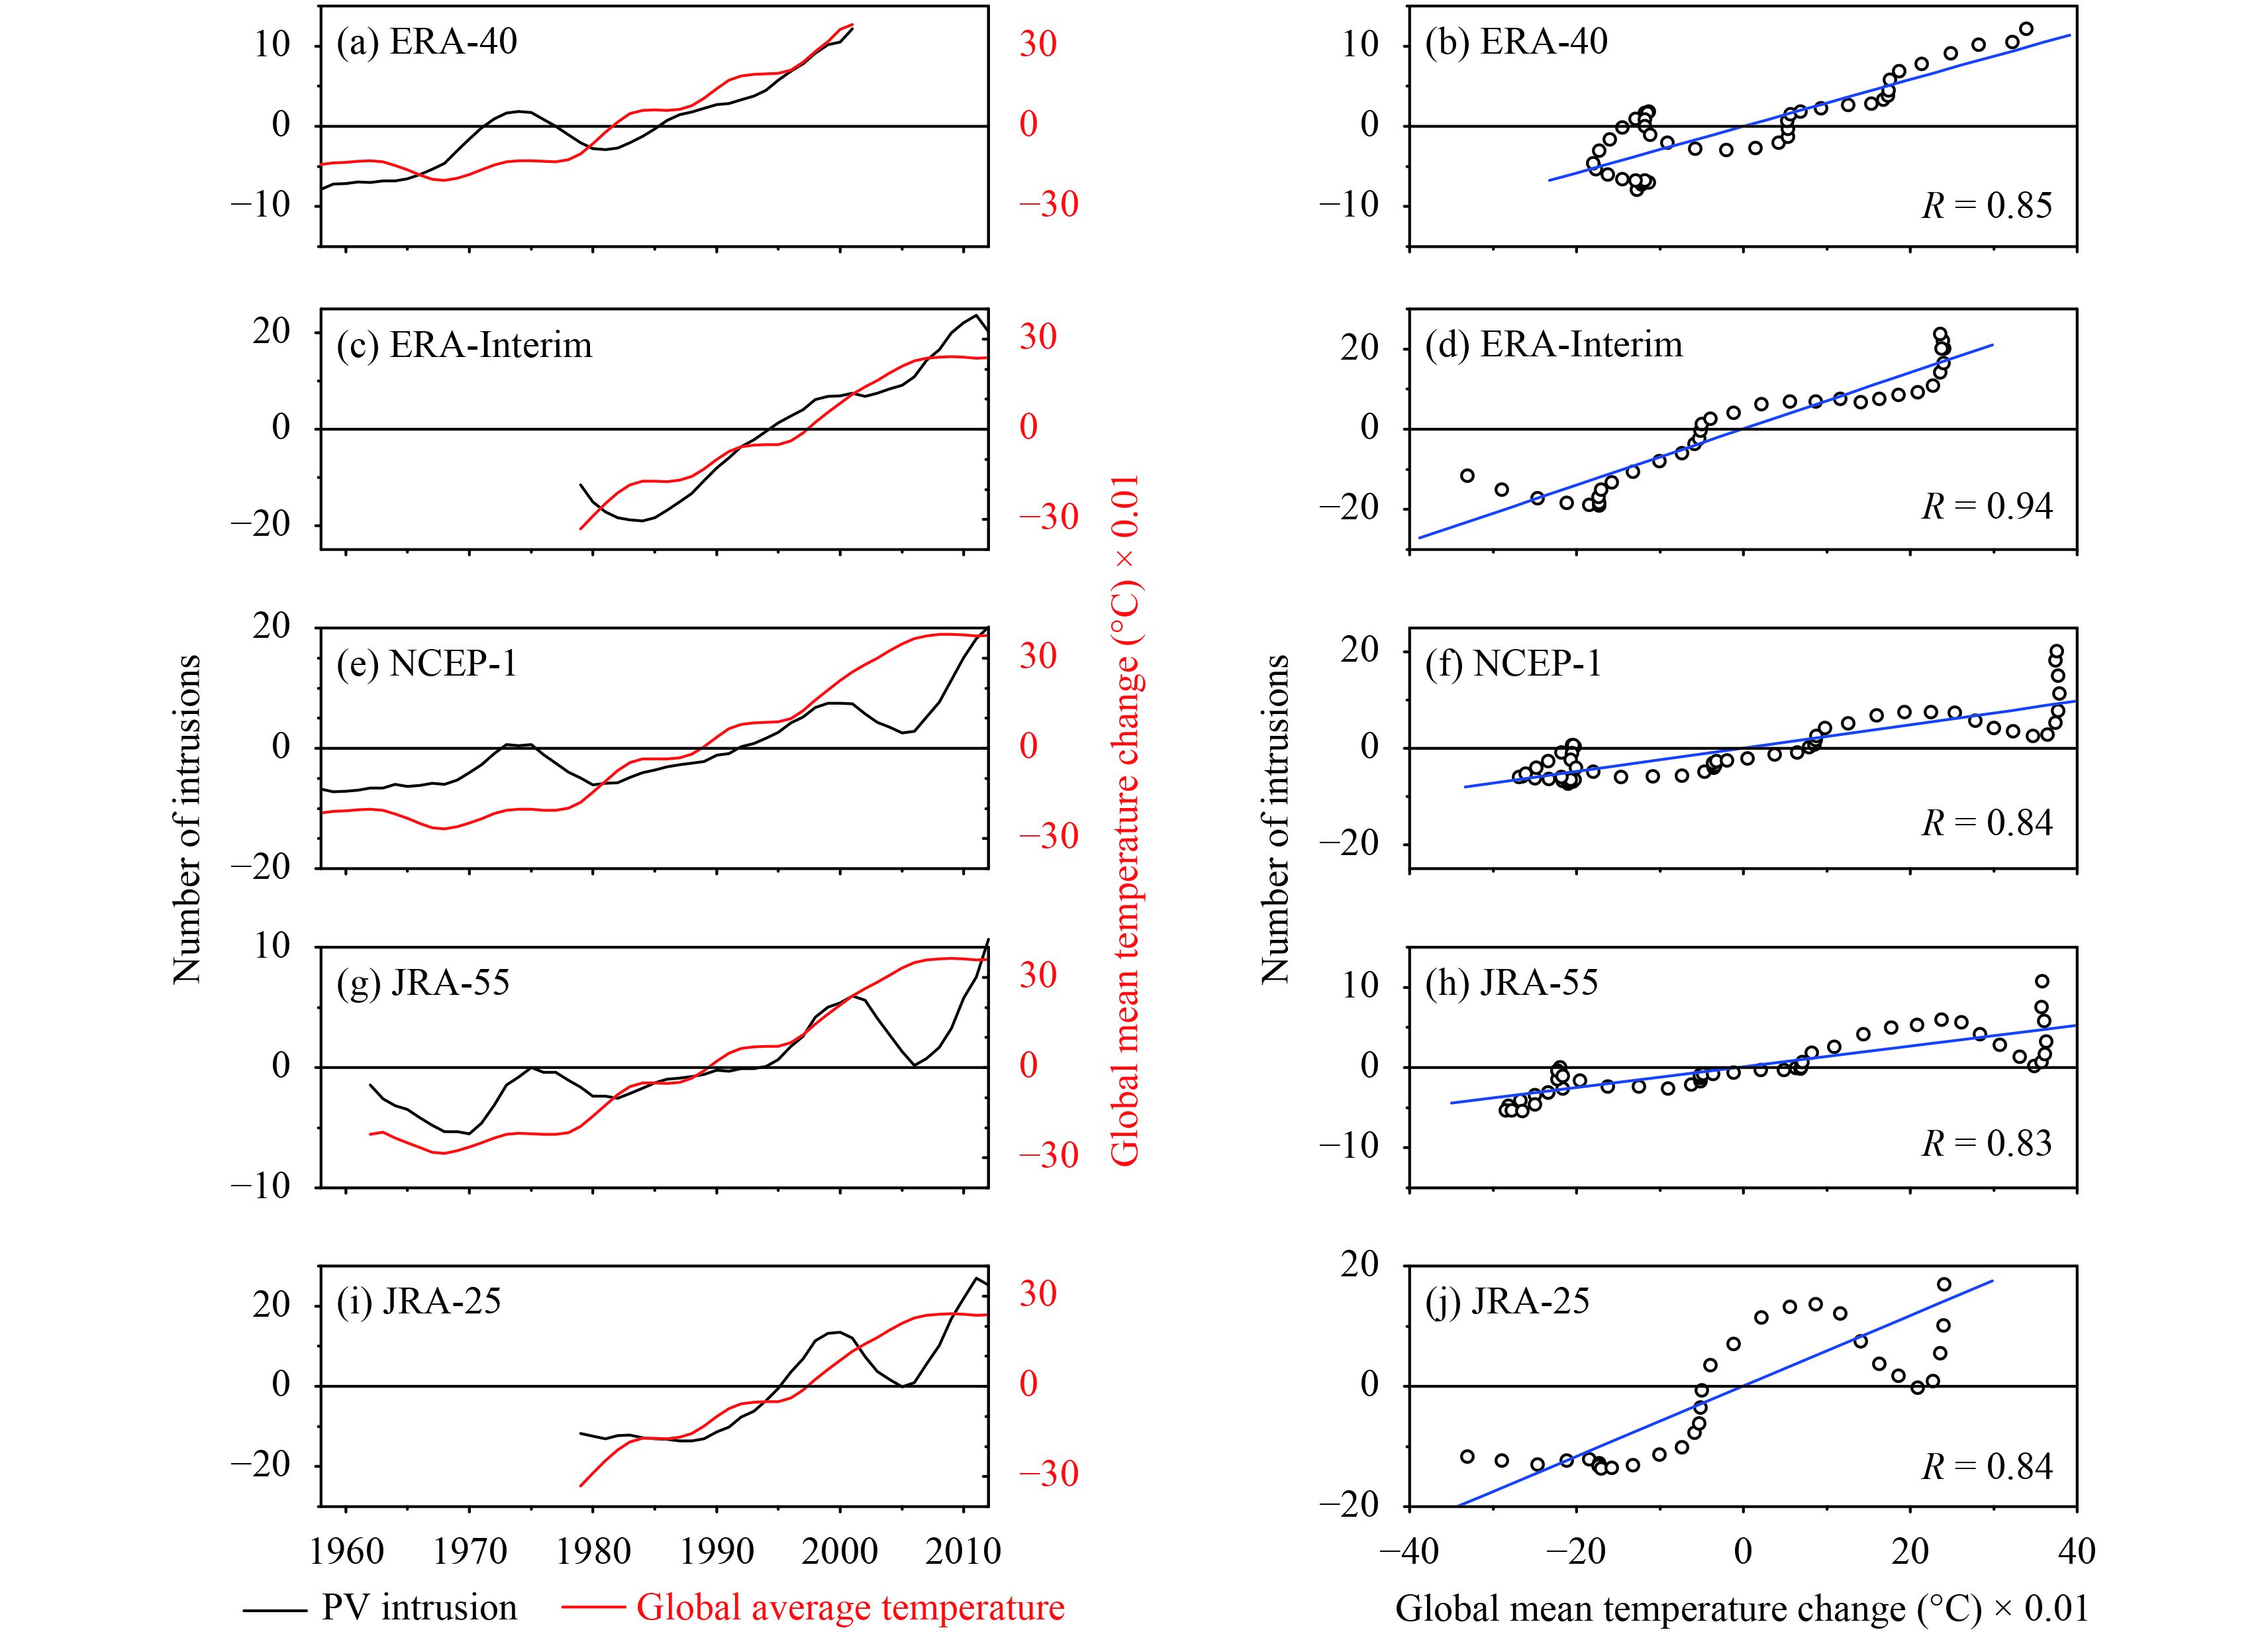
3.3 Role of global warming in driving the long-term PV intrusion trendSince the interannual variability of the PV intrusion events over the Pacific Ocean correlates strongly with the phase of ENSO, we remove the ENSO fitted trend from the original time series to derive the interdecadal variability more clearly (Nath et al., 2016). It is worth mentioning in this context that regression with Niño3.4 cannot remove the nonlinear or lagged relationship between the two; however, the nonlinear relationships of ENSO with the global mean temperature and the subtropical intrusions might have significantly contributed the long-term trend. First, we detrend the global mean temperature anomaly and the PV intrusion frequency by removing the mean value from the time series. Note that, since the anthropogenic forcings are not linear over the 50–60-yr period, we do not apply best-fit linear trend removal for detrending. Second, to remove the contribution of ENSO from the residual time series we further apply a 1–7-yr smoothing polynomial filter of order 2, both on the global mean temperature anomaly and the total PV intrusion trend over the Pacific Ocean. The filtered profiles (black line) for ERA-40, ERA-Interim, NCEP-1, JRA-55, and JRA-25 data, from 1958–2012, are shown in Figs. 7a, c, e, g, i, respectively. The intrusion frequency increases by 3.72, 13.45, 3.45, 1.96, and 11.34 (10 yr)–1 for the 5 datasets mentioned above, respectively. We over-plot the filtered global mean temperature anomaly (red line) from GISTEMP on each of the subplots, which shows a monotonous increasing trend from the mid-1970s onwards, and from –0.03°C to 0.4°C.
|
| Figure 7 Winter (December–March) mean linear trend (> 95%) in detrended and 1–7-yr smoothed polynomial (order 2) filtered profiles of PV intrusion (black lines; left-hand panels) and the global mean temperature anomaly (red lines; left-hand panels), based on (a) ERA-40, (c) ERA-Interim, (e) NCEP-1, (g) JRA-55, and (i) JRA-25. The right-hand panels (b, d, f, h, j) show the correlation between the global mean temperature anomaly and PV intrusions over the Pacific Ocean for ERA-40, ERA-Interim, NCEP-1, JRA-55, and JRA-25, respectively; the numbers in the lower-right corner of the subplots indicate the statistically significant (> 95%) coefficient; and the blue lines in each of the subplots indicate the trend line. |
To determine the link between the global mean temperature rise and intrusion frequency, we test the degree of correlation between the two factors. The significant (> 95%) correlation coefficients, based on the five reanaly-sis datasets, are 0.85, 0.94, 0.84, 0.83, and 0.84, respectively (Figs. 7b, d, f, h, j). This indicates that the global mean temperature rise can explain around 69%–88% of the variance related to the long-term increase in PV intrusion frequency over the Pacific Ocean.
The mechanism can be explained as follows. A strong zonal gradient in the Pacific SST pattern, with horseshoe-shaped warming and cooling trends in the western Pacific Ocean (Held and Soden, 2006) and in the central–eastern Pacific Ocean (Matthews and Kiladis, 1999; Ashok et al., 2007; Zhang et al., 2010; Cane et al., 1997; Lian and Chen, 2012), respectively, is prominent. This zonal gradient is tied to the zonal wind variability in the UT by strengthening and weakening the equatorial westerlies and the STJ, as part of the Walker and regional Hadley circulation, respectively, on the multi-decadal timescale. It is known that ENSO strongly modulates the Pacific cell of the Walker circulation on the interannual timescale (Bjerknes, 1969; Horel and Wallace, 1981; Kousky et al., 1984); however, its multi-decadal strengthening is in line with global warming (L’Heureux et al., 2013). It is a matter of great debate as to whether the Walker circulation has weakened (Held and Soden, 2006; Vecchi et al., 2006; Vecchi and Soden, 2007) or strengthened (L’Heureux et al., 2013) in recent decades. Moreover, a few studies (e.g., Trenberth and Fasullo, 2013) advocate a role played by the PDO in the recent changes in the Walker circulation. However, our results clearly suggest that the long-term increase in PV intrusion frequency over the Pacific Ocean exhibits a highly consistent trend with the global mean temperature rise. Recent strengthening in the warming-induced Walker circulation strengthens the equatorial westerly duct over the Pacific Ocean, which leads to an increase in the intrusion frequency over the tropics. In the present paper, after removing the ENSO related variability, we observe that the residual timeseries in PV intrusions are strongly in line with the global mean temperature rise, which is linked with anthropogenic warming.
4 Conclusions and discussionThe results of the present study show a long-term increasing trend in subtropical PV intrusion events over the Pacific Ocean—a trend that we examine using five reanalysis datasets, i.e., ERA-Interim, ERA-40, NCEP-1, JRA-55, and JRA-25. The zonal variation in SST drives the strengthening and weakening of the UT equatorial westerly duct and the STJ, respectively, over the Pacific Ocean. At first the residual time series uncorrelated with ENSO is extracted by subtracting the ENSO fitted (i.e. part of intrusion timeseries correlated with Niño3.4) time series from the actual one (L’Heureux et al., 2013). In the next step, we applied a 1–7-yr smoothing polynomial filtering (order 2) on the residual timeseries, which further reduces the contribution of ENSO to a greater extent. Therefore, the residual timeseries largely contains the contribution from the external forcing factors, which is linked with anthropogenic warming. Despite some differences, the increasing trend in subtropical PV intrusion events is unequivocal across all the reanalysis products.
The multi-decadal strengthening in the Pacific Walker circulation is in line with the global mean temperature rise. The link between the ENSO fit removed and filtered global mean temperature rise and intrusion frequency is determined by calculating the degree of correlation between the two. The significant (> 95%) correlation coefficients, based on ERA-40, ERA-Interim, NCEP-1, JRA-55, and JRA-25, are 0.85, 0.94, 0.84, 0.83, and 0.84, respectively. This is indicative of the fact that the external forcing factors (e.g. anthropogenic warming) which are linked with the global mean temperature rise can explain around 69%–88% of the variance related to the long-term increase in PV intrusion frequency over the Pacific Ocean.
More PV intrusions will enhance the long-term mixing and exchanges between the stratosphere and troposphere, and vice versa. Moreover, this may affect the chemical composition and ozone, as well as the water vapor budget, in the atmosphere, particularly over the Pacific Ocean. Furthermore, this will cause more ozone to intrude from the stratosphere to the lower troposphere, and even to the oceanic boundary layer. It remains an open question as to whether subtropical intrusions will continue to increase with global warming and, if so, how the tropospheric ozone budget will change in the future. This needs further investigation with model simulations and future projections.
Acknowledgments. We thank the two anonymous reviewers for their constructive comments, which helped to improve the paper. We thank the NCEP–NCAR, ECMWF, and JRA for providing the NCEP-1, ERA-40, ERA-Interim, JRA-55, and JRA-25 data. We also thank Dr. Kaiming Hu for providing the ECHAM5 data.
| Ashok, K., S. K. Behera, S. A. Rao, et al., 2007: El Niño Modoki and its possible teleconnection. J. Geophys. Res., 112, C11007. DOI:10.1029/2006JC003798 |
| Bjerknes, J., 1969: Atmospheric teleconnections from the equato-rial Pacific. Mon. Wea. Rev., 97, 163–172. DOI:10.1175/1520-0493(1969)097<0163:ATFTEP>2.3.CO;2 |
| Brunet, G., and P. H. Haynes, 1996: Low-latitude reflection of Rossby wave Trains. J. Atmos. Sci., 53, 482–496. DOI:10.1175/1520-0469(1996)053<0482:LLRORW>2.0.CO;2 |
| Cane, M. A., A. C. Clement, A. Kaplan, et al., 1997: Twentieth-century sea surface temperature trends. Science, 275, 957–960. DOI:10.1126/science.275.5302.957 |
| Chung, P. H., and T. Li, 2013: Interdecadal relationship between the mean state and El Niño types. J. Climate., 26, 361–379. DOI:10.1175/JCLI-D-12-00106.1 |
| Compo, G. P., J. S. Whitaker, P. D. Sardeshmukh, et al., 2011: The twentieth century reanalysis project. Quart. J. Roy. Meteor. Soc., 137, 1–28. |
| Dee, D. P., and S. Uppala, 2009: Variational bias correction of satellite radiance data in the ERA-Interim reanalysis. Quart. J. Roy. Meteor. Soc., 135, 1830–1841. DOI:10.1002/qj.v135:644 |
| Gill, A. E., 1980: Some simple solutions for heat-induced tropical circulation. Quart. J. Roy. Meteor. Soc., 106, 447–462. DOI:10.1002/(ISSN)1477-870X |
| Held, I. M., and B. J. Soden, 2006: Robust responses of the hydrological cycle to global warming. J. Climate., 19, 5686–5699. DOI:10.1175/JCLI3990.1 |
| Horel, J. D., and J. M. Wallace, 1981: Planetary-scale atmospheric phenomena associated with the Southern Oscillation. Mon. Wea. Rev., 109, 813–829. DOI:10.1175/1520-0493(1981)109<0813:PSAPAW>2.0.CO;2 |
| Kalnay, E., M. Kanamitsu, R. Kistler, et al., 1996: The NCEP/NCAR 40-year reanalysis project. Bull. Amer. Meteor. Soc., 77, 437–471. DOI:10.1175/1520-0477(1996)077<0437:TNYRP>2.0.CO;2 |
| Kiladis, G. N., and K. M. Weickmann, 1992: Extratropical forcing of tropical Pacific convection during northern winter. Mon. Wea. Rev., 120, 1924–1939. DOI:10.1175/1520-0493(1992)120<1924:EFOTPC>2.0.CO;2 |
| Kobayashi, S., Y. Ota, Y. Harada, et al., 2015: The JRA-55 reanalysis: General specifications and basic characteristics. J. Meteor. Soc. Japan., 93, 5–48. DOI:10.2151/jmsj.2015-001 |
| Kousky, V. E., M. T. Kagano, and I. F. A. Cavalcanti, 1984: A review of the Southern Oscillation: Oceanic–atmospheric circulation changes and related rainfall anomalies. Tellus A, 36, 490–504. DOI:10.3402/tellusa.v36i5.11649 |
| L’Heureux, M. L., S. Lee, and B. Lyon, 2013: Recent multidecadal strengthening of the Walker circulation across the tropical Pacific. Nat. Climate Change, 3, 571–576. |
| Lian, T., and D. Chen, 2012: An evaluation of rotated EOF analy-sis and its application to tropical Pacific SST variability. J. Climate, 25, 5361–5373. DOI:10.1175/JCLI-D-11-00663.1 |
| Matthews, A. J., and G. N. Kiladis, 1999: Interactions between ENSO, transient circulation, and tropical convection over the Pacific. J. Climate, 12, 3062–3086. DOI:10.1175/1520-0442(1999)012<3062:IBETCA>2.0.CO;2 |
| McIntyre, M. E., and T. N. Palmer, 1983: Breaking planetary waves in the stratosphere. Nature, 305, 593–600. DOI:10.1038/305593a0 |
| McPhaden, M. J., T. Lee, and D. McClurg, 2011: El Niño and its relationship to changing background conditions in the tropi-cal Pacific Ocean. Geophys. Res. Lett., 38, L15709. DOI:10.1029/2011GL048275 |
| Miller, A. J., D. R. Cayan, T. P. Barnett, et al., 1994: The 1976–77 climate shift of the Pacific Ocean. Oceanography, 7, 21–26. DOI:10.5670/oceanog |
| Nath, D., W. Chen, H. F. Graf, et al., 2016: Subtropical potential vorticity intrusion drives increasing tropospheric ozone over the tropical central Pacific. Sci. Rep., 6, 21370. DOI:10.1038/srep21370 |
| North, G. R., 1984: Empirical orthogonal functions and normal modes. J. Atmos. Sci., 41, 879–887. DOI:10.1175/1520-0469(1984)041<0879:EOFANM>2.0.CO;2 |
| Onogi, K., J. Tsutsui, H. Koide, et al., 2007: The JRA-25 reanaly-sis. J. Meteor. Soc. Japan., 85, 369–432. DOI:10.2151/jmsj.85.369 |
| Rienecker, M. M., M. J. Suarez, R. Gelaro, et al., 2011: MERRA: NASA’s Modern-Era Retrospective Analysis for research and applications. J. Climate, 24, 3624–3648. DOI:10.1175/JCLI-D-11-00015.1 |
| Roeckner, E., G. Bäuml, L. Bonaventura, et al., 2003: The Atmospheric General Circulation model ECHAM5. Part I: Model Description. Report No. 349, Hamburg, Germany, Max-Planck-Institut für Meteorologie. |
| Saha, S., S. Moorthi, H. L. Pan, et al., 2010: The NCEP climate forecast system reanalysis. Bull. Amer. Meteor. Soc., 91, 1015–1057. DOI:10.1175/2010BAMS3001.1 |
| Tokinaga, H., S. P. Xie, C. Deser, et al., 2012: Slowdown of the Walker circulation driven by tropical Indo-Pacific warming. Nature, 491, 439–443. DOI:10.1038/nature11576 |
| Trenberth, K. E., and J. T. Fasullo, 2013: An apparent hiatus in global warming?. Earth’s Future, 1, 19–32. DOI:10.1002/2013EF000165 |
| Uppala, S. M., P. W. Kållberg, A. J. Simmons, et al., 2005: The ERA-40 re-analysis. Quart. J. Roy. Meteor. Soc., 131, 2961–3012. DOI:10.1256/qj.04.176 |
| Vecchi, G. A., and B. J. Soden, 2007: Global warming and the weakening of the tropical circulation. J. Climate, 20, 4316–4340. DOI:10.1175/JCLI4258.1 |
| Vecchi, G. A., B. J. Soden, A. T. Wittenberg, et al., 2006: Weakening of tropical Pacific atmospheric circulation due to anthropogenic forcing. Nature, 441, 73–76. DOI:10.1038/nature04744 |
| Wang, B., 1995: Interdecadal changes in El Niño onset in the last four decades. J. Climate, 8, 267–285. DOI:10.1175/1520-0442(1995)008<0267:ICIENO>2.0.CO;2 |
| Wang, C., 2005: ENSO, Atlantic climate variability, and the Walker and Hadley circulations. The Hadley Circulation: Present, Past and Future. Diaz, H. F., and R. S. Bradley, Eds. Dordrecht, Springer, 173–202. |
| Waugh, D. W., 2005: Impact of potential vorticity intrusions on subtropical upper tropospheric humidity. J. Geophys. Res., 110, D11305. DOI:10.1029/2004JD005664 |
| Waugh, D. W., and L. M. Polvani, 2000: Climatology of intrusions into the tropical upper troposphere. Geophys. Res. Lett., 27, 3857–3860. DOI:10.1029/2000GL012250 |
| Waugh, D. W., and B. M. Funatsu, 2003: Intrusions into the tropical upper troposphere: Three-dimensional structure and accompanying ozone and OLR distributions. J. Atmos. Sci., 60, 637–653. DOI:10.1175/1520-0469(2003)060<0637:IITTUT>2.0.CO;2 |
| Waugh, D. W., R. A. Plumb, and L. M. Polvani, 1994: Nonlinear, barotropic response to a localized topographic forcing: Formation of a " tropical surf zone” and its effect on interhemi-spheric propagation. J. Atmos. Sci., 51, 1401–1416. DOI:10.1175/1520-0469(1994)051<1401:NBRTAL>2.0.CO;2 |
| Xiang, B. Q., B. Wang, and T. Li, 2013: A new paradigm for the predominance of standing central Pacific warming after the late 1990s. Climate Dyn., 41, 327–340. DOI:10.1007/s00382-012-1427-8 |
| Zhang, W. J., J. P. Li, and X. Zhao, 2010: Sea surface temperature cooling mode in the Pacific cold tongue. J. Geophys. Res., 115(C12), C12042. DOI:10.1029/2010JC006501 |
 2017, Vol. 31


