The Chinese Meteorological Society
Article Information
- LI, Shuanglin, Zhe HAN, and Huopo CHEN, 2017.
- A Comparison of the Effects of Interannual Arctic Sea Ice Loss and ENSO on Winter Haze Days: Observational Analyses and AGCM Simulations. 2017.
- J. Meteor. Res., 31(5): 820-833
- http://dx.doi.org/10.1007/s13351-017-7017-2
Article History
- Received February 7, 2017
- in final form May 7, 2017
2. Institute of Atmospheric Physics/Climate Change Research Center, Chinese Academy of Sciences, Beijing 100029
Haze is a type of atmospheric pollution phenomena whereby smoke and dry particles are suspended in the atmosphere, dimming the sky and deteriorating visibility. Heavy haze often causes serious damage to the environment and human health, including traffic jams, worse air quality, and high occurrences of respiratory disease (Wu et al., 2005; Pope III and Dockery, 2006; Wang and Mauzerall, 2006; Xu et al., 2013; Xie et al., 2014). In recent winters, more haze days have been detected in China (e.g., Niu et al., 2010; Ding and Liu, 2014; Wang et al., 2015), and the number of pediatric patients with reported pneumonia or lung cancer has drastically increased throughout the country (Xu et al., 2013). Haze has become a serious societal issue in China and has attracted a large amount of attention from governmental bodies and the general public. In 2010, China issued a national standard for the observation and monitoring of haze (Wu et al., 2010). Subsequently, an air pollution prevention action was stipulated in September 2013, and stricter controls on coal consumption, industry production, and vehicle usage have been subsequently adapted. Thus, an in-depth understanding of haze formation and improving its prediction are of substantial importance for the country.
The increased occurrence of haze in China is closely related to increased pollutant emissions due to the country’s rapid urbanization and industrialization (Wang et al., 2013). In many regions of China, this is evidenced by secondary inorganic aerosols and coal combustion, which are the two primary contributors to severe pollution events. For example, in Chengdu, the capital city of Sichuan Province in Southwest China, the two factors in combination account for over a half of the pollutants, with the contribution rates of 37 ± 18% and 20 ± 12%, respectively ( Tao et al., 2014). In Beijing, vehicles are the most important source of fine particulate matter 2.5 (PM2.5), contributing 25% of pollution, whereas coal combustion and cross-regional transport are the next to vehicles, both explaining a rate of 19% (He et al., 2013), although there is still uncertainty and an on-going debate regarding the contribution rates of these sources (e.g., Zhang R. et al., 2013).
However, the occurrence of haze does not arise only from pollutant emissions. Since the release of the “Atmospheric Pollution Prevention and Control—Ten Measures of China” by Chinese government in 2013, air pollutant emission has been significantly reduced in Beijing and its vicinity. But severe haze events occurred more frequently in recent years. For example, more heavy haze days occurred in January 2013, and Beijing reached its peak of air pollution, which resulted in the first haze orange alert in its meteorological record (e.g.,Ding and Liu, 2014; Zhang et al., 2014). In December 2015 and December 2016, haze pollution was the most severe and the highest warning (a red warning) was issued several times1.
Haze occurs only when the pollutants are not dispersed or transported away but instead are contained and accumulate near the surface. A calm and steady synoptic weather condition is substantially important for the occurrence of haze days. In addition, rainfall can wash away pollutants and is unfavorable to the formation of haze. In general, the meteorological or synoptic weather factors favorable to haze’s occurrence include steady atmospheric stratification, weak near-surface wind speeds, high relative humidity, and reduced precipitation (Zhang X. Y. et al., 2013). The importance of steady stratification is seen by its seasonally more frequent occurrence in winter, during which the near surface air is colder and more stable. The increase in haze days in eastern China in recent years is related to weakened surface wind speeds (Xu et al., 2006; Gao, 2008; Niu et al., 2010) and increased relative humidity (Ding and Liu, 2014). These meteorological or synoptic weather conditions favorable for the occurrence of haze can be further traced to the large-scale background of atmospheric general circulation. Wu et al. (2008) revealed intensified zonal circulations in the mid-troposphere but weakened wind speeds on the surface when heavy haze events occurred in the Pearl River Delta region of South China.
It is well known that anomalous lower boundary forcings, including sea surface temperature (SST) and sea ice, play important roles in modulating the large-scale atmospheric circulation (e.g., Li et al., 2008; Mori et al., 2014). In the recent more haze winters (2013, 2015, and 2016), one substantially common feature is the reduction of Arctic sea ice, albeit with various SST warming/cooling events occurring in the central–eastern tropical Pacific (i.e., ENSO). The record strongest El Niño occurred in the 2015 winter (December 2015 to February 2016), but just one weak La Niña or neutral phase of ENSO in the 2016 and 2013 winters. Whether and how the Arctic sea ice loss and ENSO modulate winter haze days are intriguing.
Recently, Wang et al. (2015) documented that Arctic sea ice loss may enhance haze pollution in eastern China by modulating atmospheric conditions and may have accounted for approximate 45%–67% of the interannual to interdecadal variability in haze days.Gao and Li (2015) showed that the SST warming/cooling events occurring in the central–eastern tropical Pacific (i.e., ENSO) have a precursory influence on haze days in China. The ENSO’s impact on haze has also been found in Sumatra Island of Indonesia, where decreased haze days occur in autumn three months prior to the peak of El Niño events (Wang et al., 2004). However, the conclusions in these observational studies are not definitely reliable because the derived sea ice or SST signals in Gao and Li (2015) and Wang et al. (2015) were not exclusive due to a short record length and limited sample size. In particular, Wang et al. (2015) did not exclude ENSO signals, which may have existed according to Gao and Li (2015). Similarly, Gao and Li (2015) did not exclude the potential sea ice’s signals, which may have existed according to Wang et al. (2015). This suggests uncertainty and the need for further study. In the present study, we conducted AGCM sensitive experiments using prescribed SST or sea ice anomaly forcings to verify the results of Gao and Li (2015) or Wang et al. (2015).
The rest of this paper is organized as follows. Section 2 describes the observational datasets, methods, AGCM, and experimental design. Section 3 presents the observational analyses of the connection of winter haze days with Arctic sea ice or ENSO. Unlike in Gao and Li (2015) or Wang et al. (2015), linear trends and decadal components in the observational data were removed for all the variables prior to the analyses in this study. Section 4 discusses the AGCM responses to Arctic sea ice reduction or ENSO and compares their potential impacts on haze days. Finally, the discussion and concluding remarks are given in Section 5.
2 Data, model, and experimental design 2.1 Observational dataObservational haze occurrences are derived from relative humidity, visibility, and surface wind speed, although various criteria are adapted by different organizations (e.g., the World Meteorological Organization and UK Met Office) and researchers (Wu, 2006; Vautard et al., 2009; Ding and Liu, 2014). As in Chen and Wang (2015), haze is identified when the observed visibility is less than 10 km and the relative humidity and surface wind speeds are less than 90% and 7 m s–1, respectively. A threshold of relative humidity less than 90% is used to distinguish haze from fog (Schichtel et al., 2001; Doyle and Dorling, 2002). A threshold of surface wind speeds less than 7 m s–1 distinguishes haze from dust because dust is generally accompanied by high near-surface winds, although they both have similar low visibilities. When all three meteorological elements (visibility, relative humidity, and near-surface wind speeds) meet the criteria once in the four times operational observations in a day, that day is considered to be a haze day. Monthly haze occurrence is calculated as the sum of the haze days in that calendar month, and a regional mean is computed as the simple average of the occurrence sites within the region. Herein, central–eastern China is considered as the region in the 20°–40°N latitudinal band from 105°E to the east (where observational data are available). The relative humidity, visibility, and wind speeds at a height of 10 m were obtained from the National Meteorological Information Center of the China Meteorological Administration2. A quality-control on the Chinese observational dataset has been conducted before its release. The variables were based on four observational times per day: 0200, 0800, 1400, and 2000 LT (local time).
The atmospheric circulation data, including monthly sea level pressure (SLP); 500-hPa geopotential height (Z500), air temperature (T500), relative humidity (Rh500); 850-hPa geopotential height (Z850), air temperature (T850), relative humidity (Rh850), horizontal wind components (V850); and outgoing longwave radiation (OLR), were obtained from the ECMWF Interim reanalysis (ERA-Interim) (Dee et al., 2011). The precipitation dataset was obtained from the Global Precipitation Climatology Centre (Schneider et al., 2014). The period of 1979 to 2013 was used because high quality data were consistently available in this period; sea ice data were not reliably archived until 1979, when satellite observations began.
Monthly sea ice concentrations (SICs) and SSTs were obtained from the Hadley Center of UK Met Office (Rayner et al., 2003). This work focuses on the interannual variability in the occurrence of haze, and therefore, linear trends and decadal components were removed for all the variables prior to the analyses. As usual, the Niño3.4 index was used to describe ENSO, which is derived from the average SST anomaly in the winter months (November to January) in the Niño3.4 region (5°S–5°N, 170°–120°W).
2.2 AGCM and the experimental designAn AGCM, which was developed by the Max Plank Institute for Meteorology (the ECHAM5), is used here (Roeckner et al., 2003; 2006). It has the horizontal resolution of about 2.8° × 2.8° derived from the triangular spectral truncation T42. Vertically, it has a total of 31 sigma levels with the top at 10 hPa. The model performs well in the extratropics and is appropriate to study the climatic impact of Arctic sea ice reduction (e.g.,Petoukhov and Semenov, 2010).
A total of three sets of ensemble experiments were performed as follows.
1) Control experiments, in which the model was prescribed with the monthly SST and sea ice calculated as the mean over the years 1979–2010. This set of ensembles is referred to as “CTRL_Exp”.
2) Sea ice experiments (referred to as “SIC_Exp”), in which the model was forced with Arctic sea ice anomaly superimposed on the climatological monthly sea ice. The monthly sea ice anomaly is the regression of sea ice in the calendar month against the autumn Arctic sea ice area index.
3) SST experiments (referred to as “SST_Exp”). As in 2), but the regression of the SST anomalies against the Niño3.4 index was added to the climatological monthly SST.
Each ensemble contained sixty members; each started with randomly selected different initial conditions beginning on September 1 and was integrated for one year. These ensembles are summarized in Table 1. The outputs of the first three months were discarded, as this is the spin up time of the AGCM. The monthly outputs from December to February of the following years were analyzed. The modeled response to one forcing is defined as the difference of the 60-member ensemble with this forcing minus the same ensemble of the control experiments.
| Experiments | Model years | Description |
| CTRL_Exp | 60 | Climatological monthly SST and sea ice |
| SIC_Exp | 60 | As CTRL_Exp, but climatological sea ice was added with anomalous sea ice reduction (60°N northward) |
| SST_Exp | 60 | As CTRL_Exp, but climatological SST was added with the ENSO-associated tropical Pacific SSTA |
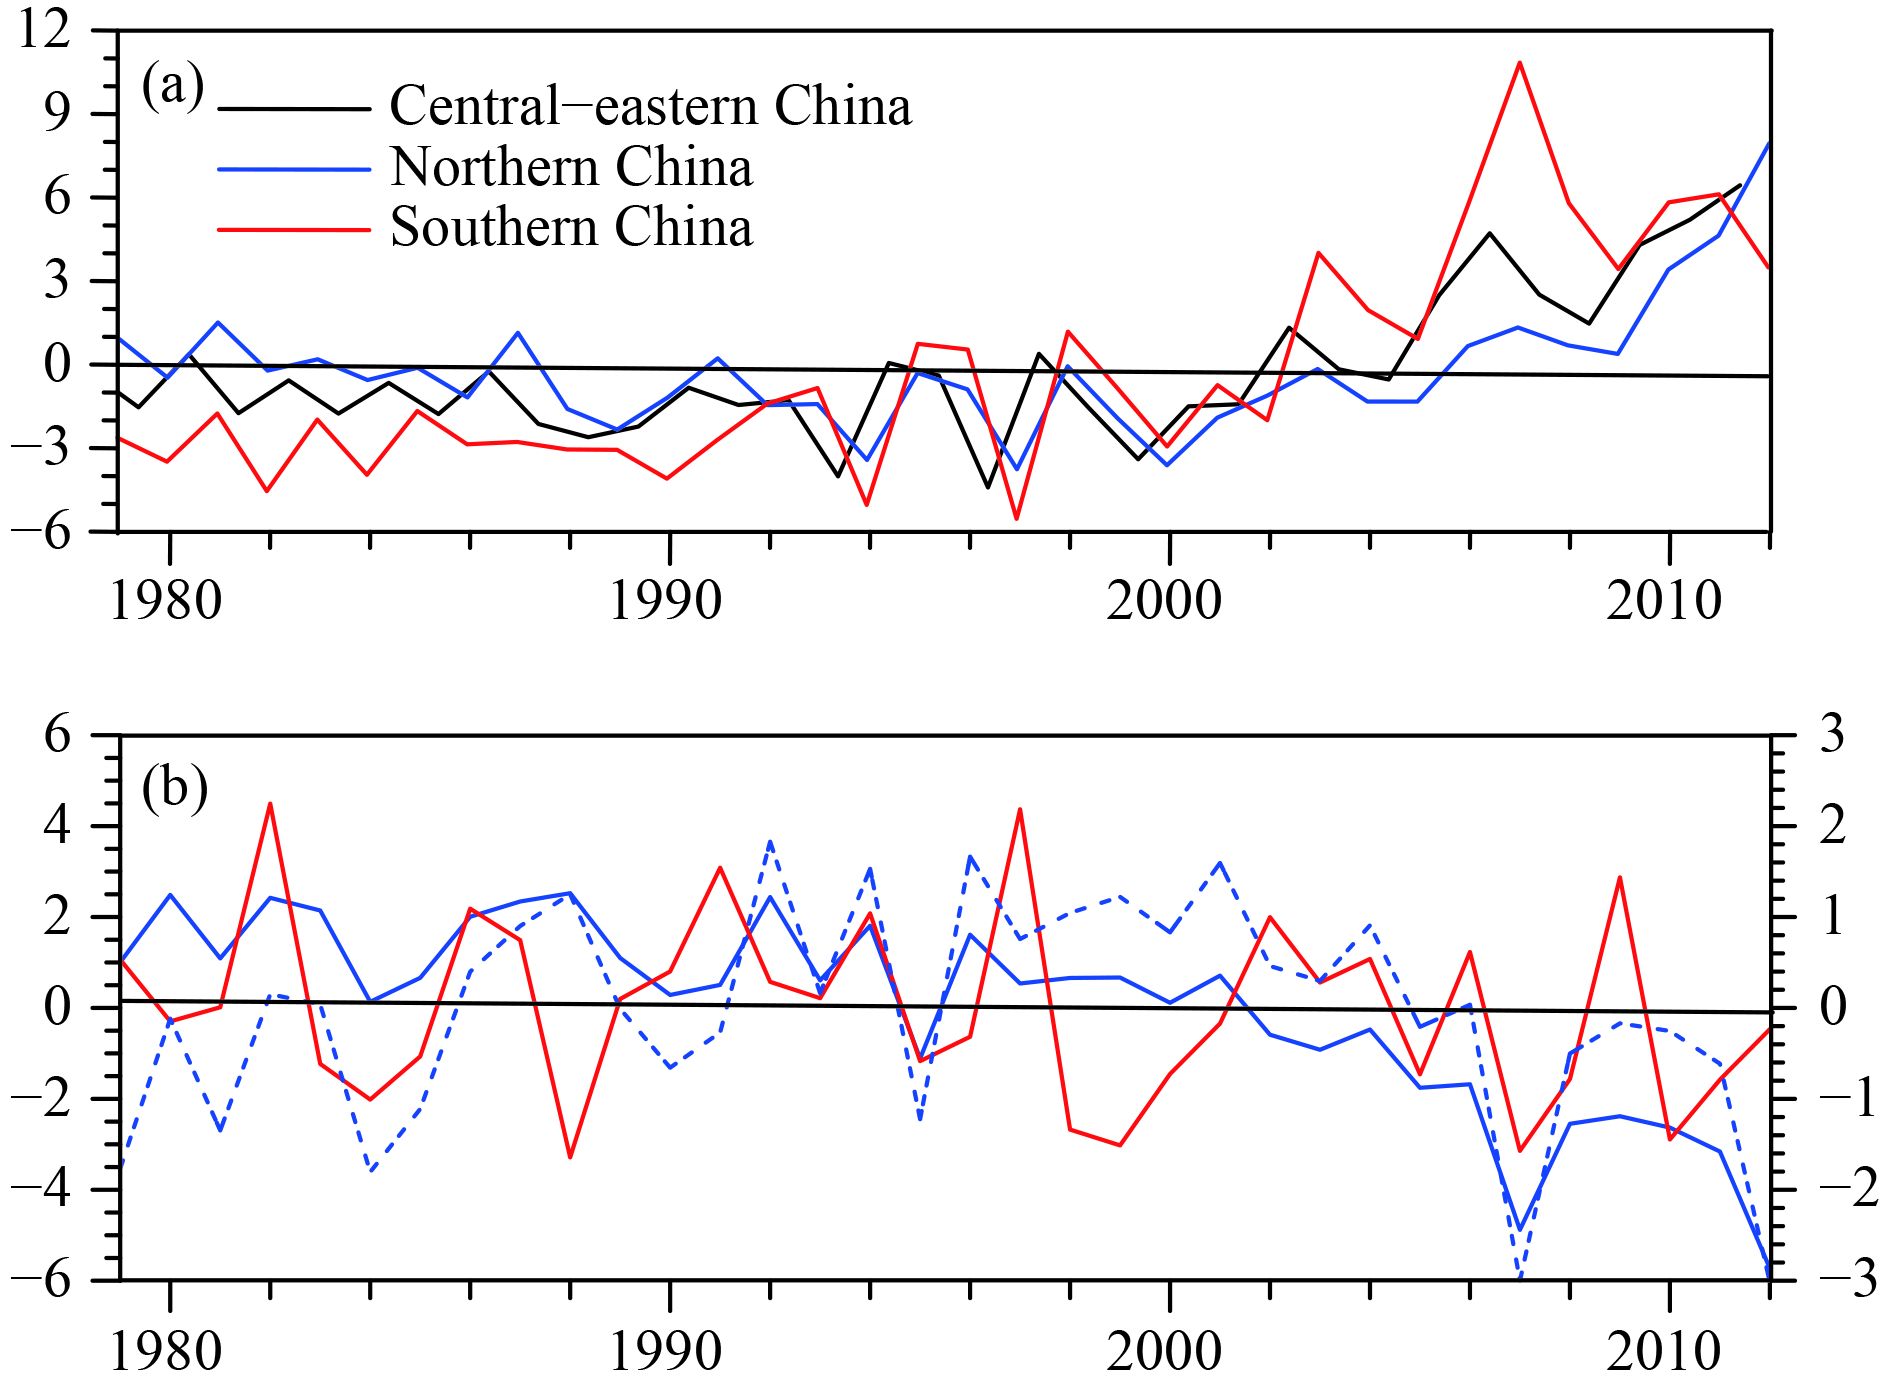
Figure 1 displays a comparison of the haze days with the autumn Arctic sea ice and winter Niño3.4 indices. Herein, the autumn Arctic sea ice index is defined as the September–November averaged sea ice area over the Arctic (north of 60°N). Autumn is selected because the sea ice reaches its minimum and its anomaly is usually most significant in this season. Due to a substantial decline of sea ice in past decades, the detrended sea ice index is also given, where the linear trend was calculated by least squares fitting for the period 1979–2013.
|
| Figure 1 (a) Winter haze days (day) in central–eastern China (black line), northerh China (blue line), and southern China (red line). The region is outlined in Fig. 3. (b) Normalized autumn (September–November) Arctic sea ice index (blue solid line), normalized detrended Arctic sea ice index (blue dashed line), and normalized winter (DJF) Niño3.4 index (red line). The scale on the left and right vertical axes is for the sea ice and the Niño3.4 index, respectively. |
From Fig. 1, as noted by Wang et al. (2015), during past decades, the number of days of haze occurrence varied opposite to that of the evolution of the Arctic sea ice. Along with the Arctic sea ice loss, the number of haze days increased substantially in central–eastern China. However, the evolution of the number of haze days was apparently not in concert with that of the Niño3.4 index. This can also be seen from the correlations inTable 2. Table 2 shows that the number of winter haze days in central–eastern China was significantly oppositely correlated to the autumn Arctic sea ice area (–0.82) but weakly oppositely correlated to the Niño3.4 index (–0.35); when all the indices were detrended, their correlations remained qualitatively unchanged, but with reduced values (–0.67 vs. –0.28).
| Central–eastern China | North China | South China | |
| SON Arctic SIA | –0.82*(–0.67*) | –0.66*(–0.65*) | –0.82*(–0.50*) |
| DJF Niño3.4 | –0.35*(–0.28) | –0.22(–0.16) | –0.41*(–0.41*) |
| Note: The values in parentheses are the correlation coefficients when the SIA or Niño3.4 indices were detrended. Values marked with an asterisk indicate significance at the 95% confidence level. | |||
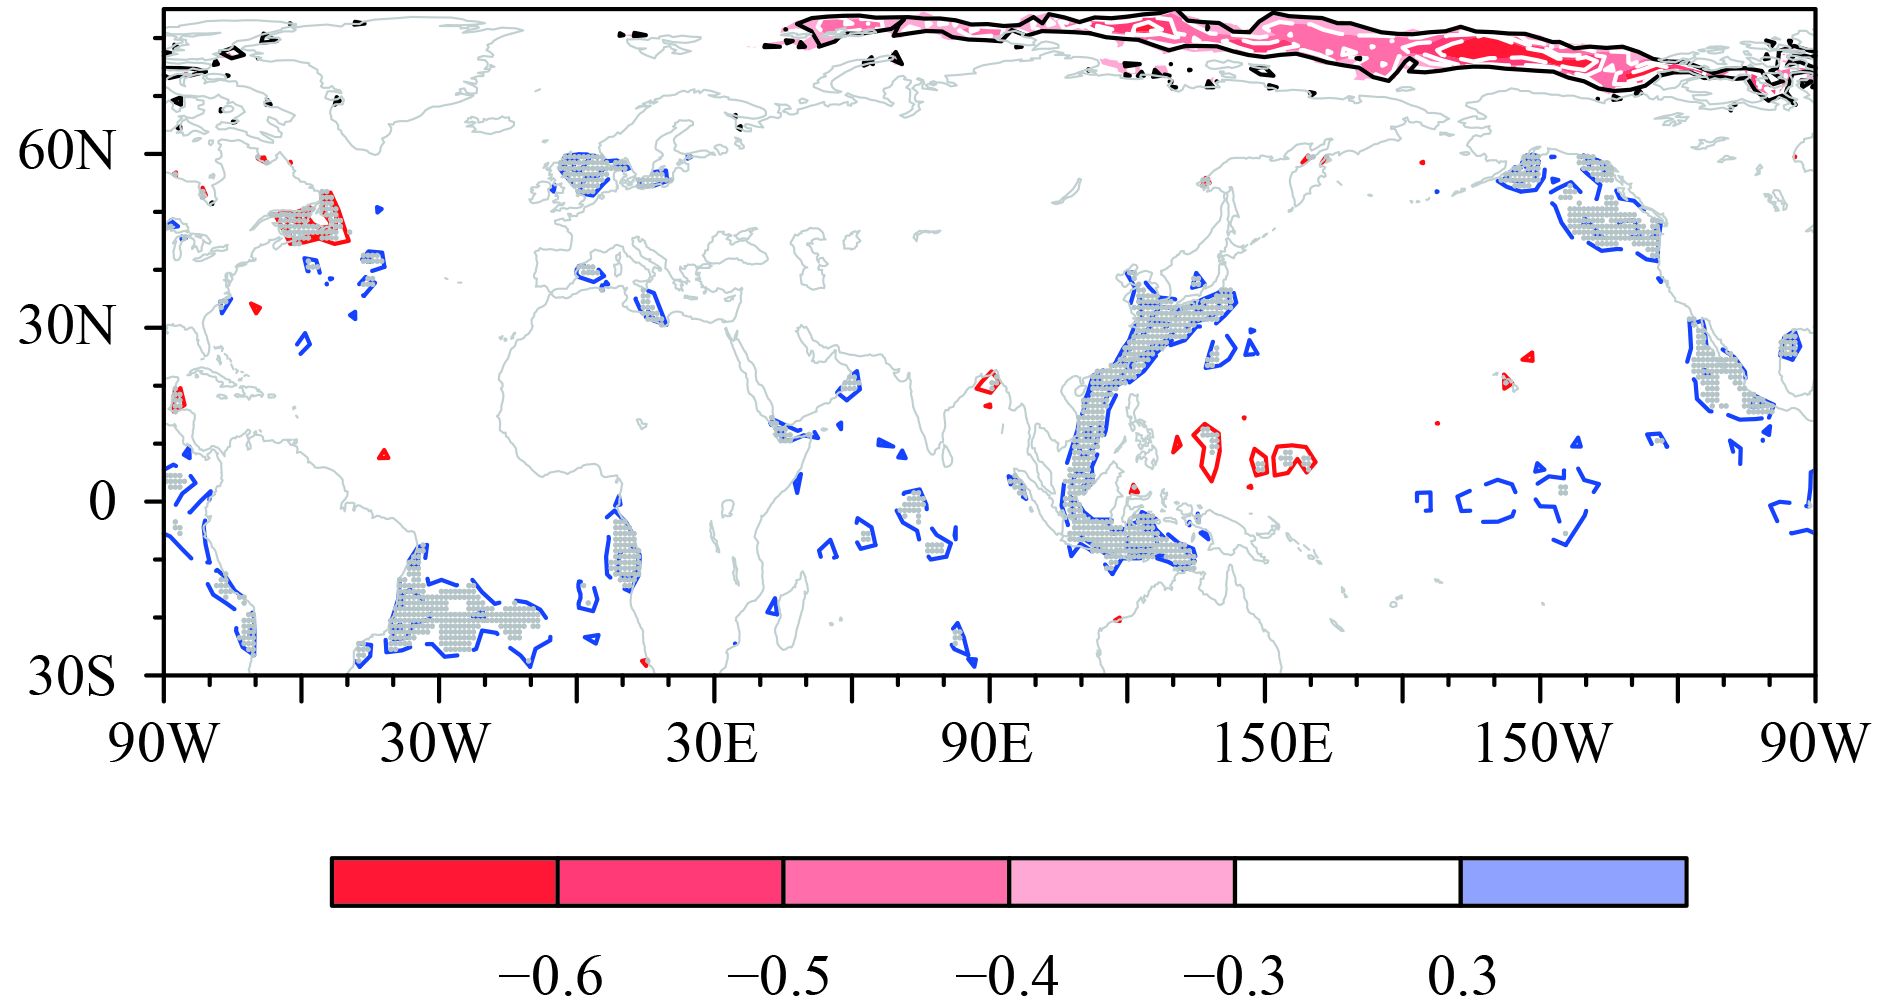
Figure 2 displays the distribution of the Arctic sea ice anomaly and SST anomaly (SSTA) in association with the number of winter haze days in central–eastern China. Evidently, in accordance with the increase in haze, the Arctic sea ice decreased substantially, particularly in the boundary seas, including the Barents, Kara, Laptev, eastern Siberian, Chukchi, and Beaufort Seas. This is in agreement with the correlation inTable 2. In comparison, the SSTA signals were weak, and no evident ENSO was seen. This illustrates that the total number of haze days in central–eastern China on an interannual timescale was not closely linked to ENSO.
|
| Figure 2 Correlation coefficient (CC) of the number of haze days in central–eastern China with autumn sea ice concentration (SIC; color shading) and winter SST (contours and gray shading). For the CC with SIC, the black line indicates significance at the 95% confidence level. For the CC with SST, only the contours with absolute values above 0.3 are given, and the interval is 0.1. Shading indicates significance at the 95% confidence level. |
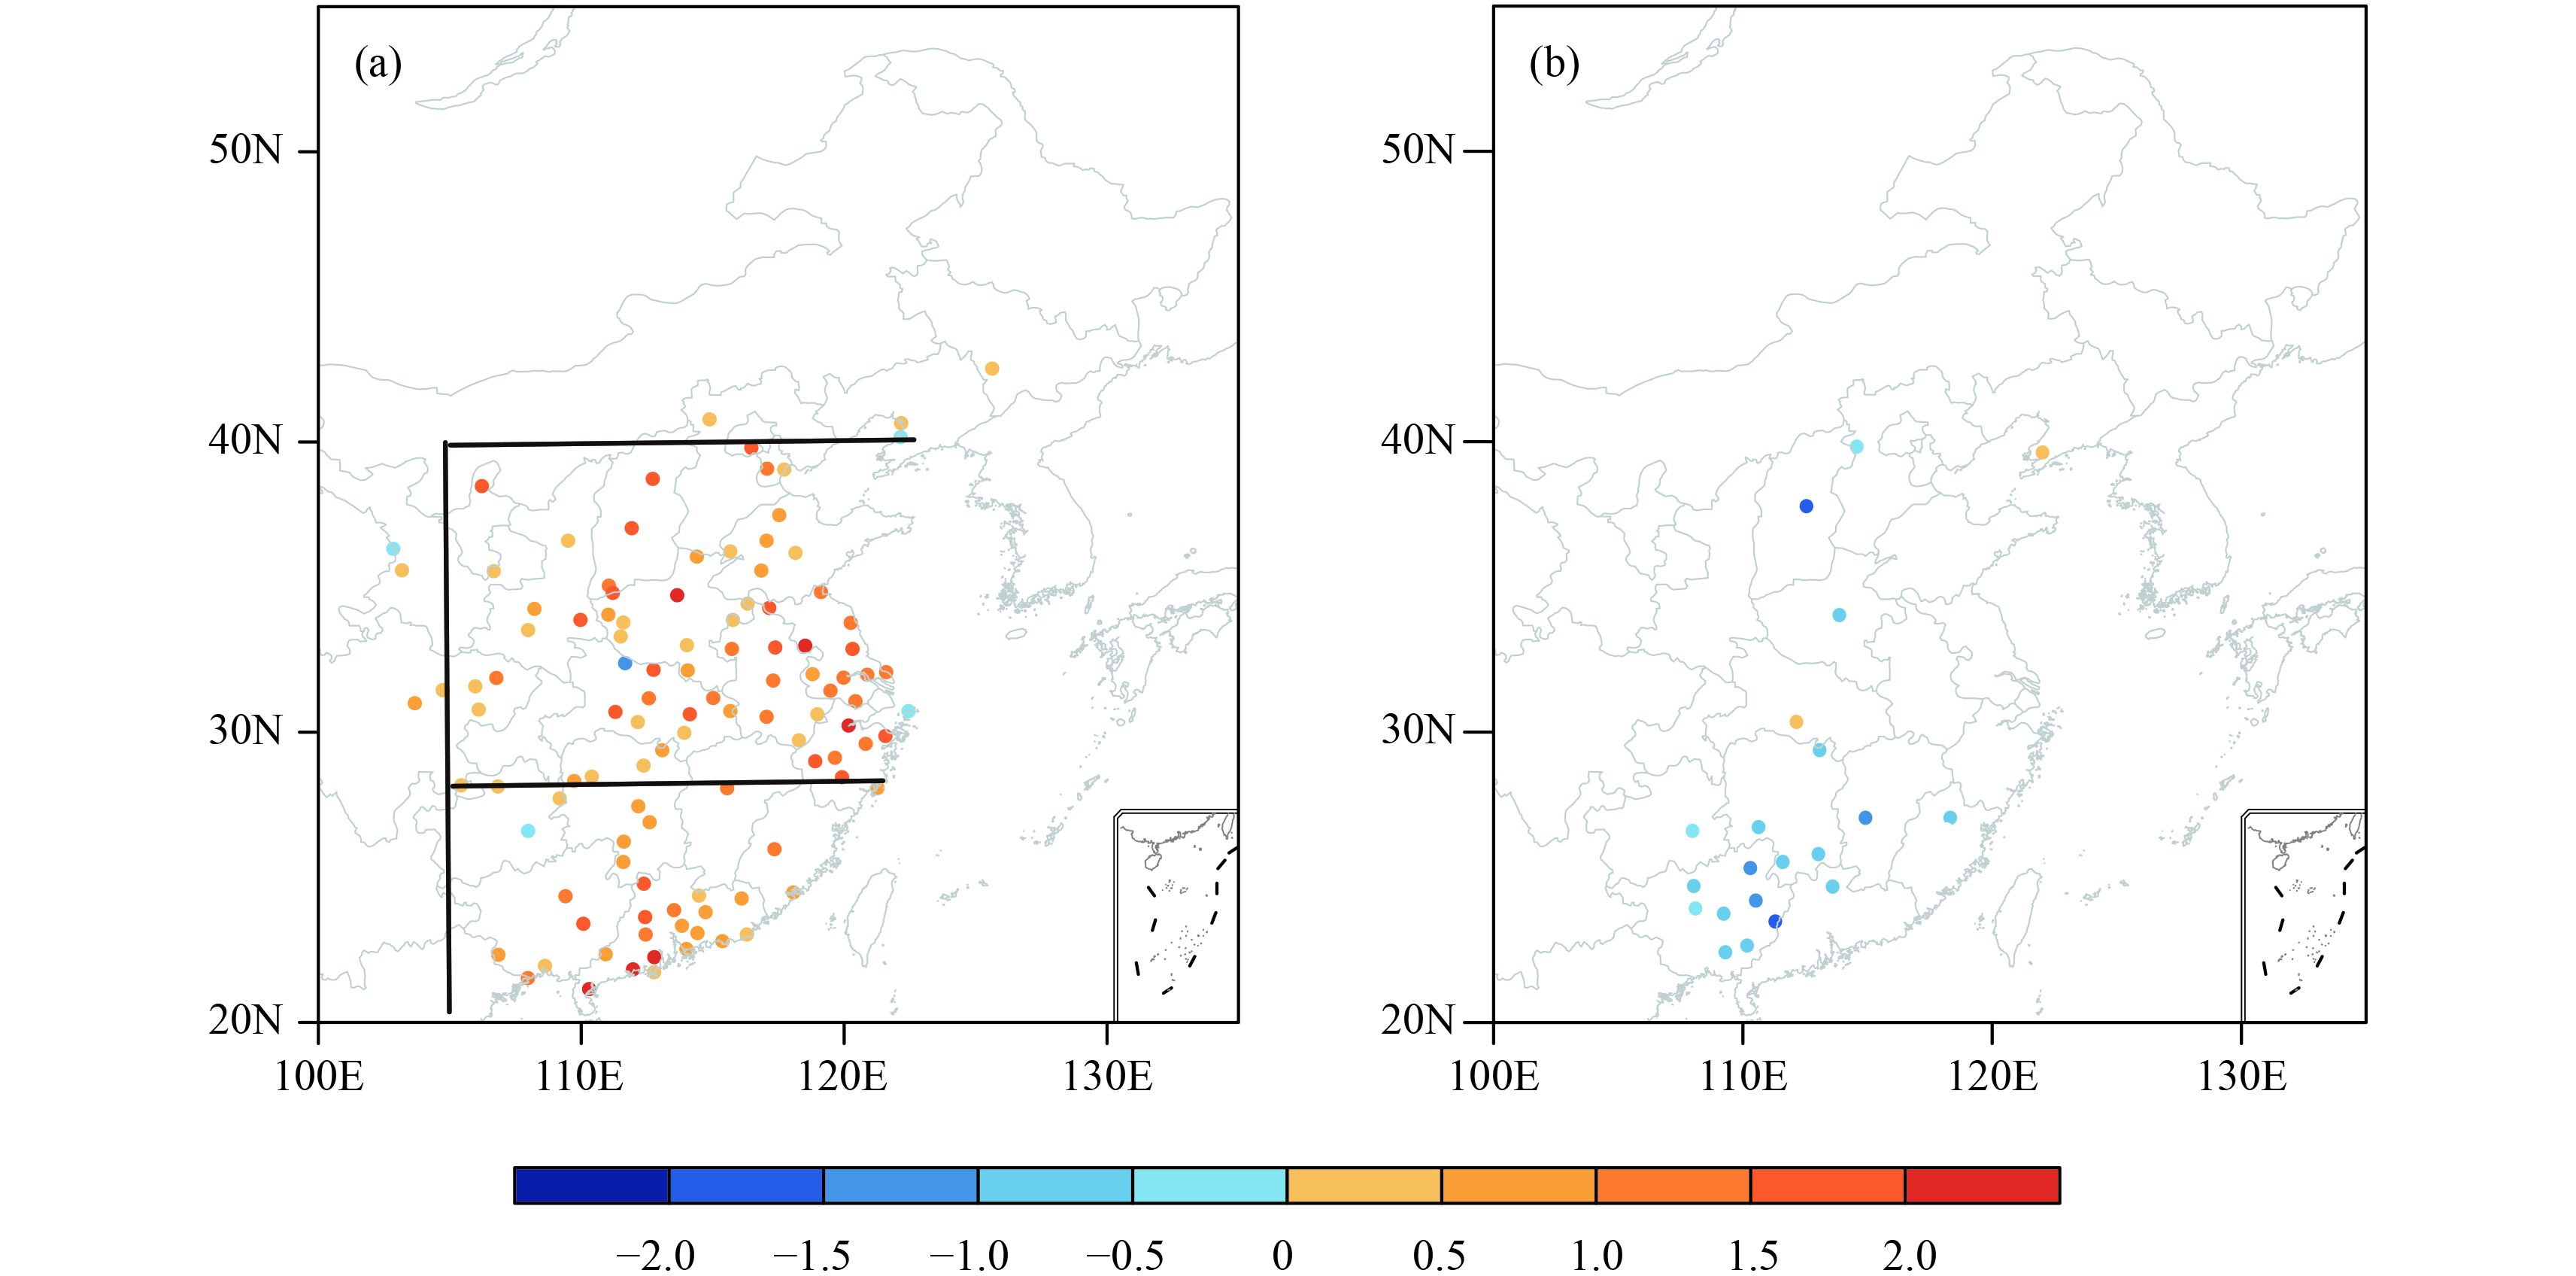
To shed light on the connection of the number of winter haze days with Arctic sea ice and ENSO events, Fig. 3 shows a comparison of the regressions of the number of winter haze days against the autumn Arctic sea ice area index and against the Niño3.4 index. Herein, the sign of the sea ice index was reversed to describe the Arctic sea ice loss. Corresponding to the reduction in Arctic sea ice (Fig. 3a), the number of haze days in central–eastern China substantially increased, consistent with the above analyses. However, for Niño 3.4 (Fig. 3b), the anomalous number of haze days was overall restricted to southern China, where the number of winter haze days was reduced corresponding to the positive phase of ENSO. No significant haze day anomalies were seen elsewhere. In other words, the impact from the ENSO events was more regional. This suggests a difference in impacts from Arctic sea ice loss and ENSO events. To further illustrate the difference, the central–eastern China region was divided into two sub-regions along 28°N: northern China and southern China. Although the number of haze days in the two sub-regions overall varied unanimously (Fig. 1a), one can see that the correlation of the number of winter haze days in northern China with the Arctic sea ice was higher than that with ENSO (Table 2). In particular, the number of haze days in northern China was not significantly correlated with Niño3.4 but was significantly negatively correlated with ENSO, with a coefficient of –0.41.
|
| Figure 3 Regressions of the winter haze days (day mon–1) against the (a) autumn Arctic SIA index and (b) winter Niño3.4 index. The signs of the SIA index in (a) are reversed to correspond to sea ice loss. |
Figure 4 shows a comparison of the regressions against the number of haze days in northern and southern China. Corresponding to the increased number of haze days in both northern and southern China, the Arctic sea ice was substantially reduced. There was no obvious correlation of SSTA to the increased number of haze days in northern China, but the La Niña-like SSTA corresponded to the increased number of haze days in southern China. The analyses verified the difference in the impacts on the number of winter haze days between the Arctic sea ice anomaly and ENSO.
One may wonder if there is a possibility that the sea ice anomaly in Fig. 4b is generated by the La Niña event, rather than directly linked to haze days in southern China, since the sea ice regression map in Fig. 4a is very different from that in Fig. 4b. One recent study by Zhang and Li (2017) also suggested that the La Niña-like SSTA may induce Arctic sea ice loss similar to that in Fig. 4b. We checked the independence attributes of Arctic sea ice and ENSO, and found that they are overall independent of each other during the analysis period of the present study (Han et al., 2016a). Nevertheless, this issue deserves a further study.

|
| Figure 4 As in Fig. 2, but for the increase in haze days in (a) northern China and (b) southern China. |
As mentioned above, the occurrence of haze is closely related to two weather factors: (1) a calm or weak ventilation condition and (2) stable stratification. Globally, clearing haze depends on dry and wet deposition (rain washing); but regionally, it depends more on dispersion and transport. For example, cold air activity plays a crucial role in clearing and dispersing winter haze in Beijing (Zhang X. Y. et al., 2013). Therefore, near-surface wind speeds, atmospheric stability, and precipitation are important for the occurrence, maintenance, and dispersal of haze.
|
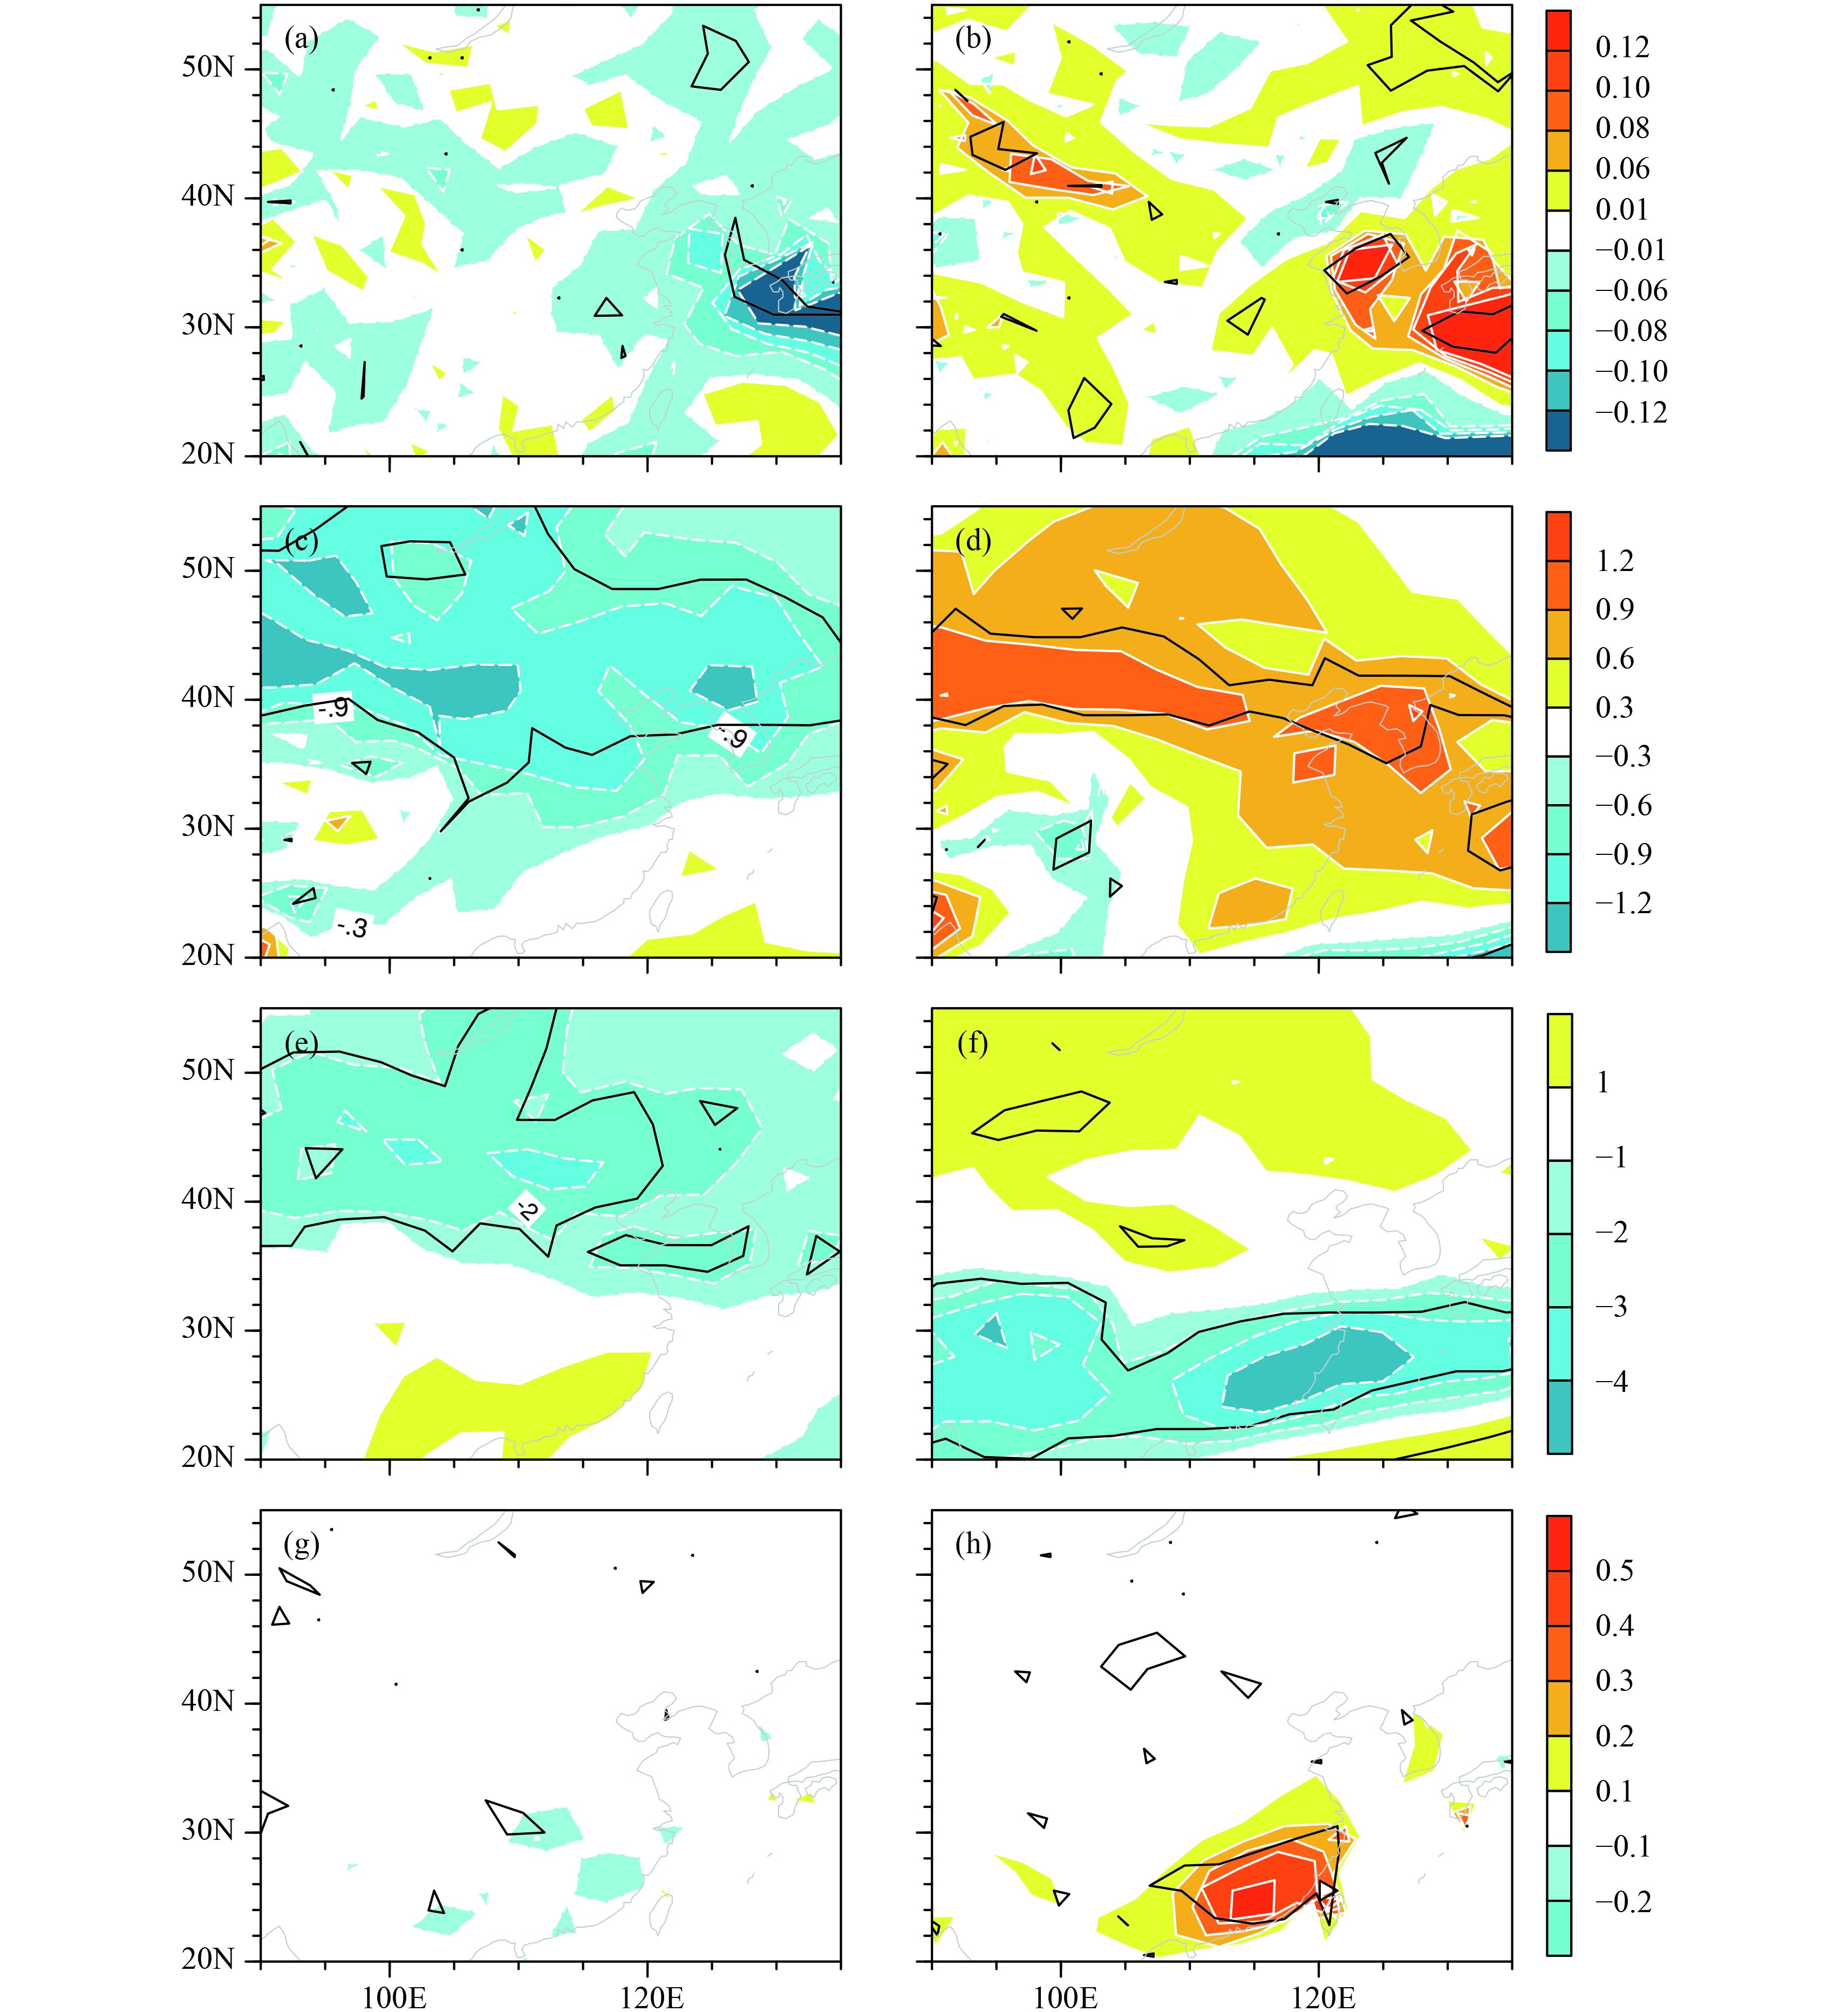
| Figure 5 Regression of (a, b) winter wind speeds (m s–1) at 10-m height, (c, d) K-index (°C), (e, f) OLR (W m–2), and (g, h) precipitation (mm day–1) against (a, c, e, g) autumn Arctic SIA and (b, d, f, h) winter Niño3.4 indices. For the regression onto the Arctic SIA index, the signs are reversed, corresponding to sea ice loss. The black line indicates significance at the 90% confidence level. |
Figures 5a and b compares the wind speeds at a height of 10 m in association with Arctic sea ice loss and El Niño. Corresponding to Arctic sea ice loss, there was a weak reduction in wind speeds in much of central–eastern China, albeit with a lack of significance. The weakened near-surface wind speeds were in agreement with the increased number of haze days. Regarding El Niño, the near-surface wind speeds intensified in much of central–eastern China, but again, there was a lack of significance. The opposite change of the near-surface wind speeds in southeastern China linked to the Arctic sea ice reduction and to El Niño suggests their offset influence on haze.
The atmospheric stratification stability can be measured by using the K-index. The K-index is computed by
| $K = {T_{850}} - {T_{500}} + {T_{{\rm{d}}850}} - {\left( {T - {T_{\rm{d}}}} \right)_{700}},$ |
where Ti is the air temperature at the ith level, and (Td)j is the jth level dew point temperature calculated from actual air temperature and relative humidity under the Magnus-Tetens approximation (Wang et al., 2015). The K-index represents the integrative state of atmosphere static stability and saturation condition. As the K-index increases, the stratification becomes increasingly weak and unstable. From Figs. 5c, d, it is seen that the Arctic sea ice loss corresponded to a decreased K-index. This means that the sea ice loss favored increased stable stratification, in agreement with the increased number of haze days. In comparison, El Niño’s impact on the K-index was opposite, albeit it was less clear in southern China.
Rain washing plays an important role in the deposition and clearance of aerosols. Figures 5e and g show that the weakened convection (positive OLR anomaly) and decreased precipitation in the southern region (south of 32°N) of central–eastern China corresponded to the Arctic ice loss, consistent with the increased number of haze days. The weakened OLR in the northern (north of 32°N;Fig. 5e) may be explained as a result of increased haze days, because more haze intercepts and retains more long wave radiation near the surface and causes less OLR penetrating the top of atmosphere. In comparison, there was a dipolar precipitation anomaly, with increased precipitation in the south and less precipitation in the north, linked to El Niño (Fig. 5h). The increased precipitation in the south contributed to the reduced haze occurrence. The correspondence of the precipitation regressions to those of OLR (Figs. 5f, h) suggests that ENSO intensifies the rainfall in southeastern China through inducing more convection to a large degree. The intensified convection is favorable for the vertical dispersion of aerosols, reducing aerosols in addition to the rain washing effect.
To understand the atmospheric circulation associated with Arctic sea ice loss and ENSO events, Fig. 6 displays distributions of SLP, Z500, and V850. Corresponding to the Arctic sea ice loss, there was a positive SLP anomaly over the region from the northern North Atlantic toward Europe and the Ural Mountains (Urals in brief), but there was a less significant anomaly over continental eastern Asia. This was also seen in previous studies (Honda et al., 2009; Wu et al., 2011; Liu et al., 2012). These anomalies favor an even distribution of air pressure over central–eastern China and are not beneficial for the dispersion of haze. As for Z500, there were strong positive anomalies over the northern North Atlantic that extended from northern Europe to the Urals. These Z500 anomalies, together with the positive anomalies in SLP, implied a quasi-barotropic structure. Although the positive seasonal-mean anomalies may correspond to either an intensified amplitude or increased frequency of blocking, one recent study byGong and Luo (2017) suggested that the increased frequency was the dominant cause. Such intensified persistence of blocking circulation provides a background for calm and steady weather condition (SMSSDM, 1957; Tao, 1959). This is also seen from a zonal-extending weak negative Z500 anomaly over central to East Asia and no obvious Z500 over Baikal Lake to the Sea of Okhotsk. At 850 hPa, there were evident positive Z850 anomalies over northern Europe and the Urals, as also seen in Z500 and SLP. No significant anomalies were found over Mongolia and East Asia. Correspondingly, the 850-hPa wind anomaly was weak, with identifiable southerly or southwesterly anomaly in East China, albeit with a lack of significance.

|
| Figure 6 As in Fig. 5, but for (a, b) SLP (hPa), (c, d) Z500 (gpm), and (e, f) Z850 (gpm) and V850 (m s–1). The shading indicates significance above the 90% confidence level. |
Regarding El Niño, there was significant positive SLP and Z500 anomalies throughout the tropics, along with weak negative anomalies in midlatitude Eurasia. This suggests that El Niño favored the intensification of the subtropical high over the western Pacific. A consistent feature was also seen at 850 hPa. There were southwesterly anomalies over the southeastern coastal area of China, originating from the rear of the anomalous lower-level anticyclone over the Philippine Seas. The wind-speed shear at the northwestern side to the anomalous southwesterly flow caused a convergence in the lower troposphere, which favored intensified precipitation in the southeastern coastal area of China. The lower-level anticyclone was an important circulation system forced by El Niño (Zhang et al., 1999; Wang et al., 2000). Thus, these anomalies together favored weakening East Asian winter monsoon and warming winter climate (Li, 1989) and, subsequently, intensifying precipitation, and decreasing haze days due to the rain washing effect.
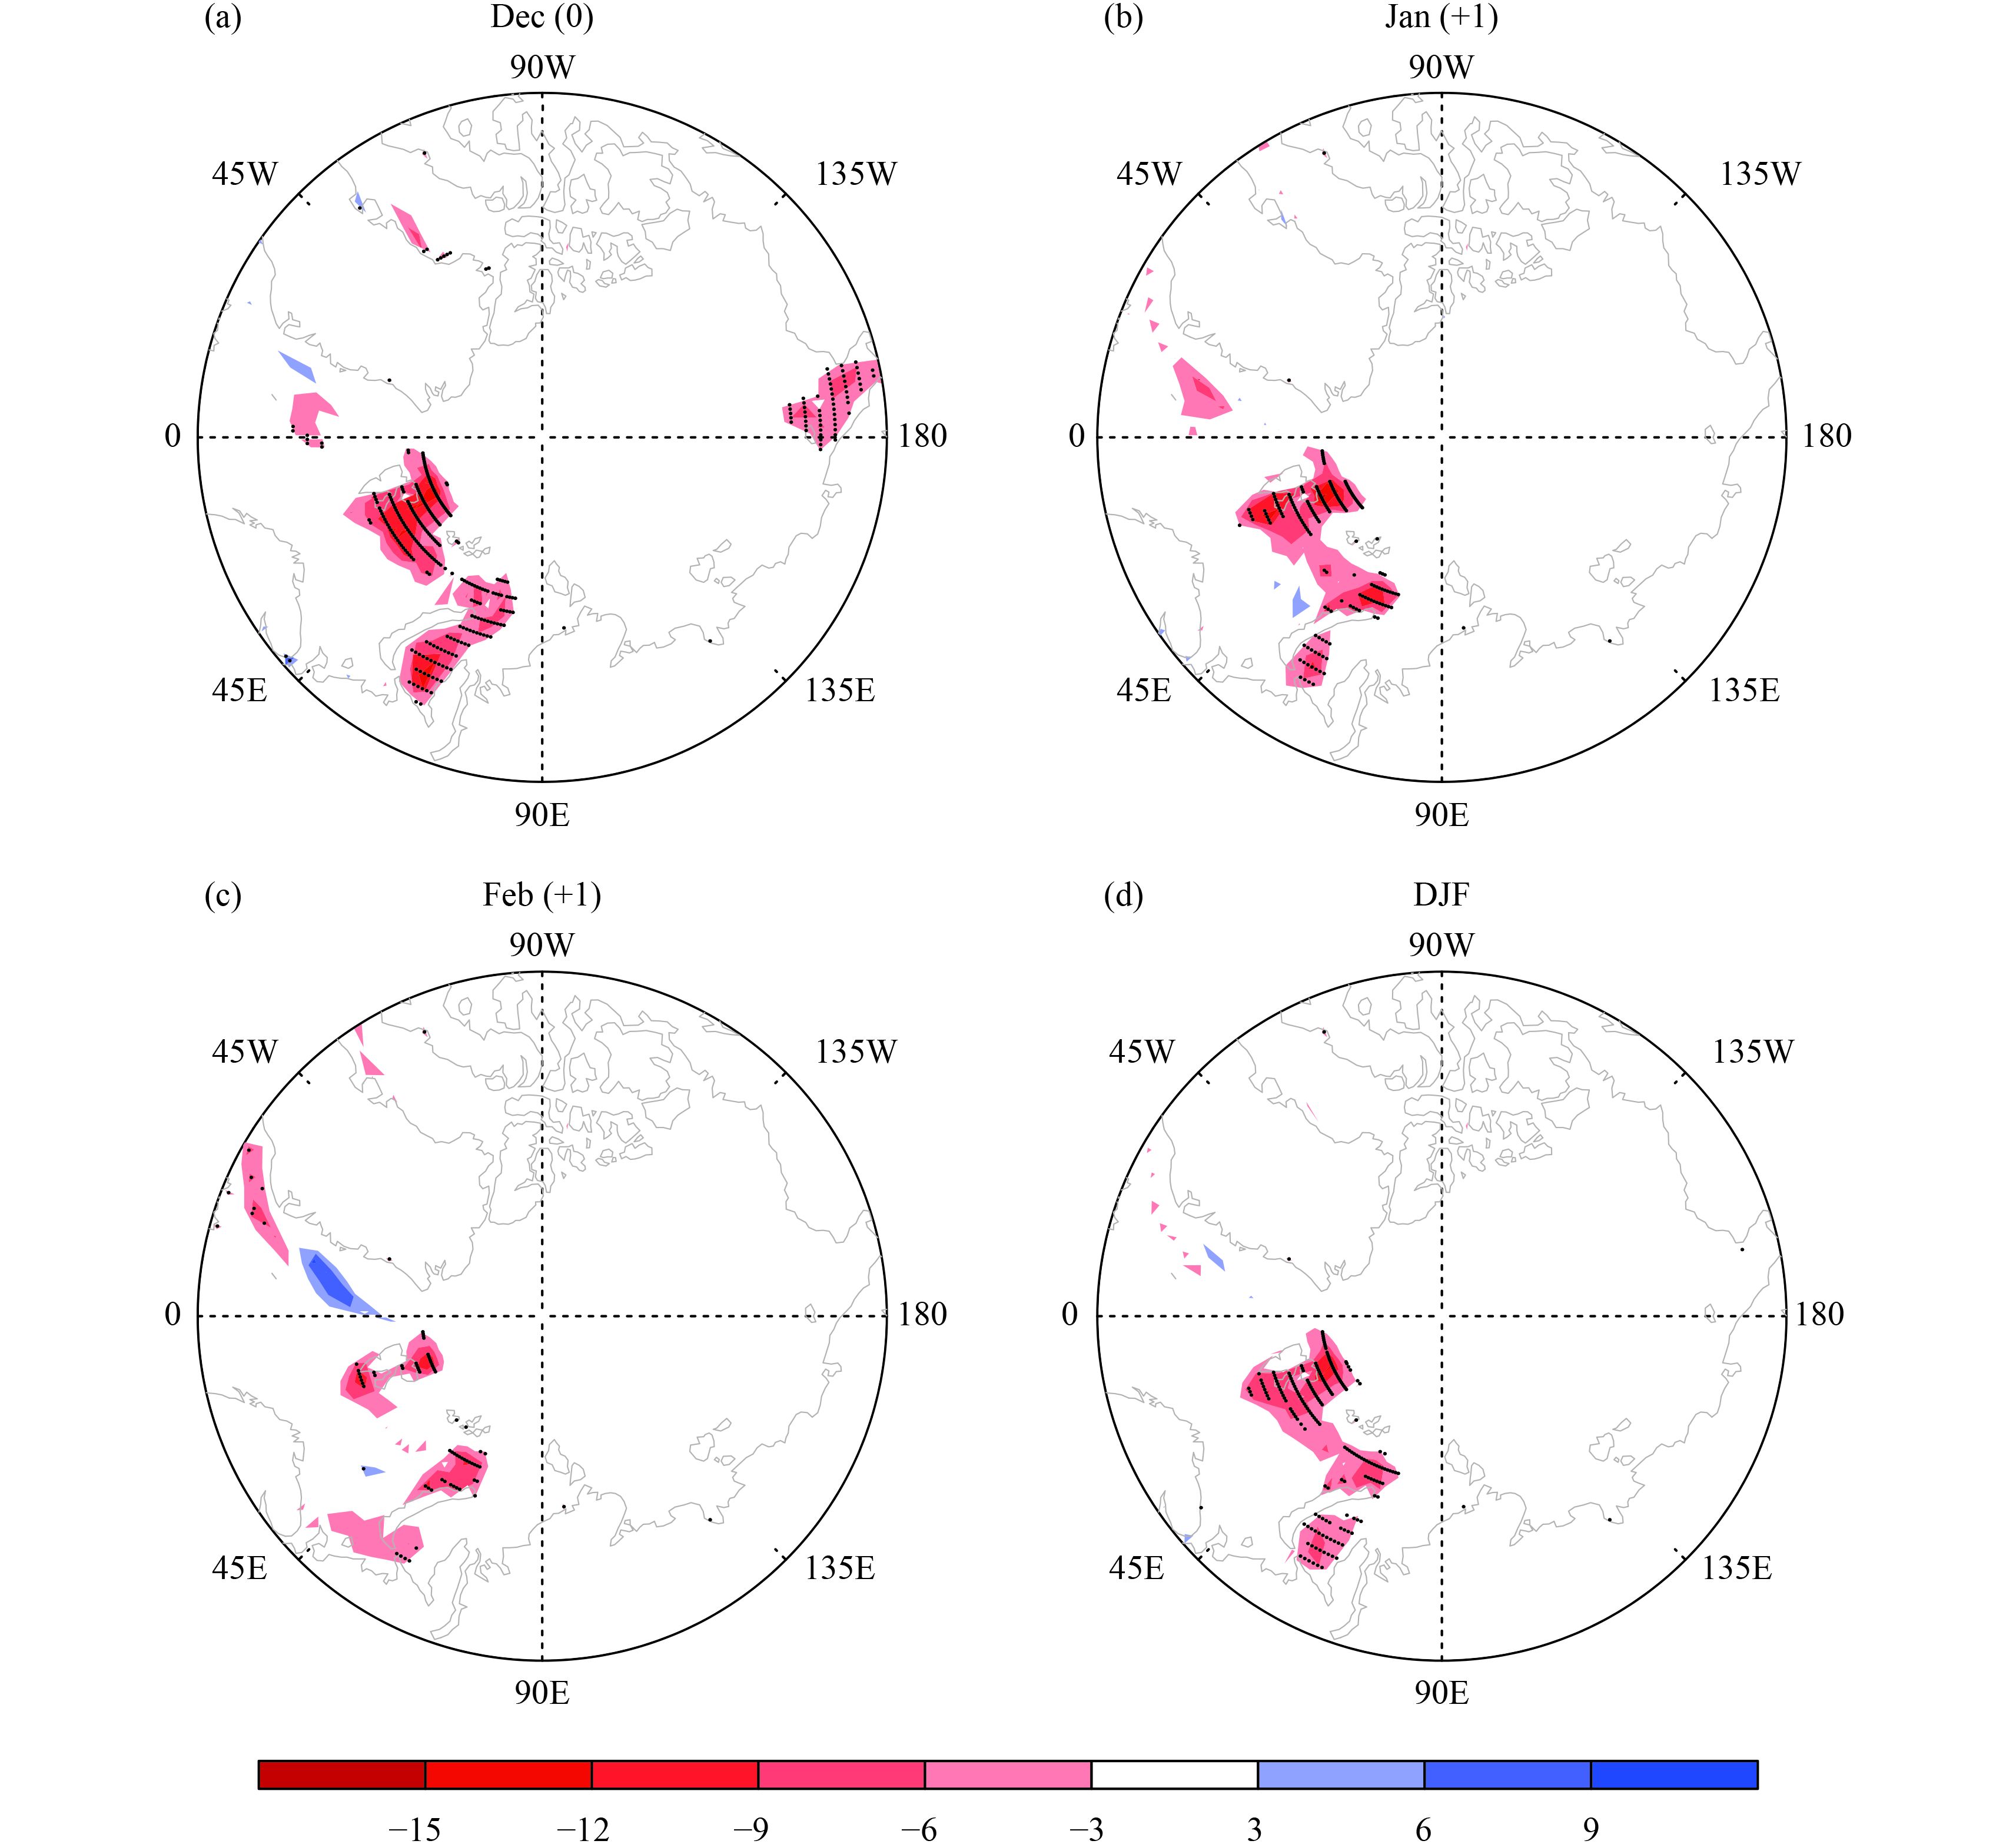
Above we showed that autumn Arctic sea ice loss played an important role in inducing more haze days in the following winter in central–eastern China. The mechanism for the across-seasonal connection is unclear because the atmosphere lacks memory and the autumn sea ice forced atmospheric signals cannot be maintained long enough to persist into winter. One possibility is the across-seasonal persistence of the Arctic sea ice anomaly itself.Figure 7 displays the following-winter sea ice regressions onto the autumn Arctic sea ice. A significant negative value (reduction) is seen in the Barents-Kara Seas. The reduction arose from the persistent part of the autumn sea ice reduction therein to a considerable extent, which can be seen from the seasonal evolution of the composite autumn sea ice (figure omitted). This illustrates that sea ice anomalies in the Barents-Kara Seas can bridge the across-seasonal connection between the winter climate and the preceding autumn sea ice anomaly. In addition, other processes such as snowfall on the Eurasian Continent may also play roles in bridging the across-seasonal connection (Walsh, 2014) because autumn sea ice can influence snowfall and the anomalous snow cover easily persists into the following winter, which in turn impacts the climate.
|
| Figure 7 The sea ice regression evolution in (a) December, (b) January, (c) February, and (d) the winter (DJF) mean, linked to the haze-related autumn sea ice reduction. The dotted regions have values above the 95% confidence level. |
One may wonder why the winter sea ice is not used as the index to derive the Arctic sea ice–haze connection, now that the impact of autumn sea ice on haze days over China involves the issue of persistence. There are three reasons for this. First, the interannual variability of Arctic sea ice in winter is much weaker than that in autumn, and, as such, the winter Arctic sea ice anomaly linked to haze is less evident. Second, it is difficult to derive the cause–effect connection between the Arctic sea ice and haze due to the simultaneous feedback between the sea ice and atmospheric circulation (e.g.,Deser et al., 2000; Wu and Zhang, 2010; Han et al., 2016b). Finally, in comparison with autumn, the sea ice in winter is less useful for winter climate prediction due to a lack of lead time.
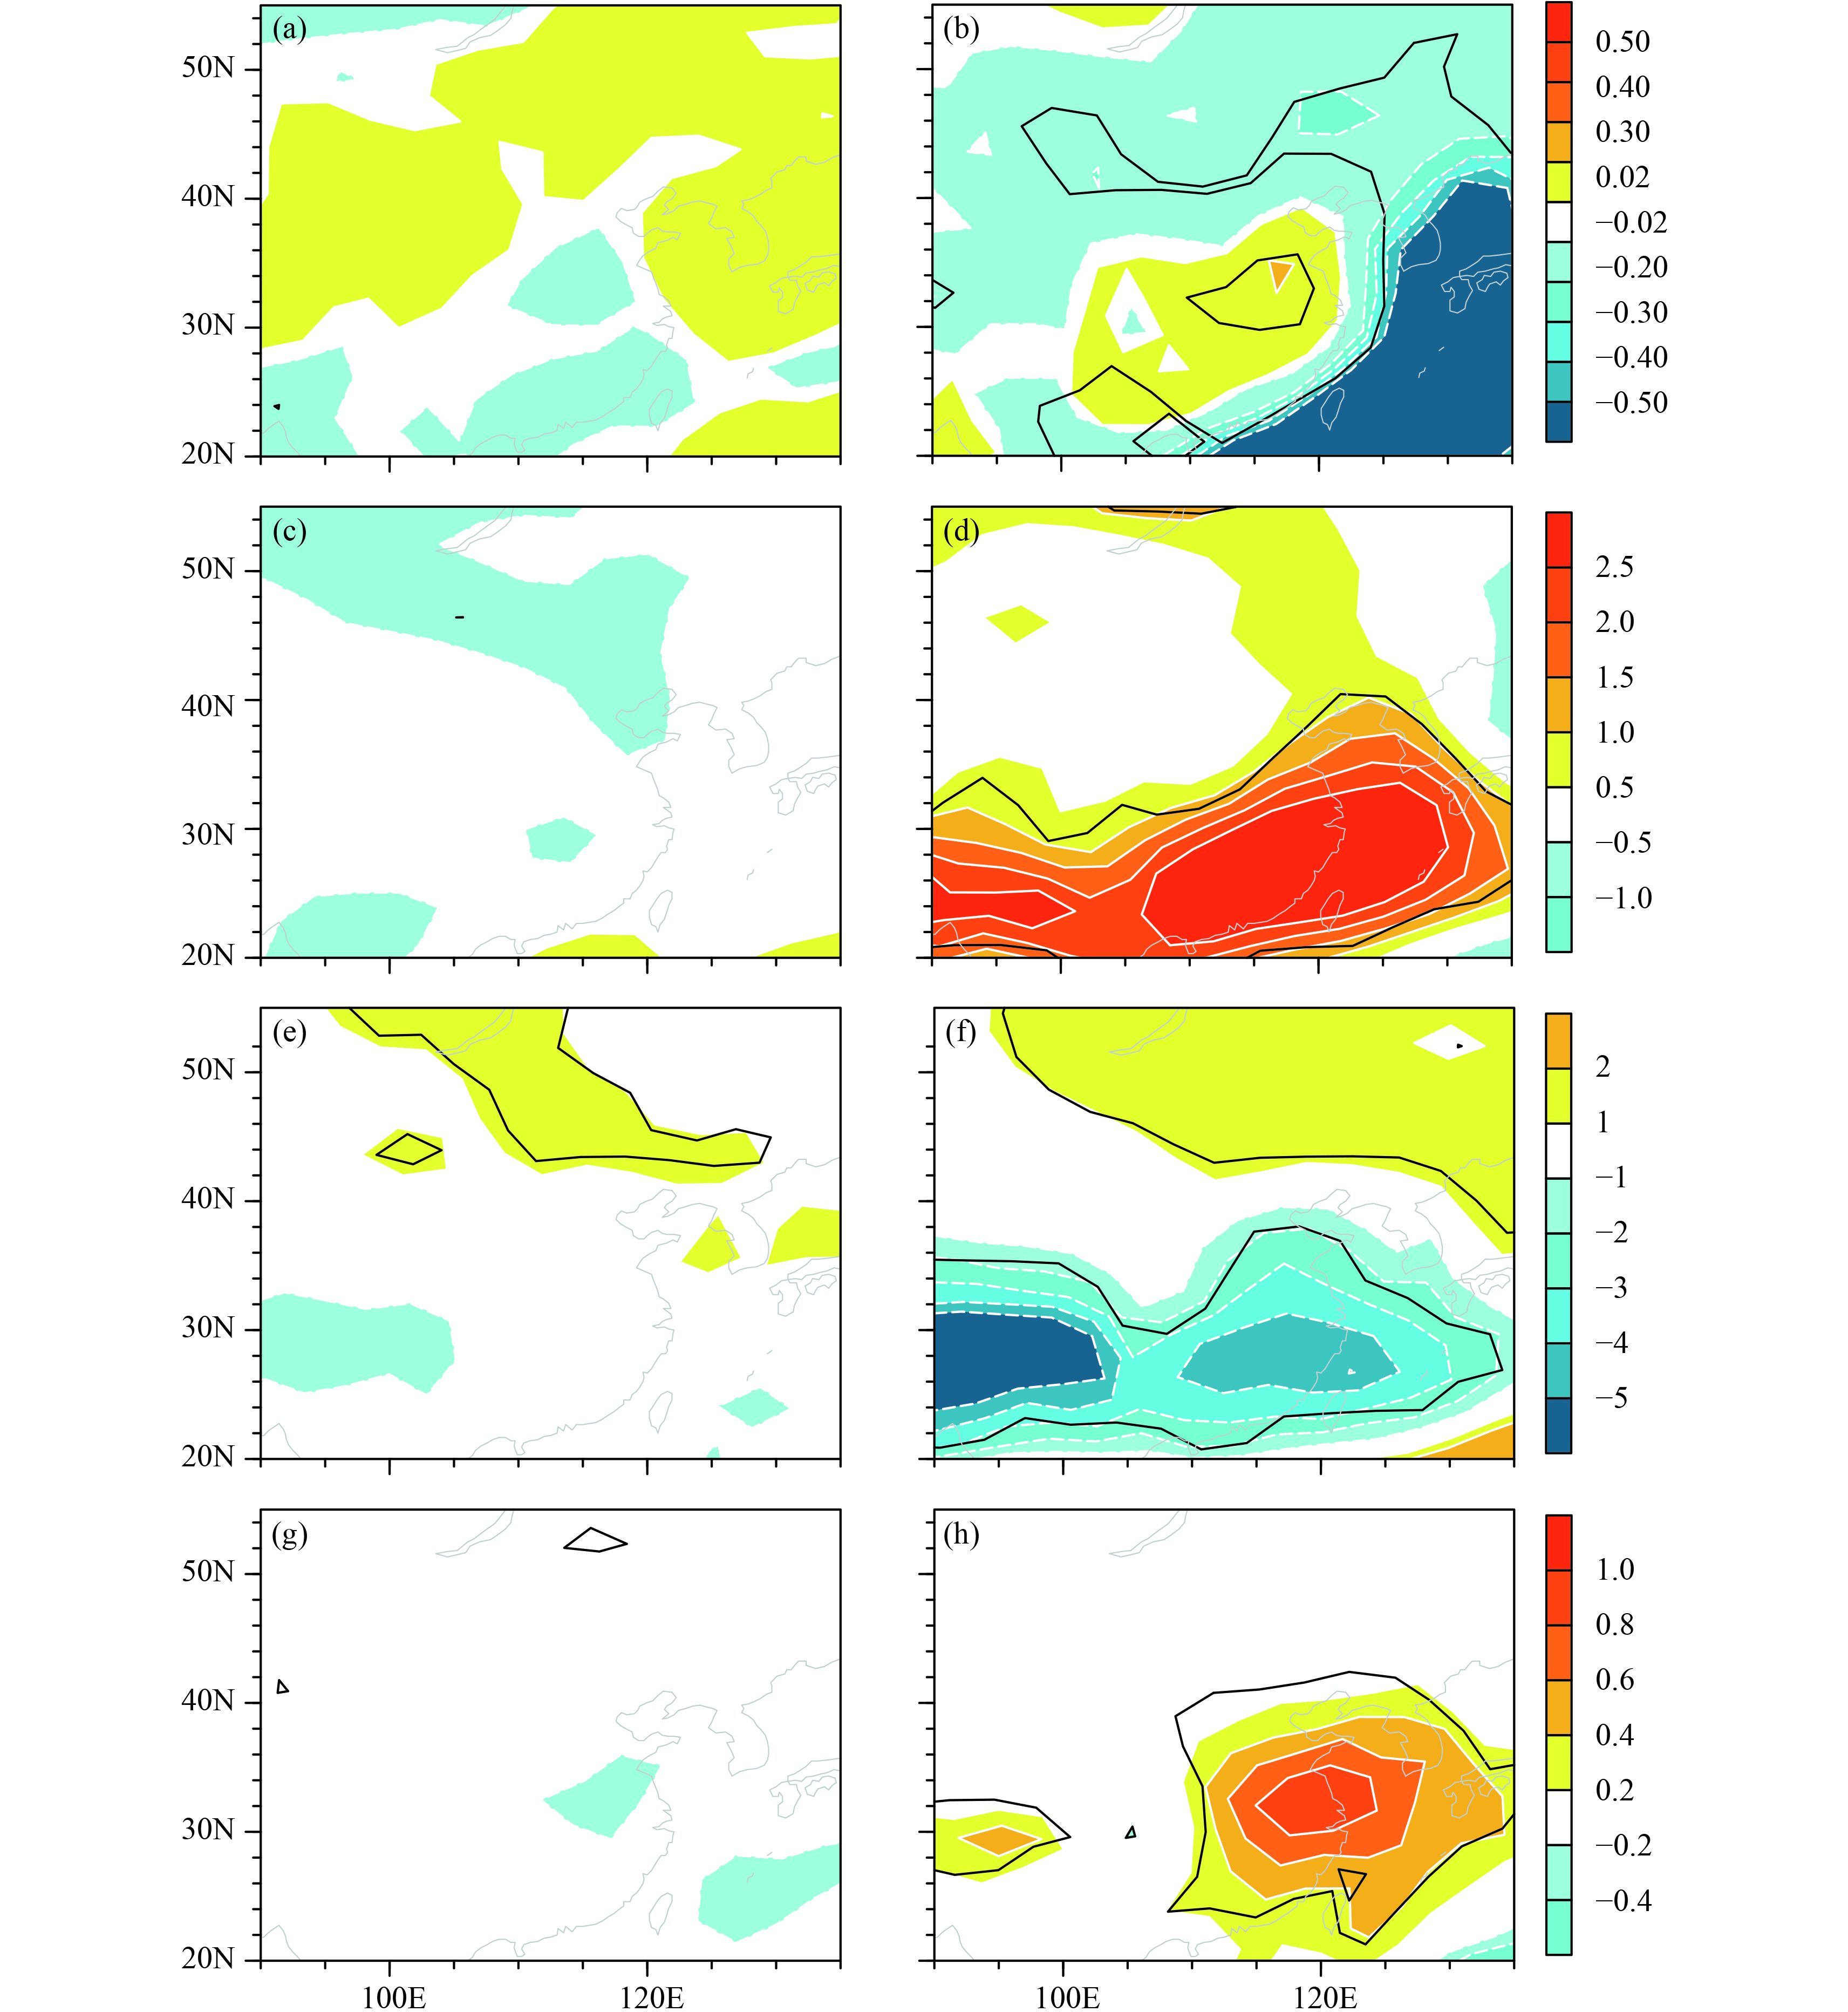
4 AGCM resultsBecause there are no visibility outputs, winter haze days cannot be derived from the AGCM outputs; as a consequence, the impacts of Arctic sea ice loss and ENSO cannot be derived either. Alternately, we analyzed the meteorological condition relevant to haze days to obtain implications on the impacts of the sea ice and ENSO forcing on haze.
|
| Figure 8 As in Fig. 5, but for AGCM simulated response to Arctic sea ice loss (left panels) and Niño3.4 SSTA (right panels). |
Figure 8 compares the modeled responses of the near-surface wind speed at a height of 10 m, K-index, OLR, and precipitation. It is seen that the sea ice loss induced a weak decrease in the near-surface wind speeds throughout much of central–eastern China along with a decrease in theK-index in northern China. The latter indicates increased stratification stability. An intensified precipitation response was seen in the northern region, but there was no convective precipitation response in much of central–eastern China. By comparing these response results with the observational regressions, a consistency is found evident (Figs. 8a, c, e, g versus those in Fig. 5). This suggests that the linkage between the haze days and Arctic sea ice loss seen in the observations should be a relation of cause and effect.
Regarding El Niño, it induced a decreased near-surface wind speed response in northern and southeastern China but an increased wind speed response in central China, along with increased responses in the K-index and precipitation (also convective precipitation) in southern China (Figs. 8b, d, f, h). These responses are also in agreement with the observational regressions (Figs. 8b, d, f, h versus those in Fig. 5), suggesting a substantial effect of El Niño on the meteorological condition relevant to haze days.
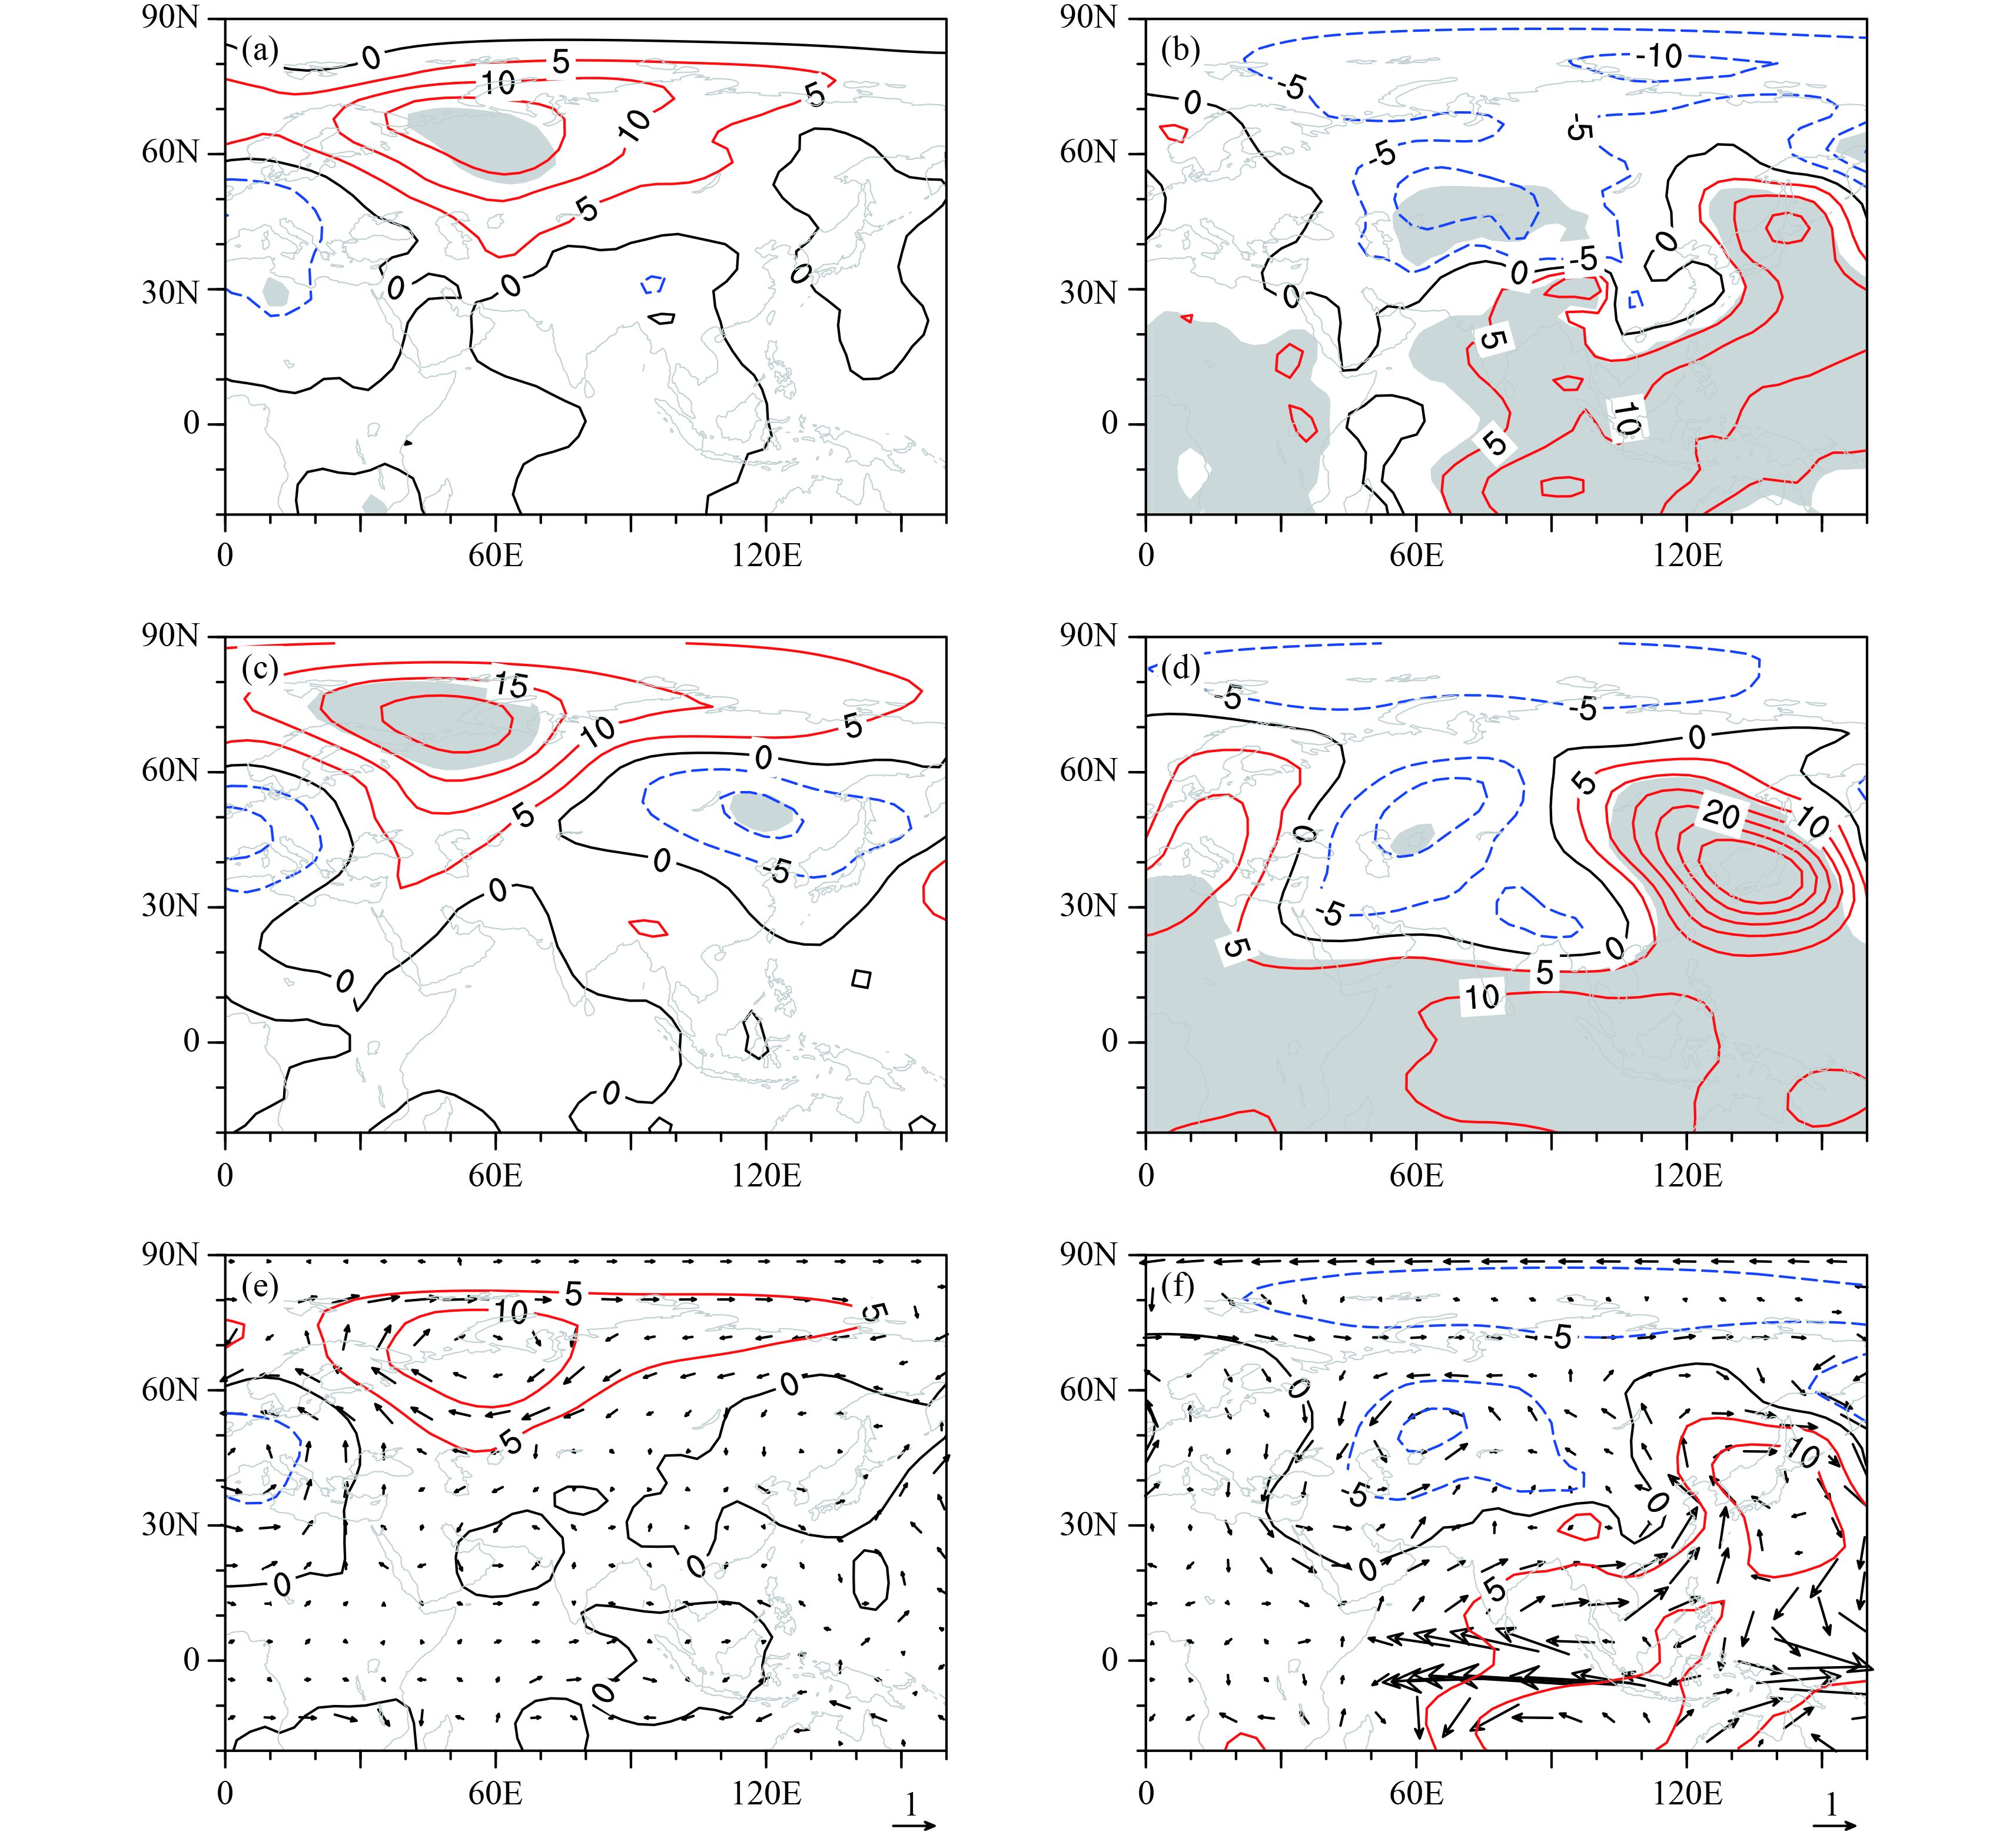
Regarding atmospheric circulation, the sea ice loss induced enhanced SLP and Z500 responses in the northwestern part of the Eurasian Continent, particularly over the Urals (Figs. 9a, c, e). These responses favored more-frequent occurrence or persistence of atmospheric blocking patterns. In addition, there were less evident SLP responses over Siberia and southeastern Asia. This favored an even distribution of atmospheric pressure fields over East Asia. These large-scale atmospheric circulation responses were also generally consistent with the observational regressions (Figs. 9a, c, e versus those in Fig. 6).
|
| Figure 9 As in Fig. 6, but for AGCM results. |
Regarding El Niño, it induced an increased SLP response throughout the tropics along with a decrease in the midlatitudes (Figs. 9b, d, f). As for Z500, the tropical responses were similar to those of SLP, favoring the intensification of the subtropical high in the western Pacific. In addition, there were substantial positive height responses over the East Asian coast, which weakened the climatological East Asian Grand Trough, a key system that consists of the East Asian winter monsoon. At the lower levels, there was a southerly response, which was part of the low-level anticyclonic response over the South China Sea and the Philippine Seas. The wind shear convergence corresponding to the lower-level wind response explains the intensified precipitation in southeastern coastal China. It may have contributed to the decreased number of haze days through the rain washing effect. These responses acting together weakened the East Asian winter monsoon. Thus, the AGCM results supported the effects of the Arctic sea ice loss and ENSO on the winter haze days as well as their differences illustrated in the observational regressions.
5 Discussion and conclusionsIn this study, we compared the effects of autumn Arctic sea ice reduction and El Niño events on winter haze days in central–eastern China through observational analyses and AGCM sensitivity experiments. The results suggested that both forcings produced a substantial impact, but the influential domains and underlying mechanisms were different between them.
The impact domain of the Arctic sea ice loss was broader. It caused increased haze days throughout central–eastern China. Mechanistically, it induced substantial positive height anomalies over the northern North Atlantic and Europe. These intensified the frequency of blocking highs over the Atlantic, northern Europe, and the Urals upstream of Asia. While the blocking is maintained, an even distribution of surface air pressure appears in northern East Asia. This contributed to decreased near-surface wind speeds and intensified atmospheric stratification stability, which provided calm and steady meteorological conditions for the occurrence of haze.
In comparison, ENSO’s impact was primarily restricted to the region of southern China, and its positive/negative phase (El Niño/La Niña) caused reduced/increased haze days in southern China. The primary mechanism was the rain washing effect. El Niño caused more precipitation in coastal southeastern China through a lower-tropospheric anomalous anticyclone over the Philippine Seas, which has been well illustrated in previous studies (Zhang et al., 1999; Wang et al., 2000; Li et al., 2008; Xie et al., 2009). The anomalous southwesterly at the rear of the anticyclone increased moisture transport from the South China Sea, causing an anomalous moisture convergence and resulting in intensified precipitation in southeastern coastal China.
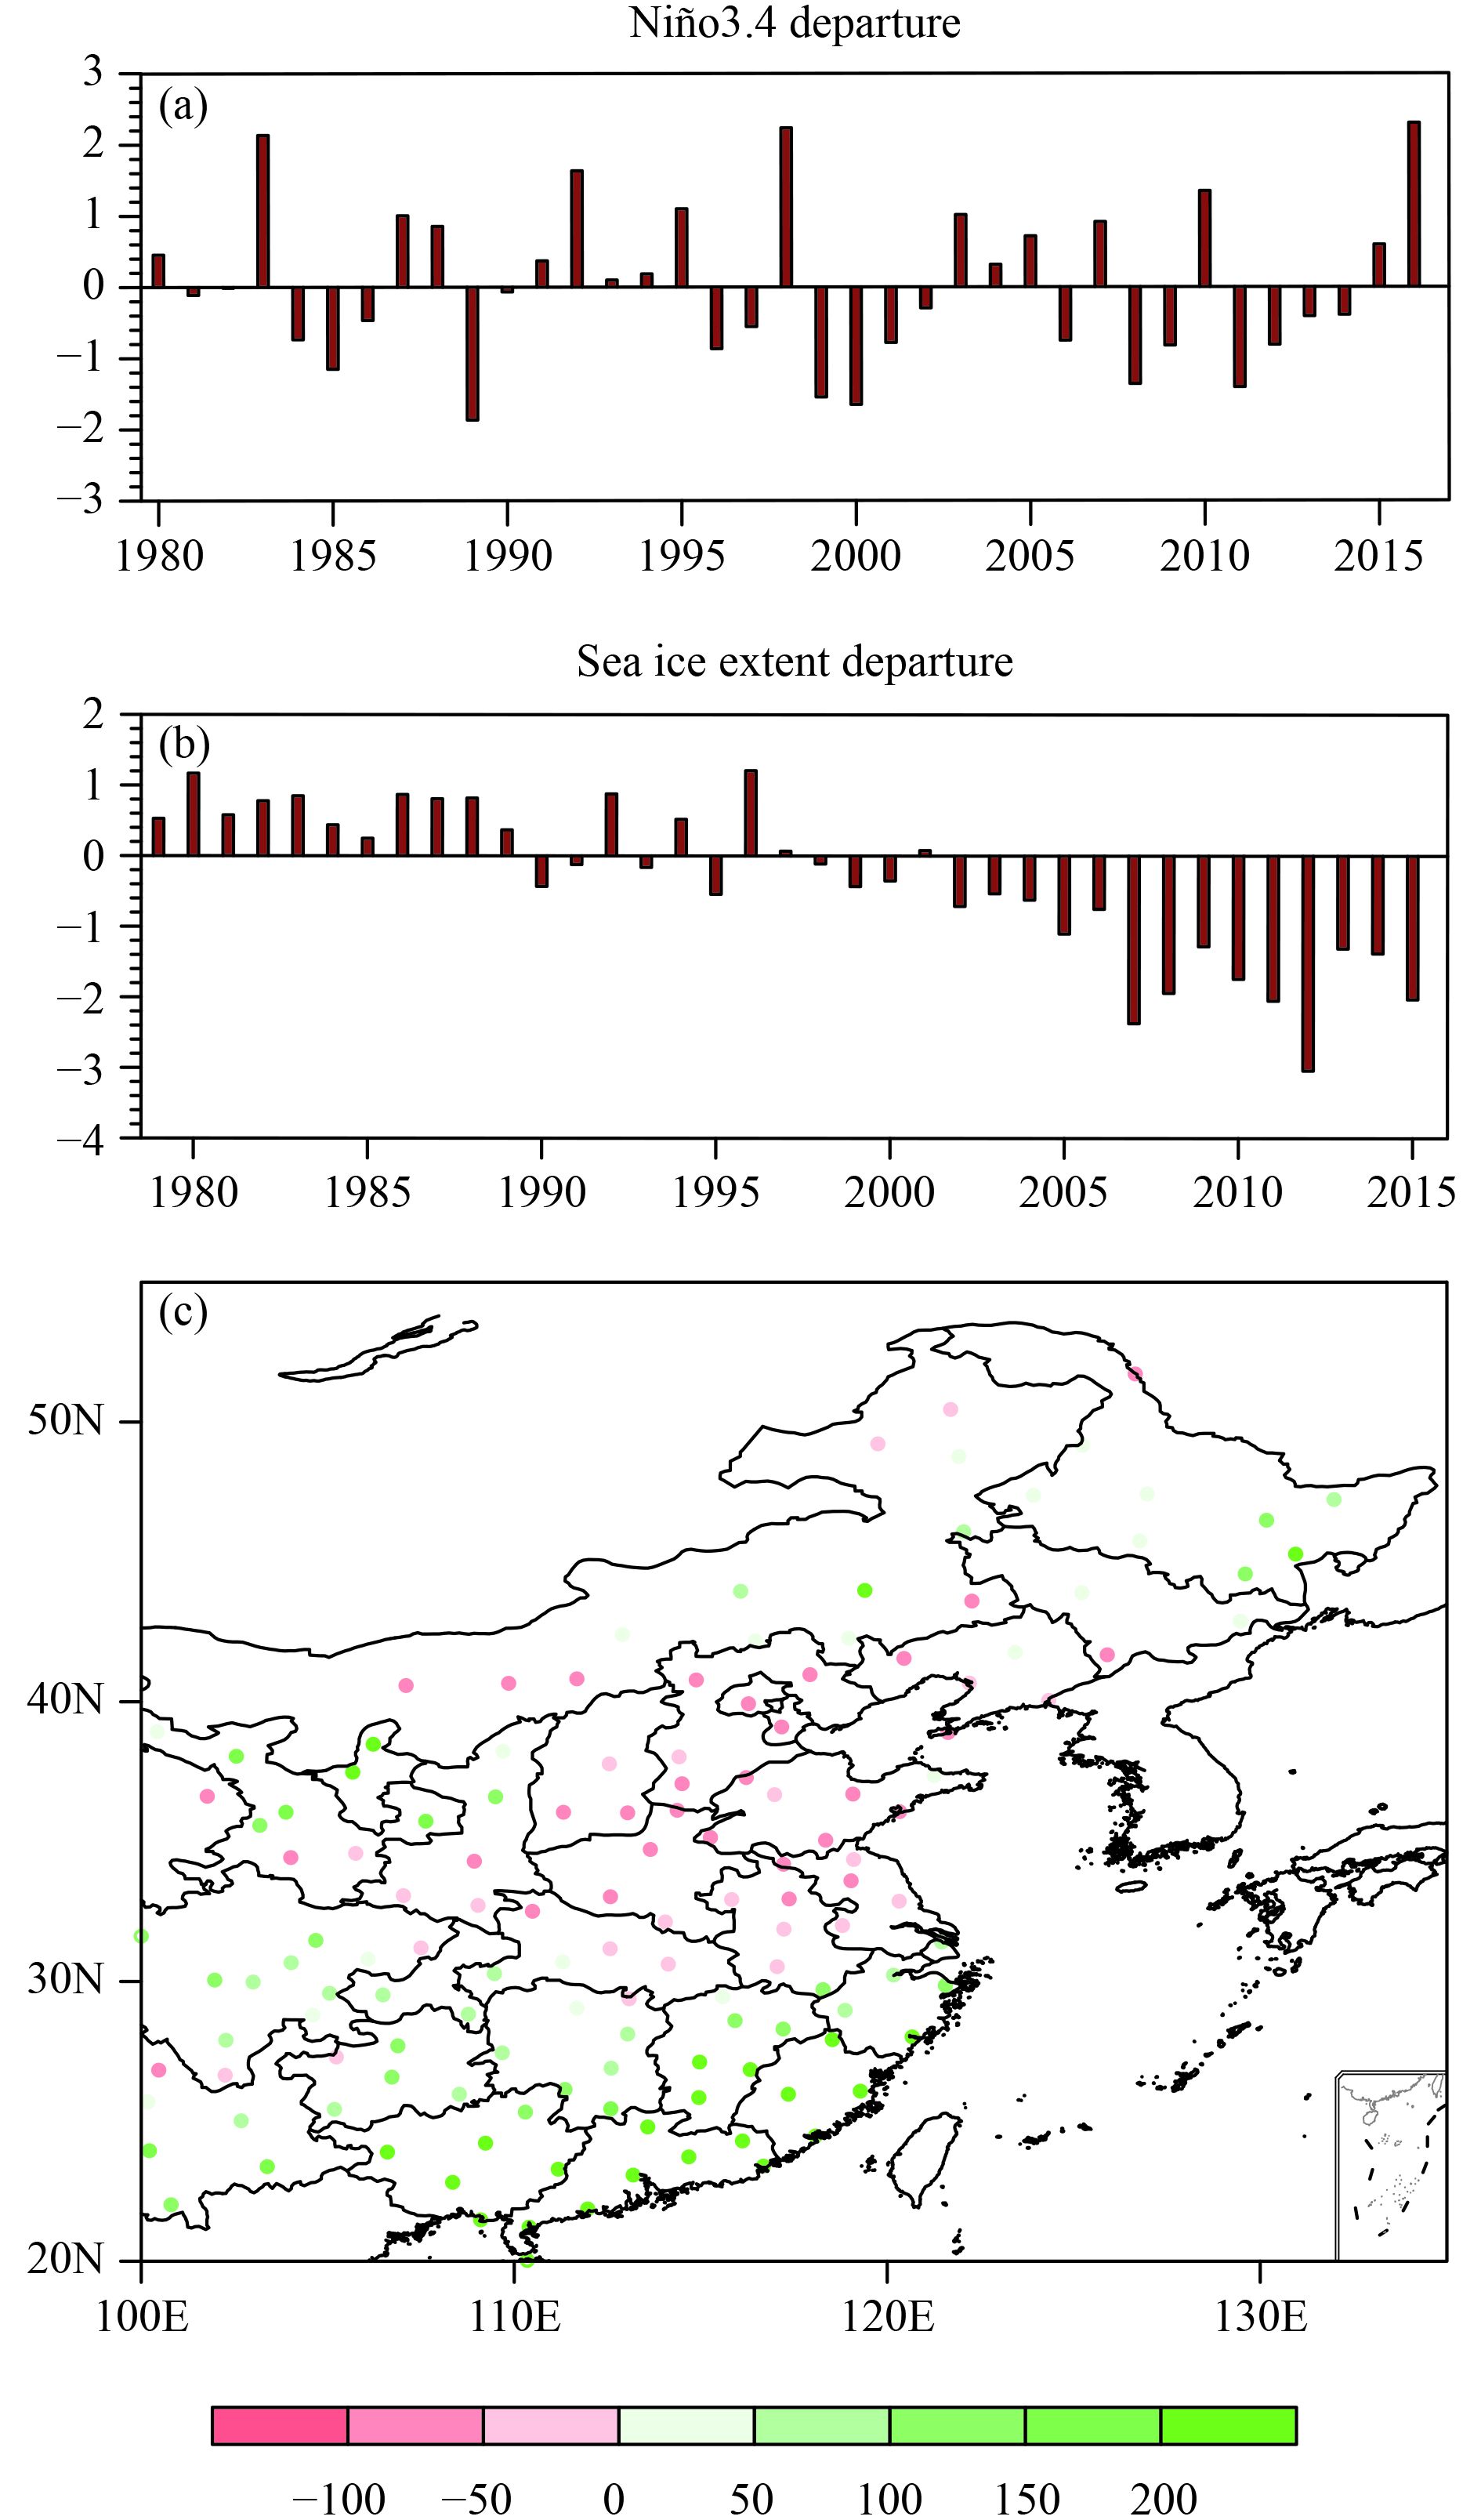
The several recent winters with more haze days (2013, 2015, and 2016) validated the present finding that the sea ice’s effect is broader and the ENSO’s effect is contained in southern China. Substantial Arctic sea loss are seen in all the three cases (Fig. 10b), but with varying strength and phase of ENSO (Fig. 10a). The conclusion that the ENSO’s impact is contained in southern China is also seen from increased rainfall (Fig. 10c) in the 2015 winter. Nonetheless, this study highlights the importance of the Arctic sea ice loss for North China and the joint importance of both ENSO and Arctic sea ice loss for southern China.
Beyond Wang et al. (2015), we proposed an explanation to the role of Arctic sea ice loss in inducing more winter haze days. About the ENSO’s impact, our result is slightly different from Gao and Li (2015), which illustrated a broader impact region (i.e., whole central–eastern China) rather than the southern coastal China region found here. One possible explanation for this inconsistency is that their observational analysis has not excluded the potential signals from Arctic sea ice loss. This suggests a need to further study the issue, which will be our future task.
|
| Figure 10 Historical evolution of (a) the December–January averaged Niño3.4 index anomaly (°C) and (b) the September Arctic sea ice extent anomaly (106 km2); and (c) distribution of the rainfall anomaly percentage (%) averaged through December 2015–January 2016. The datasets for the Niño3.4 index, the Arctic sea ice extent, and the mainland China monthly rainfall were downloaded from http://www.esrl.noaa.gov/psd/data/correlation/nina34.data, http://nsidc.org/data/seaice_index/archives.html, and http://www.ncc-cma.net/Website/index.php? ChannelID=43&WCHID=5, respectively. The climatological normal is defined as the average of 1981–2010. |
| Chen, H. P., and H. J. Wang, 2015: Haze days in North China and the associated atmospheric circulations based on daily visibility data from 1960 to 2012. J. Geophys. Res., 120, 5895–5909. DOI:10.1002/2015JD023225 |
| Dee, D. P., S. M. Uppala, A. J. Simmons, et al., 2011: The ERA-Interim reanalysis: Configuration and performance of the data assimilation system. Quart. J. Roy. Meteor. Soc., 137, 553–597. DOI:10.1002/qj.v137.656 |
| Deser, C., J. E. Walsh, and M. S. Timlin, 2000: Arctic sea ice variability in the context of recent atmospheric circulation trends. J. Climate, 13, 617–633. DOI:10.1175/1520-0442(2000)013<0617:ASIVIT>2.0.CO;2 |
| Ding, Y. H., and Y. J. Liu, 2014: Analysis of long-term variations of fog and haze in China in recent 50 years and their relations with atmospheric humidity. Sci. China Earth Sci., 57, 36–46. DOI:10.1007/s11430-013-4792-1 |
| Doyle, M., and S. Dorling, 2002: Visibility trends in the UK 1950–1997. Atmos. Environ., 36, 3161–3172. DOI:10.1016/S1352-2310(02)00248-0 |
| Gao, G., 2008: The climatic characteristics and change of haze days over China during 1961–2005. Acta Geogr. Sinica, 63, 761–768. |
| Gao, H., and X. Li, 2015: Influences of El Niño southern oscillation events on haze frequency in eastern China during boreal winters. Int. J. Climatol., 35, 2682–2688. DOI:10.1002/joc.2015.35.issue-9 |
| Gong, T. T., and D. H. Luo, 2017: Ural blocking as an amplifier of the Arctic sea ice decline in winter. J. Climate, 30. DOI:10.1175/JCLI-D-16-0548.1 |
| Han, Z., S. L. Li, J. P. Liu, et al., 2016a: Linear additive impacts of Arctic sea ice reduction and La Niña on the Northern Hemisphere winter climate. J. Climate, 29, 5513–5532. DOI:10.1175/JCLI-D-15-0416.1 |
| Han, Z., F. F. Luo, and J. H. Wan, 2016b: The observational influence of the North Atlantic SST tripole on the early spring atmospheric circulation. Geophys. Res. Lett., 28, 2998–3003. |
| He, H., X. M. Wang, Y. S. Wang, et al., 2013: Formation mechanism and control strategies of haze in China. Bull. Chinese Acad. Sci., 28, 344–352. |
| Honda, M., J. Inoue, and S. Yamane, 2009: Influence of low Arctic sea-ice minima on anomalously cold Eurasian winters. Geophys. Res. Lett., 36, L08707. DOI:10.1029/2008GL037079 |
| Li, C. Y., 1989: Frequent activities of stronger aerotroughs in East Asia in wintertime and the occurrence of the El Niño event. Sci. China Chem., 32, 976–985. |
| Li, S. L., J. Lu, G. Huang, et al., 2008: Tropical Indian Ocean basin warming and East Asian summer monsoon: A multiple AGCM study. J. Climate, 21, 6080–6088. DOI:10.1175/2008JCLI2433.1 |
| Liu, J. P., J. A. Curry, H. J. Wang, et al., 2012: Impact of declining Arctic sea ice on winter snowfall. Proc. Natl. Acad. Sci. USA, 109, 4074–4079. DOI:10.1073/pnas.1114910109 |
| Mori, M., M. Watanabe, H. Shiogama, et al., 2014: Robust Arctic sea-ice influence on the frequent Eurasian cold winters in past decades. Nat. Geosci., 7, 869–873. DOI:10.1038/ngeo2277 |
| Niu, F., Z. Q. Li, C. Li, et al., 2010: Increase of wintertime fog in China: Potential impacts of weakening of the eastern Asian monsoon circulation and increasing aerosol loading. J. Geophys. Res., 115, D00K20. DOI:10.1029/2009JD013484 |
| Petoukhov, V., and V. A. Semenov, 2010: A link between reduced Barents-Kara sea ice and cold winter extremes over northern continents. J. Geophys. Res., 115, D21111. DOI:10.1029/2009JD013568 |
| Pope, C. A.,III, and D. W. Dockery, 2006: Health effects of fine particulate air pollution: Lines that connect. J. Air Waste Manage. Assoc., 56, 709–742. DOI:10.1080/10473289.2006.10464485 |
| Rayner, N. A., D. E. Parker, E. B. Horton, et al., 2003: Global analyses of sea surface temperature, sea ice, and night marine air temperature since the late nineteenth century. J. Geophys. Res., 108(D14), 4407. DOI:10.1029/2002JD002670 |
| Roeckner, E., G. Bäuml, L. Bonaventura, et al., 2003: The Atmospheric General Circulation Model ECHAM5. Part I: Model Description. Max Planck Institute for Meteorology Report No. 349, Max Planck Institute for Meteorology, Hamburg, 127 pp. |
| Roeckner, E., R. Brokopf, M. Esch, et al., 2006: Sensitivity of simulated climate to horizontal and vertical resolution in the ECHAM5 atmosphere model. J. Climate, 19, 3771–3791. DOI:10.1175/JCLI3824.1 |
| Schichtel, B. A., R. B. Husar, S. R. Falke, et al., 2001: Haze trends over the United States 1980–1995. Atmos. Environ., 35, 5205–5210. DOI:10.1016/S1352-2310(01)00317-X |
| Schneider, U., A. Becker, P. Finger, et al., 2014: GPCC’s new land surface precipitation climatology based on quality-controlled in situ data and its role in quantifying the global water cycle. Theor. Appl. Climatol., 115, 15–40. DOI:10.1007/s00704-013-0860-x |
| SMSSDM, (Staff Members of the Section of Synoptic, Meteorology Dynamic, of Geophysics Institute, and Sinica Meteorology, 1957: On the general circulation over East Asia (I). Tellus, 9, 432–446. |
| Tao, J., J. Gao, L. Zhang, et al., 2014: PM2.5 pollution in a megacity of Southwest China: Source apportionment and implication . Atmos. Chem. Phys., 14, 8679–8699. DOI:10.5194/acp-14-8679-2014 |
| Tao, S. Y., 1959: A review on the past 10-year study on cold surge in China. Acta Meteor. Sinica, 30, 226–230. |
| Vautard, R., P. Yiou, and G. J. van Oldenborgh, 2009: Decline of fog, mist and haze in Europe over the past 30 years. Nat. Geosci., 2, 115–119. DOI:10.1038/ngeo414 |
| Walsh, J. E., 2014: Intensified warming of the Arctic: Causes and impacts on middle latitudes. Global and Planetary Change, 117, 52–63. DOI:10.1016/j.gloplacha.2014.03.003 |
| Wang, B., R. G. Wu, and X. H. Fu, 2000: Pacific–East Asian teleconnection: How does ENSO affect East Asian climate?. J. Climate, 13, 1517–1536. DOI:10.1175/1520-0442(2000)013<1517:PEATHD>2.0.CO;2 |
| Wang, H. J., H. P. Chen, and J. P. Liu, 2015: Arctic sea ice decline intensified haze pollution in eastern China. Atmos. Oceanic Sci. Lett., 8, 1–9. DOI:10.3878/AOSL20140081 |
| Wang, X. P., and D. L. Mauzerall, 2006: Evaluating impacts of air pollution in China on public health: Implications for future air pollution and energy policies. Atmos. Environ., 40, 1706–1721. DOI:10.1016/j.atmosenv.2005.10.066 |
| Wang, Y. H., R. D. Field, and O. Roswintiarti, 2004: Trends in atmospheric haze induced by peat fires in Sumatra Island, Indonesia and El Niño phenomenon from 1973 to 2003. Geophys. Res. Lett., 31, L04103. DOI:10.1029/2003GL018853 |
| Wang, Y. S., L. Yao, Z. R. Liu, et al., 2013: Formation of haze pollution in Beijing–Tianjin–Hebei region and their control strategies. Bull. Chinese Acad. Sci., 28, 353–363. |
| Wu, B. Y., J. Z. Su, and R. H. Zhang, 2011: Effects of autumn–winter Arctic sea ice on winter Siberian high. Chinese Sci. Bull., 56, 3220–3228. DOI:10.1007/s11434-011-4696-4 |
| Wu, D., 2006: More discussions on the differences between haze and fog in city. Meteor. Mon., 32, 9–15. |
| Wu, D., X. X. Tie, C. C. Li, et al., 2005: An extremely low visibility event over the Guangzhou region: A case study. Atmos. Environ., 39, 6568–6577. DOI:10.1016/j.atmosenv.2005.07.061 |
| Wu, D., G. L. Liao, X. J. Deng, et al., 2008: Transport condition of surface layer under haze weather over the Pearl River Delta. J. Appl. Meteor. Sci., 19, 1–9. |
| Wu, D., X. J. Wu, F. Li, et al., 2010: Spatial and temporal variation of haze during 1951–2005 in Chinese mainland. Acta Meteor. Sinica, 68, 680–688. DOI:10.11676/qxxb2010.066 |
| Wu, Q. G., and X. D. Zhang, 2010: Observed forcing-feedback processes between Northern Hemisphere atmospheric circulation and Arctic sea ice coverage. J. Geophys. Res., 115(D14), D14119. DOI:10.1029/2009JD013574 |
| Xie, S. P., K. M. Hu, J. Hafner, et al., 2009: Indian Ocean capacitor effect on Indo-western Pacific climate during the summer following El Niño. J. Climate, 22, 730–747. DOI:10.1175/2008JCLI2544.1 |
| Xie, Y. B., J. Chen, and W. Li, 2014: An assessment of PM2.5 related health risks and impaired values of Beijing residents in a consecutive high-level exposure during heavy haze days . Environ. Sci., 35, 1–8. |
| Xu, M., C. P. Chang, C. B. Fu, et al., 2006: Steady decline of East Asian monsoon winds, 1969–2000. Evidence from direct ground measurements of wind speed. J. Geophys. Res., 111(D24). DOI:10.1029/2006JD007337 |
| Xu, P., Y. F. Chen, and X. J. Ye, 2013: Haze, air pollution, and health in China. Lancet, 382, 2067. DOI:10.1016/S0140-6736(13)62693-8 |
| Zhang, L., and T. Li, 2017: Physical process responsible for the interannual variability of sea ice concentration in Arctic in boreal autumn since 1979. J. Meteor. Res.. DOI:10.1007/s13351-017-6105-7 |
| Zhang, R., J. Jing, J. Tao, et al., 2013: Chemical characterization and source apportionment of PM2.5 in Beijing: Seasonal perspective . Atmos. Chem. Phys., 13, 7053–7074. DOI:10.5194/acp-13-7053-2013 |
| Zhang, R. H., A. Sumi, and M. Kimoto, 1999: A diagnostic study of the impact of El Niño on the precipitation in China. Adv. Atmos. Sci., 16, 229–241. DOI:10.1007/BF02973084 |
| Zhang, R. H., Q. Li, and R. N. Zhang, 2014: Meteorological conditions for the persistent severe fog and haze event over eastern China in January 2013. Sci. China Earth Sci., 57, 26–35. DOI:10.1007/s11430-013-4774-3 |
| Zhang, X. Y., J. Y. Sun, Y. Q. Wang, et al., 2013: Factors contributing to haze and fog in China. Chinese Sci. Bull., 58, 1178–1187. DOI:10.1360/972013-150 |
 2017, Vol. 31


