The Chinese Meteorological Society
Article Information
- ZHONG, Junting, Xiaoye ZHANG, Yaqiang WANG, et al., 2017.
- Relative Contributions of Boundary-Layer Meteorological Factors to the Explosive Growth of PM2.5 during the Red-Alert Heavy Pollution Episodes in Beijing in December 2016 . 2017.
- J. Meteor. Res., 31(5): 809-819
- http://dx.doi.org/10.1007/s13351-017-7088-0
Article History
- Received June 5, 2017
- in final form August 18, 2017
2. Integrated Ecological–Meteorological Observation and Experimental Station, Chinese Academy of Meteorological Sciences, Beijing 100081;
3. Center for Excellence in Regional Atmospheric Environment, Institute of Urban Environment, Chinese Academy of Sciences, Xiamen 361021;
4. Center for Atmosphere Watch and Service, Meteorological Observation Center, China Meteorological Administration, Beijing 100081
Fine particulate matter (PM) smaller than 2.5 μm in diameter (PM2.5) represents a major environmental threat that degrades visibility, negatively impacts human health (Chen et al., 2013), and directly/indirectly affects wea-ther and climate (Wei et al., 2011; Boucher et al., 2013; Zhang et al., 2013; Zhang R. Y. et al., 2015). As the world’s second largest economy, China has experienced heavy aerosol pollution episodes, with PM2.5 reaching unprecedented high levels in many cities, particularly Beijing and its vicinity, which is one of the nation’s most polluted regions (Zhang et al., 2012).
A variety of explanations have been proposed for the causes of the heavy pollution episodes (Huang et al., 2014; Sun et al., 2014; Wang H. et al., 2014; Wang X. et al., 2014; Wang Z. et al., 2014). Previous studies found that atmospheric conditions were one of the most important parameters in regulating the cycles of pollution episodes in autumn 2013 in Beijing (Zhang et al., 2009; Guo et al., 2014) and in the North China Plain and other areas of China (Zhang X. Y. et al., 2015). In addition, meteorological factors and the secondary aerosols produced after the initiation of pollution facilitated the occurrence of severe haze in January 2013 (Zheng B. et al., 2015). An analysis of atmospheric background fields in January 2013 revealed that both the dynamic effects, including weak surface wind and vertical wind shear, and the thermodynamic effects, including stratification instability, temperature inversion, and dew-point deficit, substantially affected pollution formation (Zhang et al., 2014). By analyzing a typical autumnal haze episode during 21–26 October 2014, it was found that southerly transport of pollutants prevailed during the transition period and contributions of secondary inorganic species increased greatly in the polluted period (Zhu et al., 2016). Southerly/southwesterly surface winds were found more likely to contribute to severe air pollution in Beijing (Wang Z. B. et al., 2013). Atmospheric chemical reactions, including liquid phase reactions, in which aqueous SO2 is oxidized by NO2, H2O2, and O3 to form sulfate, and heterogeneous reactions, in which NO2 and N2O5 form nitrates with water, are conducive to secondary aerosol formation. High PM2.5 levels suspended in the boundary layer (BL) during hazy weather may remarkably influence local BL meteorology by reforming the regional solar and thermal radiative budgets (Wang et al., 2015), which results in further pollution accumulation.
Despite these research outcomes, the formation mechanism and evolution of Beijing’s heavy pollution episodes have not been fully understood, particularly with respect to identifying the major contributors to the explosive growth of PM2.5 mass concentration, which rapidly increases by approximately 200 μg m–3, to highly elevated PM2.5 levels. Earlier studies attributed this dramatic increase to fast local chemical production (Wang Z. et al., 2014). This finding is contradicted by later studies, which proposed that the rapid changes are more likely to be caused by the regional transport of clean/polluted air masses based on surface meteorological factors, including wind, humidity, and the PM2.5 mass concentrations in various cities in the North China Plain (Zheng G. J. et al., 2015). However, surface meteorological factors do not suffice to persuasively explain the increase because the explosive growth of PM2.5 levels occasionally occurs with weak surface winds and low humidity. In addition, atmospheric vertical variations in the BL may significantly affect the PM2.5 mass concentration near the ground (Hua et al., 2016), but this has not been extensively investigated. Therefore, the present paper uses vertical measurements of meteorological variables to investigate the relative contributions of meteorological factors in the BL to the explosive growth of PM2.5 during the heavy pollution episodes in Beijing in December 2016; particularly, the red-alert heavy pollution episode will be focused on. The paper also attempts to quantify the effect of meteorological feedback on the explosive growth of PM2.5 levels at the beginning of the cumulative stages of heavy pollution.
2 Data and methodsIn this study, the following data are used.
(1) ECMWF atmospheric reanalysis data collected 4 times daily at 0200, 0800, 1400, and 2000 Beijing time (BT) from 15 to 22 December 2016, on a horizontal resolution of 0.5° × 0.5°.
(2) Hourly PM2.5 mass concentrations measured by national monitoring stations of the Ministry of Environmental Protection of China. The PM2.5 levels of two stations located in Haidian and Fangshan districts were used to represent the pollution conditions of northern and southern Beijing, respectively.
(3) Hourly ground-level meteorological observations from automatic weather stations (AWSs) provided by the National Meteorological Information Center of the China Meteorological Administration.
(4) Atmospheric vertical observations twice daily at 0800 and 2000 BT, including winds, temperature, and relative humidity (RH), measured by an L-band radiosonde radar at Observatory 54511 in southern Beijing from 1 December 2016 to 10 January 2017.
A parameterized index, namely, PLAM (Parameter Linking Aerosol Pollution and Meteorological Ele-ments), is calculated with the observations at Observatory 54511 from 1 December 2016 to 10 January 2017, by use of the method presented in detail in previous studies (Zhang et al., 2009; Wang et al., 2012; Wang J. et al., 2013; Zhang X. Y. et al., 2015)
3 Results 3.1 Definitions of heavy pollution and explosive growth of PM2.5According to the PM2.5 daily mean mass concentration thresholds in China’s national environmental quality standards, a clean period is defined as a period during which the PM2.5 mass concentration is less than 35 μg m–3, while a pollution episode is defined as a period during which the PM2.5 mass concentration exceeds 80 μg m–3 for 3 consecutive days between two clean periods. Pollution episodes with peak PM2.5 values more than 400 μg m–3 are termed heavy pollution episodes (HPEs), while those with peak PM2.5 values less than 300 μg m–3 are termed light pollution episodes (LPEs).
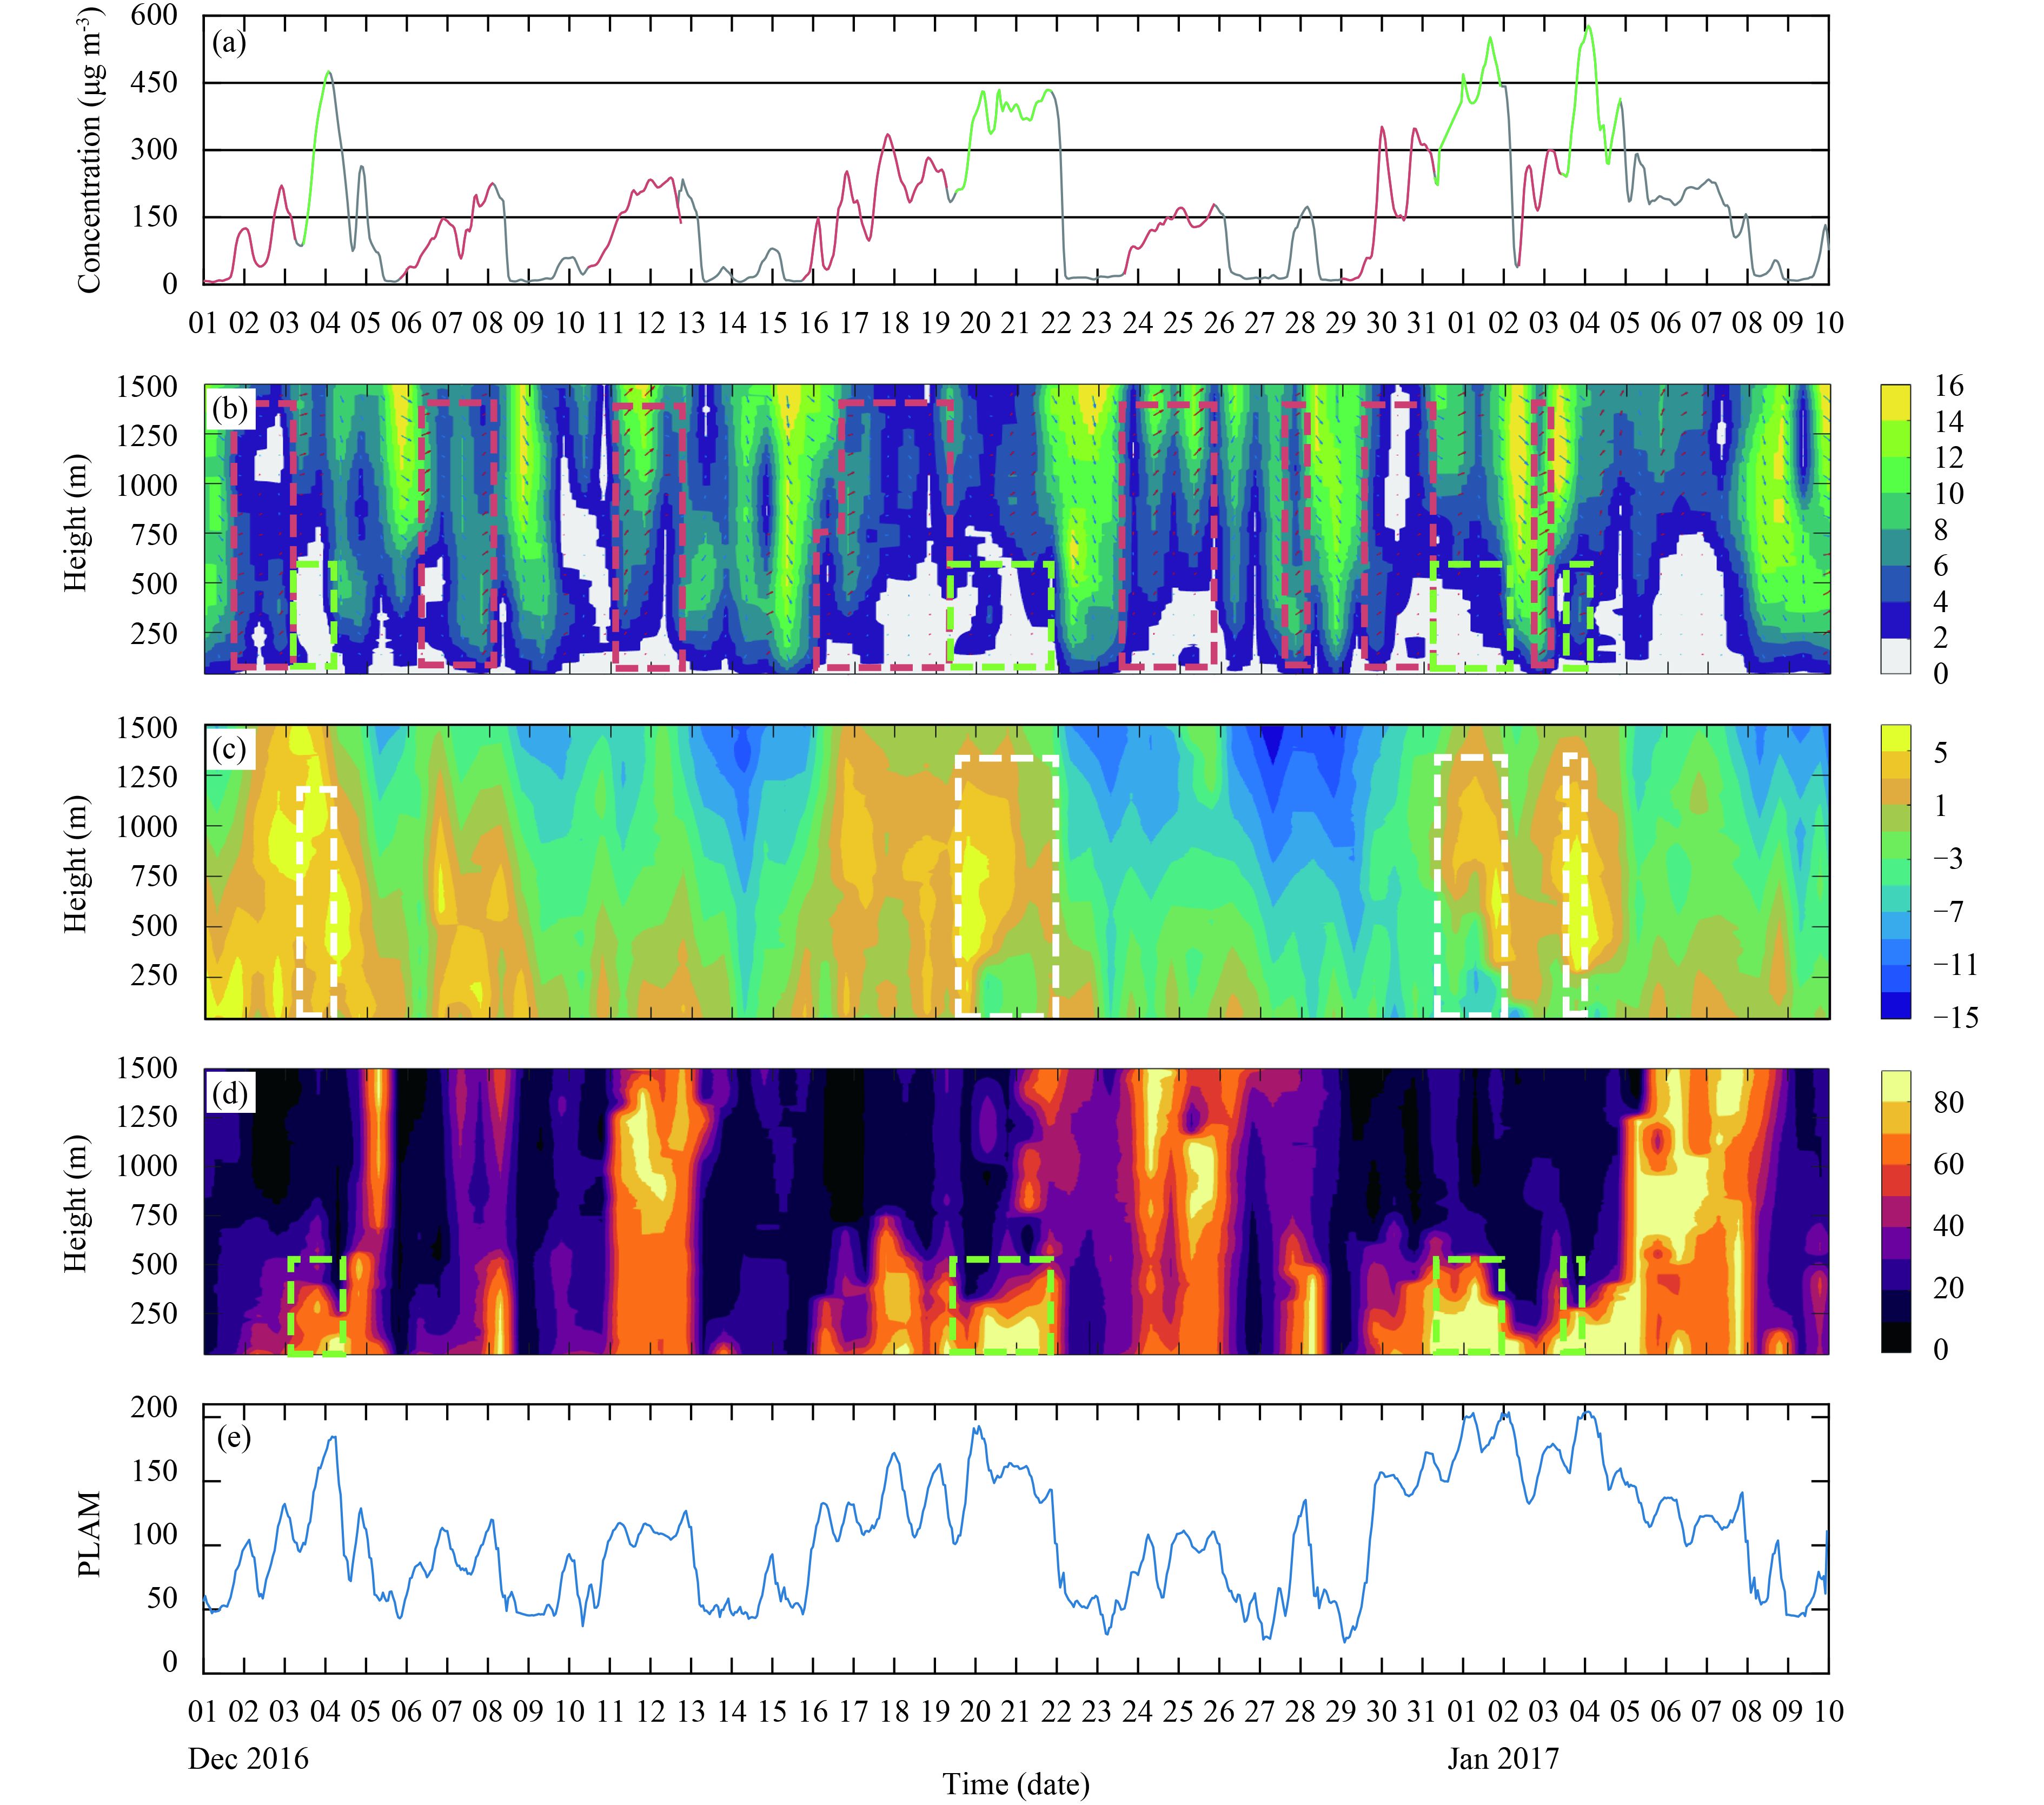
Figure 1 shows the temporal evolutions of PM2.5 mass concentration from 1 December 2016 to 10 January 2017 (this period represents typical winter time in Beijing). It is easily found that the measured PM2.5 levels exhibit a clear periodic cycle of 3–7 days, and at least three HPEs occur with each lasting for 5–7 days while multiple LPEs occur with each lasting for 3–4 days.
In Fig. 1, the LPE period and the early HPE period (red lines) are tentatively referred to as the pollution transport stages (TSs), during which the PM2.5 mass concentration varies more sensitively and rapidly in response to the wind shift from northerly to southerly in the BL (Fig. 1b), compared with the vertical variations of temperature and RH (Figs. 1c, d). The later periods of HPEs (green lines) are tentatively defined as pollution cumulative stages (CSs), when the stable atmospheric stratification characterized by anomalous temperature inversion occurs.
During the TSs, periods of growth appear, during which the PM2.5 mass concentration rapidly increases from less than 30 to 150–300 μg m–3 in the initial several to 10 h or increases by over 100 μg m–3 rapidly afterwards. These growth periods of the TSs are termed original/transport growth processes. The growth periods of the CSs, when the PM2.5 mass concentration rapidly increases from 100–200 to approximately 400 μg m–3, are defined as subsequent/cumulative explosive growth processes.
|
| Figure 1 Temporal variations in PM2.5, PLAM, and vertical distributions of meteorological factors from 1 December 2016 to 10 January 2017. (a) PM2.5 mass concentration, (b) wind vector and wind velocity (shading; m s–1), (c) temperature (shading; °C), (d) RH (shading; %), and (e) PLAM. Red boxes correspond to original/transport growth processes, while green/white boxes correspond to subsequent/cumulative explosive growth processes. |

|
| Figure 2 Distributions of surface pressure and 500-hPa geopotential height at (a) 0800 Beijing Time (BT) 15 December, (b) 2000 BT 16 December; (c) 2000 BT 19 December, and (d) 2000 BT 21 December 2016. Blue contours denote geopotential height, shadings represent surface pressure, and red points from west to east represent cities of Shijiazhuang, Gucheng, Baoding, Beijing, and Tianjin, respectively. |
We now analyze the atmospheric background fields from 16 to 22 December 2016 during the red-alert aerosol HPEs in Beijing. Figure 2 depicts the surface pressure and 500-hPa geopotential height fields over East Asia. Before pollution formation, a surface high lay northwest of the North China Plain, over which northwesterly surface winds carrying unpolluted air masses from the less populated northern mountainous areas were dominant (Jia et al., 2008; Liu et al., 2013; Guo et al., 2014). The surface high subsequently moved to the south of the plain at 2000 BT 16 December, when southerly air masses from the more populated southern industrial regions dominated over the plain, corresponding to appreciably increased PM2.5 levels (Fig. 1a).
The North China Plain was governed by uniform pressure that hampered the outward transport of pollutants at 2000 BT 19 December, when relatively stable atmospheric stratification characterized by negligible surface winds occurred and coincided with the beginning of the CS. On 21 December, at 2000 BT, an anomalous surface low over the plain was conducive to air convergence, which resulted in the maintenance and aggravation of aerosol pollution during the CS. A comparison of the 500-hPa contour lines at 0800 BT 15 December (clean) and 2000 BT 16 December (polluted) reveals that the midlatitude meridional circulations were weaker during HPEs, which indicates that the exchange between the northern and southern air masses was weakened, particularly during the CS.
With the Taihang Mountains blocking the invasion of cold air from the rear of the East Asian trough into eastern China, the unique geographic features of the North China Plain facilitated pollutant accumulation over the plain.
3.2.2 Pollutant transport from south of BeijingThe ground-level PM2.5 mass concentration is affected by meteorological factors in the BL, including winds, temperature, RH, and BL height. Figure 1 shows the temporal variation of PM2.5 mass concentration (Fig. 1a) and temporal–vertical distributions of wind, temperature, and RH (Figs. 1b, c, d). Strong northwesterly winds, whose velocity increases with height, dominate in the BL during clean periods with PM2.5 levels less than 35 μg m–3. During the transition between clean and polluted periods, the wind shifts from northerly to southerly with dramatically decreased velocity. This wind shift coincides with the original growth of PM2.5 mass concentration, suggesting that the pollutant transport by southerly wind may be responsible for the growth, since southerly air masses originate from the more populated industrial regions in the south. For example, the PM2.5 mass concentration rapidly increases from 20 to approximately 140 μg m–3 within 12 h after the wind shifts from northerly to southerly at 2000 BT 23 December, and from 10 to over 300 μg m–3 at 1200 BT 30 December.
The PM2.5 mass concentration varies sensitively and rapidly in response to a wind shift even during the TSs, which is indicative of the primary contribution of southerly pollutant transport to the original growth of PM2.5 levels. For example, during the period from 6 to 8 December, the occurrence of strong northwest winds broke the ascending trend of PM2.5 mass concentration, which quickly rebounded when southerly winds subsequently took over.
The original growth is featured with a gentle (3.4–5.4 m s–1) or moderate (5.5–7.9 m s–1) wind speed rather than a light (0.3–1.5 m s–1) or calm (0–0.2 m s–1) airflow below 500 m during TSs, suggesting that local emissions under relatively stable atmospheric stratification with substantially lower wind speed are likely conducive but not dominant, with respect to pollution concentration growth. During the growth processes, the southerly air masses migrate more than 288 km day–1 below 500 m (estimated from the measured wind speed), which indicates a substantial impact from the southern PM2.5 transport. During the TSs, air temperature decreases with height without anomalous inversion, and moisture increases compared with clean periods. However, near-ground (< 250 m) RH varies substantially (40%–70%) among different TSs, which indicates that the original growth is unlikely to be primarily caused by vertical variations of temperature and RH. Nevertheless, weak inversion and near-ground moisture accumulation favor the growth of pollution.
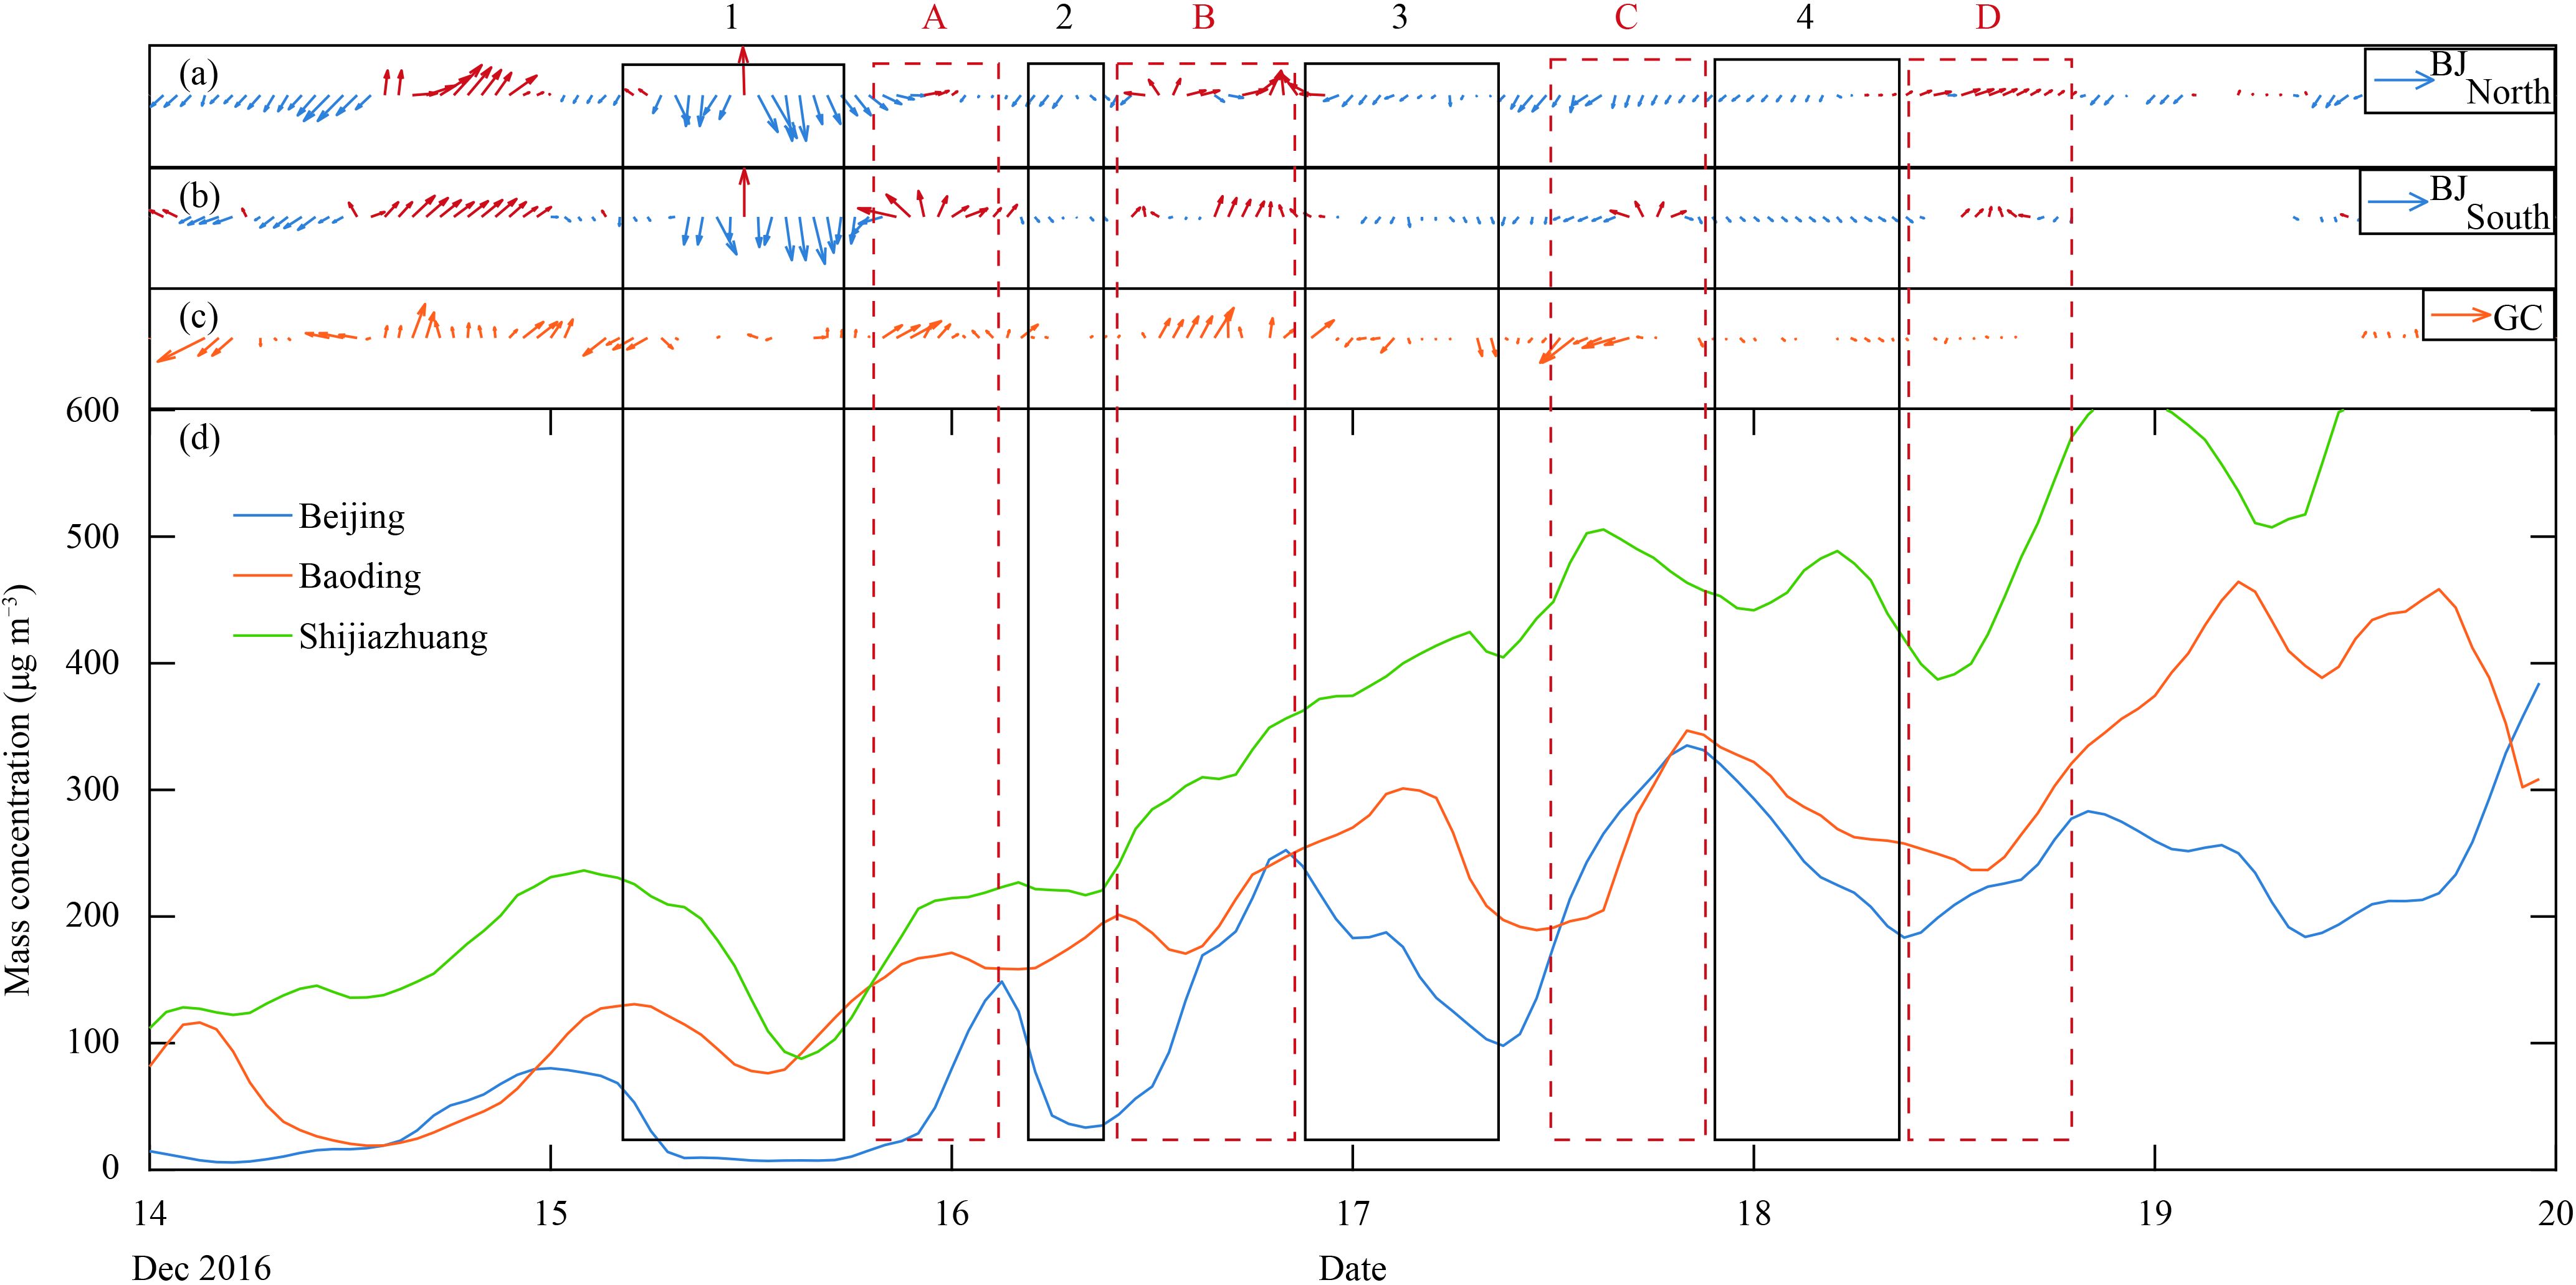
The contribution of southerly pollutant transport to original growth is further assessed by examining in detail the red-alert HPE of 16–22 December 2016. Four substantial decline processes (see Fig. 3, processes 1–4) appear, with clean northerly winds dominating southern and northern Beijing, while three growth processes (Fig. 3, processes A, B, D), before which the PM2.5 levels of southern cities (including Baoding and Shijiazhuang) were clearly higher than that of Beijing, concurrently occur with polluted southerly winds governing southern and northern Beijing. In the third growth process (Fig. 3, process C), relatively clean northern and relatively polluted southern air masses converge in the urban area of Beijing, resulting in cyclonic wind shear. Such a shear is favorable for pollutant accumulation, which is also aggravated by the occurrence of weak inversion and near-surface moisture accumulation (Figs. 1c, d).
|
| Figure 3 Temporal variations in PM2.5 and wind direction in Beijing and its vicinity from 14 to 20 December 2016. (a) Wind direction in northern Beijing, (b) wind direction in southern Beijing, (c) wind direction in Gucheng, and (d) evolutions of urban mean PM2.5 mass concentration in Beijing (blue line), Baoding (orange line), and Shijiazhuang (green line). The red boxes mark the rapid growth of PM2.5 concentration while black boxes mark the substantial decline of PM2.5 concentration. |
Southerly pollutant transport primarily results in the original growth of PM2.5 levels, which is also facilitated by the occurrence of weak inversion and the near-surface moisture accumulation. Warm and humid airflows from the south transport more water vapor and pollutants to the North China Plain, creating the requisite moisture and pollution accumulation conditions for the subsequent explosive growth.
3.3 Meteorological conditions for the subsequent explosive growth 3.3.1 Pre-existing PM2.5 levels likely resulting in anomalous inversionThe existing PM2.5 levels established by the original growth preceded the anomalous temperature inversion that occurred during the four CSs (see Fig. 1c). Common causes of the temperature inversion in Beijing include advection, topography, and radiation. Advection inversion occurs when a warm and less dense air mass moves over a cold and dense air mass. In the present case, the temperature inversion in the CSs occurred with light or calm winds, suggesting that the contribution of warm/cold advection is limited. Although the Taihang Mountains are situated to the north of Beijing and occasionally cold air climbs over the mountain peak down into the urban area of Beijing, in the case of this study, almost no striking northerly winds were observed during the CSs, indicating that topography contributes limitedly to the inversion. Definitely, at night, the ground would emit radiation that exceeds the amount of radiation received from the sun during daytime, which serves to create inversion, namely, radiation inversion. On the other hand, the radiative cooling effect of pre-existing aerosols would remarkably backscatter a large amount of radiation received by the ground to space to reinforce surface temperature reduction.
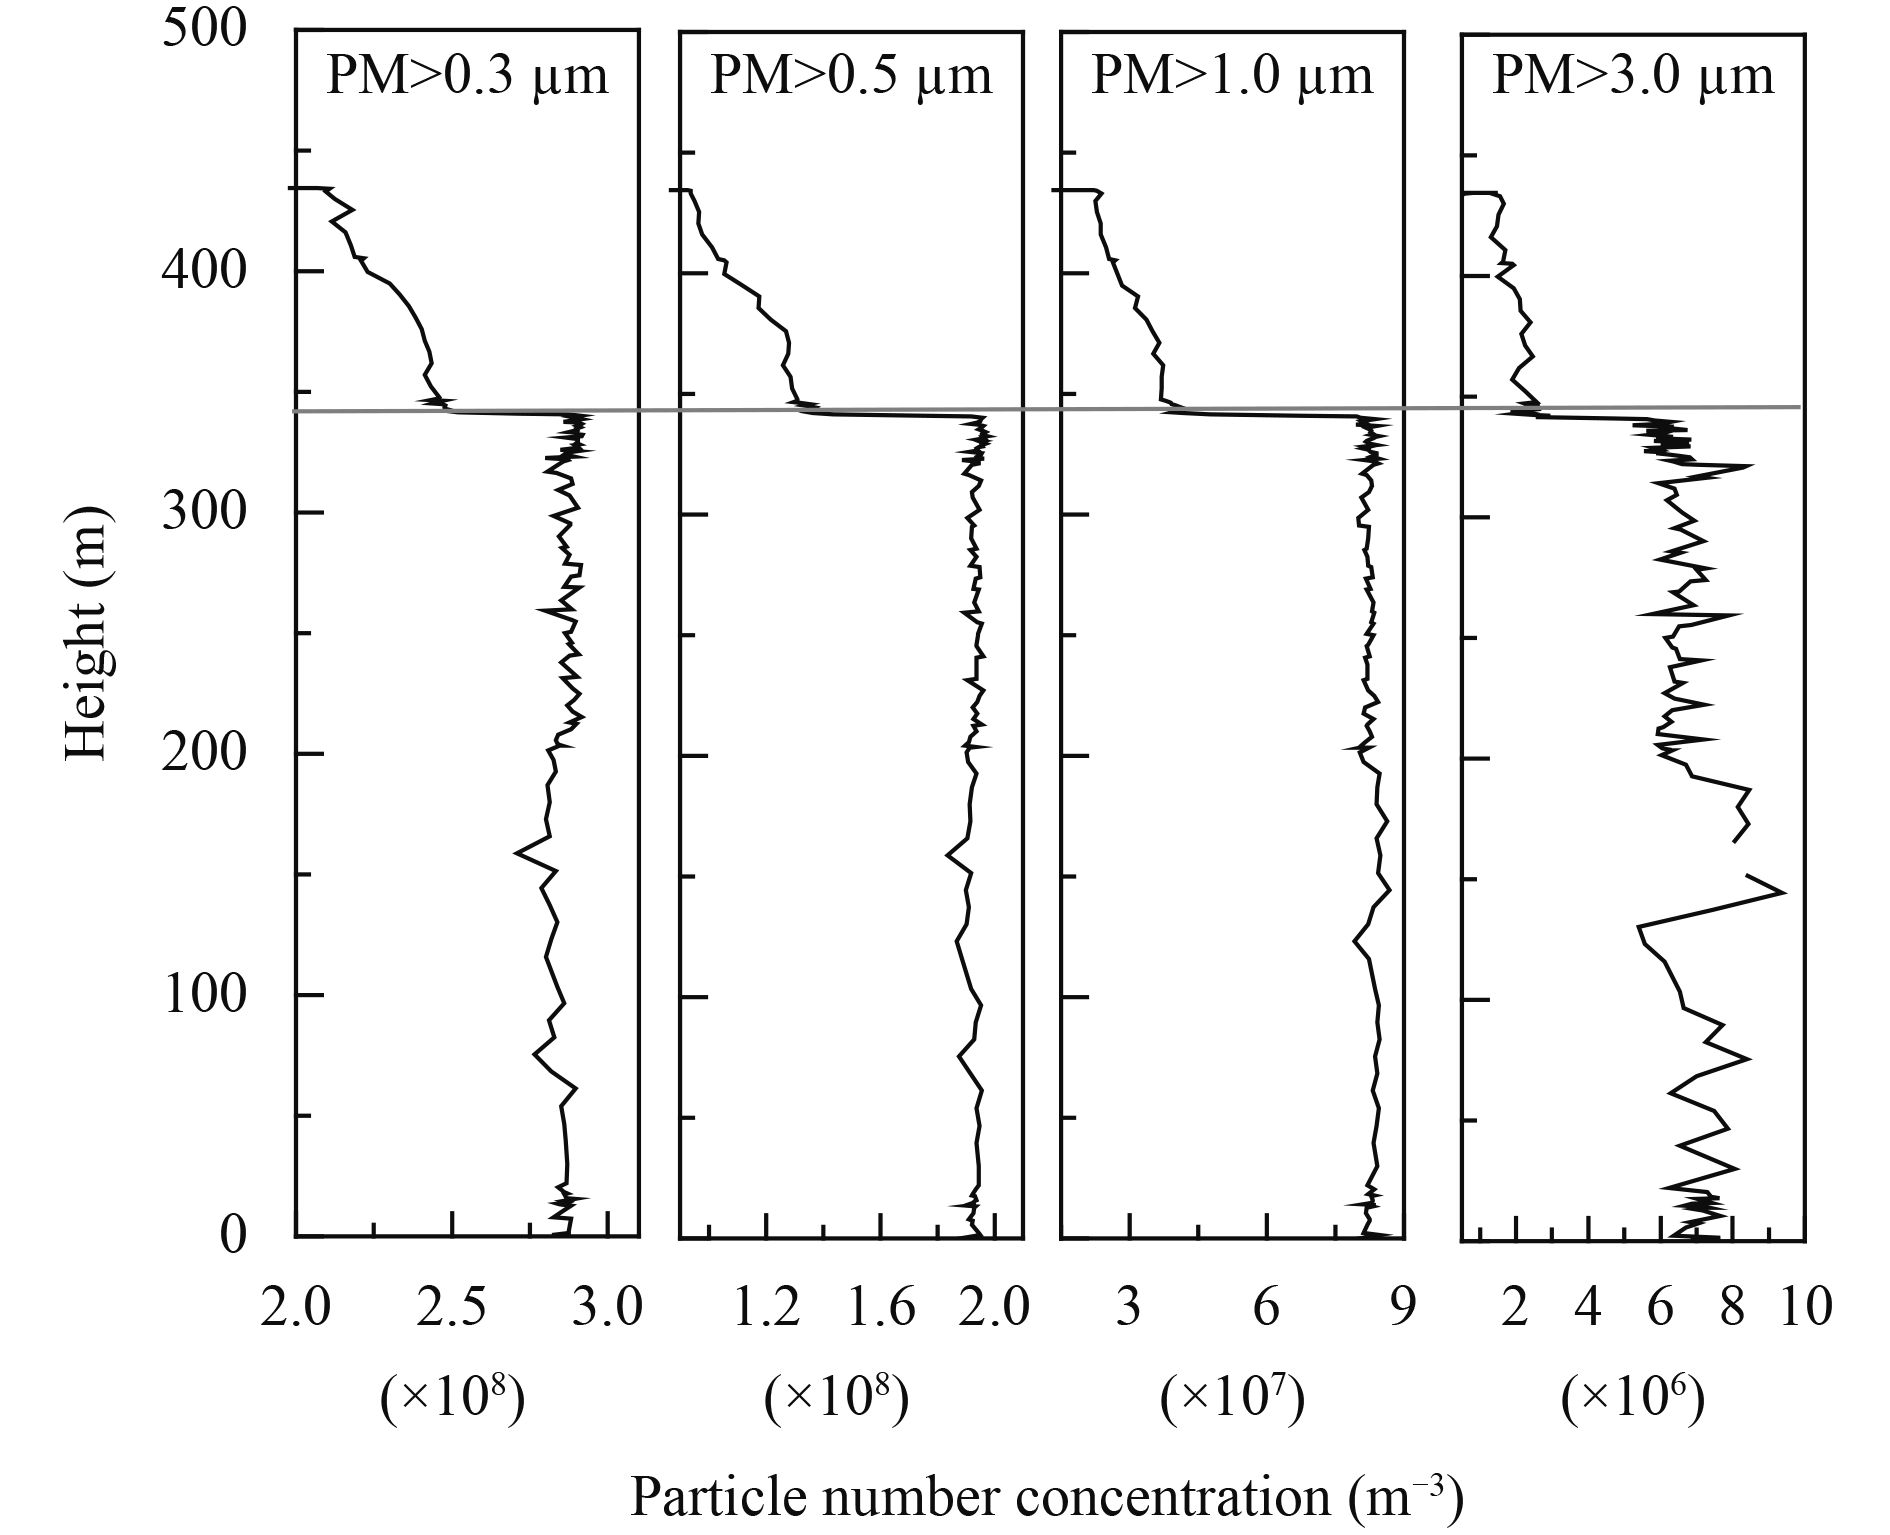
With existing high PM2.5 levels, it is inferred that the radiation inversion is partly caused by the radiation cooling of aerosols. In addition, the radiative cooling effect of pre-existing aerosols (Wang J. et al., 2014), which are concentrated below 350 m (Fig. 4), would result in more noticeable decrease in temperature in the near-surface layer than in the higher layer. Previous studies reported that aerosol particle size increased by 20%–60% after moisture absorption in North China (Pan et al., 2009), and aerosol direct radiative forcing increased by approximately 50% (Che et al., 2015). These findings suggest that the feedback of pre-existing aerosols might play a major role in the formation of temperature inversion during the four CSs.
|
| Figure 4 Vertical variations of PM number concentration in Beijing on 19 December 2016. The gray line marks the boundary layer height (approximately 340 m) at which the PM number concentration substantially decreases. |
The subsequent explosive growth of PM2.5 levels in the four CSs coincides with the anomalous inversion as shown in Figs. 1a, c. This suggests that the inversion, with strong static stability trapping pollution-laden air beneath it, facilitates pollutant accumulation. For example, PM2.5 mass concentration rapidly increased from less than 300 μg m–3 on 31 December to approximately 500 μg m–3 on 1 January, in company with the occurrence of the anomalous inversion.
Figures 1c and 1d show the temporal–vertical variations of temperature and RH in the BL from 1 December 2016 to 10 January 2017. A comparison of the four CSs and the seven TSs indicates that the near-ground moisture accumulation is not striking in the absence of temperature inversion, and the RH of the upper BL is occasionally higher than that of the near-ground surface. For example, the RH distributed evenly in the BL is less than 40% during clean periods, while the RH is approximately 60% at the near ground and over 80% above 750 m during the TSs from 11 to 13 December and from 24 to 26 December. When weak inversion occurs in the BL, the lower edge of the inversion layer is in approximate agreement with the RH contour of 60%. The RH of less than 40% (even 20%) over the inversion layer is distinctive from that below the layer. For example, during the TS from 16 to 20 December, the RH in the near-ground air below the inversion layer is maintained at 60%–80%, while the RH over the inversion layer is less than 20%. The sharp increase in near-surface moisture with the brief inversion on 8 December indicates that the vertical distribution of RH is likely under the control of temperature inversion. When an anomalous inversion layer occurs in the BL, the lower edge of the strong inversion layer coincides with the RH contour of 80%. The RH over the inversion layer differs substantially from that below the layer. Moisture accumulates anomalously below the inversion layer with RH over 80% in the near-ground atmosphere. For example, near-ground RH congregated increasingly with the stepped descending inversion from 1 to 2 January 2017.
The previously noted relation between vertical temperature and RH indicates that anomalous inversion results in appreciable near-surface moisture accumulation by suppressing the vertical mixing of water vapor (Wallace and Hobbs, 2006). The vertical diffusion of the near-surface water vapor as the anomalous inversion disappeared on 5 January 2017 verifies the cited research outcome.
3.3.3 Moisture accumulation facilitating aerosol hygro-scopic growth and additional secondary aerosol
|
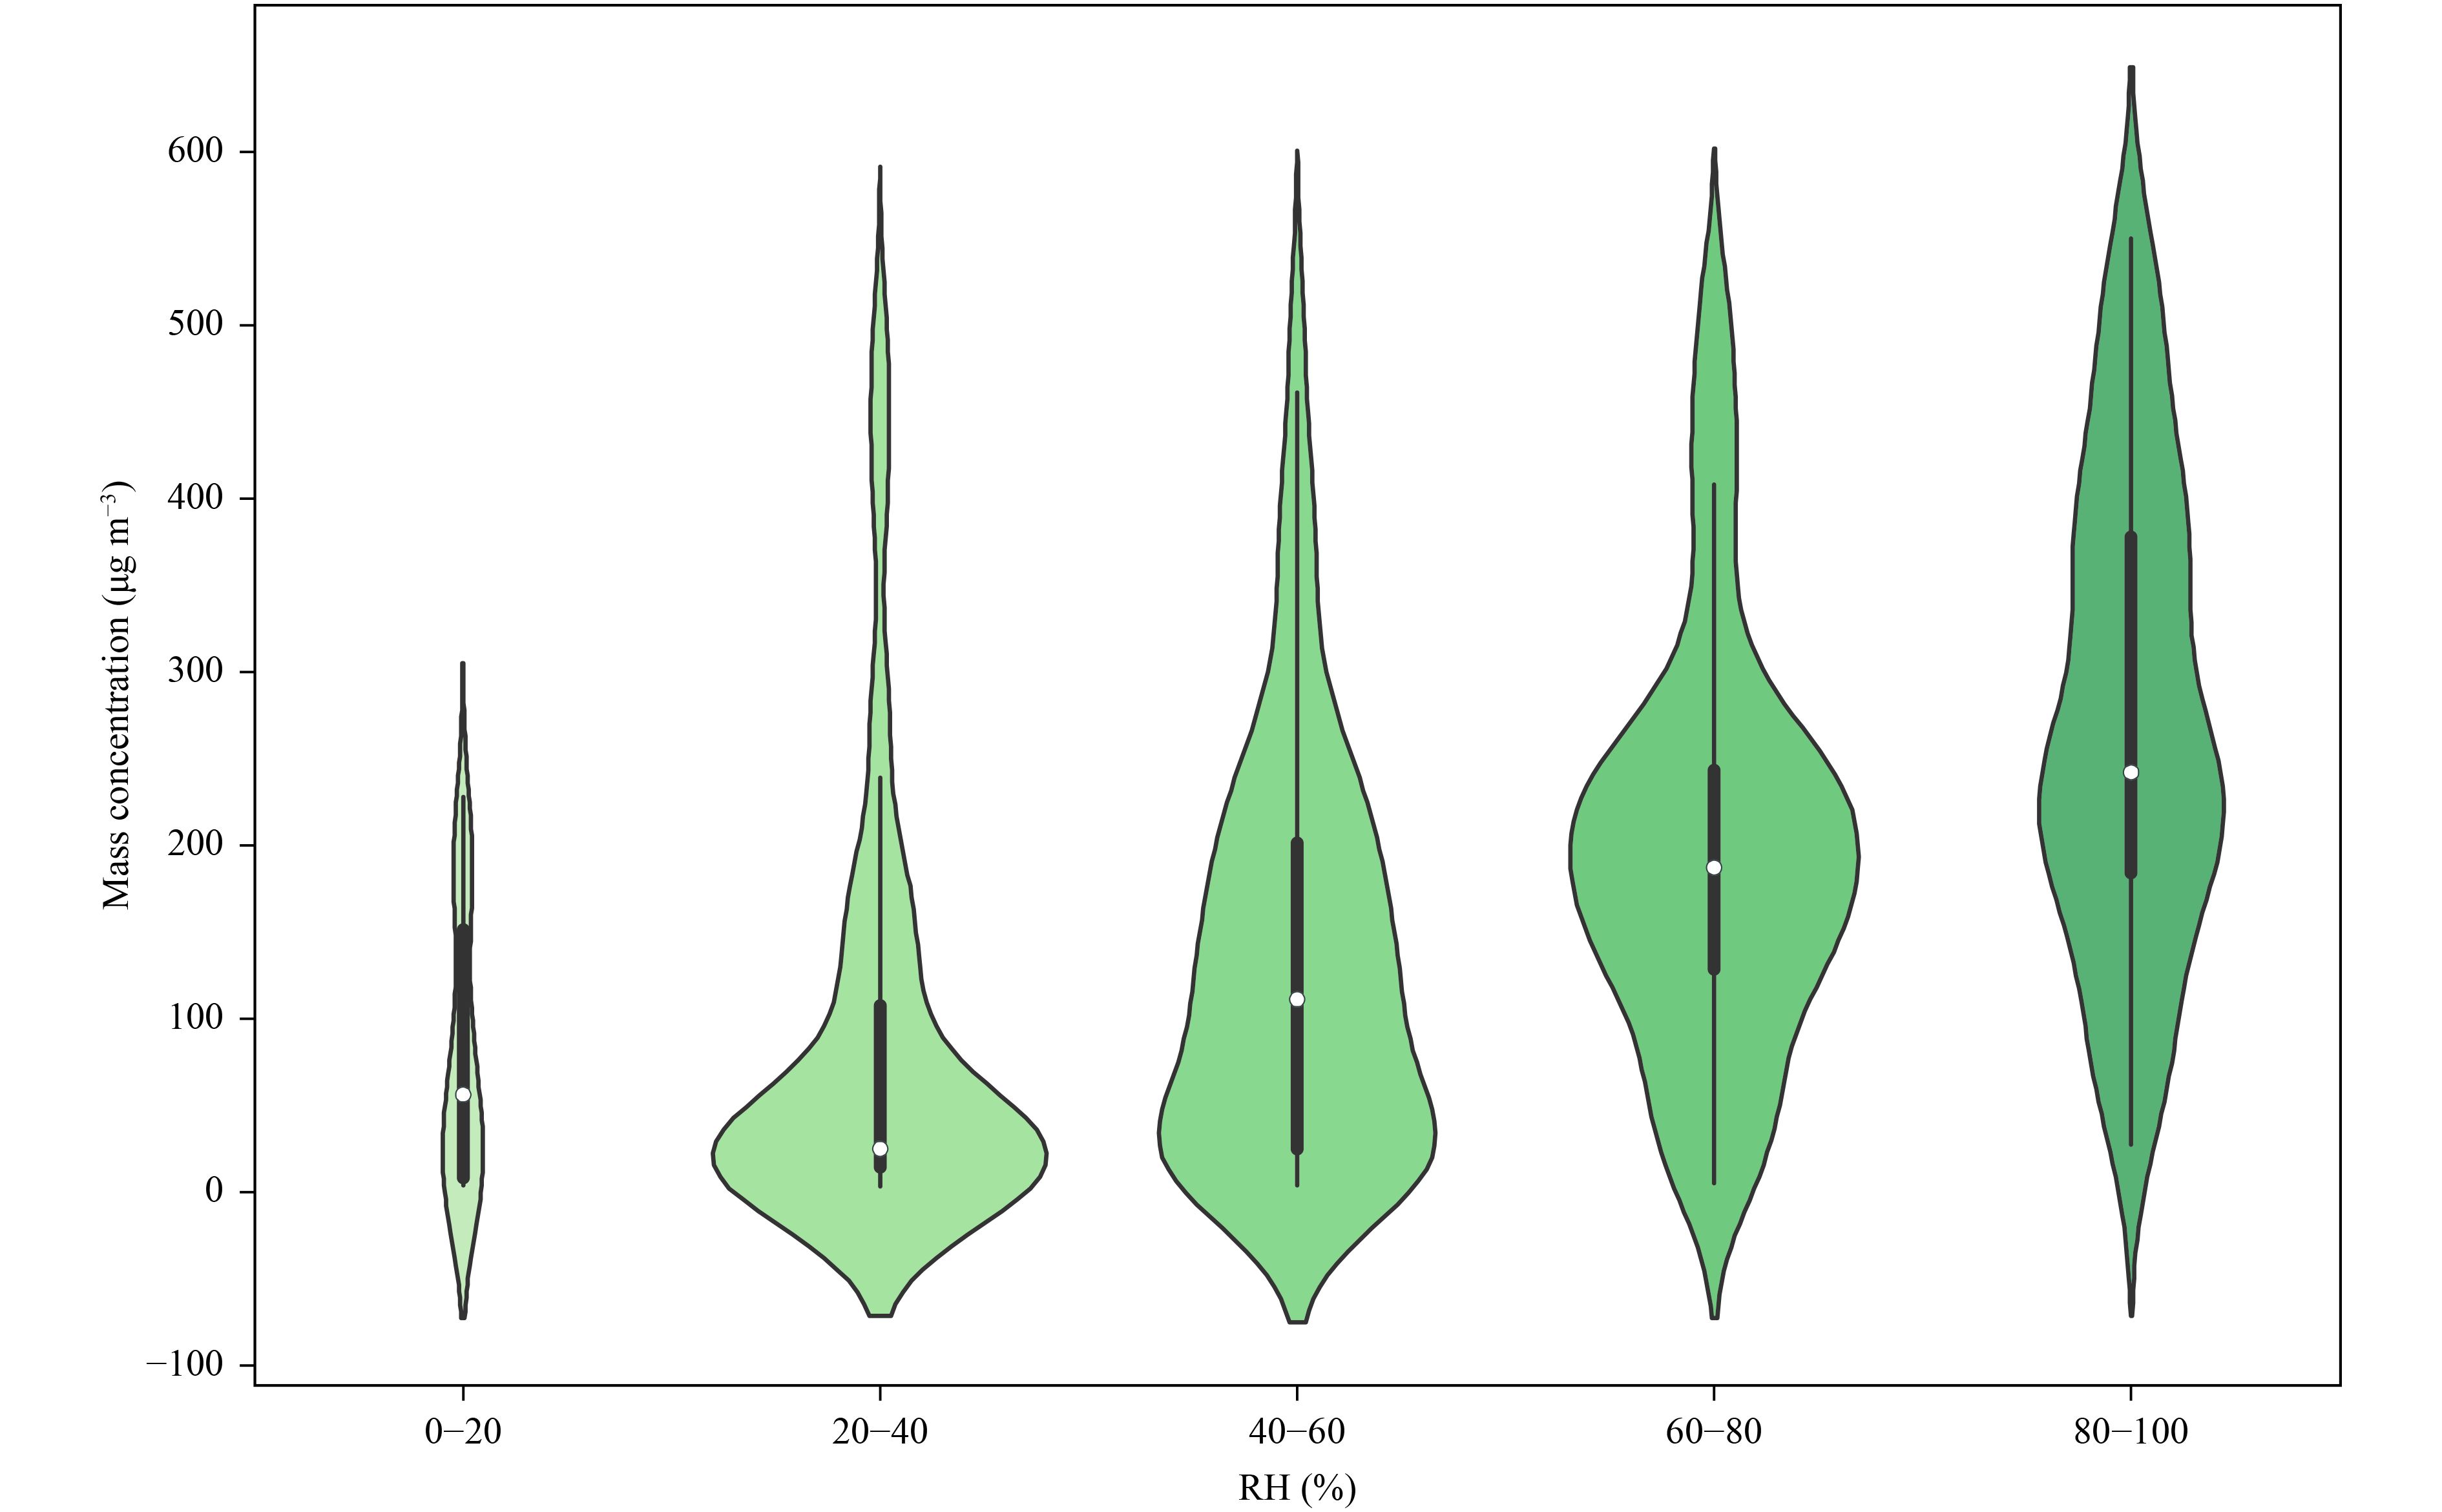
| Figure 5 Distribution of urban surface PM2.5 mass concentration in different ranges of RH from 1 December 2016 to 10 January 2017. The green nucleuses are the kernel density plots of PM2.5 concentration and the black columns are the box plots of PM2.5 concentration. |
We found that PM2.5 mass concentration substantially increases with RH when RH exceeds 20% (Fig. 5). The PM2.5 concentration is approximately 50, 100, 200, and 300 μg m–3, respectively, when the range of RH stays between 20%–40%, 40%–60%, 60%–80%, and 80%–100%. This indicates that RH remarkably influences the increase of PM2.5 concentration levels. When additional water vapor appears in the air, strong absorbent aerosols such as sulfate, nitrate, ammonium, and soluble organic particles, absorb the moisture and grow (Che et al., 2015). Aerosol particle size increases 20%–60% after moisture absorption in North China (Pan et al., 2009).
Aerosol water is a key component of atmospheric aerosols and serves as a medium that enables aqueous-phase reactions (Pilinis et al., 1989; Ervens et al., 2011). For example, aerosol water serves as a reactor in which alkaline aerosol components trap the SO2 oxidized by NO2 to form sulfate, whereby high reaction rates are sustained by the high neutralizing capacity of the atmosphere in northern China (Cheng et al., 2016). The ratio of SO2 to SO42– ranges from less than 0.1 at RH < 20% to 1.1 at RH > 90%, exhibiting an exponential increase with RH ( Wang et al., 2016). In addition, high RH is conducive to heterogeneous chemical processes, which accelerate the formation of air pollution (Zhu et al., 2011). For example, the net reaction probability of HNO3 uptake on CaCO3 particles was found to increase with increasing RH from about 0.003 at 10% to 0.21 at 80% (Liu et al., 2008). Under heavy pollution, humidity-related processes produced most atmospheric particles (Tang et al., 2016).
3.3.4 Overall causes for subsequent explosive growthA comparison between the temopral variations in PM2.5 mass concentration and in the vertical distributions of wind, temperature, and RH in Beijing from 1 December 2016 to 10 January 2017 shows that stable atmospheric stratification primarily characterized by light/calm southerly winds, anomalous temperature inversion, and accumulated moisture (RH > 80%) below 250 m, occurs concurrently with the subsequent explosive growth of PM 2.5 levels in the four CSs.
The anomalous temperature inversion facilitates vertical accumulation of pollutants through suppressing convective activities, while light/calm southerly winds precluding the invasion of northerly cold winds facilitates local pollution accumulation by minimizing horizontal pollutant diffusion. Decreased near-ground solar radiation caused by the cooling effect of aerosols reduces the BL height (less than 350 m, Fig. 4) to condense pollutants. Further accumulated near-surface moisture (RH > 80%) caused by the previously noted ground temperature decrease and inhibited vertical mixing of water vapors is conducive to secondary aerosol formation to increase PM 2.5 concentration levels. The joint effects of light/calm southerly winds, anomalous temperature inversion partly induced by radiative cooling of pre-existing aerosols, and accumulated moisture, result in the subsequent explosive growth of PM2.5 in the CSs.
High PM2.5 concentration levels accumulated from the subsequent explosive growth further decrease the near-ground temperature by reflecting and scattering more so-lar radiation, thus strengthening the existing anomalous inversion to maintain or accumulate pollutants until the next synoptic process occurs (Fig. 1c). For example, the near-surface temperature ranged from 3°C at 2000 BT 19 December to –3°C at 0800 BT 20 December after elevated ground PM2.5 levels. The near-surface temperature remained at –1°C with PM2.5 of more than 400 μg m–3 over the next 2 days until northerly strong, clean winds blew the pollution away on 22 December.
3.4 Quantification of meteorological feedback effect on the subsequent explosive growth
|
| Figure 6 Correlation between PM2.5 concentration and PLAM from 1 December 2016 to 10 January 2017. |
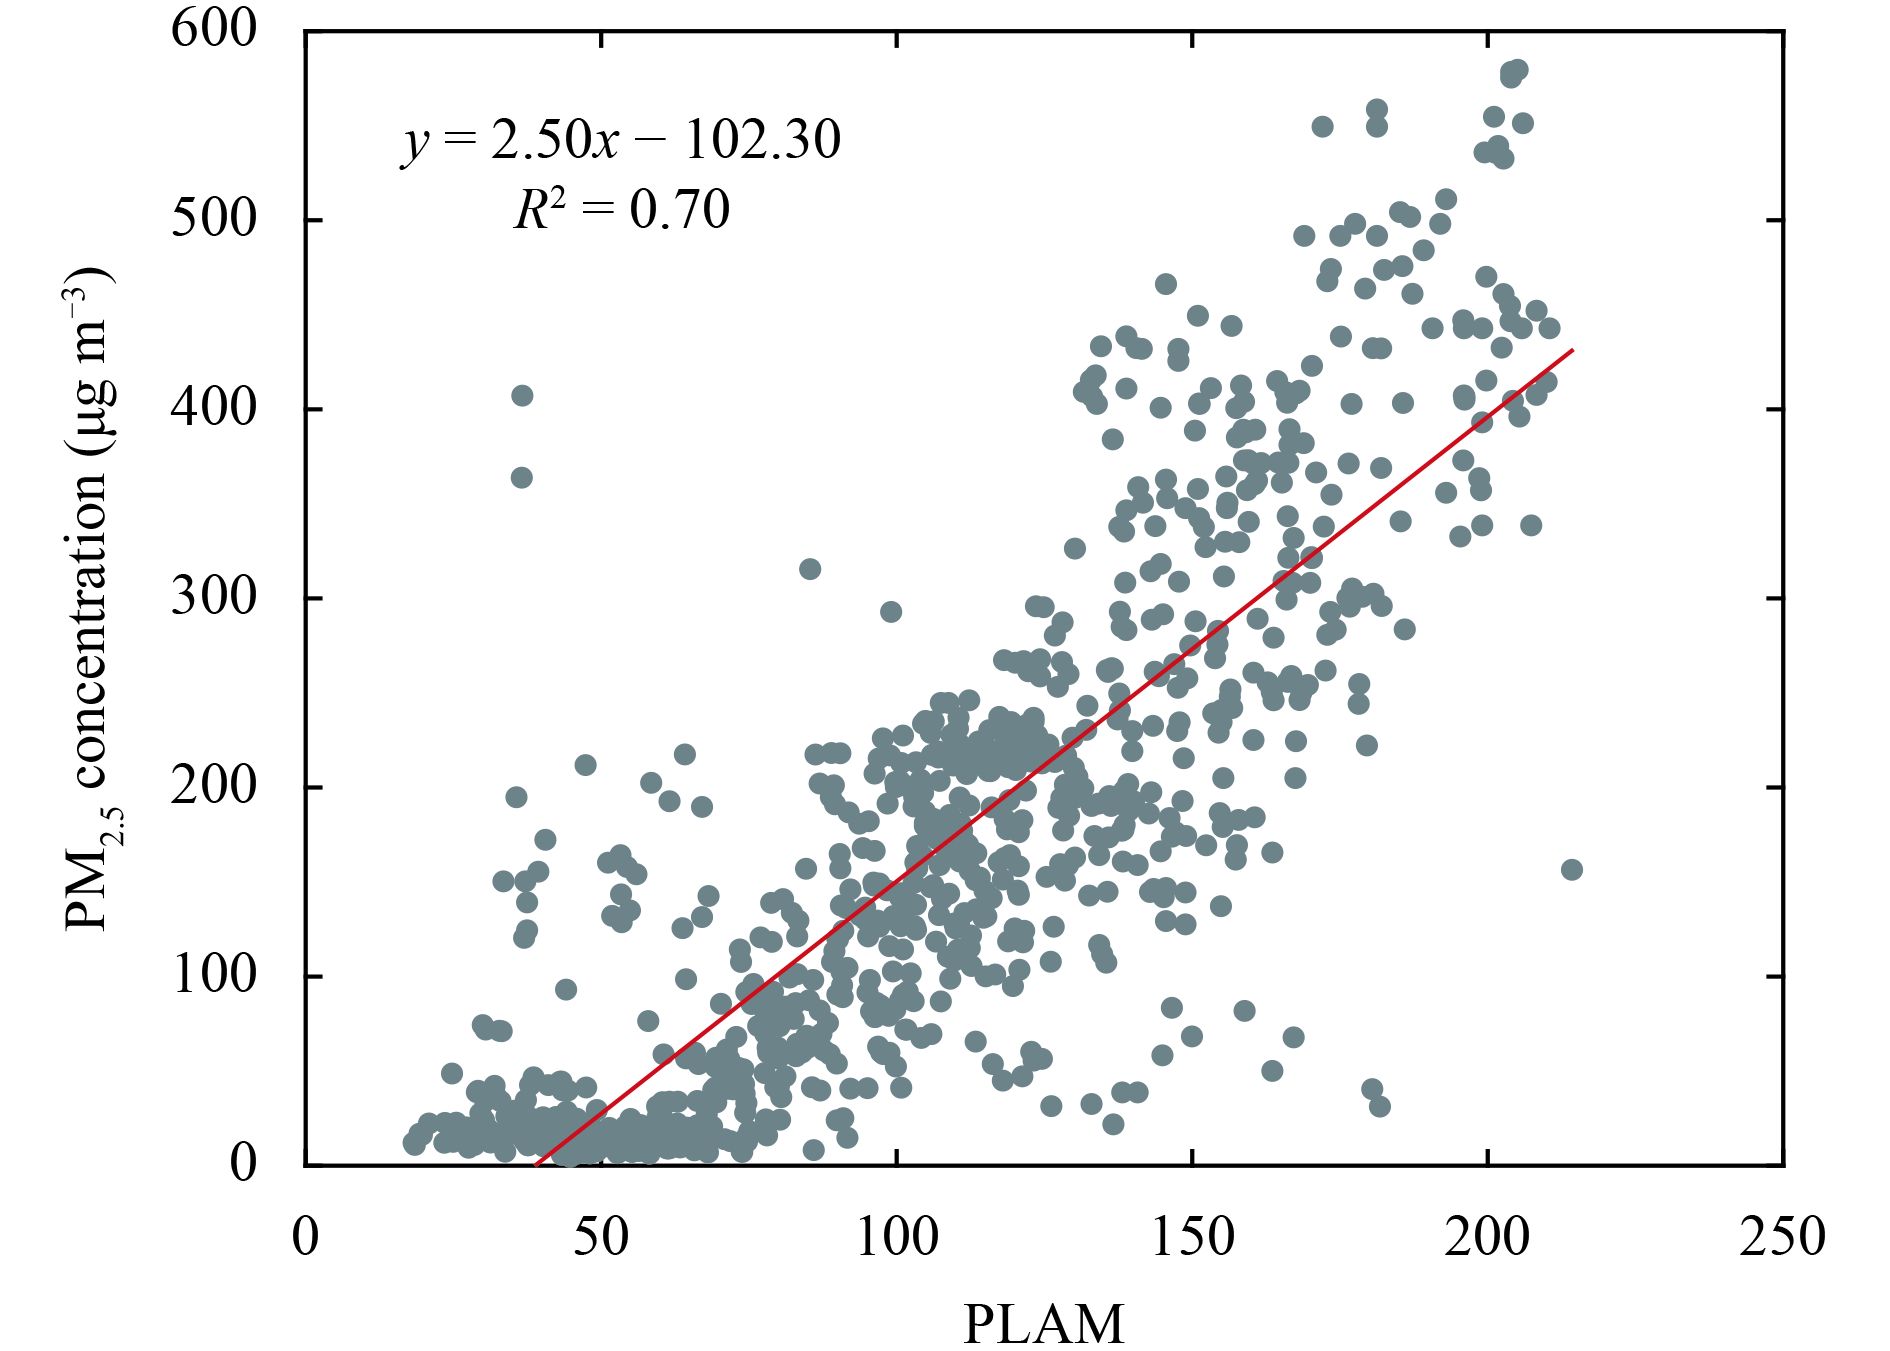
The above analysis reveals that atmospheric factors have major impacts on the formation and maintenance of HPEs. To further examine the influence of meteorologi-cal conditions on PM, a comprehensive meteorological index, i.e., PLAM, is used. PLAM is derived from the relationship of PM2.5 with key meteorological parameters and primarily reflects the stability of the air mass and the condensation rate of water vapor on aerosol particles. The PLAM index was employed to evaluate the contribution of meteorological factors to changes in atmospheric composition and optical properties over Beijing during the 2008 Olympic Games (Zhang et al., 2009) and to identify the contribution of specific meteorological factors to a 10-day haze–fog event in 2013 (Zhang et al., 2013). The details have been described in Wang et al. (2012) and Wang Z. B. et al. (2013). Figures 1a and 1e show that the hourly variation of urban mean PM2.5 mass concentration is in close agreement with that of PLAM for Beijing. The squared correlation coefficient is up to 0.70, exceeding the 0.05 significance level (Fig. 6), which suggests that the appearance of the HPEs in December may primarily be caused by meteorological factors, which explain approximately 70% of the PM2.5 concentration variation.
|
| Figure 7 Correlation between PM2.5 concentration and PLAM in (a–d) four subsequent explosive growth stages. |
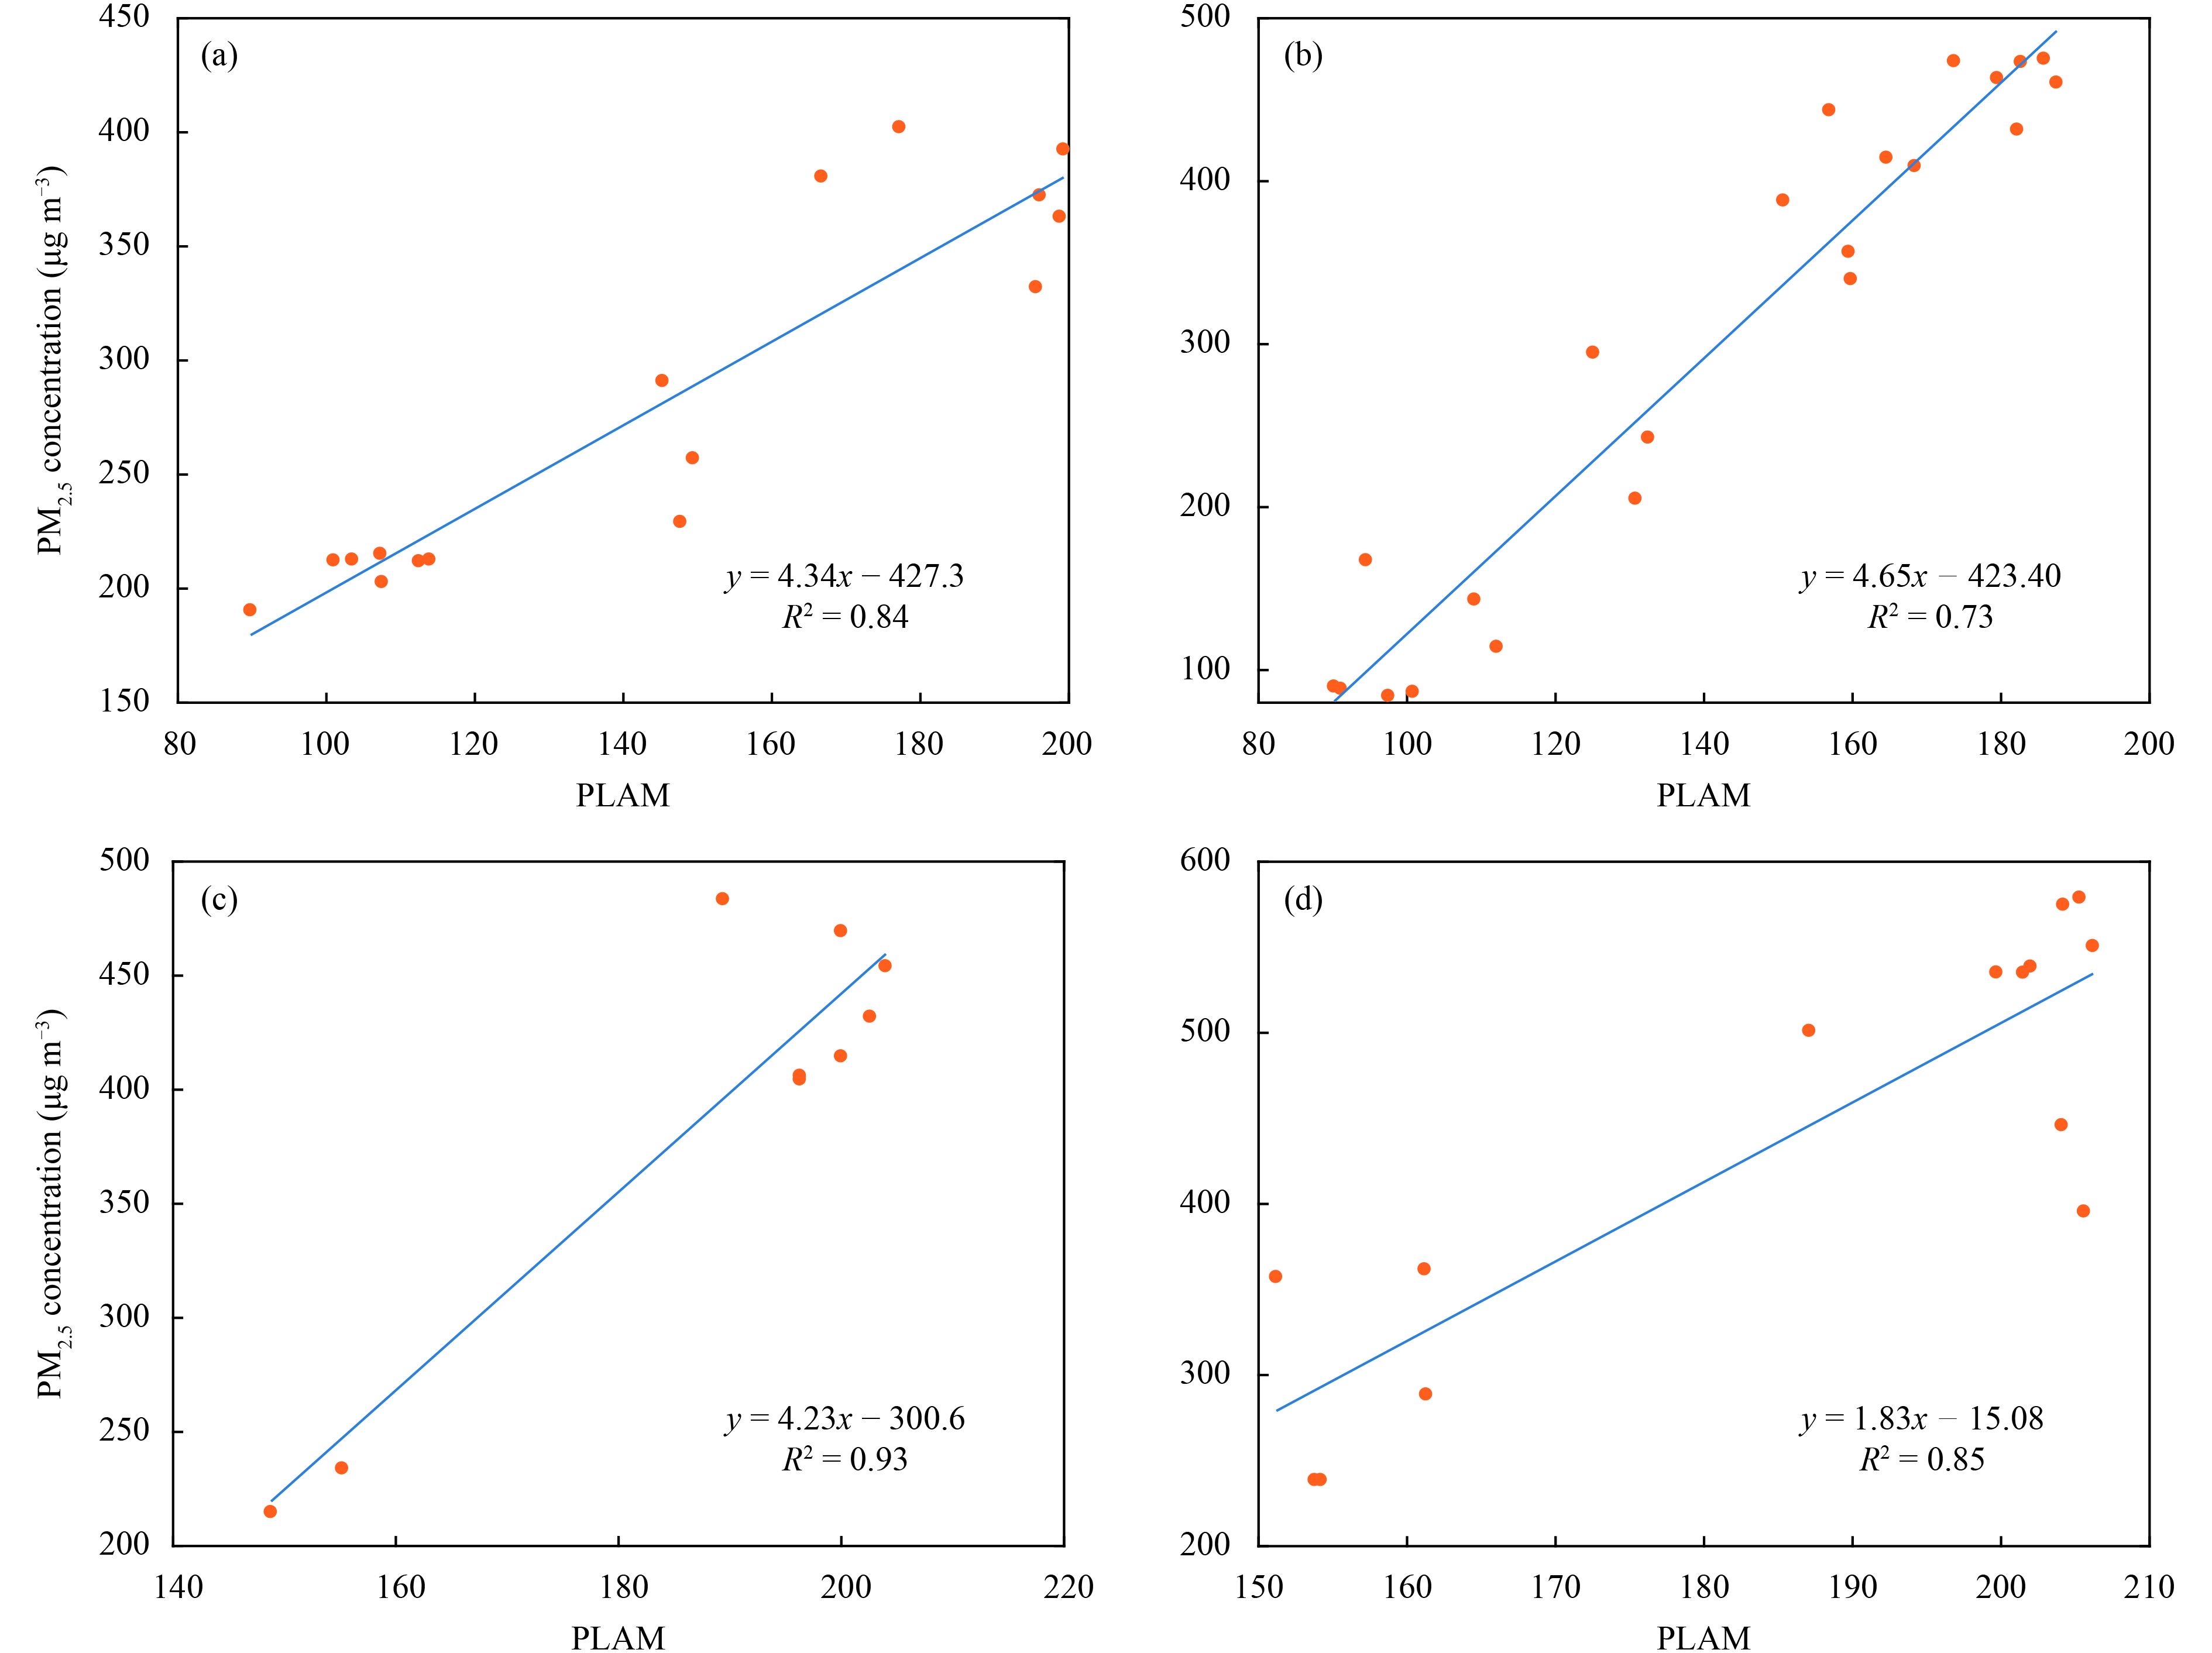
To further analyze the meteorological feedback effect of the more stable BL caused by the interaction between pre-existing aerosols and radiation on explosive growth of PM2.5 during the CSs, the correlation coefficient of PLAM and PM2.5 during the early CSs is calculated. The correlation coefficients are 0.73–0.93, exceeding the 0.05 significance level (Figs. 7a–d). This indicates that the meteorological feedback effect on PM2.5 accounts for approximately 84% on average, with a range of 73%–93%, in different stages of the explosive growth of PM2.5 mass concentration during the early CSs.
4 ConclusionsIn this paper, the relative contributions of meteorological factors within the boundary layer to the explosive growth of PM2.5 mass concentration were elucidated for both the initial PM transport stages and the subsequent PM accumulation stages. Pollutants transported from the south of Beijing primarily result in the formation of PM2.5 pollution in Beijing. Typically, during this pollution transport stage, warm and humid airflow from the south transports more water vapor and pollutants to the North China Plain, creating the requisite moisture and pollution accumulation conditions for the subsequent explosive growth of PM2.5 and subsequent accumulation.
When pollution occurs in Beijing with a certain amount of PM mass concentration within the BL, decreased surface solar radiation attributable to the radiative cooling effect of existing aerosols likely results in anomalous temperature inversion. This anomalous temperature inversion facilitates vertical pollutant accumulation by suppressing convective activities, while light/calm southerly winds that preclude the invasion of northerly cold winds facilitates local pollution accumulation by minimizing horizontal pollutant diffusion. Decreased surface solar radiation and weakened horizontal winds caused by the cooling effect of aerosols reduce the BL height, which is conducive to pollutant accumulation.
These results are also confirmed by a significant increase in the PLAM index and PM2.5 mass during the early cumulative stages of PM2.5. Using the change in the PLAM index to indicate the increase in PM2.5 due to worsening weather conditions, we observed that approximately 84% of the total amount of explosive growth in PM2.5 mass concentration during the early cumulative stages of the HPEs in Beijing in December 2016 could be attributable to the feedback effect on PM2.5 of the deterioration of the meteorological conditions.
The weak vertical mixing of moisture suppressed by anomalous temperature inversion and the ground temperature decrease caused by the cooling effects of PM result in appreciable near-surface moisture accumulation (RH > 80%). This moisture accumulation facilitates pollutant accumulation by enhancing hygroscopic growth and accelerating liquid phase and heterogeneous reactions. However, these specific reaction mechanisms have not been fully understood, particularly their contributions to explosive growth and maintenance of PM 2.5 during the cumulative stages of pollution. This topic requires additional investigation.
Exceedingly high PM2.5 concentration levels accumulated from the subsequent explosive growth further decreases the near-ground temperature by reflecting and scattering more solar radiation, and strengthening the existing anomalous temperature inversion to maintain or accumulate pollutants until the next synoptic process occurs.
| Boucher, O., D. Randall, P. Artaxo, et al., 2013: Clouds and aerosols. Climate Change 2013: The Physical Science Basis. Contribution of Working Group I to the Fifth Assessment Report of the Intergovernmental Panel on Climate Change. Stocker, T. F., D. Qin, G.-K. Plattner, et al., Eds. Cambridge University Press, Cambridge, United Kingdom and New York, NY, USA, 571–658. Online Link |
| Che, H., X. Y. Zhang, X. Xia, et al., 2015: Ground-based aerosol climatology of China: Aerosol optical depths from the China Aerosol Remote Sensing Network (CARSNET) 2002–2013. Atmos. Chem. Phys. Disc., 15, 12715–12776. DOI:10.5194/acpd-15-12715-2015 |
| Chen, Y., A. Ebenstein, M. Greenstone, et al., 2013: Evidence on the impact of sustained exposure to air pollution on life expectancy from China’s Huai River policy. Proc. Natl. Acad. Sci. USA, 110, 12936–12941. DOI:10.1073/pnas.1300018110 |
| Cheng, Y., G. Zheng, W. Chao, et al., 2016: Reactive nitrogen chemistry in aerosol water as a source of sulfate during haze events in China. Sci. Adv., 2. DOI:10.1126/sciadv.1601530 |
| Ervens, B., B. J. Turpin, and R. J. Weber, 2011: Secondary orga-nic aerosol formation in cloud droplets and aqueous particles (aqSOA): A review of laboratory, field and model studies. Atmos. Chem. Phys., 11, 11069–11102. DOI:10.5194/acp-11-11069-2011 |
| Guo, S., M. Hu, M. L. Zamora, et al., 2014: Elucidating severe urban haze formation in China. Proc. Natl. Acad. Sci. USA, 111, 17373–17378. DOI:10.1073/pnas.1419604111 |
| Hua, Y., S. Wang, J. Wang, et al., 2016: Investigating the impact of regional transport on PM2.5 formation using vertical observation during APEC 2014 Summit in Beijing . Atmos. Chem. Phys., 16, 15451–15460. DOI:10.5194/acp-16-15451-2016 |
| Huang, R.-J., Y. Zhang, C. Bozzetti, et al., 2014: High secondary aerosol contribution to particulate pollution during haze events in China. Nature, 514, 218–222. DOI:10.1038/nature13774 |
| Jia, Y., K. A. Rahn, K. He, et al., 2008: A novel technique for quantifying the regional component of urban aerosol solely from its sawtooth cycles. J. Geophys. Res. Atmos., 113, 6089–6098. DOI:10.1029/2008JD01038 |
| Liu, Y., E. R. Gibson, J. P. Cain, et al., 2008: Kinetics of heterogeneous reaction of CaCO3 particles with gaseous HNO3 over a wide range of humidity. J. Phys. Chem. A, 112, 1561. DOI:10.1021/jp076169h |
| Liu, X. G., J. Li, Y. Qu, et al., 2013: Formation and evolution mechanism of regional haze: A case study in the megacity Beijing, China. Atmos. Chem. Phys., 13, 4501–4514. DOI:10.5194/acp-13-4501-2013 |
| Pan, X. L., P. Yan, J. Tang, et al., 2009: Observational study of influence of aerosol hygroscopic growth on scattering coefficient over rural area near Beijing mega-city. Atmos. Chem. Phys., 9, 7519–7530. DOI:10.5194/acp-9-7519-2009 |
| Pilinis, C., J. H. Seinfeld, and D. Grosjean, 1989: Water content of atmospheric aerosols. Atmos. Environ., 23, 1601–1606. DOI:10.1016/0004-6981(89)90419-8 |
| Sun, Y., Q. Jiang, Z. Wang, et al., 2014: Investigation of the sources and evolution processes of severe haze pollution in Beijing in January 2013. J. Geophys. Res. Atmos., 119, 4380–4398. DOI:10.1002/2014JD021641 |
| Tang, G., J. Zhang, X. Zhu, et al., 2016: Mixing layer height and its implications for air pollution over Beijing, China. Atmos. Chem. Phys., 16, 2459–2475. DOI:10.5194/acp-16-2459-2016 |
| Wallace, J. M., and P. V. Hobbs, 2006: Atmospheric Science: An Introductory Survey. Elsevier, 483 pp. |
| Wang, J. Z., S. Gong, X. Y. Zhang, et al., 2012: A parameterized method for air-quality diagnosis and its applications. Adv. Meteor., 3181–3190. DOI:10.1155/2012/238589 |
| Wang, J., Y. Wang, H. Liu, et al., 2013: Diagnostic identification of the impact of meteorological conditions on PM2.5 concentrations in Beijing . Atmos. Environ., 81, 158–165. DOI:10.1016/j.atmosenv.2013.08.033 |
| Wang, Z. B., M. Hu, Z. J. Wu, et al., 2013: Long-term measurements of particle number size distributions and the relationships with air mass history and source apportionment in the summer of Beijing. Atmos. Chem. Phys., 13, 10159–10170. DOI:10.5194/acpd-13-5165-2013 |
| Wang, H., J. An, L. Shen, et al., 2014: Mechanism for the formation and microphysical characteristics of submicron aerosol during heavy haze pollution episode in the Yangtze River Delta, China. Sci. Total Environ., 490, 501–508. DOI:10.1016/j.scitotenv.2014.05.009 |
| Wang, J., S. Wang, J. Jiang, et al., 2014: Impact of aerosol–meteorology interactions on fine particle pollution during China’s severe haze episode in January 2013. Environ. Res. Lett., 9, 094002. DOI:10.1088/1748-9326/9/9/094002 |
| Wang, X., J. Chen, J. Sun, et al., 2014: Severe haze episodes and seriously polluted fog water in Ji’nan, China. Sci. Total Environ., 493, 133–137. DOI:10.1016/j.scitotenv.2014.05.135 |
| Wang, Z., J. Li, Z. Wang, et al., 2014: Modeling study of regional severe hazes over mid–eastern China in January 2013 and its implications on pollution prevention and control. Sci. China Earth Sci., 57, 3–13. DOI:10.1007/s11430-013-4793-0 |
| Wang, H., M. Xue, X. Y. Zhang, et al., 2015: Mesoscale modeling study of the interactions between aerosols and PBL meteorology during a haze episode in Jing–Jin–Ji (China) and its nearby surrounding region – Part 1: Aerosol distributions and meteorological features. Atmos. Chem. Phys., 15, 3257–3275. DOI:10.5194/acp-15-3257-2015 |
| Wang, G., R. Zhang, M. E. Gomez, et al., 2016: Persistent sulfate formation from London Fog to Chinese haze. Proc. Natl. Acad. Sci. USA, 113, 13630. DOI:10.1073/pnas.1616540113 |
| Wei, P., S. Y. Cheng, J. B. Li, et al., 2011: Impact of boundary-layer anticyclonic weather system on regional air quality. Atmos. Environ., 45, 2453–2463. DOI:10.1016/j.atmosenv.2011.01.045 |
| Zhang, X. Y., Y. Q. Wang, W. L. Lin, et al., 2009: Changes of atmospheric composition and optical properties over Beijing—2008 Olympic monitoring campaign. Bull. Amer. Meteor. Soc., 90, 1633. DOI:10.1175/2009BAMS2804.1 |
| Zhang, X. Y., Y. Q. Wang, T. Niu, et al., 2012: Atmospheric aerosol compositions in China: Spatial/temporal variability, chemical signature, regional haze distribution and comparisons with global aerosols. Atmos. Chem. Phys., 11, 26571–26615. DOI:10.5194/acp-12-779-2012 |
| Zhang, X., J. Sun, Y. Wang, et al., 2013: Factors contributing to haze and fog in China. Chinese Sci. Bull., 58, 1178. DOI:10.1360/972013-150 |
| Zhang, R. H., Q. Li, and R. N. Zhang, 2014: Meteorological conditions for the persistent severe fog and haze event over eastern China in January 2013. Sci. China Earth Sci., 57, 26–35. DOI:10.1007/s11430-013-4774-3 |
| Zhang, R. Y., G. H. Wang, S. Guo, et al., 2015: Formation of ur-ban fine particulate matter. Chemical Reviews, 115, 3803–3855. DOI:10.1021/acs.chemrev.5b00067 |
| Zhang, X. Y., J. Z. Wang, Y. Q. Wang, et al., 2015: Changes in chemical components of aerosol particles in different haze regions in China from 2006 to 2013 and contribution of meteorological factors. Atmos. Chem. Phys., 15, 12935–12952. DOI:10.5194/acp-15-12935-2015 |
| Zheng, B., Q. Zhang, Y. Zhang, et al., 2015: Heterogeneous chemistry: A mechanism missing in current models to explain secondary inorganic aerosol formation during the January 2013 haze episode in North China. Atmos. Chem. Phys., 15, 2031–2049. DOI:10.5194/acp-15-2031-2015 |
| Zheng, G. J., F. K. Duan, H. Su, et al., 2015: Exploring the severe winter haze in Beijing: The impact of synoptic weather, regional transport and heterogeneous reactions. Atmos. Chem. Phys., 15, 2969–2983. DOI:10.5194/acp-15-2969-2015 |
| Zhu, T., J. Shang, and D. F. Zhao, 2011: The roles of heterogeneous chemical processes in the formation of an air pollution complex and gray haze. Sci. China Chem., 54, 145–153. DOI:10.1007/s11426-010-4181-y |
| Zhu, X., G. Tang, B. Hu, et al., 2016: Regional pollution and its formation mechanism over North China Plain: A case study with ceilometer observations and model simulations. J. Geophys. Res. Atmos., 121, 14574–14588. DOI:10.1002/2016JD025730 |
 2017, Vol. 31


