The Chinese Meteorological Society
Article Information
- Yan LI, Weican ZHOU, Xianyan CHEN, Dexian FANG, Qianqian ZHANG . 2017.
- Influences of the Three Gorges Dam in China on Precipitation over Surrounding Regions. 2017.
- J. Meteor. Res., 31(4): 767-773
- http://dx.doi.org/10.1007/s13351-017-6177-4
Article History
- Received October 31, 2016
- in final form March 22, 2017
2. National Climate Center, Beijing 100081;
3. Chongqing Institute of Meteorological Sciences, Chongqing 401147
The Three Gorges Dam (TGD) in China—located on the Yangtze River and controlling a section of the river—is the largest hydro power project in the world. The associated Three Gorges Reservoir (TGR), a huge artificial lake, had a water level of 66 m before the operation of TGD, which then increased to 135 m in June 2003, 155 m in October 2006, approximately 172 m in 2008 and 2009, and 175 m on 25 October 2010, after which it has remained stable. At the point, its water level rose to 175 m, TGR had extended to 660 km along the waterway, with its average width having increased from 0.6 to 1–2 km, and the total area having reached 1084 km2. Therefore, an increasing amount of attention is being paid to the forcing exerted by TGD on the climate. However, the impact in this regard, due to the land-use change related to TGD, has not yet been clarified. Some studies, based on several specific field experiments (Chen et al., 2009, 2013; Li and Tang, 2014) and idealized numerical simulations (Zhang et al., 2004), have indicated that the influence of TGR on climate is weak and confined only to the local (i.e., km) scale.
The surrounding topography is complex and may couple with TGR to impact the precipitation in nearby areas. Two numerical simulations, control and TGD, were performed by Miller et al. (2005) to investigate the influence of TGD, and the results indicated that the presence of TGR leads to strong local evaporation that cools the air, thus enhancing descending motion and, as a result, there is almost no influence on precipitation locally due to TGR. Wu et al. (2006) examined the impact of TGD on regional precipitation and found that TGR land-use change enhances the rainfall between the Daba and Qinling mountains and weakens it over the TGD region (28°–34°N, 106°–112°E). Xiao et al. (2010) analyzed the decadal variation of precipitation in the vicinity of TGD using daily data from 1960 to 2005, and argued that there is no significant evidence that the opposite sign of change in precipitation in the areas north and south of the Yangtze River has been affected by TGD. Hence, the effect of land-use change associated with TGD on the surrounding precipitation is controversial. Studies based on high-resolution numerical simulations (Zhang et al., 2004; Wu et al., 2006) and observational analysis have limited temporal coverage, only partially covering the period of TGD's existence (Wu et al., 2006; Xiao et al., 2010). Thus, further studies on the influences of TGD on the surrounding pattern and amounts of precipitation, using longer observational data, are required.
The abovementioned research on the climate change induced by TGR (Wu et al., 2006; Xiao et al., 2010) only used data up until the year 2005, when the water level was less than 155 m, and there were only two years of observations used for discussion. In fact, TGD has now been in use—either partially or completely—for more than 10 yr, which provides us with a sufficiently long observational record to reanalyze the climatic impact of TGD. In addition, the rainfall over East Asia experienced a significant decadal shift around the mid 1990s (Zhu et al., 2014; Ren et al., 2017); the decadal turning point of the winter rainfall over southern China occurred around 1993 (Li et al., 2016). Therefore, in this study, 10 yr (2004–13) of observations after TGR came into use, and another two 10-yr observational periods (1984–93 and 1994–2003) before its use, are compared to reveal the possible impact of TGR on the surrounding patterns and amounts of precipitation.
2 Data and methodsThe daily observations of precipitation (mm), temperature (℃), evaporation (kg m–2), and relative humidity (%) during 1984–2013 are from the China Daily Ground Climate Dataset, Version 3.0, of the China Meteorological Data Sharing Service System (http://cdc.nmic.cn). The data were collected and quality-controlled by the National Meteorological Information Center of the China Meteorological Administration. After an initial quality assessment, we identified a set of stations to be applied in this study (Fig. 1). To understand effectively the precipitation variations (both spatial and temporal) in the vicinity of TGD (28°–34°N, 106°–112°E), empirical orthogonal function (EOF) analysis is applied.

|
| Figure 1 Location of Three Gorges Dam (TGD) and the observational stations used in this study. Each colored region represents the three spatial bands used for elucidating the influence of TGD on the local climate. Black dots indicate the station locations and the "#" symbol represents the location of TGD. |
We divided up the study zone based on distance from the reservoir (Degu et al., 2011). Specifically, we compared the climatic variations of temperature, humidity, evaporation, and precipitation in the following three spatial bands (Fig. 1): (1) over TGR, (2) near TGR (a band between 10 and 100 km away from the center of TGR), and (3) far from TGR (a band between 100 and 200 km away from the center of TGR). The climatic variation associated with the Pacific Decadal Oscillation and other decadal climate modes generally influences a much larger region, including the three spatial bands of the present study. However, the climate change induced by the reservoir is considered as being greater in the closer TGR region (Li et al., 2011). Hence, the relative variation from one band to another is considered as being mostly the results of the reservoir's impact. The influence of internal variations of temperature, humidity, and precipitation should be very random in the three bands, and thus negligible in the 10-or 30-yr average pattern.
For a similar reason, we define a new time series as the difference between the time series over TGR and the vicinity of TGD (28°–34°N, 106°–112°E). Since the influence of TGD reflected in the time series over the vicinity of TGD is relatively small (Wu et al., 2006), the new time series should significantly reduce the signal of natural internal variation.
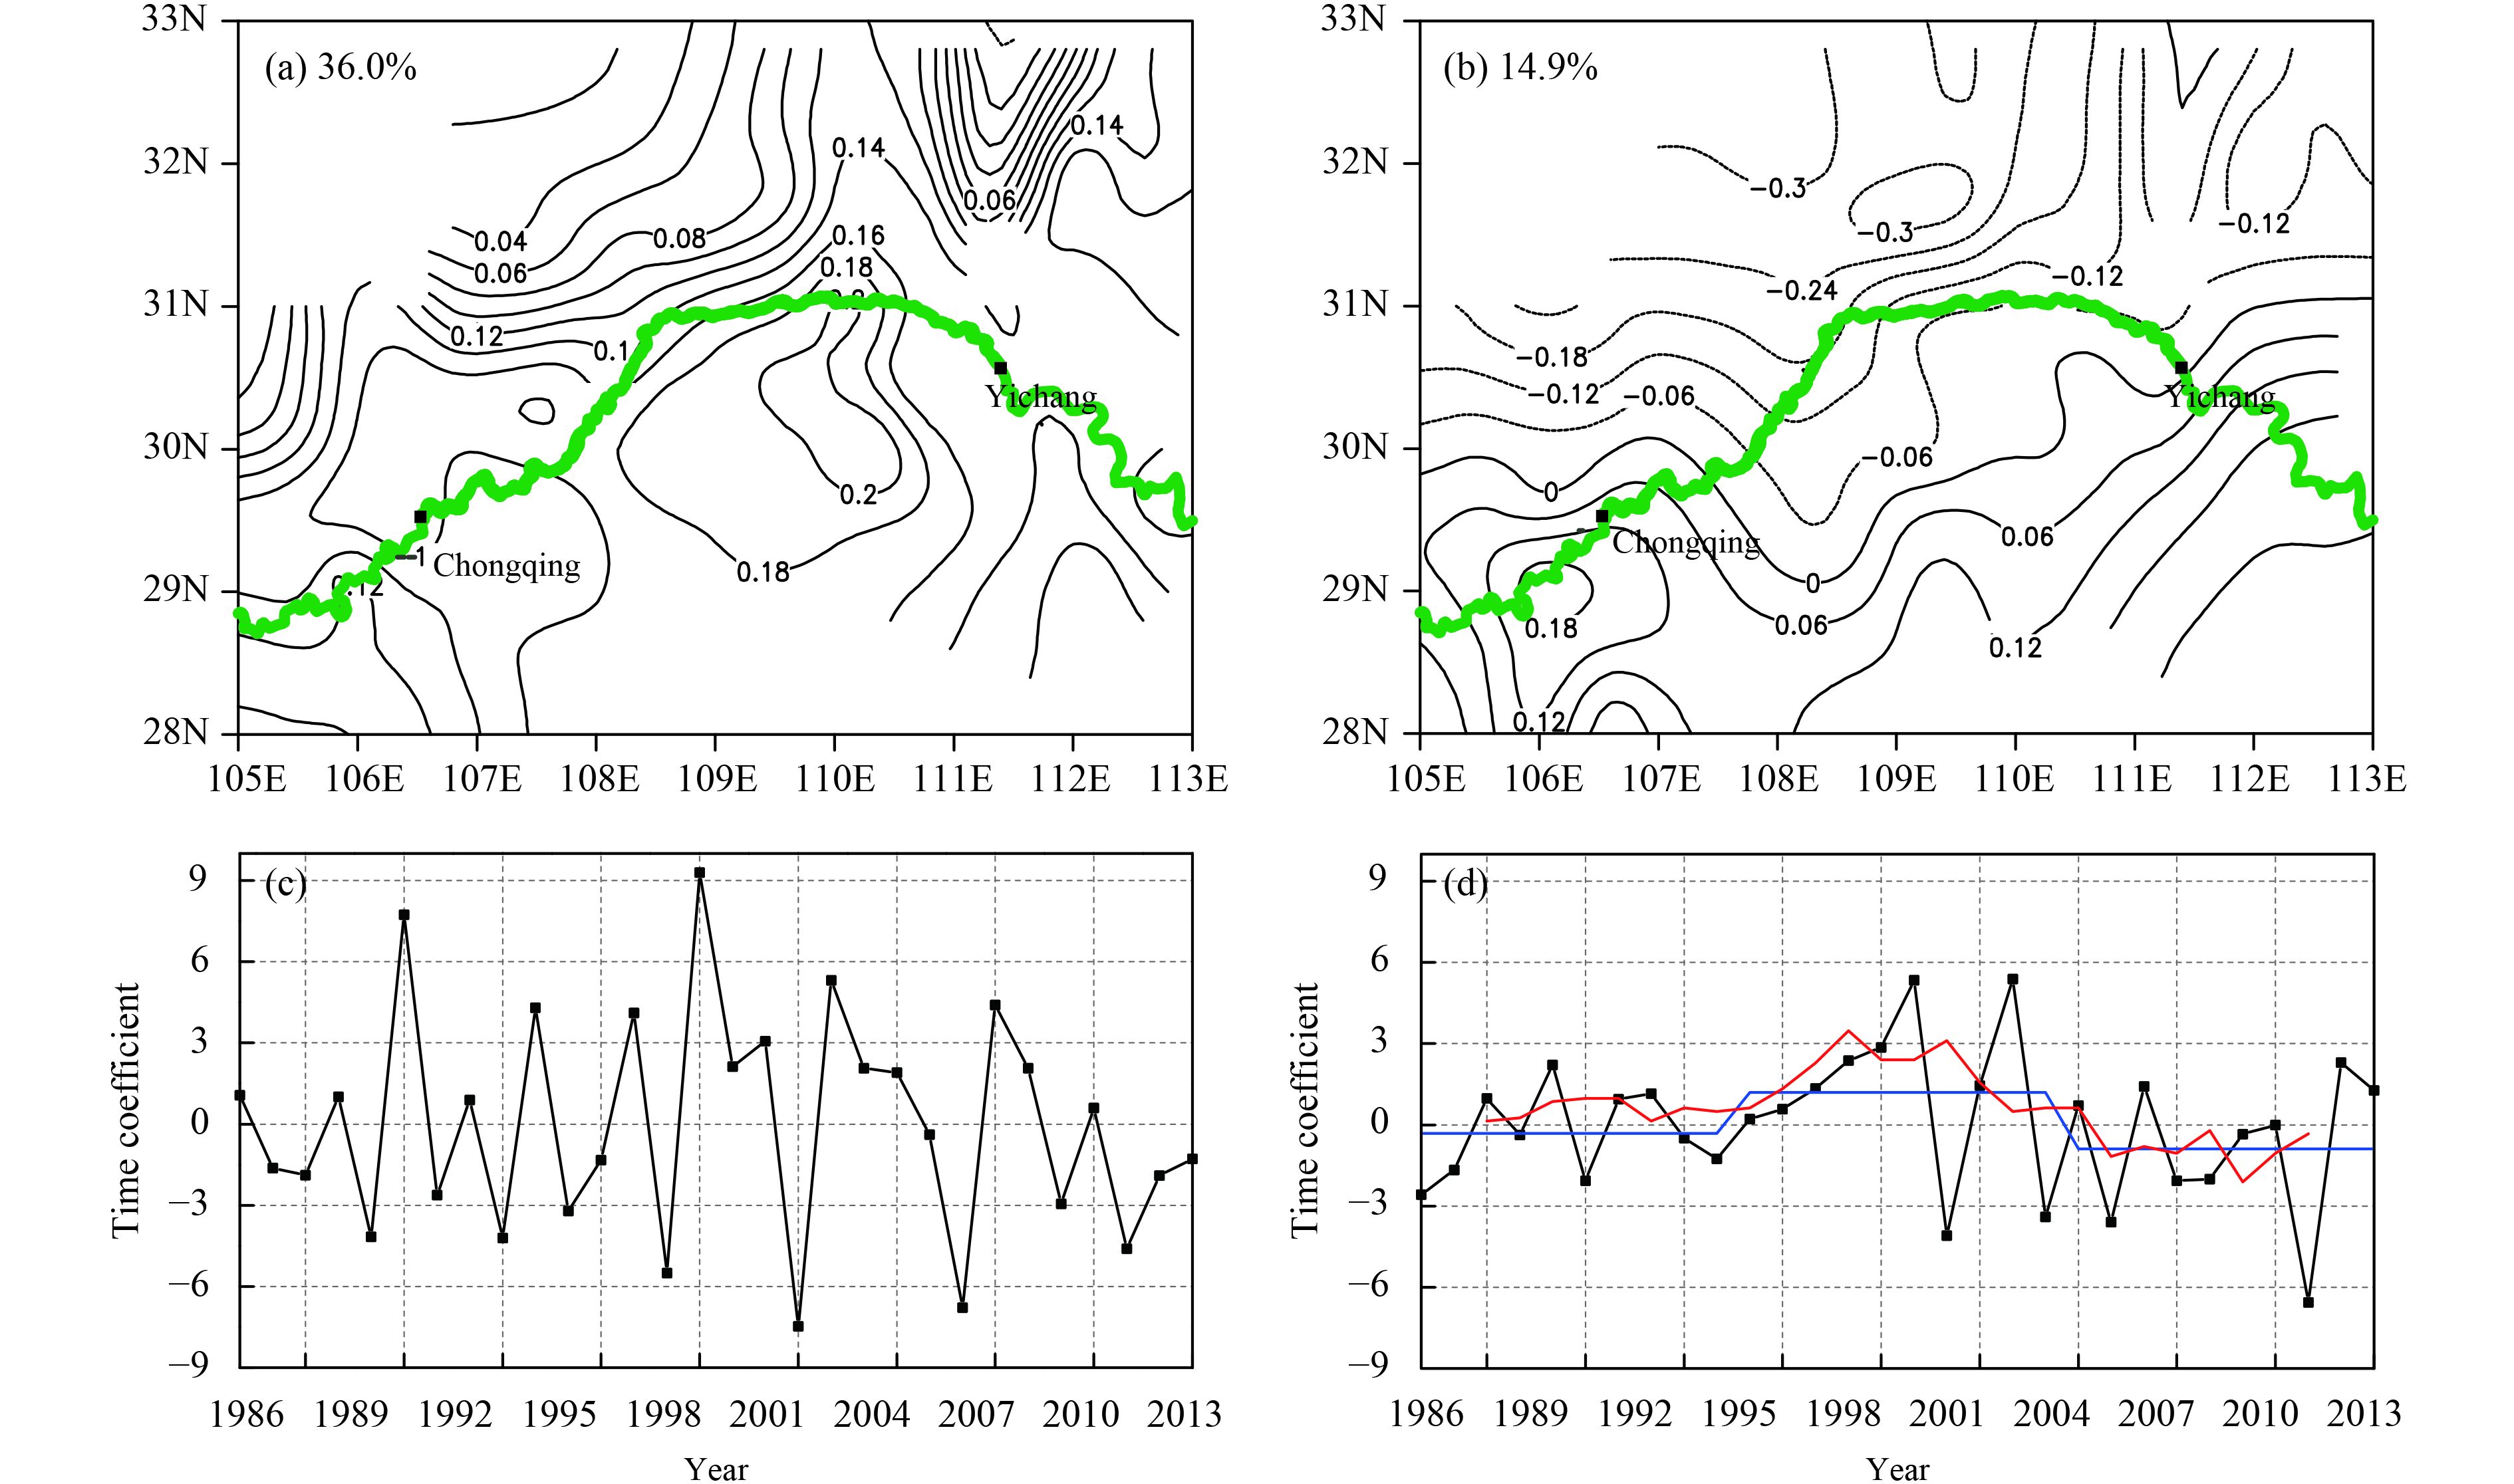
3 Precipitation variability around TGDThe spatiotemporal characteristics of annual-mean precipitation in the TGD region are analyzed by using the EOF method for the three decades (1984–93, 1994–2003, and 2004–13), separately. The results show a similar pattern of precipitation anomalies in the first and second modes, so we put the three decades together to investigate the precipitation change over time. Figure 2 shows the spatial pattern and the corresponding spatiotemporal variability of the first and second EOF modes during 1984–2013 using the EOF method. The first mode explains 36% of the total variance and reflects a precipitation pattern with same anomalous signs over southern and northern Yangtze River (Fig. 2a). The second mode accounts for 14.9% of the total variance and shows opposite signs of anomalies in northern and southern Yangtze River (Fig. 2b). This is consistent with the findings of Xiao et al. (2010) and Li and Tang (2014). The time series of the first EOF mode mainly reflects the interannual variation (Fig. 2c). However, the time series of the second EOF mode shows not only the significant interannual variability, but also the interdecadal variability; the 5-yr running mean clearly shows two turning points, in 1993 and 2003, which is consistent with the split point of the study periods. From the mid 1990s to the early 2000s, precipitation decreased to the north and increased to the south. The precipitation patterns were similar during the 1980s and 2004–13, when the precipitation increased to the north of the Yangtze River but decreased to the south. The above EOF analysis agrees with previous studies that the natural precipitation has an opposite signal on northern and southern Yangtze River. Furthermore, we should be cautious of the fact that the turning point of the second EOF mode is around 2003, when TGR was only partially in use.
|
| Figure 2 Spatial patterns of the EOF's leading modes and the corresponding spatiotemporal variability of mean annual precipitation (mm day–1) in the area of TGD (28°–33°N, 105°–113°E) from 1984 to 2013: (a) spatial pattern of the first mode, (b) spatial pattern of the second mode, (c) principal component of the first mode, and (d) principal component of the second mode. The red line in (d) is the 5-yr running mean, and the blue horizontal lines denote the decadal mean. |
To investigate this further, the observation is divided into three 10-yr periods: 1984–93, 1994–2003, and 2004–13 (the former two representing decades before TGR was in use and the latter representing a decade after TGR came into use). The differences in the annual-mean precipitation between 1994–2003 and 1984–93, as well as between 2004–13 and 1994–2003, were calculated and plotted in Fig. 3. The results clearly show opposite precipitation changes over northern and southern sides of the Yangtze River, which is consistent with the second EOF mode. During the recent 10-yr period, after TGD's water level was raised in 2003, the annual-mean precipitation increased to the north and decreased to the south, as compared with 1994–2003. Wu et al. (2006) suggested that this phenomenon might have been influenced by the construction of TGD. However, Xiao et al. (2010) believed that such an opposite tendency of precipitation variation occurred before TGD's construction, meaning that it may have been due to natural variability. From Fig. 2d, we can see that the magnitude of the time series during 1984–93 is significantly smaller than that during 2004–13. Thus, this raises a new question as to whether the construction of TGD enhanced the natural variability of precipitation.

|
| Figure 3 Differences in mean annual precipitation (mm day–1) derived from the two periods: (a) between 1994–2003 and 1984–93; (b) between 2004–13 and 1994–2003. |
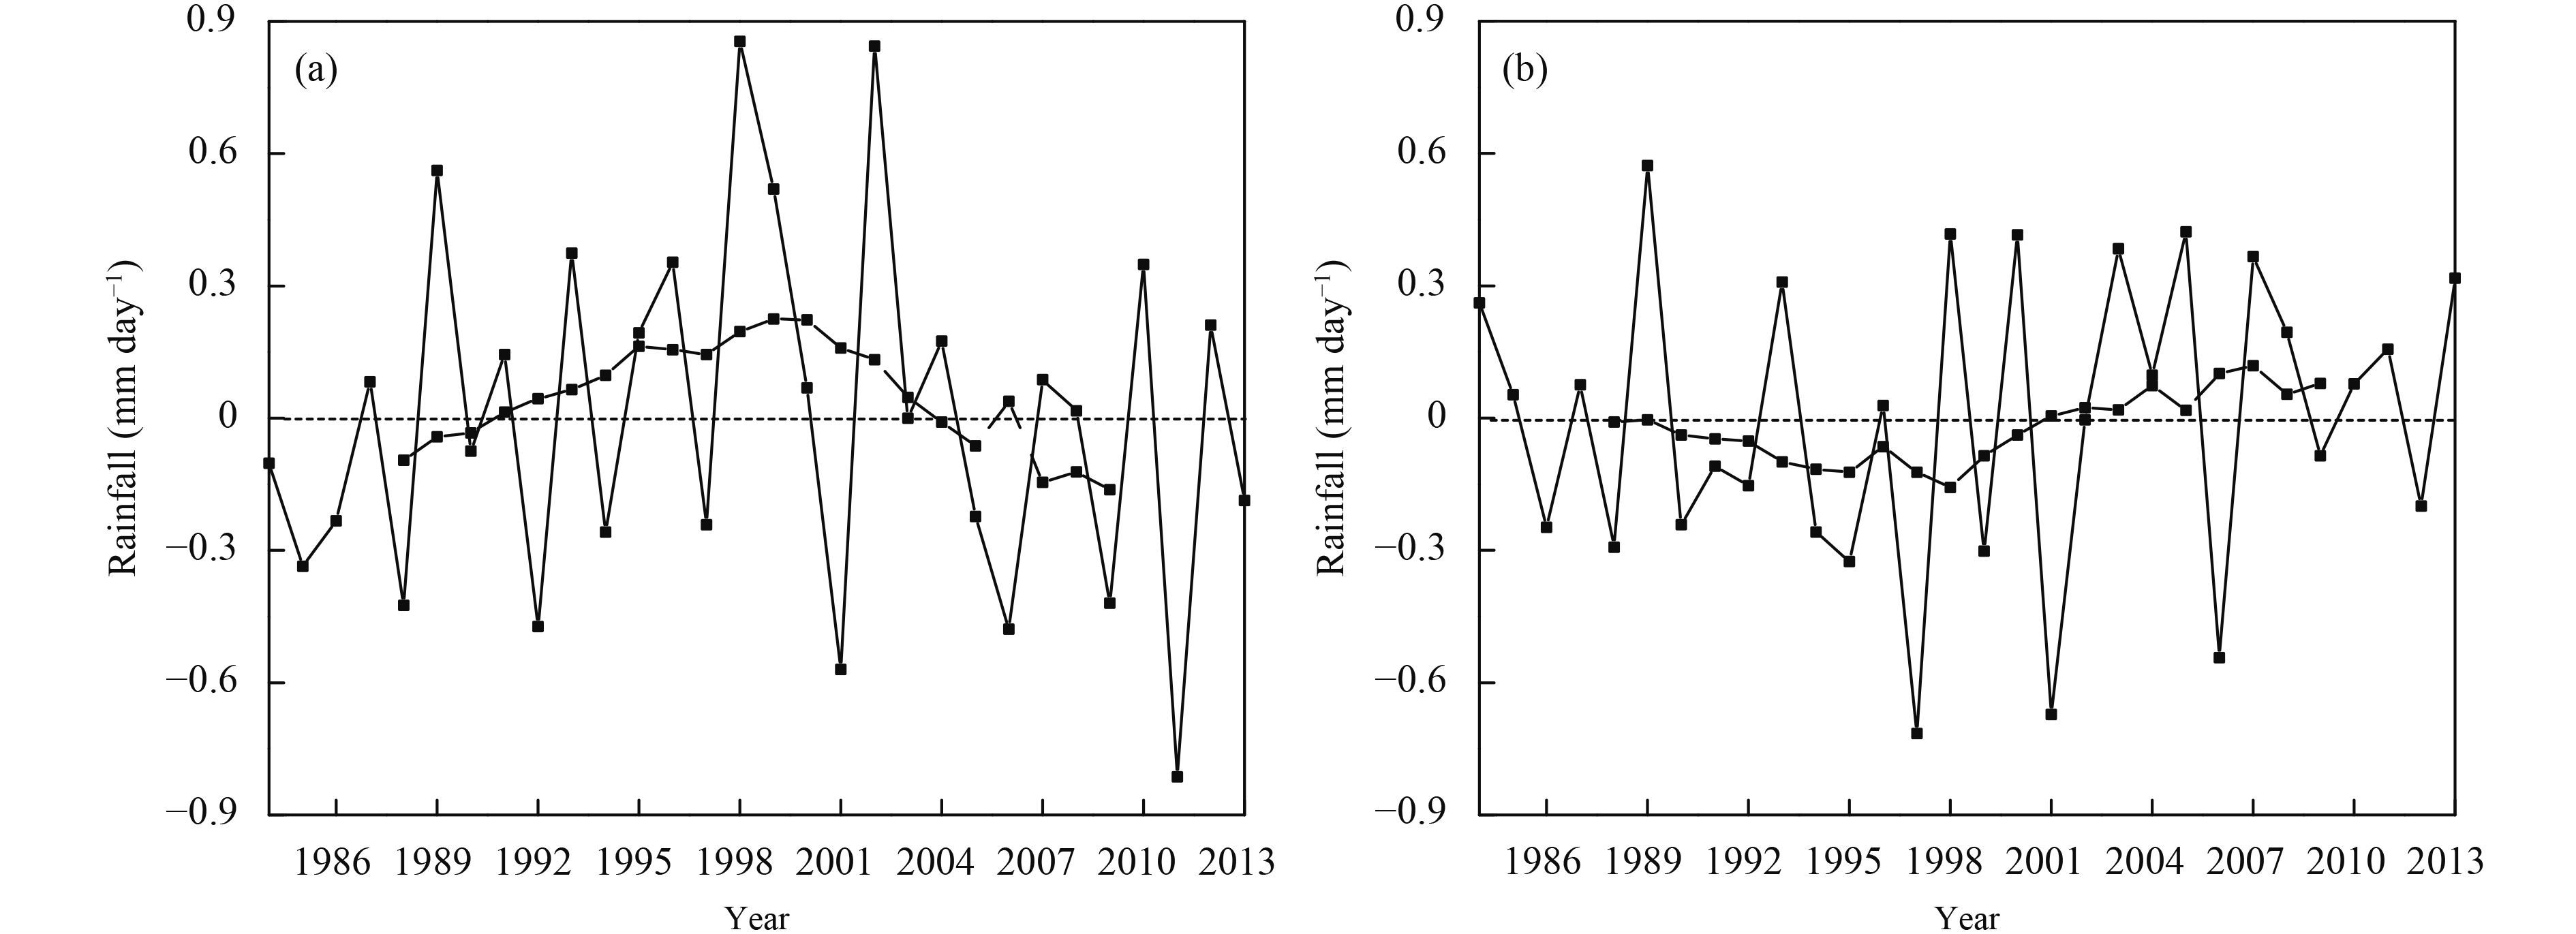
To address this question, the time series of annual-mean precipitation anomalies for the areas to the north and south of the Yangtze River were calculated. Figure 4a shows the time series of the average annual-mean precipitation over the northern side, from which it can be seen that the precipitation enhanced after 1998. The time series for the southern side (Fig. 4b) shows opposite anomalies; the precipitation started to decrease gradually from 2000. It is clear that there was no significant change in the precipitation trend in 2004, both on the northern and southern sides. These results strongly suggest that the patterns of increased precipitation on the northern side and decreased precipitation on the southern side in recent years are therefore not due to the expanded water area, but instead to a spatially homogeneous change in precipitation associated with natural climate change. The turning point in 2004 of the second EOF mode (Fig. 2d) may be due to the different natural variability between the north and south side areas. Hence, the pattern of opposite precipitation variation in the areas on southern and northern sides of TGR may not be influenced by TGD.
|
| Figure 4 Mean annual precipitation (mm day–1) on the (a) north side and (b) south side of the Yangtze River in the area of TGD from 1984 to 2013. The dotted line denotes the 9-yr running mean curve. |
To further investigate the possible impact of TGD on regional precipitation, we focus on the 30-yr daily mean near-surface (10 m) temperature (Tmean; ℃), maximum temperature (Tmax; ℃), minimum temperature (Tmin; ℃), precipitation (mm), relative humidity (%), and surface evaporation (kg m–2). The relative variation from one band to another is studied by using the three spatial bands as depicted in Fig. 1.
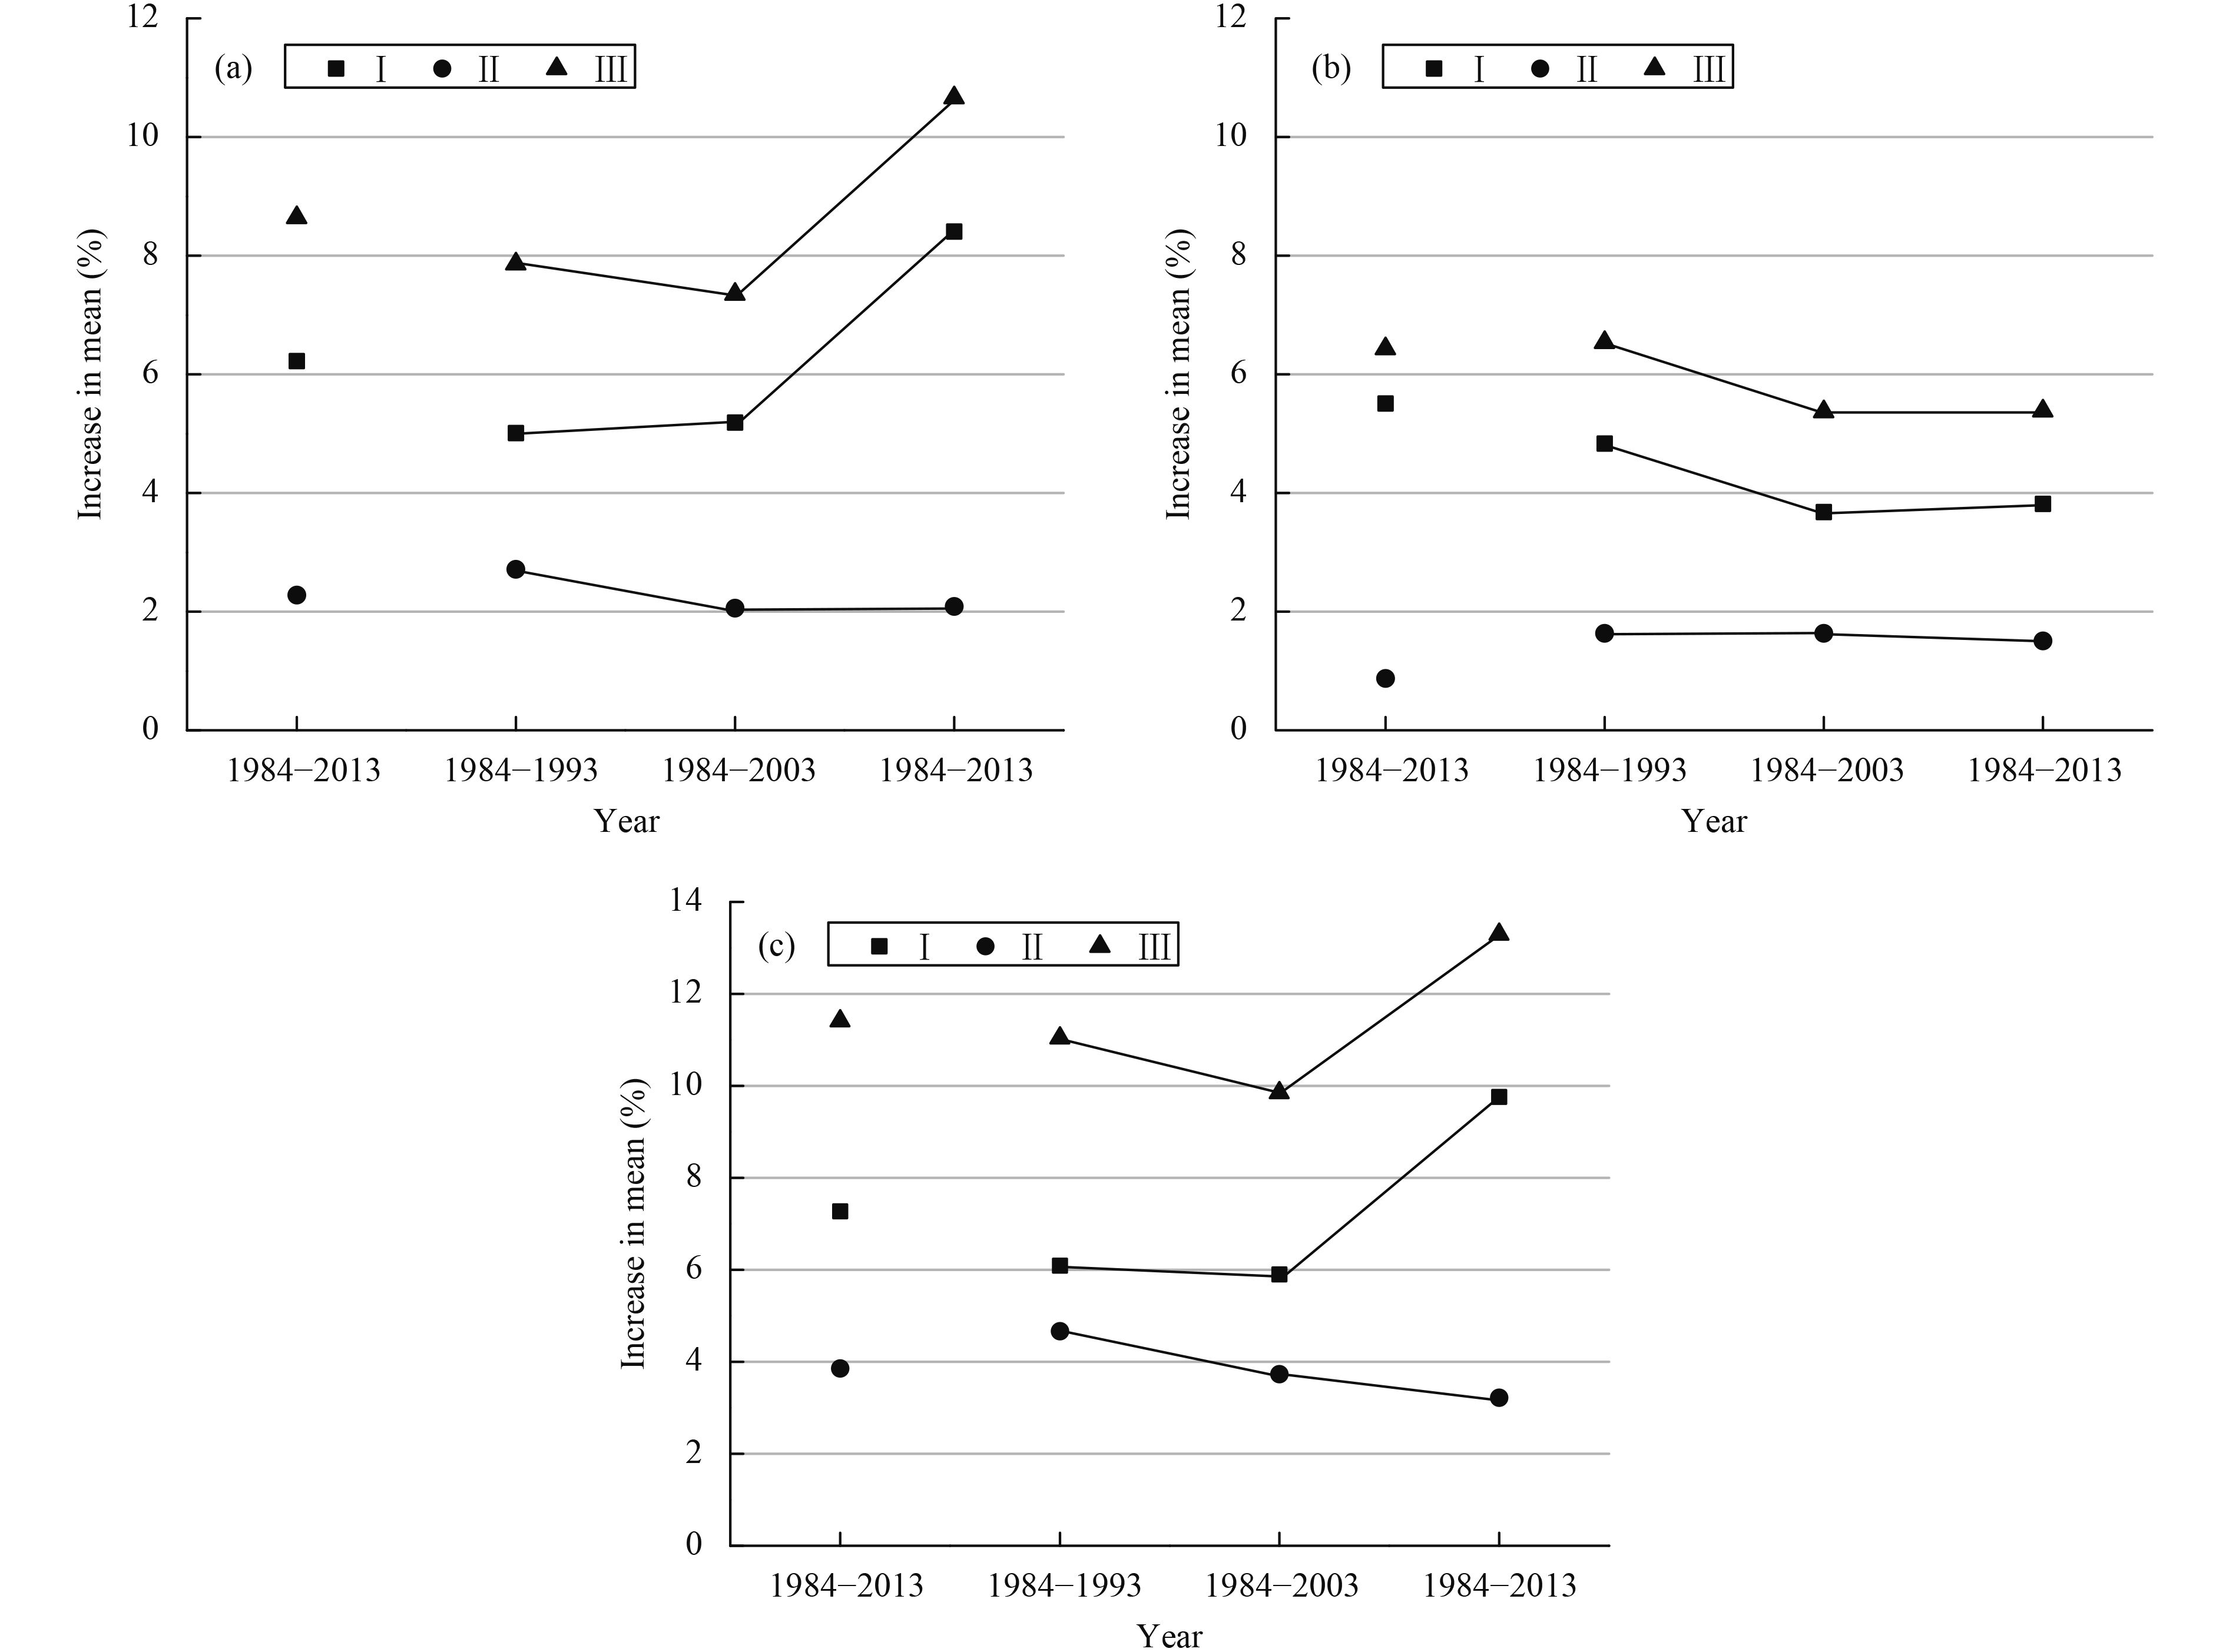
Figure 5 shows the 30-yr spatial gradient for Tmean, Tmax, and Tmin in three scenarios: (1) Scenario Ⅰ: the percentage difference in temperature between the TGR and near-TGR regions,
|
| Figure 5 Spatial gradients of daily temperature (℃), where the y-axis is the percentage increase (%) of the climatological mean from one spatial band to another: (a) temperature, (b) maximum temperature, and (c) minimum temperature for Scenarios Ⅰ, Ⅱ, and Ⅲ. |
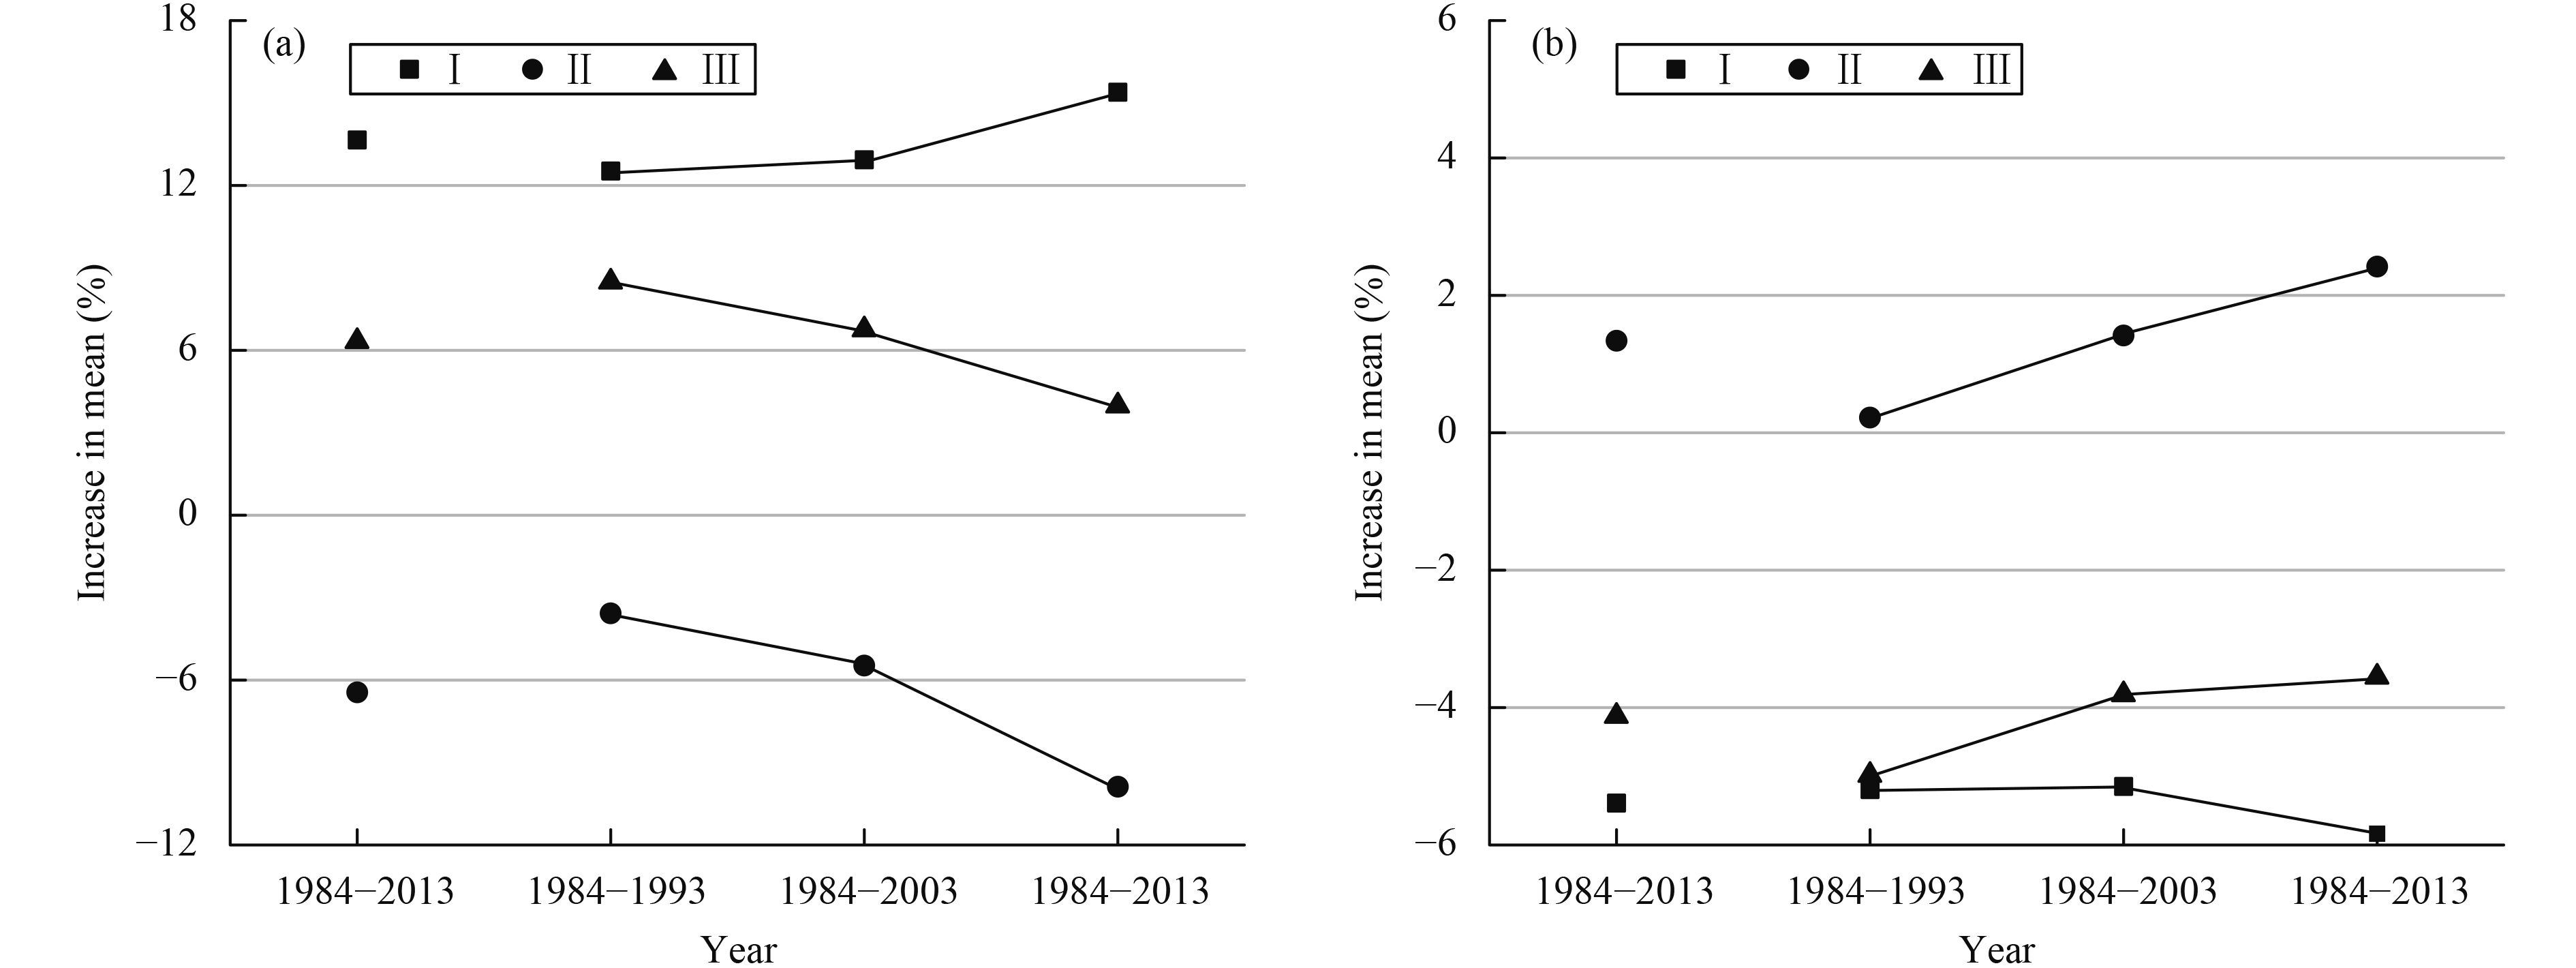
The spatial gradients of the 10-yr mean surface evaporation and relative humidity in the three periods are shown in Fig. 6. The surface evaporation and relative humidity show opposite changes in the past 30 years. The daily mean evaporation gradient between the TGR and near-TGR regions increased continuously; the increases are 0.42% and 2.45% in the two successive 10-yr periods, respectively. However, the daily mean evaporation gradient decreased between the TGD and far-TGR regions; the decreases are –1.74% and –2.77% in the two successive 10-yr periods, respectively. In Fig. 6b, the spatial gradient of relative humidity also demonstrates this point. It is shown that the change in the relative humidity gradient between the TGR and near-TGR regions is small in the pre-TGD period (1984–2003) but it becomes larger in the post-TGD period (2004–13), as does the gradient between the near-TGR and far-TGR regions.
|
| Figure 6 As in Fig. 5, but for (a) surface evaporation (kg m–2) and (b) relative humidity (%). |
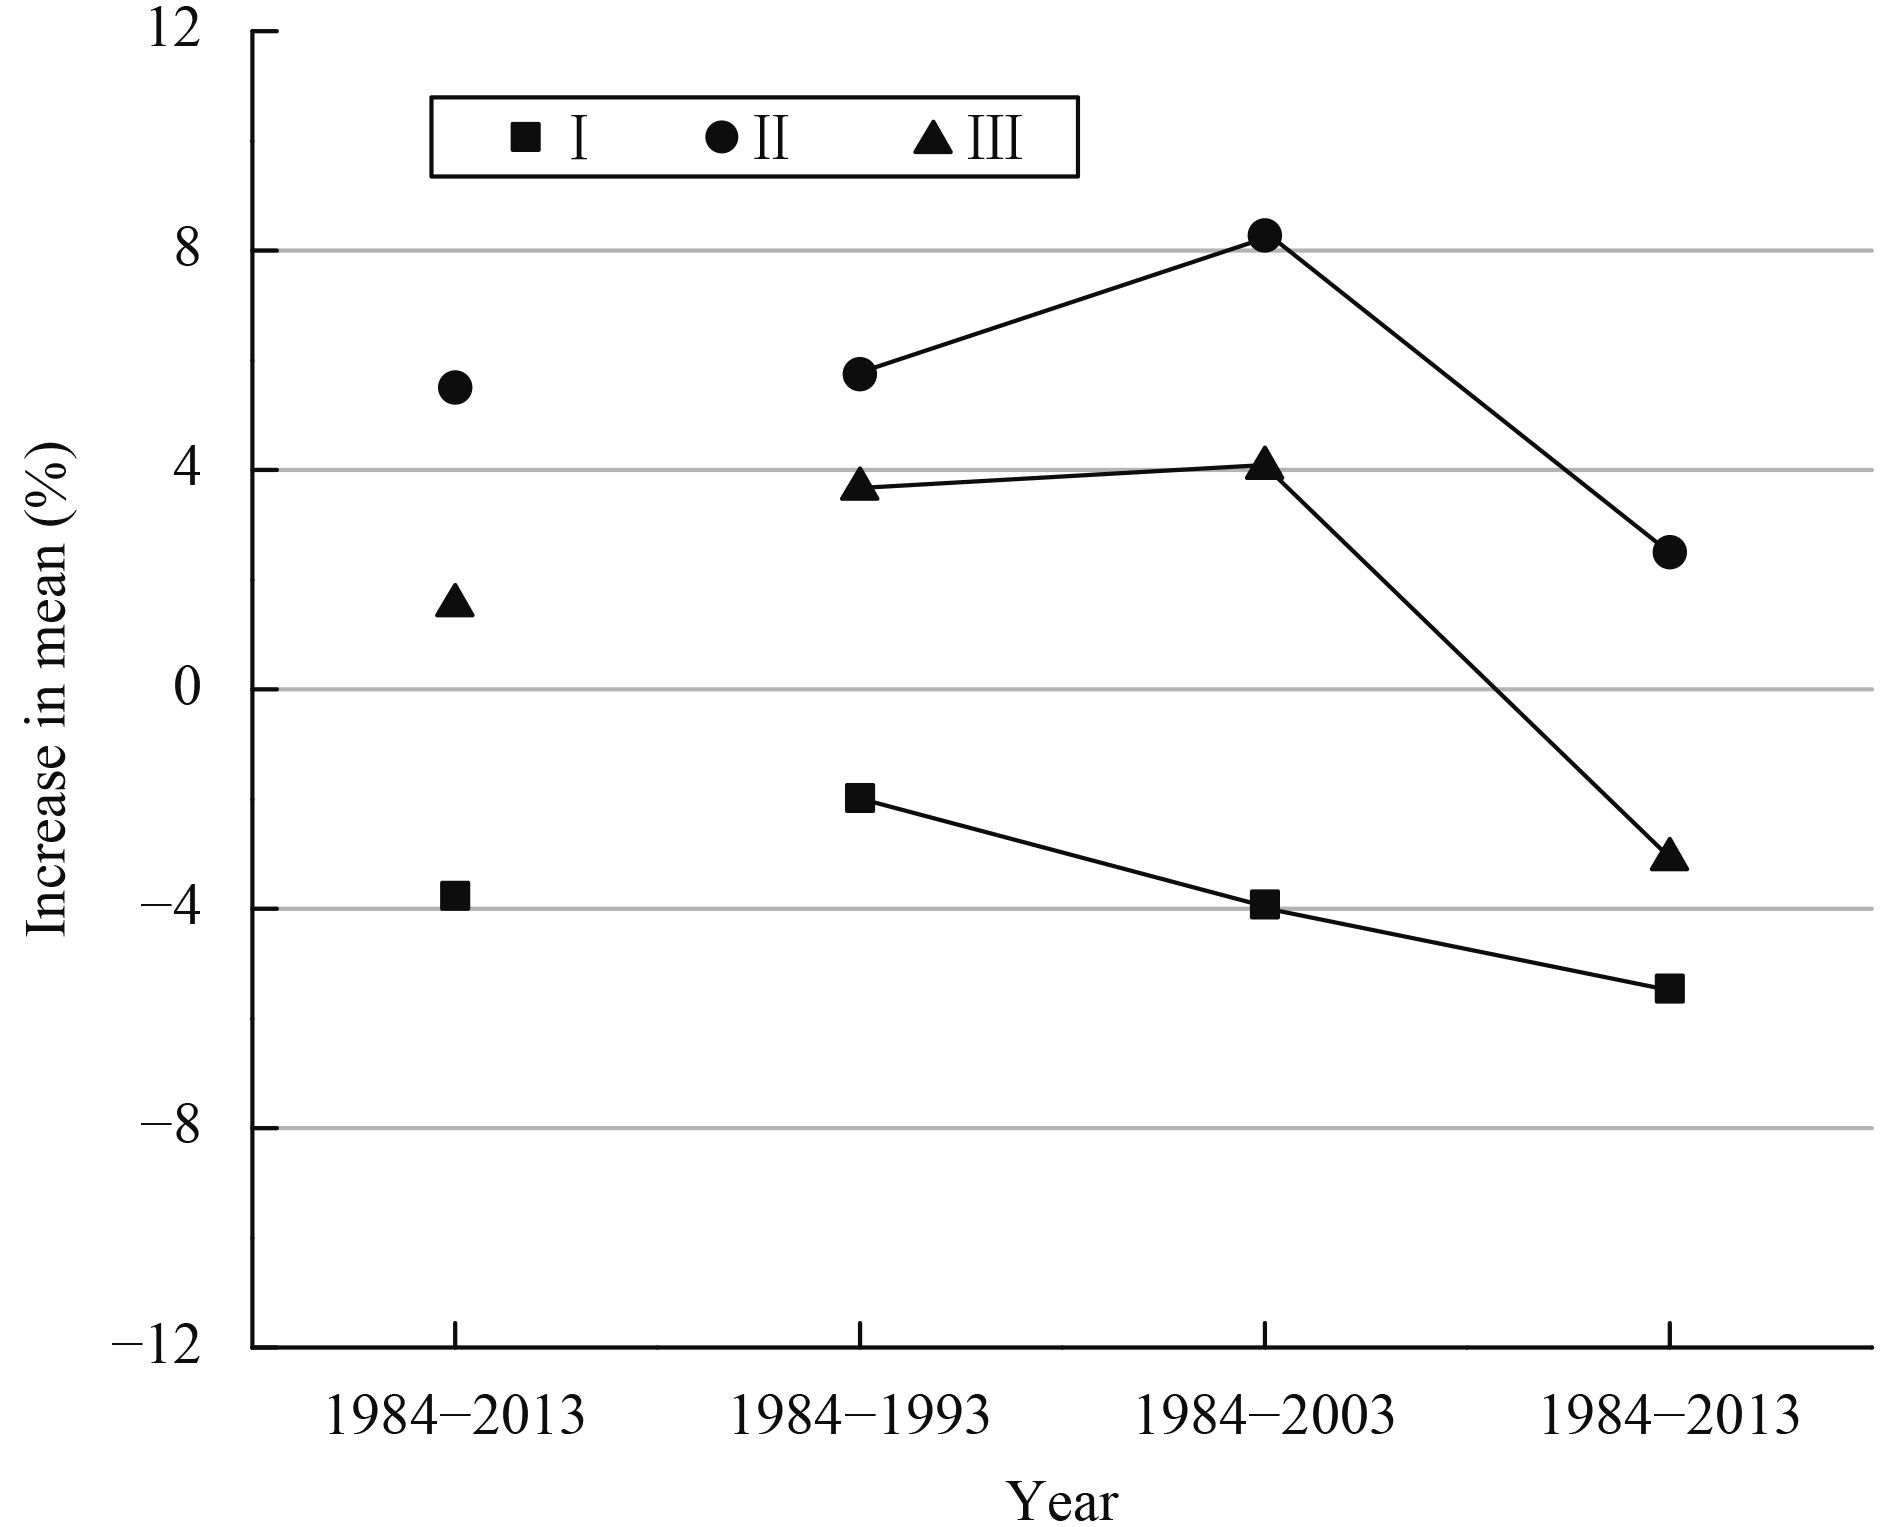
Next, we explored the corresponding influence on precipitation. Figure 7 shows the spatial gradients of the daily total precipitation for the periods 1984–2013, 1984–93, 1994–2003, and 2004–13. Although the spatial gradients of precipitation are opposite in the post-and pre-TGD eras in Scenario Ⅲ, this is caused by the dramatic decrease in the gradient between the TGR and near-TGR regions (Scenario Ⅰ), as well as that between the near-TGR and far-TGR regions (Scenario Ⅱ) in the post-TGD period. Because the impact of the expanded watery area gradually decreased with increasing distance from TGR, a similar trend from the TGR region to the near-TGR region and an opposite trend from the above two regions to the far-TGR region mean that the effect on the precipitation associated with TGD is in the first 100 km (local scale, including the TGR and near-TGR regions).
|
| Figure 7 As in Fig. 5, but for precipitation (mm). |
Following the above findings, we investigated the influence of TGD on the local rainfall using a new time series, which is the difference of the two time series over the following regions: over the TGR region, and the whole vicinity of the TGD area (28°–34°N, 106°–112°E). For the new time series, the impact of natural variation should be reduced because it should be very similar in the above two regions. Figure 8 indicates a small difference in the mean annual precipitation between these two regions, with the difference ranging from –0.4 to 0.4 mm day–1. There are 7 yr when the difference is more than 0.2 mm day–1, among which 4 yr occurred before 2004, with a maximum of 0.35 mm day–1, and 3 yr occurred after 2004, with a maximum of 0.34 mm day–1. Moreover, there is a negative trend in the annual-mean precipitation difference. The slope of the negative trend is –0.13 (30 yr)–1, and it is not statistically significant at the 90% confidence level. Although the negative trend in the precipitation difference can be seen over the 30-yr period, the last decade's mean precipitation anomalies are much weaker than those in the first two decades. This suggests that the water level of TGD increasing by 69 m after 2003 may have had weak impacts on the rainfall amount in its vicinity, which may have slightly reduced precipitation on the local scale.

|
| Figure 8 Time series of the precipitation difference between the TGR region and the whole vicinity of the TGD area (28°–34°N, 106°–112°E). The horizontal lines indicate the average difference in precipitation in the pre-TGD and post-TGD periods, and the dotted line denotes the linear trend. |
In summary, the EOF analysis of annual precipitation anomalies suggests that TGR is located in a transition zone between opposing precipitation variation in the areas north and south of the Yangtze River. In addition, there has been no significant change in precipitation since 2004, both in the north and south. Thus, the increased precipitation on the northern side and decreased precipitation on the southern side since 2004 is probably due to the different natural variability, which is associated with natural climate change. The relative climate variation from one band to another in terms of temperature, humidity, evaporation, and precipitation, in three spatial bands (over TGR, near TGR, and far from TGR) has been investigated. The results indicate that the land-use changes associated with TGD may have weakly impacted the rainfall amount on the local scale, possibly reducing the precipitation over TGR slightly.
The TGD project may influence both the social environment and climate change (Wu et al., 2006). We have tried in this study to investigate the influence of TGD on precipitation, to answer the question as to whether TGD could have modified the pattern and rainfall amounts of precipitation on the local or regional scale. The results provide useful information to the government for flood prevention and mitigation. It should, however, be pointed out that precipitation varies spatially due to the complex topography. The influence of TGD on the regional atmospheric circulations closely related to the precipitation has not been addressed in the present work; further studies using high-resolution numerical simulations are needed.
| Chen, X. Y. , Q. Zhang, D. X. Ye, et al. , 2009: Regional climate change over Three Gorges reservoir area. Resour. Environ. Yangtze Basin, 18, 47-51. (in Chinese) |
| Chen X. Y., Song L. C., Guo Z. F., et al., 2013: Climate change over the Three Gorge reservoir and upper Yangtze with its possible effect. Resour. Environ. Yangtze Basin, 22, 1466–1471. |
| Degu A. M., Hossain F., Niyogi D., et al., 2011: The influence of large dams on surrounding climate and precipitation patterns. Geophys. Res. Lett., 38, L04405. DOI:10.1029/2010GL046482 |
| Li H. Tang, 2014: Local precipitation changes induced by the Three Gorges reservoir based on TRMM observations. Resour. Environ. Yangtze Basin, 23, 617–625. |
| Li W. Zhu, J. J. Dong, 2017: A new mean-extreme vector for the trends of temperature and precipitation over China during 1960–2013. Meteor. Atmos. Phys., 129, 273–282. DOI:10.1007/s00703-016-0464-y |
| Li Y., Gao Y. H., Chen X. Y., et al., 2011: The impact of the land use change associated with the Three Gorges Dam on regional climate change. J. Nanjing Univ. (Nat. Sci.), 47, 330–338. |
| Miller L., N. M. Jin, J. F. Tsang, 2005: Local climate sensitivity of the Three Gorges Dam. Geophys. Res. Lett., 32, L16704. DOI:10.1029/2005GL022821 |
| Ren Q., Zhu Z. W., Hao L. P., et al., 2017: The enhanced relationship between southern China winter rainfall and warm pool ocean heat content. Int. J. Climatol., 37, 409–419. DOI:10.1002/joc.4714 |
| Wu G., L. Zhang, Q. H. Jiang, 2006: Three Gorges Dam affects regional precipitation. Geophys. Res. Lett., 33, L6704. DOI:10.1029/2006GL026780 |
| Xiao C. Yu, C. F. Fu, 2010: Precipitation characteristics in the Three Gorges Dam vicinity. Int. J. Climatol., 30, 2021–2024. DOI:10.1002/joc.1963 |
| Zhang T., H. H. Zhu, C. Zhang, 2004: Numerical modeling of microclimate effects produced by the formation of the Three Gorges reservoir. Resour. Environ. Yangtze Basin, 13, 133–137. |
| Zhu W., Z. Li, T. H. He, 2014: Out-of-phase relationship between boreal spring and summer decadal rainfall changes in southern China. J. Climate, 27, 1083–1099. DOI:10.1175/JCLI-D-13-00180.1 |
 2017, Vol. 31


