The Chinese Meteorological Society
Article Information
- Zengwu WANG, Shiqi YANG, Qiaolin ZENG, Yongqian WANG. 2017.
- Retrieval of Aerosol Optical Depth for Chongqing Using the HJ-1 Satellite Data. 2017.
- J. Meteor. Res., 31(3): 586-596
- http://dx.doi.org/10.1007/s13351-017-6102-x
Article History
- Received June 3, 2016
- in final form November 28, 2016
2. Chongqing Institute of Meteorological Sciences, Chongqing 401147
Aerosol refers to a multiphase system composed of various solid and liquid particles, such as dust, smoke particles, cloud, fog, ice crystals, and gas carriers, suspended in the atmosphere (Chen et al., 2011). Aerosol plays an important role in the research of the terrestrial climatic system. Aerosol directly influences solar radiation at earth’s surface through scattering and absorption, and affects temperature variations in the atmosphere (Haywood and Ramaswamy, 1998). Aerosol also changes the microphysical characteristics of cloud through condensation, thus altering its radiation characteristics and motion (Ramanathan et al., 2001; Kaufman et al., 2005). In addition, aerosol indirectly influences precipitation and surface reflectance (Rotstayn et al., 2001). Therefore, the properties of aerosol should be accurately determined to investigate terrestrial climate. However, various kinds of aerosol exist and rapidly change in space and time. As such, aerosol-related research in climatology remains challenging (King et al., 1999). Considering the importance of aerosol, researchers should obtain high-resolution aerosol data.
Satellite remote sensing detection for atmospheric aerosol provides several advantages, including wide-range monitoring, automatic data acquisition, and long-term continuity of data. This method can provide detailed information for aerosol research and can help researchers understand the changes in aerosol conditions with time. This method can also be used to conduct micro-scale analyses of aerosol pollution sources, dispersion, and changes in pollutant density. Satellite remote sensing inversion of aerosol optical depth (AOD) can be divided into several categories on the basis of different physical processes and data sources: single-channel algorithm, multi-channel algorithm, multi-angle and multi-channel algorithm, dark target method, structural function method, and polarization method. This study employed a dark target method for AOD inversion, in combination with the deep blue algorithm.
On the basis of the AOD inversion in the air above land, Kaufman and Sendra (1988) investigated the surface reflectance of the first and third channels of the Moderate Resolution Imaging Spectroradiometer (MODIS) and found that this parameter is in good linear relation with the apparent reflectance of the seventh channel in dense vegetation areas and dark soil areas. Furthermore, observation near the infrared channel is unaffected by aerosol. Thus, researchers proposed a dark pixel method that can be used to implement AOD inversion in the air above dense vegetation coverage areas. However, the applicability of this method in regions with high surface reflectance is poor (De Leeuw et al., 2015).
To solve the problem of AOD inversion in the air above a bright ground surface, Hsu et al. (2004) discovered that two bands of red (0.66 μm) and blue (0.47 μm) are nonlinearly related to the middle-infrared band in the bright surface regions. The distribution function of ground bidirectional reflectance is the weakest in desert and semi-desert regions and the scattering and absorption of particles are the smallest, as obtained by the analog of a radiation transmission model. Therefore, the deep blue algorithm is proposed on the basis of the dark pixel method, which is used to perform AOD inversion by considering the apparent reflectance of deep blue band satellite observation. Using the deep blue algorithm, Hsu et al. (2006) applied Sea-Viewing Wide Field-of-View Sensor (SeaWiFS) data to establish a surface reflectance database and successfully inverted the AOD in the arid and semi-arid regions of the Sahara Desert and Arabia.
Considering that China successfully launched its environment and disaster monitoring mini satellite (HJ-1A/B) in 2008, Wang et al. (2009a, b) improved the dark pixel method and utilized the environment satellite data to invert AOD in Beijing, Tianjin, and Tangshan. The result was quite similar to the ground-based observation. However, the inversion at AOD less than 0.2 was notably different from the MODIS product. Analyzing the characteristics of the HJ-1 CCD (Charge Coupled Device) camera (Sun et al., 2006), Xu et al. (2013) proposed a multi-band, multi-day, and multi-sensor method for the inversion of high spatial resolution AOD in the air above Chaoyang District in Beijing. The result was well correlated with that of a sun photometer, but the accuracy of the proposed method was lower than that of MODIS inversion. On the basis of the deep blue algorithm, Wang et al. (2012a) utilized a MODIS surface reflectance product combined with HJ-1 satellite data to conduct AOD inversion. The inversion result showed the deep blue algorithm to be highly accurate at AOD greater than 0.5. Zhang et al. (2013) used HJ-1 CCD blue and green bands to invert AOD in Beijing by assuming that surface reflectance remains unchanged within a short period. The correlation coefficient of the result with that obtained from a sun photometer was 0.84. Fang et al. (2013) proposed an AOD inversion algorithm for urban areas through the extraction of pure pixels. This method has been applied to the CCD camera data of an environment satellite. The correlation coefficient of the inversion result with the ground observation of global Aerosol Robotic Network (AERONET) reached 0.83.
With regard to spatial resolution, the maximum resolution of AOD products obtained so far is only 3 km. Data are also insufficient and thus unsuitable for refined inversion within a small area. Nevertheless, the maximum resolution of the original data used for inversion is 250 m. Furthermore, the HJ satellite is a new type of satellite first used by China to monitor environmental features and disasters, with a spatial resolution of as high as 30 m. HJ-1 has a revisiting period of 4 days. The acquisition time of the HJ-1A/B satellite is only approximately half an hour different from the MODIS data time. As an important economic development center in Southwest China, Chongqing is in a unique geographical location and surrounded by mountains and hills. Hence, the aerosol distribution conditions in this area of complex landscapes should be investigated. As mentioned earlier, the dark pixel algorithm has its advantages and weaknesses, so does the deep blue algorithm. The aim of our study was to combine the two algorithms for the megacity Chongqing and to invert the aerosol optical thickness of Chongqing based on the Chinese high-resolution HJ-1A/B data and the MODIS data.
Following this introduction, we begin by outlining the research regions and data used in this study. Second, we derive the dark pixel and deep blue algorithms, and present the improvements made to these algorithms. Third, the AOD inversion results obtained are analyzed and compared with the AOD product of MODIS and the data from some ground environment monitoring stations. Finally, conclusions and further discussion on the algorithms are given.
2 Data and domainThe HJ-1 satellite was successfully launched on 6 September 2008. It is dedicated to environment and disaster monitoring and forecasting. It is composed of two optical satellites (HJ-1A and HJ-1B) and a radar satellite (HJ-1C). HJ-1A carries a CCD camera and a hyper spectrometer imager, and HJ-1B carries a CCD camera and an infrared sensor (IRS). The spatial resolution of the CCD camera is 30 m. The camera is set with three visible-light bands (430–520, 520–600, and 630–690 nm), and a visible-light-near-infrared channel (0.76–0.90 nm). Its repeated observation period to the ground is two days. The spatial resolution of the High Spectrum Imager (HSI) installed on the HJ-1A satellite is 100 m. The spatial resolution of the near-infrared, short-wave-infrared, and middle-infrared bands of the IRS installed on the HJ-1B satellite is 150 m, and the far-infrared band is 300 m. The revisiting period of HSI and IRS to observation on the ground is four days. HJ-1 is a new civilian satellite of China, since China’s launch of a meteorological satellite, an oceanographic satellite, and a land resource satellite. HJ-1 is important in the development and application of environmental remote sensing and monitoring technology in China.
The study region covers the Chongqing City in Southwest China, which lies in the upper reaches of the Yangtze River. This region is the transition zone between the first and second terrain step east of the Sichuan basin and spans the area of 28°10′–32°13′N, 105°11′–110°11′E. Chongqing is the economic, technological, educational, and cultural center of Southwest China. The city has the largest land area in China and is a major region of development. Given its complex and varied topography and undulating terrain, the city is famously referred to as the “Mountain City.” Its topographical features vary in configuration, and it is mainly composed of mountains and hills. Chongqing also has a dense network of rivers and streams. Statistical data show that the city has 374 rivers and streams in total, and the drainage area is larger than 5050 km2. The three major rivers that flow through Chongqing are the Yangtze River, Jialing River, and Wujiang River.
Chongqing is situated in the typical hot and humid monsoon climate in central Asia, and the occurrence of cold waves in winter is reduced due to the presence of the Qinling Mountains. Because of the topography, the wind velocity is low, the humidity of the air is high, and it is difficult for pollutants near the ground to disperse. The population of Chongqing is dense and its frequency of “cumulative” air pollution created in autumn and winter is high. Given the unique geography (both human and physical) of Chongqing, there is a tendency for pollutants to persist, and thus causing haze. As a result, Chongqing is one of China’s most seriously air-polluted cities. Aerosol is one of the key factors causing air pollution. Research on aerosol will benefit the analysis of air quality and understanding of its variation in Chongqing in real time. Such research is also significant for control and mitigation of air pollution in Chongqing.
3 AOD inversion principleThe land surface is assumed to be a Lambert reflector and the atmosphere is assumed to be on an equal level. Accordingly, the apparent reflectance at the top of the atmosphere received by the satellite can be expressed as follows:
| $\begin{align}{\rho _{\rm TOP}}\!\left( {{\mu _{\rm s}},{\mu _{\rm v} },ϕ } \right) & = {\rho _0}\!\left( {{\mu _{\rm s}},{\mu _{\rm v} },ϕ } \right) \\ & +\frac{{T\!\left( {{\mu _{\rm s}}} \right){\rho _0}\!\left( {{\mu _{\rm s}},{\mu _{\rm v} },ϕ } \right)T\!\left( {{\mu _{\rm v} }} \right)}}{{1 - {\rho _{\rm s}}\!\left( {{\mu _{\rm s}},{\mu _{\rm v} },ϕ } \right)S}}.\end{align}$ | (1) |
In this equation, μs = cosθs and μv = cosθv. The parameters θs and θv represent the solar zenith angle and sensor observation angle, respectively; ϕ is the azimuth angle between the diffuse radiation and solar rays in the observation direction; ρ0(μs, μv, ϕ) is the equivalent reflectance of the atmosphere path radiation; S is the hemispherical reflectance of the atmospheric lower boundary. The optical thickness of atmospheric aerosol τa and aerosol scattering phase function P are related to the single scattering albedo; T is the atmospheric transmittance; and the parameters ρ0, S, ρs, T(μs), and T(μv) are unknown quantities. Two key issues must be solved if aerosol parameters are to be calculated from ρ0: one is to determine the atmospheric aerosol model represented by the parameters ρ0, S, and T(μs)·T(μv); and the other is how to eliminate the effect of ground surface reflectance; that is, atmosphere-land surface decoupling with ρs. The atmospheric parameters ρ0, S, and T(μs)·T(μv) can be obtained through the lookup table in the Second Simulation of the Satellite Signal in the Solar Spectrum (6S) model (Vermote et al., 1997). The key issue is how to eliminate the contribution of the ground surface to the atmosphere through an effective method.
The dark target method can be adopted to eliminate the contribution of ground surface noise. With regard to MODIS data, the middle-infrared band (2.1 μm) of the dense vegetation coverage zones with low ground surface reflectance is in good linear relation with the ground surface reflectance of the blue band (0.47 μm) and red band (0.66 μm). Compared with the visible-light band, the effect of aerosol of the middle-infrared band is negligible. Thus, the ground surface reflectance of the red and blue bands can be obtained from the apparent reflectance of the middle-infrared band. Then, the atmospheric parameters S, ρ0, and T can be obtained for AOD inversion by eliminating the contribution of ground surface reflectance from the apparent reflectance. The HJ satellite sensor only has red, green, blue, and near-infrared bands; hence, it cannot identify the dark pixels through the middle-infrared band. However, the red and blue bands of the HJ satellite correspond to the MODIS bands. A study by Wang et al. (2012b) showed that the red and blue bands of CCD data have linear relations with the ground surface reflectance. The respective lookup tables of the red and blue bands are built according to the 6S model to obtain ρ0, S, and T(μs)·T(μv) under different aerosol optical thicknesses. These factors are brought into Eq. (1) to calculate the ratio of ground surface reflectance of the red and blue bands. The AOD of pixels can be obtained by checking the nearest linear relation with the measured values through the lookup table.
Kaufman et al. (1988) were the earliest to set appropriate threshold values for determining dark pixels through calculating the pixel normalized differential vegetation index (NDVI). However, the NDVI has its weaknesses. In particular, in areas covered by high vegetation, the NDVI shows a saturation state and only slightly eliminates the interference of the atmospheric composition. Thus, the NDVI has difficulty in identifying the pixel types correctly. To solve the problems related to the vegetation index, Liu et al. (1995) proposed that an enhanced vegetation index (EVI) should be added to construct a feedback system that can simultaneously correct the effects of soil and atmosphere. Zhang et al. (2011) recommended the addition of vegetation growth inversion during the construction of the EVI regarding the settings of the CCD camera bands to enhance the radiation difference between vegetation and the soil background. As a result, the atmospheric interference will be eliminated. In the present study, the three calculation methods are used to determine dark pixels for comparing inversion results.
With regard to non-dark pixels, the surface reflectance of red and blue bands normally cannot satisfy the linear relation. Therefore, adopting the dark pixel method for AOD inversion is impossible (Shi et al., 2012). Hsu et al. (2004) emphasized through experiments that the atmospheric reflectance in the blue-light band is strong and the surface reflectance is weak. Sayer et al. (2013) evaluated the accuracy of MODIS Collection 6 “Deep Blue” aerosol data. Therefore, the method of constructing a blue-light band surface reflectance database can be adopted to realize atmosphere-land surface decoupling. As derived from the comparison of the surface reflectance based on HJ-1 CCD data inversion with the MOD09 product by Li et al. (2011), the correlation coefficients of the red and blue bands are 0.9 and 0.85, respectively. Therefore, the MODIS surface reflectance product is adopted in the present study to construct the blue-band surface reflectance database. However, the two sensors have different spectral response parameters. Based on the spectral measurement conducted by Wang et al. (2012b) in Beijing and Guangzhou, with a full band field spectrometer, correction is made through the linear relation between CCD and MODIS obtained by the response function of the blue band.
As obtained from the analysis of the basic principle of the above-mentioned dark pixel and deep blue algorithms, both methods are based on the theory of the atmospheric radiation transmission equation. The lookup tables of atmospheric parameters, apparent reflectance, and aerosol optical thickness are constructed according to the 6S model. The difference lies in the different methods of eliminating the effects of the ground surface. In particular, the dark pixel method has a good inversion effect in dense vegetation coverage zones and the deep blue algorithm mainly aims at the bright ground surface zones. Hence, in this study, the characteristics of the two inversion methods are combined. The dense vegetation areas in the research zone on the remote sensing images are interpreted by using Google earth visual observation. The dark pixel EVI threshold value is determined as 0.3 and the value smaller than 0.3 is regarded as the bright ground surface. With regard to the bright ground surface, the deep blue algorithm is indirectly adopted. In particular, the atmospheric conditions within the range of 1 km are assumed to remain unchanged first. Then, buffer zone analysis in the 3 pixels × 3 pixels zone near the dark pixel is conducted to obtain the mean value as the non-dark pixel AOD value. Finally, the deep blue algorithm is adopted for inversion.
4 Inversion result and analysisLess cloud or cloud-free images of Chongqing in the four seasons were selected to avoid the effect of weather. Considering the complex mountainous landform of Chongqing, the images are re-sampled into a resolution of 150 m. This procedure will help increase the signal-to-noise ratio and reduce the error of AOD inversion. Radiometric calibration is conducted through the metadata carried by the environment satellite, and the NDVI and EVI are calculated. Dark pixels are determined and the results are compared. The aerosols are inverted according to the aerosol models set in the 6S model, and then comparative analysis is conducted. In this study, the aerosol types of Chongqing are completely analyzed, the major urban areas and the rural areas are inverted separately, the inversion results are compared, and the correlation between the AOD of inversion and PM10 is analyzed.
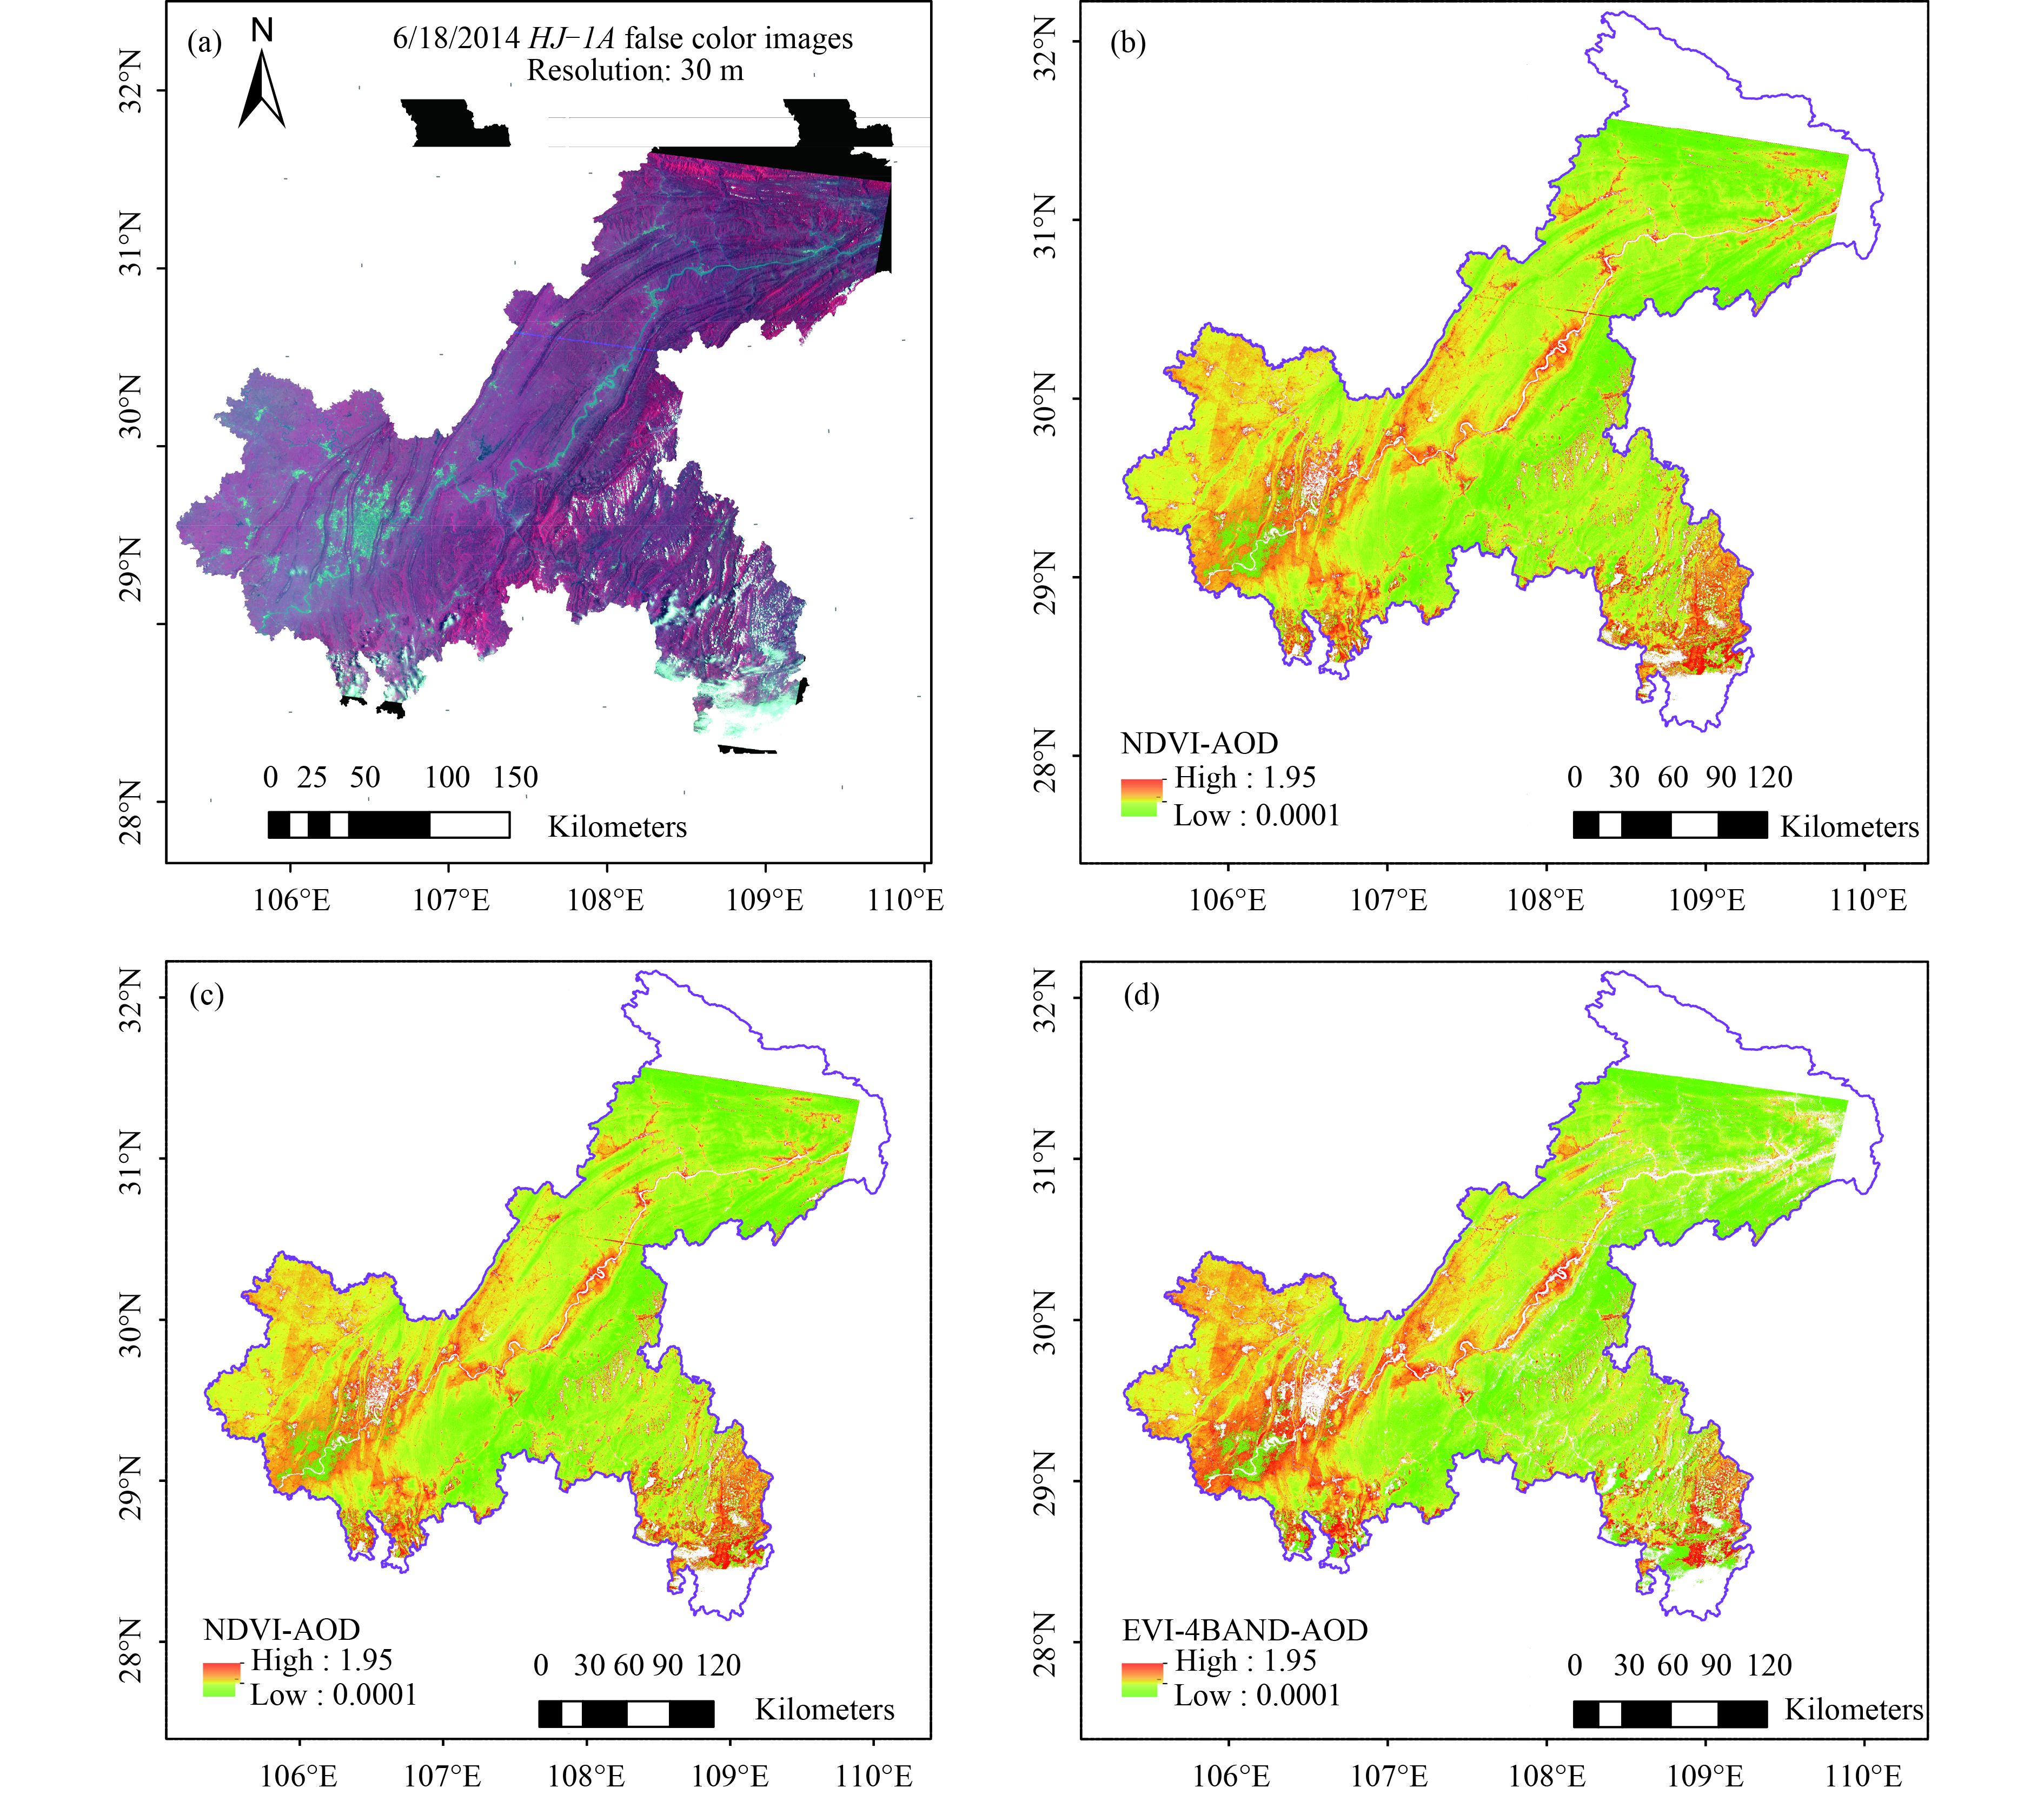
4.1 Detection of different dark pixels and comparison of inversion resultsThe data of clear weather in the Chongqing region on 18 June 2014 are used for inversion, and three different vegetation index methods are adopted to determine dark pixels. The AOD results based on the dark pixel method are indicated in Fig. 1. A comparison in the figures shows that, as the NDVI is used to determine dark pixels, calculating partial dense vegetation pixels is impossible when a saturation state has been reached. By contrast, the EVI inversion result is comparatively good. In the major urban areas of Chongqing, the difference in the inversion results obtained by using the NDVI and EVI is quite large. The MOD04 aerosol data product provided by MODIS, which cannot be obtained by dark pixels, is used for comparative analysis. The scatter plot distribution of this product is indicated in Fig. 2. Given that the dark pixel method is unsuitable for AOD inversion in urban areas, the scatter points are concentrated in the vegetation coverage zones in the rural areas. The lowest NDVI correlation coefficient is 0.567 and the RMSE is 0.09. The correlation of the EVI result is better than that of the NDVI calculated dark pixel and the correlation coefficient is 0.647. The correlation of the EVI added with the green-light band is the highest and the correlation coefficient is 0.652. Therefore, the dark pixels in the study region are obtained by the addition of the green-light band to the EVI for determination.
|
| Figure 1 AOD (aerosol optical depth) dark pixel inversion results on 18 June 2014 by using the following methods: (a) false color image; (b) NDVI; (c) EVI (enhanced vegetation index); and (d) EVI added with green-light band. |

|
| Figure 2 Scatter plots comparing three methods for determining dark pixel AOD (aerosol optical depth) inversion on 18 June 2014 with the MOD04 MODIS product: (a) NDVI; (b) EVI (enhanced vegetation index); and (c) EVI added with green-light band. |
According to the above-mentioned AOD inversion principle, inversion is conducted for the data of 18 June 2014 by use of the dark pixel method, the deep blue algorithm, the combination of these two methods, and the combination of the two methods after the buffer zone processing. The results are indicated in Figs. 1c, 3. Comparing Fig. 1c with Fig. 3a finds that the AOD inversion result of the deep blue algorithm in the entire zone is generally higher than that of the dark pixel method, with the highest value being 1.2. The major urban areas of Chongqing are mainly based on the bright surface features, and the deep blue algorithm can better invert the AOD in the atmosphere of this region. Compared with the dark pixel method, the applicability of the deep blue algorithm is stronger and the scope is broader.

|
| Figure 3 AOD (aerosol optical depth) inversion results on 18 June 2014 from the three methods: (a) deep blue algorithm; (b) dark pixel and deep blue algorithm; and (c) dark pixel, buffer zone, and deep blue algorithm. |
Analysis of the deep blue algorithm result and the MOD04 scatter plots (Fig. 4a) shows that the correlation between them (correlation coefficient of 0.661) is higher than the correlation between the dark pixel algorithm and MOD04 (0.652). However, the absolute deviation and relative deviation values between the deep blue algorithm result and MOD04 are quite large and the inversion result is poor. Figures 4b and 4c show that the deep blue algorithm combined with the dark pixel method can compensate well for the weakness of the dark pixel method and can improve the high range of the deep blue algorithm inversion result. Comparison of its inversion result with MOD04 (see Figs. 4b, c) shows that the correlation coefficient is higher than the single adoption of the deep blue algorithm or the dark pixel method. The value of pixel reflectance result to the bright ground surface is also high. Thus, the dark pixel and buffer zone after processing are combined with the inversion result of the deep blue algorithm, as shown in Fig. 3c. This method uses the buffer zone to calculate partial non-dark pixels. The data of this part reduce the deviation caused by the regional matching of the results of the two different algorithms and increase the inversion accuracy. The correlation coefficient of its result compared with MOD04 is 0.672. The correlation of this algorithm is the best among those of the four algorithms.

|
| Figure 4 Scatter plots comparing the AOD inversion results of three methods on 18 June 2014 with the MOD04 MODIS product: (a) deep blue algorithm; (b) dark pixel and deep blue algorithm; and (c) dark pixel, buffer zone, and deep blue algorithm. |
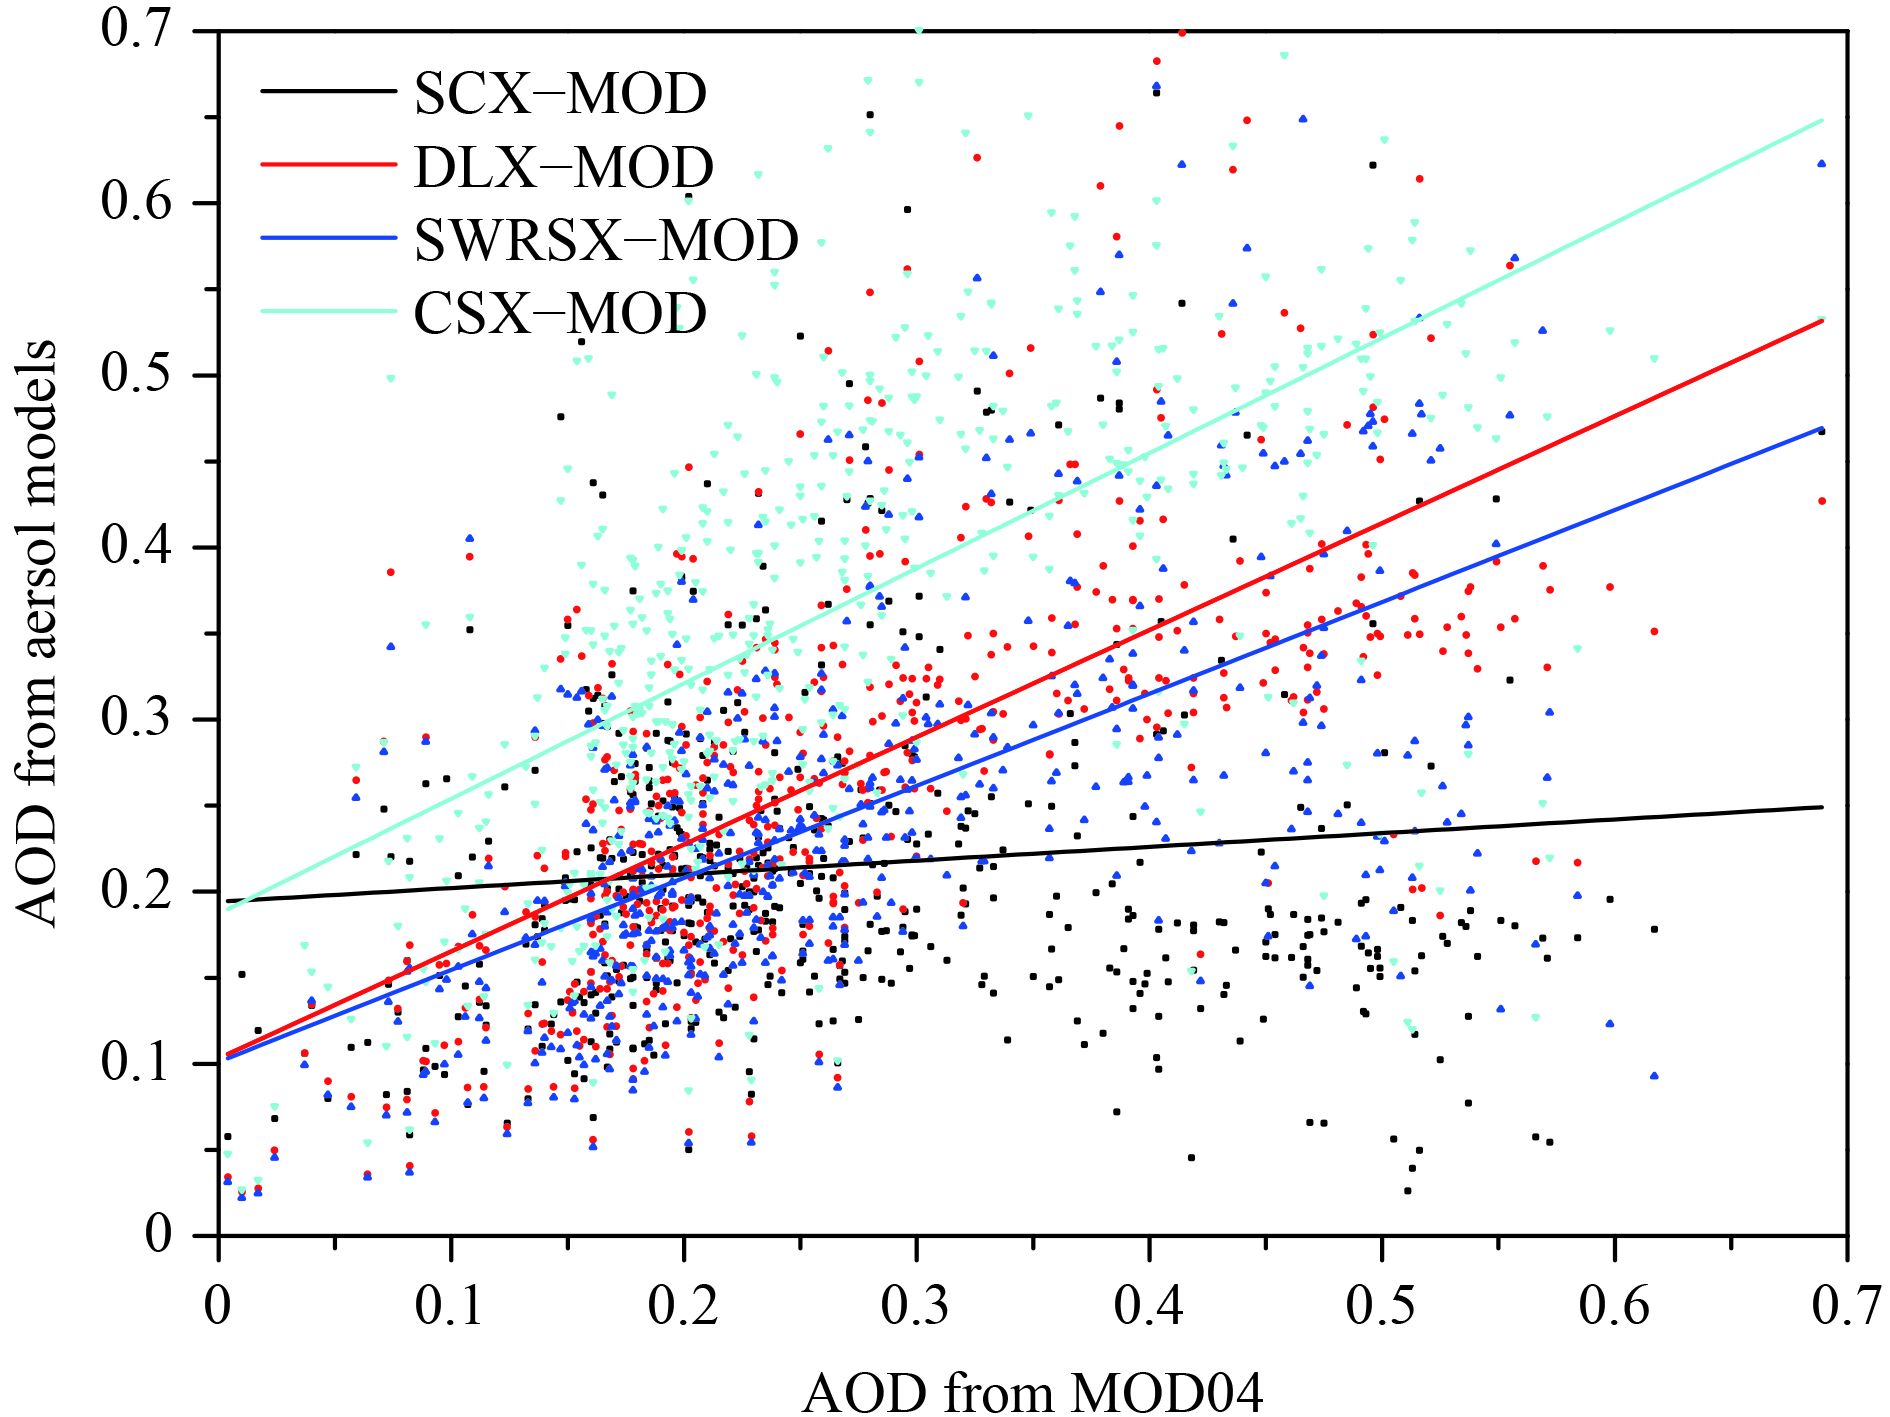
Obtaining aerosol models in the study area in real time is quite difficult. Thus, a radiation transfer model is adopted in the 6S model to configure standard aerosol types during the construction of lookup tables. The lookup tables for AOD inversion are also constructed including the results of sand-type, biomass-burning-type, mainland-type, and city-type aerosol models. A scatter plot comparing the AOD inversion of the four different aerosol types with the MOD04 product is presented in Fig. 5. The statistical results are listed in Table 1. The minimum correlation of the sand-type aerosol model is 0.254. The absolute and relative deviations are large, with values of 0.119 and 48.9%, respectively. The correlation of the biomass-burning-type aerosol model is 0.647, and the absolute and relative deviations are 0.076 and 33.3%, respectively. The correlation coefficients of the mainland- and city-type aerosol models are quite high, with values of 0.672 and 0.669, respectively. The relative (58%) and absolute (0.127) deviations of the city-type aerosol model are large and the standard deviation is 0.008. The inversion of 533 pixels of the MOD04 product in the entire region of Chongqing is used to draw the distribution diagrams/scatter plots of the inversion results of the four models versus the MOD04 product (Fig. 5). Accordingly, the inversion results of the four aerosol models can be compared.
|
| Figure 5 Scatter plot comparing the AOD (aerosol optical depth) inversion results from four aerosol models on 18 June 2014 with the MOD04 MODIS product. |
| Aerosol model type | Correlation coefficient | Absolute deviation | Relative deviation | Standard deviation |
| Sand (SCX) | 0.254 | 0.119 | 48.9% | 0.004 |
| Biomass burning (SWRSX) | 0.647 | 0.076 | 33.3% | 0.005 |
| Mainland (DLX) | 0.672 | 0.077 | 30.0% | 0.003 |
| City (CSX) | 0.669 | 0.127 | 58.0% | 0.008 |
As obtained from the diagrams, the AOD inversion of the sand-type aerosol model (black spots) is quite low and the mean value is approximately 0.2, which is considerably different from the MOD04 value. The trend line is parallel to the horizontal coordinate. The partial area value of the inversion AOD of the biomass-burning-type aerosol model (blue spots) does not differ greatly from the MOD04 value. However, a part of the AOD is considerably different from MOD04 and the correlation coefficient is lower than those of the mainland- and city-type aerosol models. By comparing the AOD inversion of the mainland-type aerosol model (red spots) and the AOD inversion of the city-type aerosol model (green spots), it is found that the overall AOD inversion of the city-type model is higher but the effect is relatively poor. As shown in Table 1, the absolute deviation, relative deviation, and standard deviation of the inversion results of the mainland-type aerosol model are lower than those of the inversion models of the city-type aerosol model. Based on the above analysis, use of the mainland-type aerosol model to construct lookup tables for the inversion of AOD in Chongqing can achieve better results.
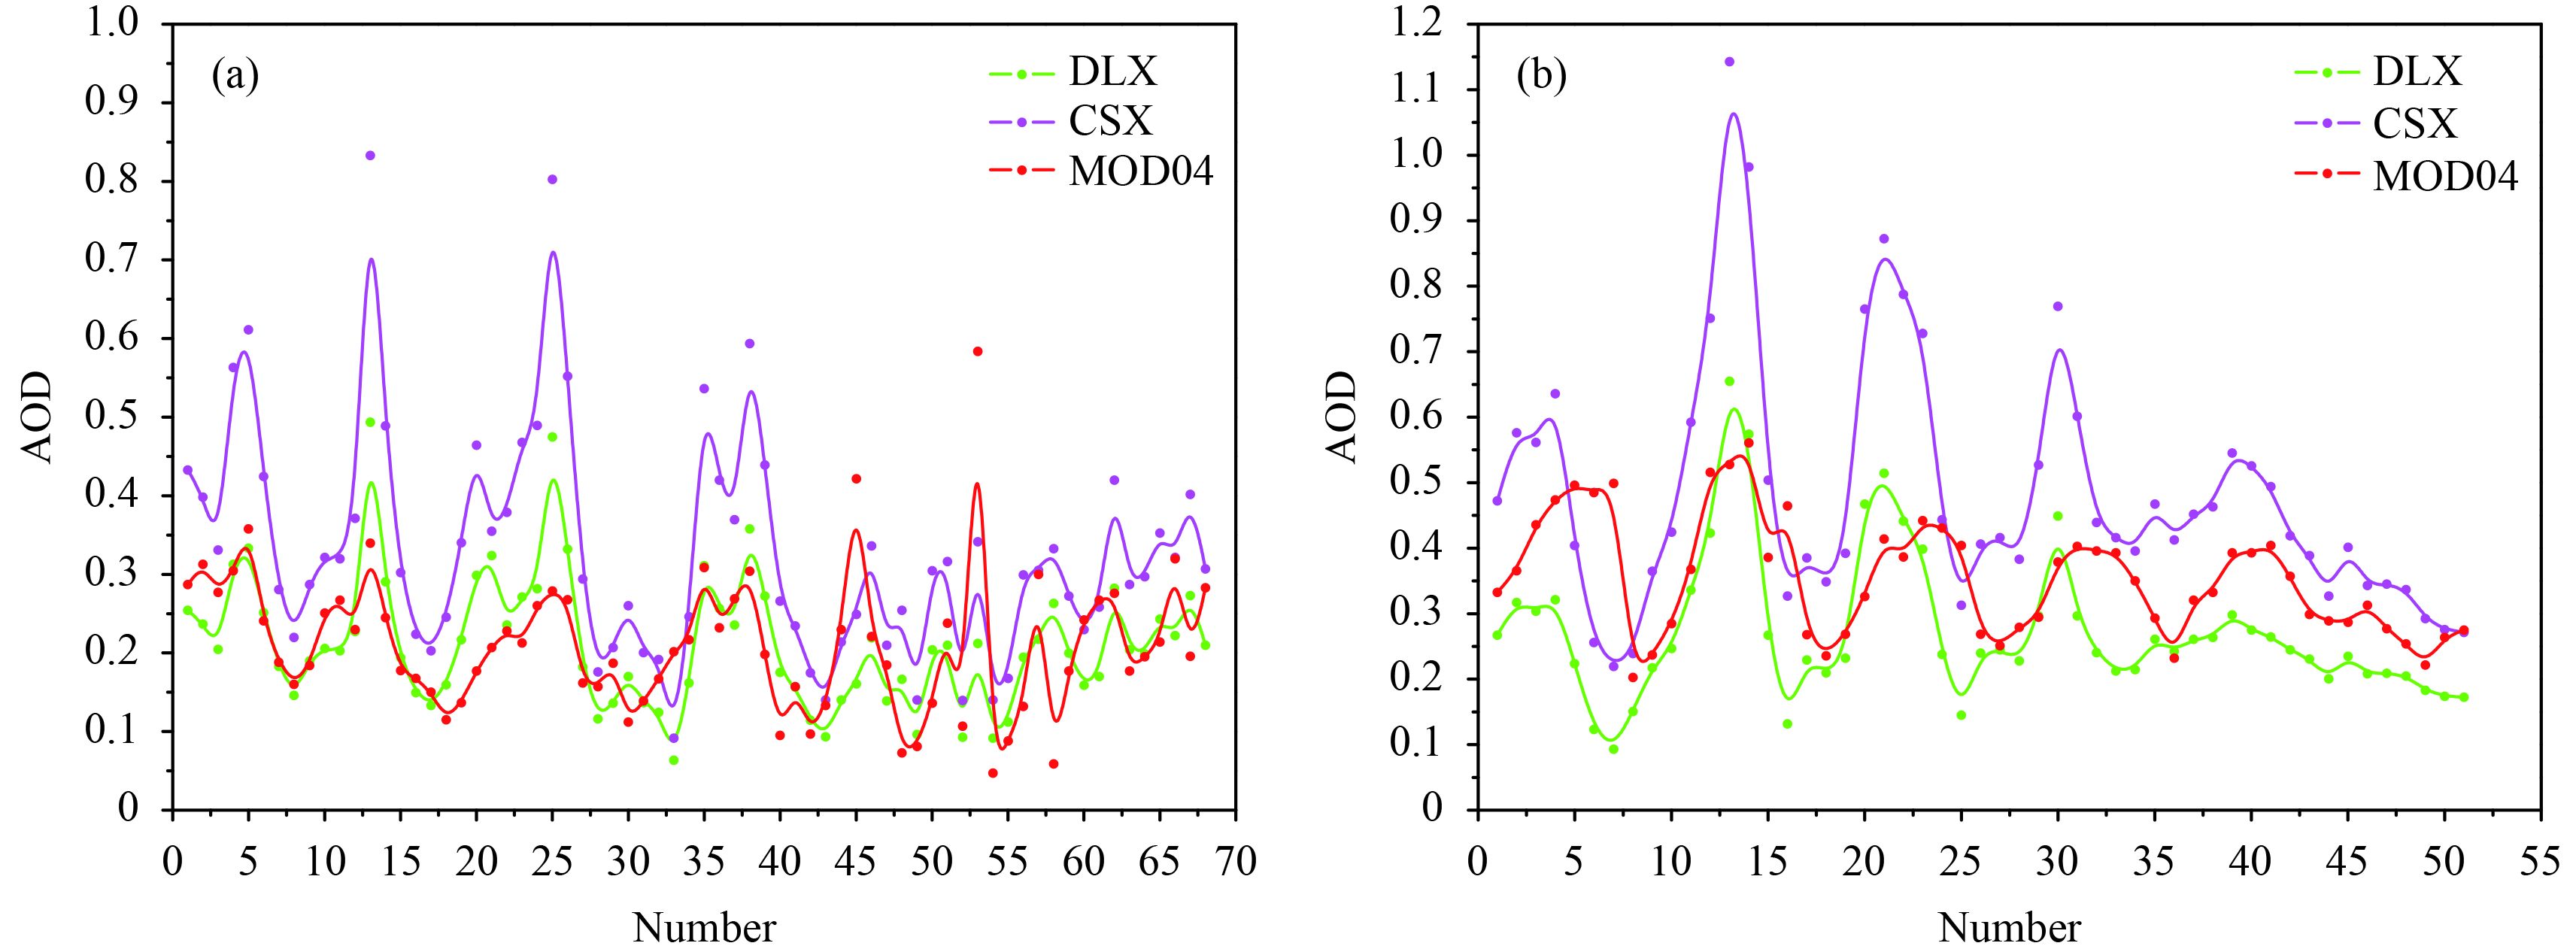
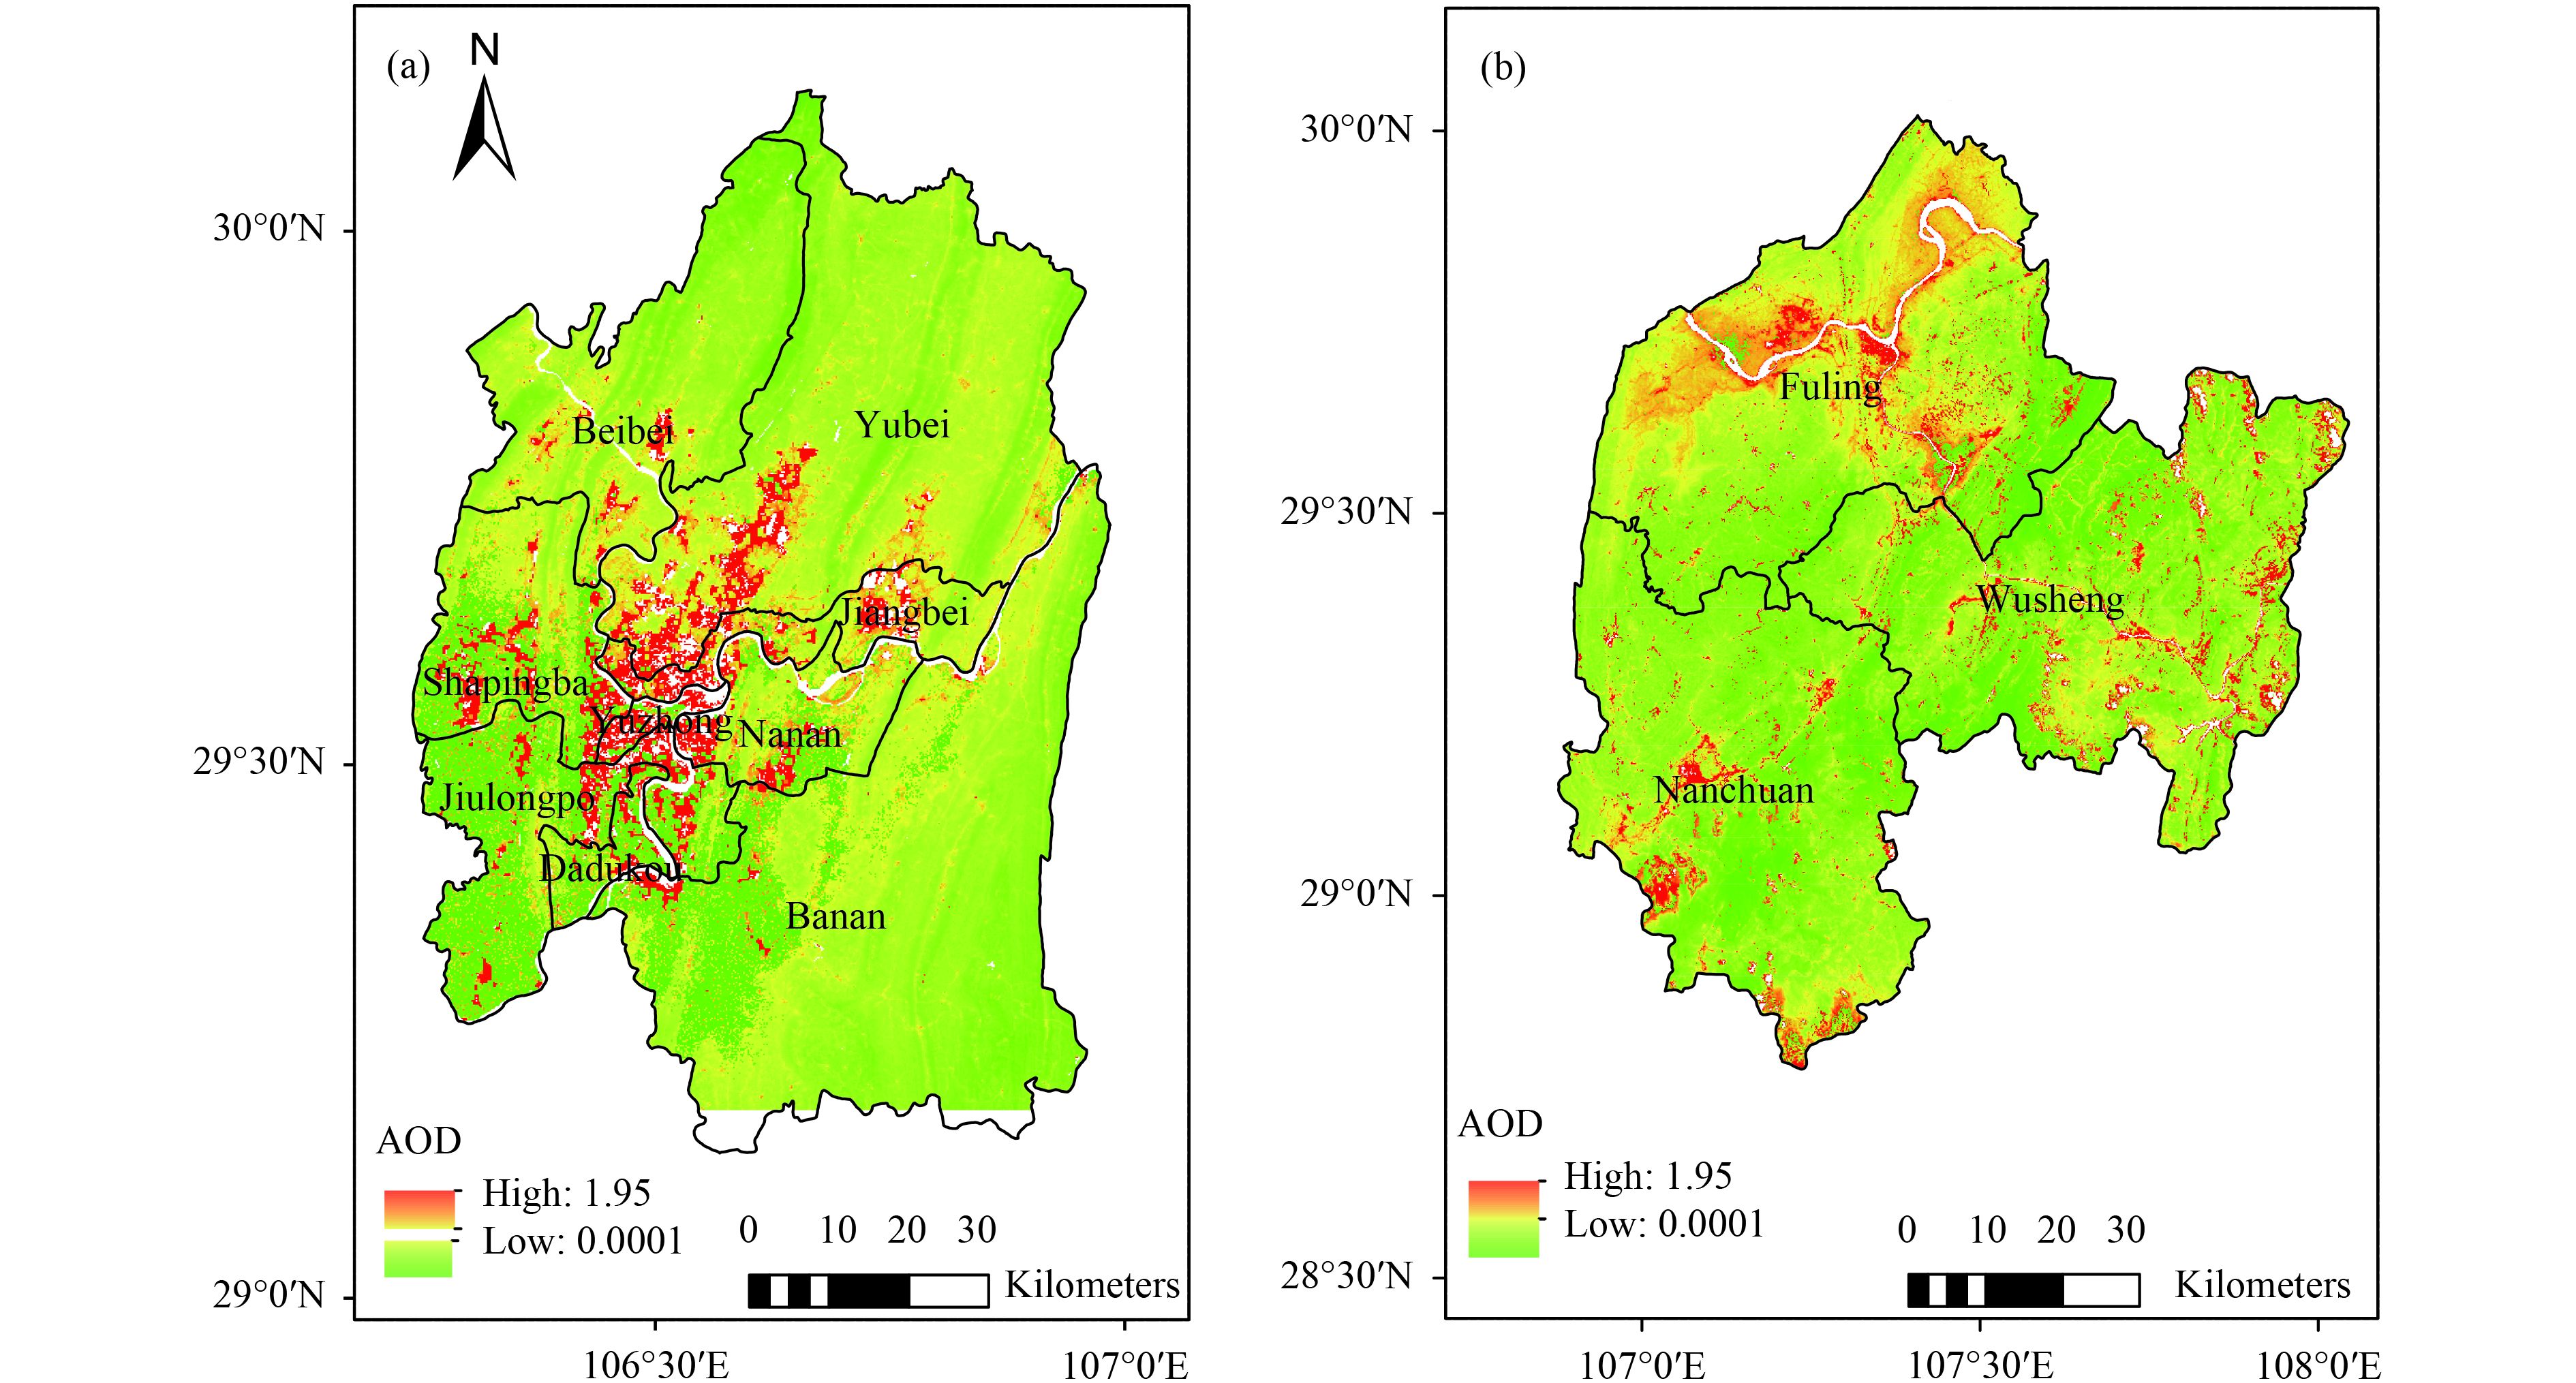
To further study the effect of the city- and mainland-type aerosol models on the inversion results, the data of the urban areas (major urban areas of Chongqing, including districts of Beibei, Yubei, Jiangbei, Shapingba, Yuzhong, Nan’an, Jiulongpo, Dadukou, and Banan) and non-major urban areas (rural areas, including districts of Fuling and Nanchuan, and Wulong County), collected on 18 June 2014, are used for inversion with the two aerosol models. Comparison with the MOD04 product is illustrated in Fig. 6, and the inversion results (mainland type) are presented in Fig. 7.
|
| Figure 6 Comparison of the AOD (aerosol optical depth) inversion of two models (DLX, mainland-type model; CSX, sand-type model) with the MOD04 MODIS product for (a) major urban areas of Chongqing and (b) rural areas of Chongqing. “Number” refers to the number of pixels. |
|
| Figure 7 AOD (aerosol optical depth) inversion results on 18 June 2014 by using the combination of the dark pixel, buffer zone, and deep blue algorithms, based on the mainland-type aerosol model for (a) major urban areas of Chongqing and (b) rural areas of Chongqing. |
According to the inversion results of the two aerosol models and those of MOD04 (Fig. 6), the AOD inversion results of the mainland-type aerosol model for the major urban areas is lower than that of MOD04. By contrast, the inversion result of the city-type aerosol model is quite high. Comparing the two inversion results finds that the AOD value of the mainland-type aerosol model is closer to MOD04 and the inversion result is better. The AOD inversion results of two different aerosol models for the rural areas are higher than the MOD04 value. On the contrary, the consistency of the mainland-type inversion result AOD value with MOD04 is good. Therefore, the inversion result of the mainland-type aerosol model is better for both urban and rural areas.
As shown in Fig. 7, the AOD value of the urban areas is large and the mean value is approximately 0.5. The air quality is relatively poor, particularly in Yuzhong District where the AOD value reaches approximately 1.2 at its maximum. This result could have been caused by the vehicle population, because this district is a traffic hub of Chongqing. The AOD values in Banan, Jiulongpo, and Yubei districts are relatively lower and the air quality is better. On the contrary, the air quality in Jiangbei, Shapingba, and Nan’an districts is relatively poor. The AOD values in the rural areas are small, the average value is approximately 0.2, and the air quality is better.
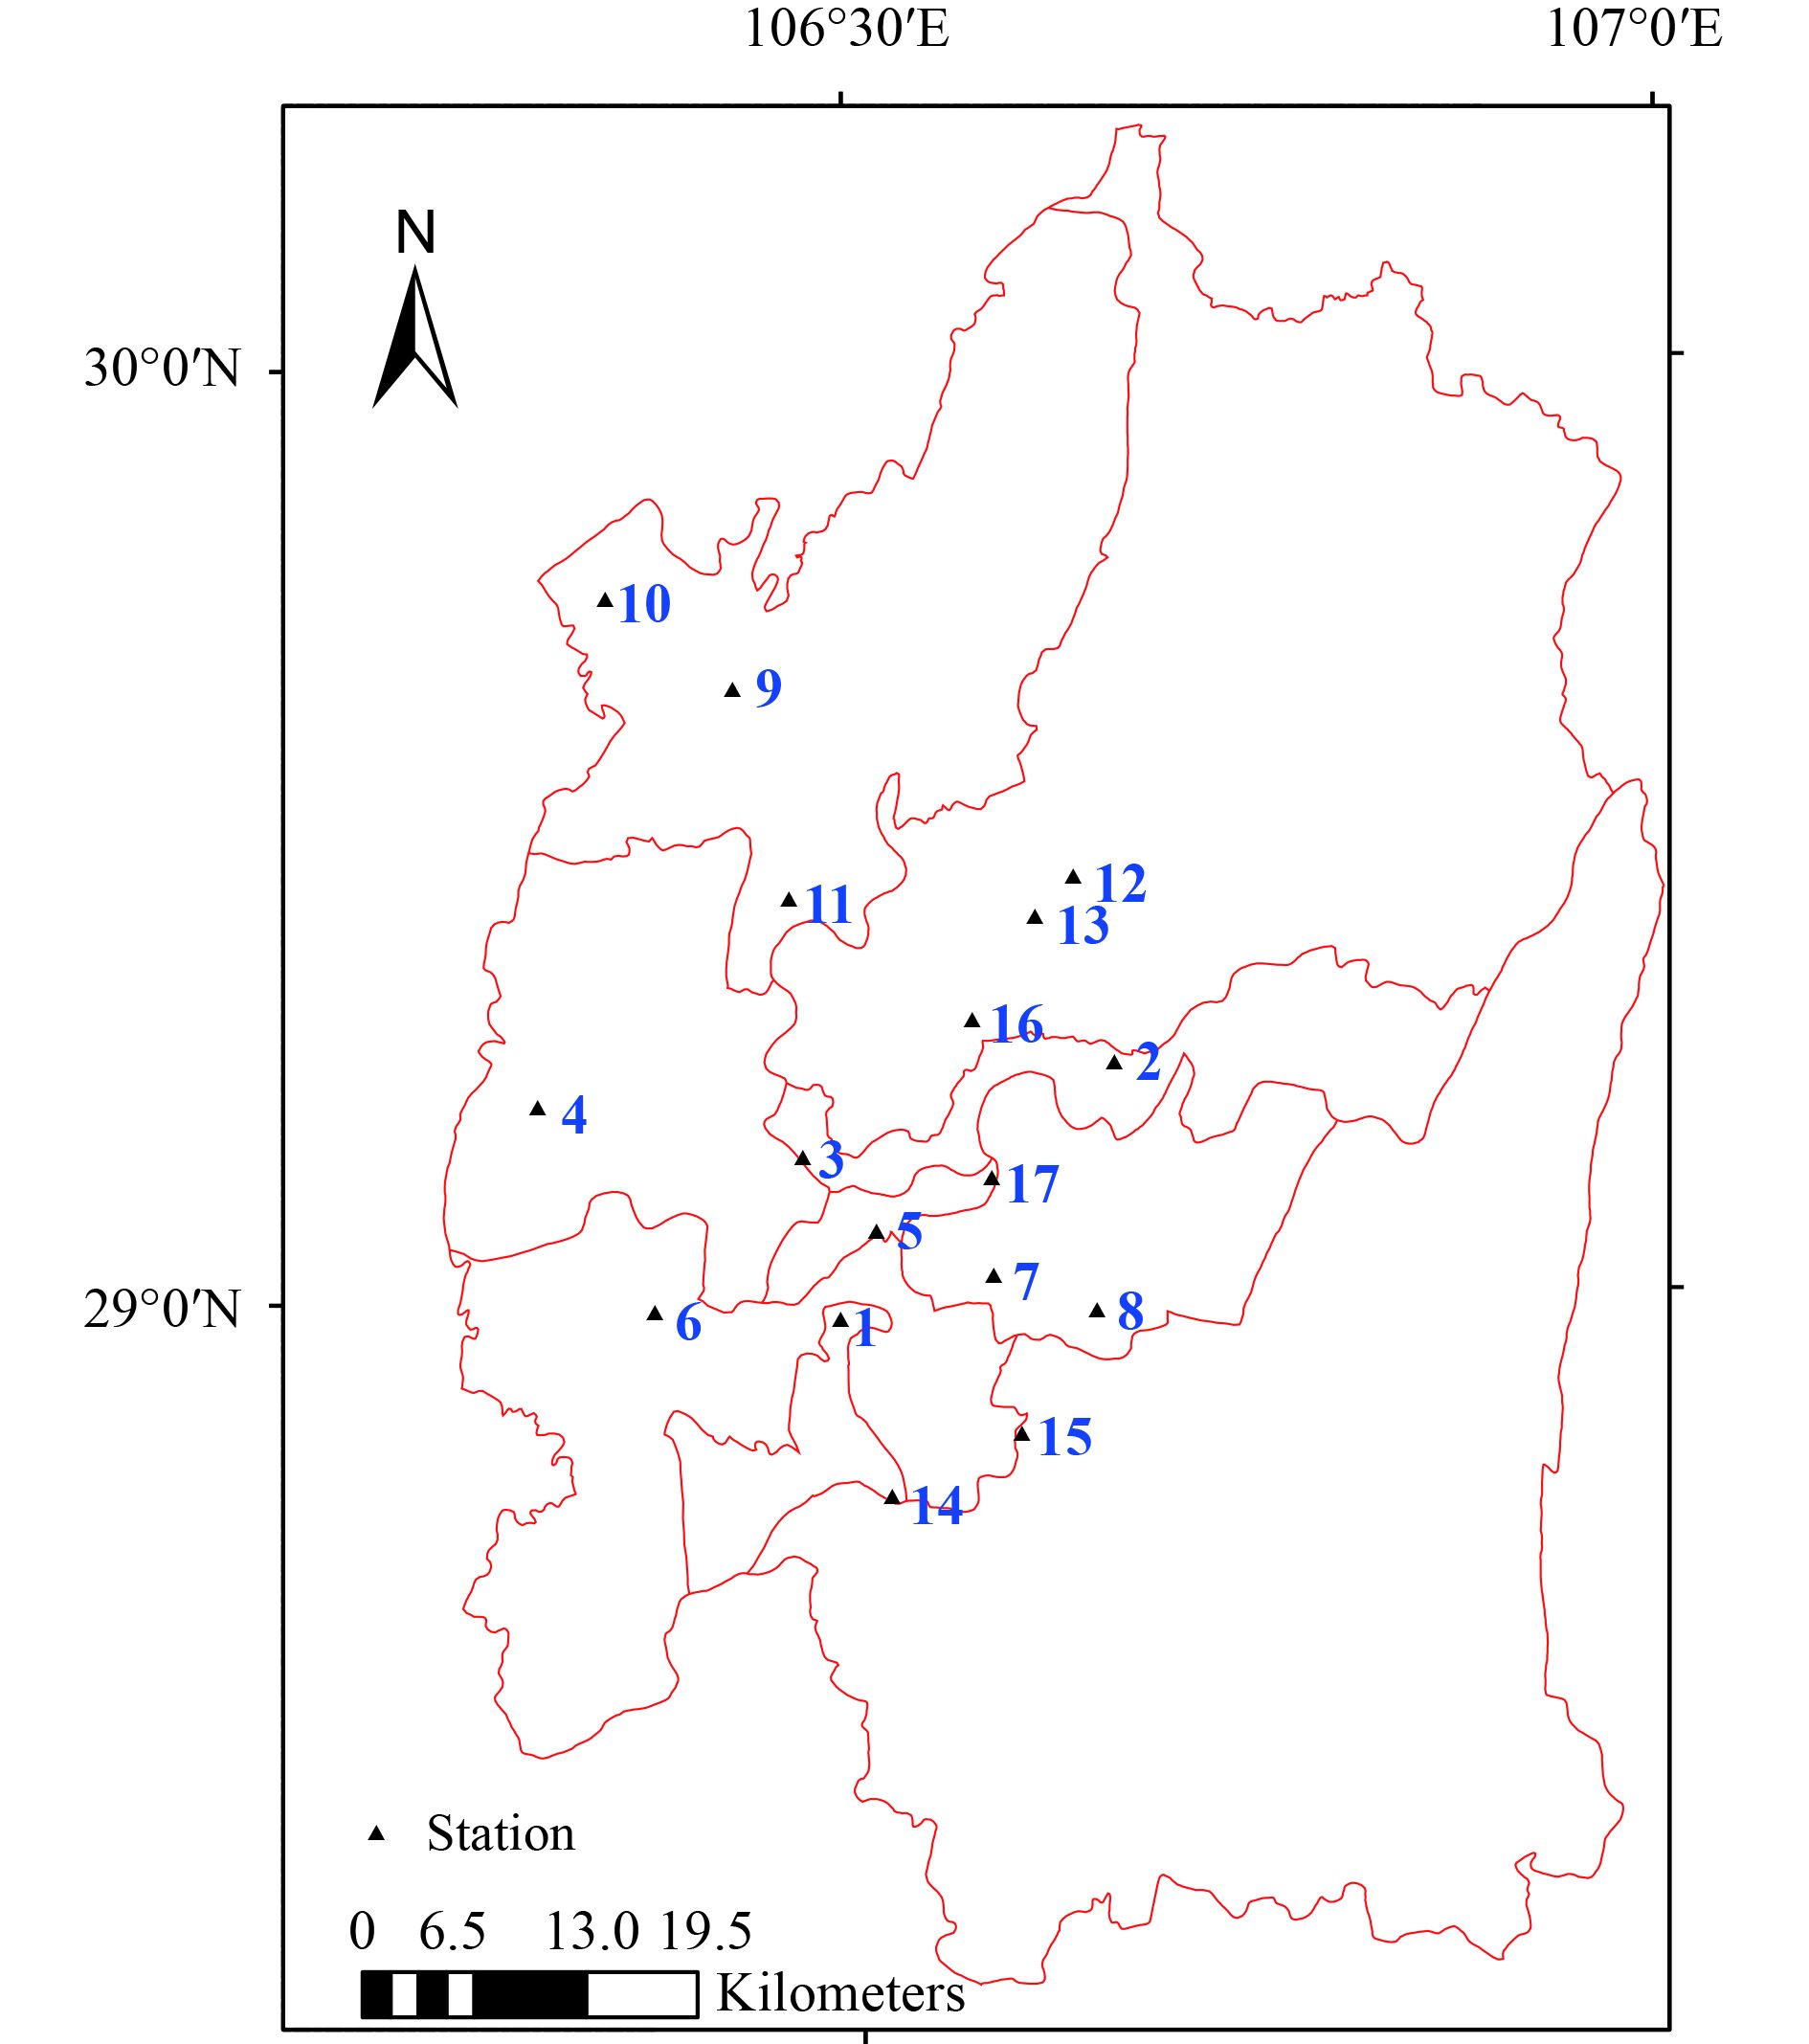
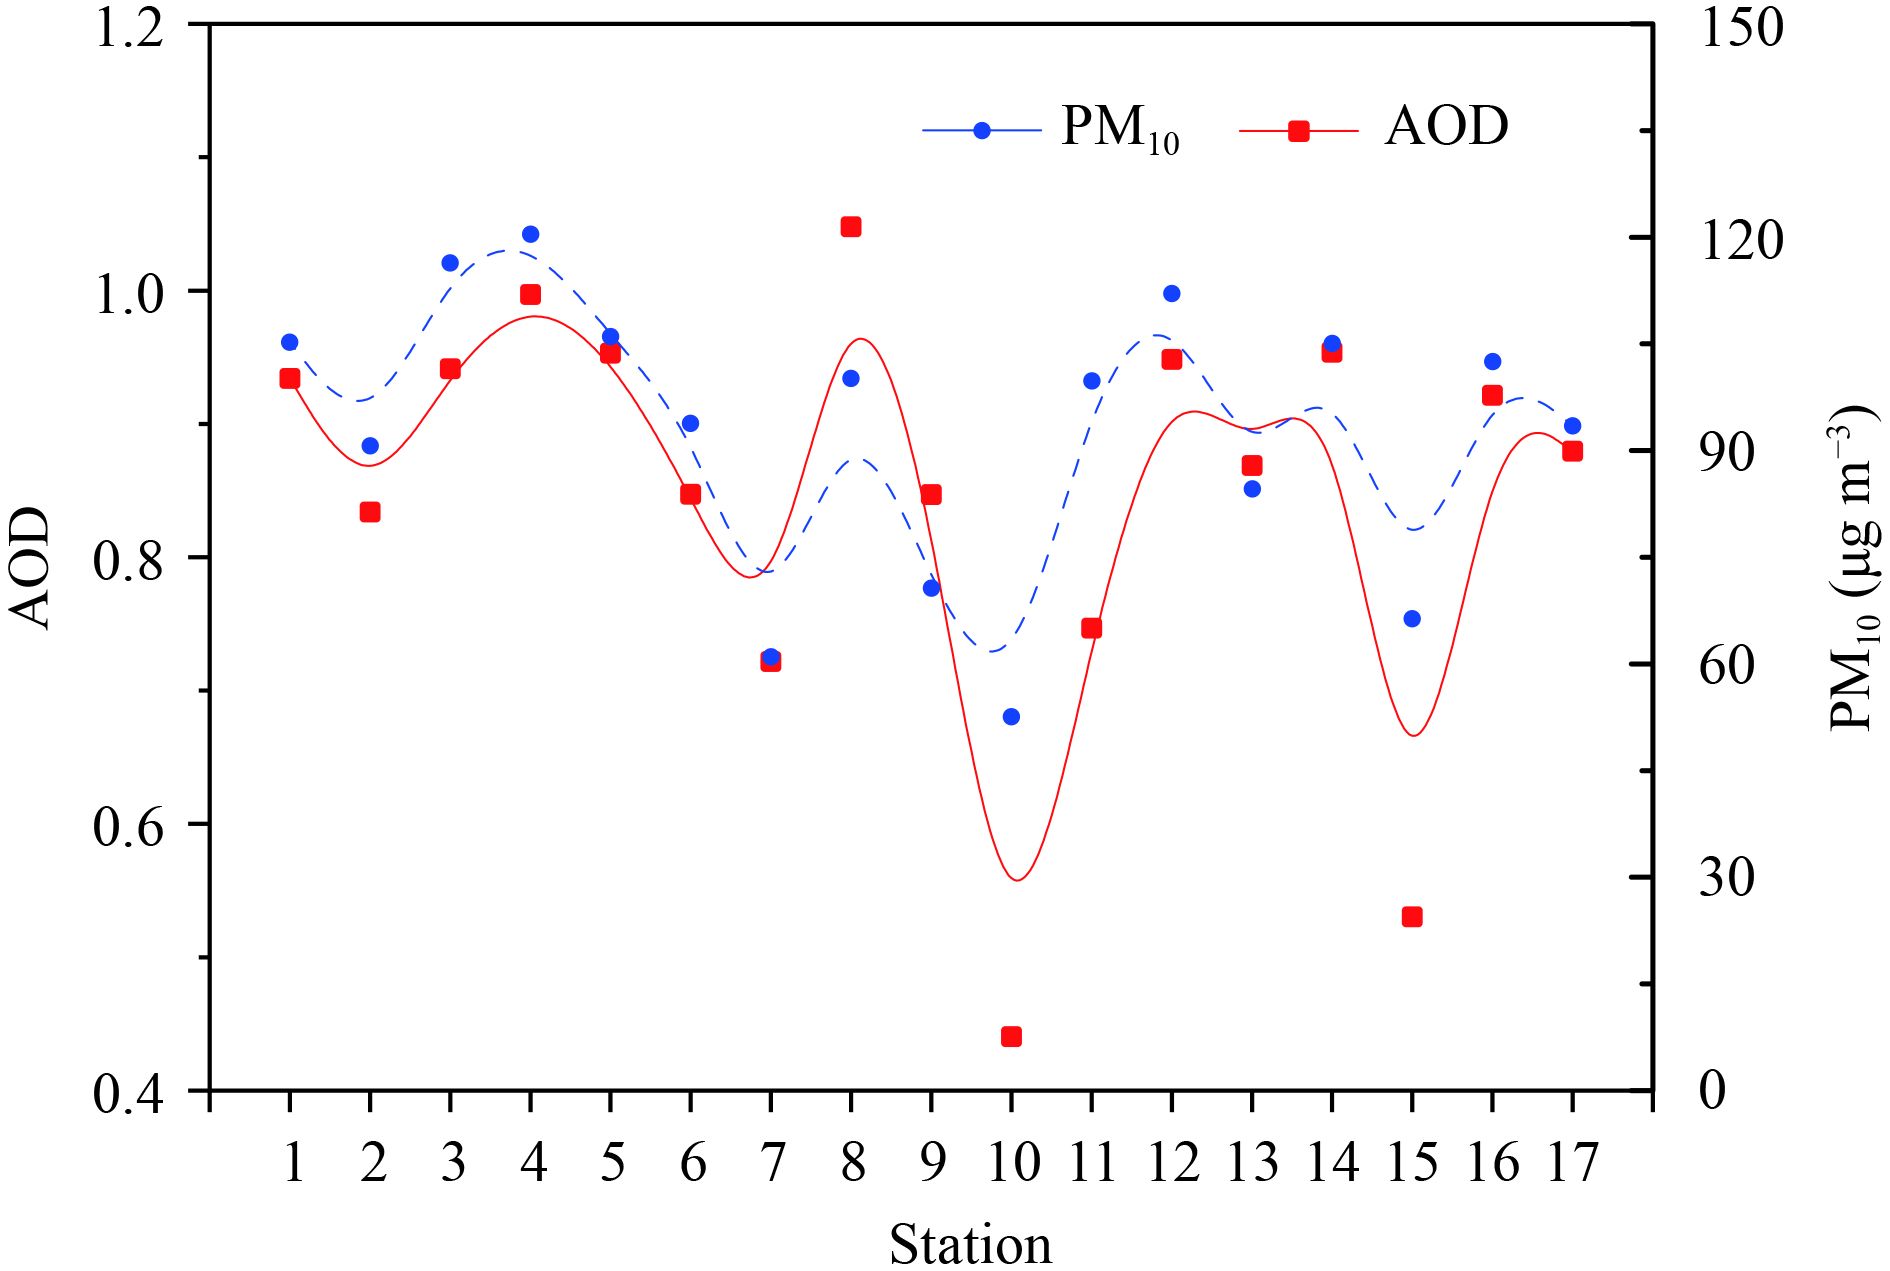
4.4 Linear correlation between aerosol and groundobserved particulate matterThe PM10 data are originally from the observational values of 17 environmental monitoring stations in the major urban areas of Chongqing (refer to Fig. 8 for the observation sites). The analysis of the correlation between AOD and PM10 proves that AOD, to a certain extent, can be used for ground atmospheric pollution monitoring. Figure 9 shows the AOD and PM10 concentration inverted by using the HJ satellite data for different sites in the Chongqing region on 18 June 2014. The results show that, apart from at Tangjiatuo, Huxi, and Jiefangbei, the difference between AOD and PM10 is consistent among sites; indeed, they have good correlation, with a correlation coefficient of 0.83. The difference between AOD and PM10 is mainly due to the different acquisition methods of the two kinds of data. AOD is inverted through satellite data, and the result represents the integral in the vertical direction within the range of the pixels. Meanwhile, PM10 is the value around the time of the satellite’s overpass, but PM10 and satellite data have a slight time difference.
|
| Figure 8 Locations of the 17 environment monitoring sites denoted by numbers. 1: Xinshancun; 2: Tangjiatuo; 3: Gaojia; 4: Huxi; 5: Panjiaping; 6: Baishiyi; 7: Nanping; 8: Caiyuan; 9: Tiansheng; 10: Jinyunshan; 11: Caijia; 12: Lianglu; 13: Konggang; 14: Yuxinjie; 15: Nanquan; 16: Lijia; and 17: Jiefangbei. |
|
| Figure 9 Comparison of the PM10 concentrations at the 17 sites (repre-sented by the numbers in Fig. 8) with the AOD (aerosol optical depth) inversion results on 18 June 2014. |
Accurately building an aerosol model is very difficult because the aerosol pollution source varies considerably and the particle composition is complex. In this study, four standard aerosol models (mainland type, city type, sand type, and biomass-burning type) are adopted for the inversion of atmospheric AOD. In comparison with MOD04 results, the inversion result of the mainland-type aerosol model is the best. However, the actual content of moisture in the atmosphere is different from the 6S model because different aerosol models have different optical parameters (scattering phase function and single scattering reflectance). This difference will cause deviation in the surface reflectance of each band, leading to deviation in the AOD inversion result.
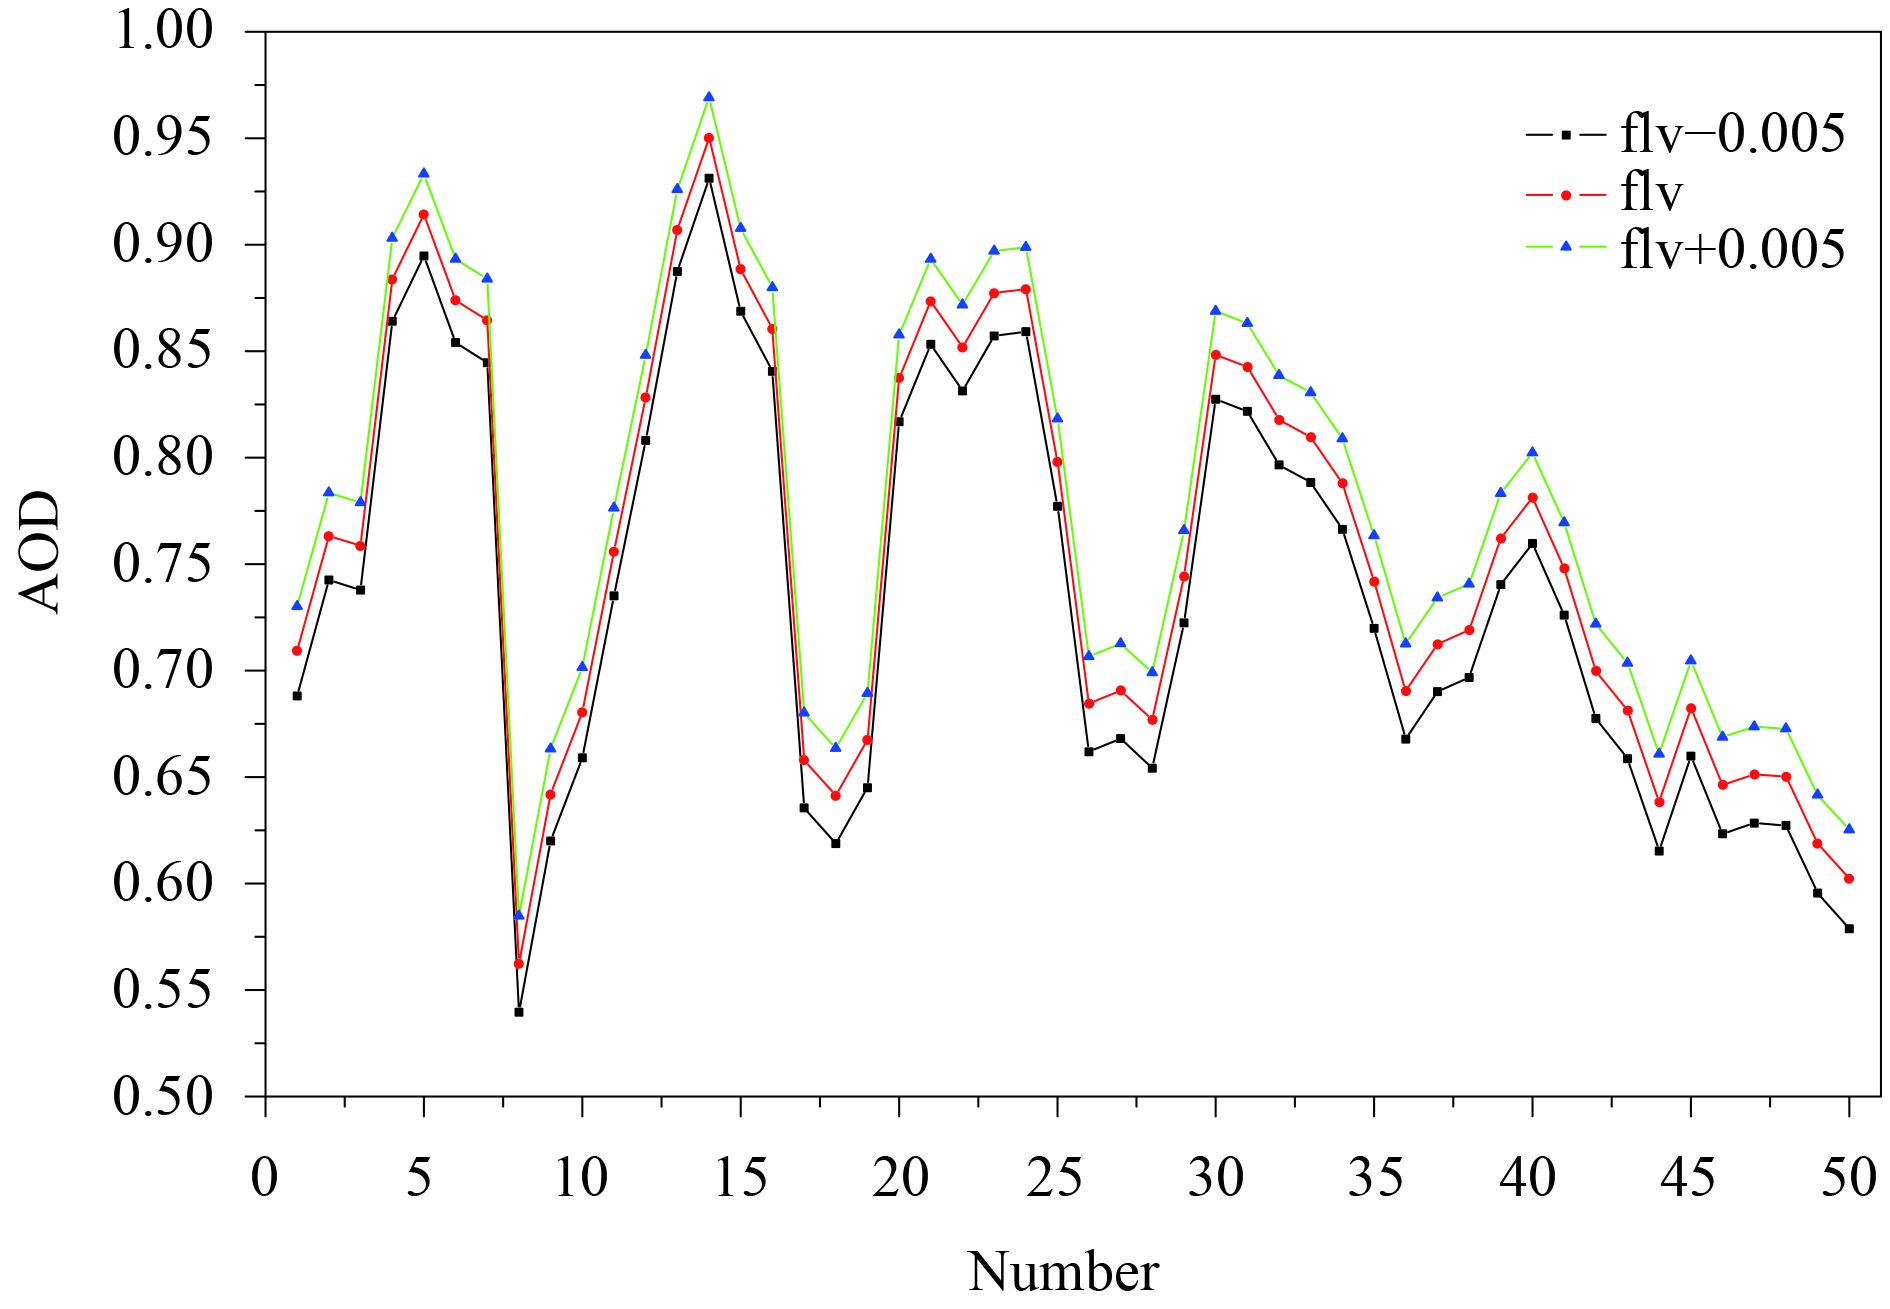
Accurately obtaining ground surface reflectance is one of the key factors for inversion of AOD with the deep blue algorithm. Kaufman et al. (1997) showed that a 0.01 deviation of surface reflectance will lead to a deviation of aerosol optical thickness larger than 0.1. Vermote et al. (1997) showed that 51.3% of the surface reflectance product of the MODIS blue-light band is good, and can be controlled within the range of ± (0.005 + 5%). Deviation analysis for deep blue algorithm was conducted by adding 0.005 + 5% to the bright surface reflectance. The result is presented in Fig. 10.
|
| Figure 10 Effect of surface reflectance (flv) deviation on the inversion of AOD. “Number” refers to the number of pixels. |
As shown in Fig. 10, the deviation of surface reflectance will have a certain effect on the AOD inversion result. The absolute deviation is small, which is approximately 0.02. The smaller the AOD, the larger the deviation caused by surface reflectance. For the domain of this study, the deviation of surface reflectance is 0.01, the average absolute deviation of AOD inversion is approximately 0.05, and the relative deviation is approximately 5.4%.
During AOD inversion, when the lookup table is constructed through 6S, the parameters such as solar elevation angle, satellite zenith angle, relative azimuth angle, and aerosol content are prescribed in the models. A total of 11 solar zenith angles, 14 satellite zenith angles, 16 relative azimuth angles, and 18 AOD values are set to construct the lookup table in this study. Fraser et al. (1992) showed that, in similar lookup tables, the deviation of the result through the interpolation in the entire table is large when the solar angle or satellite angle is large. When apparent reflectance is equal to 0.05, the deviation caused by interpolation is smaller than 0.005 and the maximum visual angle of the HJ-1A/B CCD satellite does not exceed 40°. Therefore, the inversion has certain deviation.
The most parts of the study domain are mountainous, where the topography is complex and the MODIS data have been corrected by BRDF (Bidirectional Reflectance Distribution Function). To reduce deviation caused by topography, the data are resampled onto a resolution of 150 m. The resampling of two different remote sensing datasets and the supposition of the ground surface as a Lambert reflector can cause deviation in the AOD inversion result. To avoid the cloud effect, only the threshold value of apparent reflectance of the red band is adopted. Notably, this process may also cause deviation in the AOD retrieval results.
5 Conclusions and discussionIn this study, inversion of the atmospheric aerosol parameter AOD over the Chongqing region is conducted by using HJ-1 data combined with the MODIS surface reflectance product. The HJ-1 data have a high spatial resolution of 30 m. It carries the blue and red bands and the near-infrared band set for the CCD sensor. These bands correspond to those set for the MODIS sensor. Note that the maximum resolution of MODIS is 250 m and thus MODIS data fail to satisfy the requirement of spatial resolution refinement. Nevertheless, the high resolution of HJ-1 data can overcome this weakness. The spatial resolution of HJ-1 data satisfies the refinement requirement of AOD inversion, and thus would be a better choice.
The dark pixel method and deep blue algorithm are often used to invert AOD above land. The dark pixel method produces a good inversion effect on the dense vegetation coverage zones, but this method is inapplicable for the inversion of aerosol in the air above bright ground surface zones. The deep blue algorithm provides a wide range of applicability, but the deviations in AOD inversion results are large. In this study, two methods are combined for the inversion of AOD for both dense vegetation zones and bright ground surface zones.
The dark pixel method is used in the dense vegetation coverage zones. Considering that the changes in the parameters of the atmosphere are small within 1 km, we use the buffer zone within 1 km in the dense vegetation coverage zones during calculation. Finally, the deep blue algorithm is utilized for the bright surface to reduce the large deviation caused by the direct use of the dark pixel method. On the basis of the comparison of the inversion result with that of the MOD04 product, we apply the inversion method of the dark pixel method combined with the deep blue algorithm in this study. The two methods are highly correlated and highly consistent with PM10 measurements on ground surface. Although some significant results based on the algorithms are obtained, this study is characterized by some weaknesses. The following aspects should be considered in further research.
First, we assume that the ground surface is under the conditions of a Lambert reflector and equal atmosphere during algorithm derivation. This is, however, not fully realistic. We suspect that this supposition influences the inversion results. If we considering the characteristics of a non-Lambert reflector and the actual state of the atmosphere through physical models, we may further increase the inversion accuracy. Second, during construction of the lookup table by using the 6S model, the standard mainland-type model was selected as the atmospheric aerosol model; this could be replaced by using certain instrument measurements to build the aerosol model to increase the accuracy of the final inversion results. Third, considering the time efficiency of the algorithm, we use a linear interpolation algorithm for calculation. If the nonlinear algorithm of the 6S model is used for calculation, the accuracy may be increased. Finally, the MODIS surface reflectance product is used to retrieve AOD. Temporal and spatial mismatches between HJ and MODIS reflectance products will lead to deviation in the AOD retrieval. Were the surface reflectance inverted through the HJ-1 data, the inversion accuracy and spatial resolution for AOD could also be enhanced.
| Chen, L. F., S. S. Li, J. H. Tao, et al., 2011: Remote Sensing of Aerosol Quantitative Inversion Research and Application. Science Press, Beijing, 158 pp. (in Chinese) |
| De Leeuw G., Holzer-Popp T., Bevan S., et al.,2015: Evaluation of seven European aerosol optical depth retrieval algorithms for climate analysis. Remote Sens. Environ., 162, 295–315. DOI:10.1016/j.rse.2013.04.023 |
| Fang L., Yu T., Gu X. F., et al.,2013: Aerosol retrieval and atmospheric correction of HJ-1 CCD data over Beijing. J. Remote Sens., 17, 151–164. |
| Fraser R. S., Ferrare R. A., Kaufman Y. J., et al.,1992: Algorithm for atmospheric corrections of aircraft and satellite imagery. Int. J. Remote. Sens., 13, 541–557. DOI:10.1080/01431169208904056 |
| Haywood J. M., Ramaswamy V., 1998: Global sensitivity studies of the direct radiative forcing due to anthropogenic sulfate and black carbon aerosols. J. Geophy. Res., 103(D6), 6043–6058. DOI:10.1029/97JD03426 |
| Hsu N. C., Tsay S. C., King M. D., et al.,2004: Aerosol properties over bright-reflecting source regions. IEEE Trans. Geosci. Remote Sens., 42, 557–569. DOI:10.1109/TGRS.2004.824067 |
| Hsu N. C., Tsay S. C., King M. D., et al.,2006: Deep blue retrievals of Asian Aerosol properties during ACE-Asia. IEEE Trans. Geosci. Remote Sens., 44, 3180–3195. DOI:10.1109/TGRS.2006.879540 |
| Kaufman Y. J., Sendra C., 1988: Algorithm for automatic atmospheric corrections to visible and near-IR satellite imagery. Int. J. Remote Sens., 9, 1357–1381. DOI:10.1080/01431168808954942 |
| Kaufman Y. J., Tanre D., Remer L. A., et al.,1997: Operational remote sensing of tropospheric aerosol over land from EOS moderate resolution imaging spectroradiometer. J. Geophy. Res., 102, 17051–17067. DOI:10.1029/96JD03988 |
| Kaufman Y. J., Koren I., Remer L. A., et al.,2005: The effect of smoke, dust, and pollution aerosol on shallow cloud development over the Atlantic Ocean. Proc. Natl. Acad. Sci. U.S. A., 102, 11207–11212. DOI:10.1073/pnas.0505191102 |
| King M. D., Kaufman Y. J., Tanre D., et al.,1999: Remote sensing of tropospheric aerosols from space: Past, present, and future. Bull. Amer. Meteor. Soc., 80, 2229–2260. DOI:10.1175/1520-0477(1999)080<2229:RSOTAF>2.0.CO;2 |
| Li S. S., Chen L. F., Tao J. H., et al.,2011: Retrieval and validation of the surface reflectance using HJ-1-CCD data. Spectrosc. Spect. Anal., 31, 516–520. |
| Liu H. Q., Huete A. R., 1995: A feedback based modification of the NDVI to minimize canopy background and atmos-pheric noise. IEEE Trans. Geosci. Remote Sens., 33, 457–465. DOI:10.1109/36.377946 |
| Ramanathan V., Crutzen P. J., Kiehl J. T., et al.,2001: Aerosols, climate, and the hydrological cycle. Science, 294, 2119–2124. DOI:10.1126/science.1064034 |
| Rotstayn L. D., Penner J. E., 2001: Indirect aerosol forcing, quasi forcing, and climate response. J. Climate, 14, 2960–2975. DOI:10.1175/1520-0442(2001)014<2960:IAFQFA>2.0.CO;2 |
| Sayer A. M., Hsu N. C., Bettenhausen C., et al.,2013: Validation and uncertainty estimates for MODIS Collection 6 " Deep Blue” aerosol data. J. Geophy. Res. Atmos., 118, 7864–7872. DOI:10.1002/jgrd.50600 |
| Shi Y. X., Zhang J., Reid J. S., et al.,2012: Critical evaluation of the MODIS deep blue aerosol optical depth product for data assimilation over North Africa. Atmos. Measure. Tech. Discus., 5, 7815–7865. DOI:10.5194/amt-6-949-2013 |
| Sun L., Liu Q. H., Chen L. F., et al.,2006: The application ofHJ-1 hyperspectral imaging radiometer to retrieve aerosol optical thickness over land. J. Remote Sens., 10, 770–776. |
| Vermote E. F., Tanre D., Deuze J. L., et al.,1997: Second simulation of the satellite signal in the solar spectrum, 6S: An overview. IEEE Trans. Geosci. Remote Sens., 35, 675–686. DOI:10.1109/36.581987 |
| Wang Z. T., Chen L. F., Gong H., et al.,2009a: Modified DDV method of aerosol optical depth inversion over land surfaces from CBERS02B. J. Remote Sens., 13, 1047–1057. |
| Wang Z. T., Li Q., Tao J. H., et al.,2009b: Monitoring of aerosol optical depth over land surface using CCD camera on HJ-1 satellite. China Environ. Sci., 29, 902–907. |
| Wang Z. T., Li Q., Li S. S., 2012a: The monitoring of haze from HJ-1. Spectrosc. Spect. Anal., 32, 775–780. DOI:10.3964/j.issn.1000-0593(2012)03-0775-06 |
| Wang Z. T., Li Q., Wang Q., et al.,2012b: HJ-1 terrestrial aerosol data retrieval using deep blue algorithm. J. Remote Sens., 16, 603–610. |
| Xu H., Zhang Y. H., Hou W. Z., et al.,2013: Remote sensing observation of heavy haze in Beijing by HJ-1 satellite. J. Remote Sens., 17, 476–477. |
| Zhang Y., Meng Q. Y., Wu J. L., et al.,2011: Study of environmental vegetation index based on environment satellite CCD data and LAI inversion. Spectrosc. Spect. Anal., 31, 2789–2793. DOI:10.3964/j.issn.1000-0593(2011)10-2789-05 |
| Zhang Y. H., Li Z. Q., Hou W. Z., et al.,2013: Retrieval of haze aerosol optical depth based on high spatial resolution CCD of HJ-1. J. Remote Sens., 17, 964–969. DOI:10.11834/jrs.20133062 |
 2017, Vol. 31


