The Chinese Meteorological Society
Article Information
- Dong GUO, Yucheng SU, Xiuji ZHOU, Jianjun XU, Chunhua SHI, Yu LIU, Weiliang LI, Zhenkun LI . 2017.
- Evaluation of the Trend Uncertainty in Summer Ozone Valley over the Tibetan Plateau in Three Reanalysis Datasets. 2017.
- J. Meteor. Res., 31(2): 431-437
- http://dx.doi.org/10.1007/s13351-017-6058-x
Article History
- Received May 3, 2016
- in final form October 20, 2016
2. Chinese Academy of Meteorological Sciences, Beijing 100081;
3. Guangdong Ocean University, Zhanjiang 520488;
4. Shanghai Climate Center, Shanghai 200030
The ozone layer is not only vital to the thermal structure of the stratosphere (Andrews et al., 1987), but also to ecological systems (Fuhrer and Booker, 2003). Without the ozone layer, humans, animals, and plants could not live (van der Leun et al., 1995). However, Molina and Rowland (1974) discovered that chlorofluorocarbons were thinning the ozone layer. Furthermore, substantial ozone loss was found over the South Pole (Farman et al., 1985) and in the Arctic (Newman et al., 1997). Ozone depletion has thus attracted much attention.
A similar pattern of ozone depletion was found in the midlatitudes. Based on Total Ozone Mapping Spectrometer (TOMS) data, Zhou and Luo (1994) found a hotspot in the boreal summer half year (April–September) over the Tibetan Plateau (TP), which was characterized by the smallest ozone value relative to eastern China at the same latitude, and the most depleted center was called an ozone valley (OV). Zou (1996) then confirmed the OV over the TP (OVTP) with TOMS satellite data, according to a negative zonal deviation of ozone. Bian et al. (2006) reported an unusual ozone low in winter over the TP based on longer TOMS datasets. Recently, Guo et al. (2015) found an OVTP double-core structure using Aura Microwave Limb Sounder data.
Besides the observational evidence of such ozone depletion over the TP, there have also been studies of the mechanism responsible for the OV. Among others, Liu et al. (2003), Zhou and Chen (2005), Tian et al. (2008), Bian et al. (2011), and Guo et al. (2012) emphasized that the dynamic process is somehow associated with the South Asian high (SAH). Chemical factors have also been recognized as significant drivers (Liu et al., 2010; Guo et al., 2015). The terrain of the TP is also important to the OVTP (Tian et al., 2008; Bian et al., 2011); the smaller the atmospheric column, the smaller the ozone column.
Some studies have focused on the ozone trends of the OVTP. Liu et al. (2007) analyzed Stratospheric Aerosol and Gas Experiment II data and found a decreasing trend of stratospheric ozone over the TP during 1985–2004. Zhou and Zhang (2005) also showed a decreasing trend of total ozone over the TP during 1979–2002, using TOMS/Solar Backscatter Ultraviolet data. Zhang et al. (2014) analyzed those data and their results indicated that the total-column ozone low over the TP during winter and spring has deepened over the past decade, contrary to the recovery signal in annual mean total ozone over the TP after the mid 1990s. Su et al. (2016) simulated the three emission scenarios mentioned in the special report of the Intergovernmental Panel on Climate Change, using the Whole Atmosphere Community Climate Model III. The results showed that, in the future, total ozone over the TP will increase and the speed of this increase will be less than that over other areas at the same latitudes. This indicates that the OVTP will strengthen. Reasons for the increase of total ozone are a reduction of air pollutants and weakening of the local Hadley circulation over the plateau (Su et al., 2016). Strengthening of the SAH and divergence over the TP near the tropopause may intensify the OVTP (Su et al., 2016).
There have been many studies on the formation mechanism of the OVTP. However, the present work focused on the various OVTP trends in different datasets. Ozone in the upper troposphere and lower stratosphere is important in regional climate (Wang et al., 2008), and hence different trends of OVTP may have various impacts on the climate. Therefore, studying the differences in OVTP trends in various datasets should be valuable.
The present study attempted to understand the uncertainty of OVTP intensity trends in three reanalysis datasets and explain the major reason for that uncertainty. Section 2 describes the three datasets and methods. Sections 3 and 4 present the trends of OVTP, SAH intensities, and tropopause height over the TP, as well as ozone over the non-TP. Section 5 provides conclusions and discussion.
2 Data and methods 2.1 DataThe reanalysis datasets used included total ozone, ozone profile, geopotential, and horizontal wind speed over the period 1979–2009. The datasets were ERA-Interim [the interim reanalysis data of the ECMWF], JRA-55 [the 55-yr reanalysis data from the Japan Meteorological Agency (JMA)], and NCEP-CFSR (Climate Forecast System Reanalysis). The ERA-Interim project (Dee et al., 2011) is a bridge between ERA-40 and future reanalysis generations to be produced at the ECMWF. ERA-Interim covers the period from 1979 onwards and uses 4DVar (four-dimensional variation). The lati-tudinal resolution is about 0.7° and longitudinal resolution is 0.703125°. JRA-55 (Kobayashi et al., 2015) has been produced with the TL319 version of the JMA opera-tional data assimilation system. The data sources begin in 1958, when regular radiosonde observations became available worldwide. It was the first reanalysis to apply 4DVar to the past half century. The horizontal resolution is 1.25° × 1.25°. NCEP-CFSR (Saha et al., 2010) was completed over the 31-yr period from 1979 to 2009. It used the NCEP Coupled Forecast System model. The horizontal resolution is 0.5° × 0.5°.
TOMS and Ozone Monitoring Instrument (OMI) satellite data were used to evaluate the OVTP trends in the reanalysis data. We used data from TOMS instruments aboard the Nimbus-7 (1978–93) and Earth Probe (1996–2005) satellites. TOMS makes 35 measurements every 8 s, each covering widths from 30 to 125 miles (50–200 km) on the ground, along a line perpendicular to the motion of the satellite. Almost 2 × 10⁵ daily measurements cover every single location on the earth, except areas near one of the poles, where the sun remains close to or below the horizon during the entire 24-h period. The OMI instrument is mounted on the Aura satellite and has taken high-resolution measurements of ozone from space since 2005. The OMI uses hyperspectral imaging in a push-broom mode to observe solar backscatter radiation in the visible and ultraviolet bands. Earth is viewed in 740 wavelength bands along the satellite track, with a swath large enough to provide global coverage in 14 orbits (1 day).
2.2 MethodsTOMS (Igarashi, 1997) and OMI (McPeters et al., 2015) ozone data were merged when we calculated the OVTP trend in satellite data from 1979 to 2009. OVTP intensities during 1979–2005 were from TOMS and those during 2005–09 were from modified OMI data, which were equal to OMI data minus the difference of 2005 OMI and TOMS data. Furthermore, reanalysis ozone below 600 hPa across the TP was integrated vertically for investigating the effect of atmospheric column loss from the plateau on OVTP trends, because the average altitude there is near 4000 m (600 hPa). Given a variable F, its zonal deviation is F*, which is expressed as F* =F – [F] (Lorenz, 1967). Here, [F] is the zonal mean of F, or the average F over a latitude circle. Using ozone zonal deviation can better show the character of the OVTP, because ozone counters are usually parallel to latitude. We also used the Student’s t test to verify the trends.
3 OVTP climatology and its trendAll three reanalysis datasets in Fig. 1 show the OVTP in summer, but there are some differences between them in intensity and position. OVTP intensities in ERA-Interim (Figs. 1a, f) and JRA-55 (Figs. 1b, g) are similar. Values of their centers are near 270-DU (Dobson Unit) (–30 DU) total ozone zonal (deviation), and –25-DU total ozone zonal deviation contours are around 2700 km in zonal direction in both datasets. However, the OVTP in NCEP-CFSR is weaker, with minimum total ozone over the TP of about 280 DU (Fig. 1c) and a zonal deviation center of –25 DU around 1600 km (Fig. 1h). Moreover, OVTP centers in ERA-Interim (Fig. 1f) and JRA-55 (Fig. 1g) are at 35°N, 80°E, but the NCEP-CFSR OVTP center is at 32°N, 85°E (Fig. 1h). In addition, TOMS and OMI show a similar pattern, although their averaging periods are not the same.

|
| Figure 1 Summer (June–August) mean total column ozone (DU) and total column ozone zonal deviation (DU) in (a, f) ERA-Interim, (b, g) JRA-55, (c, h) NCEP-CFSR for 1979–2009, (d, i) OMI for 2005–09, and (e, j) TOMS for 1979–2005. |
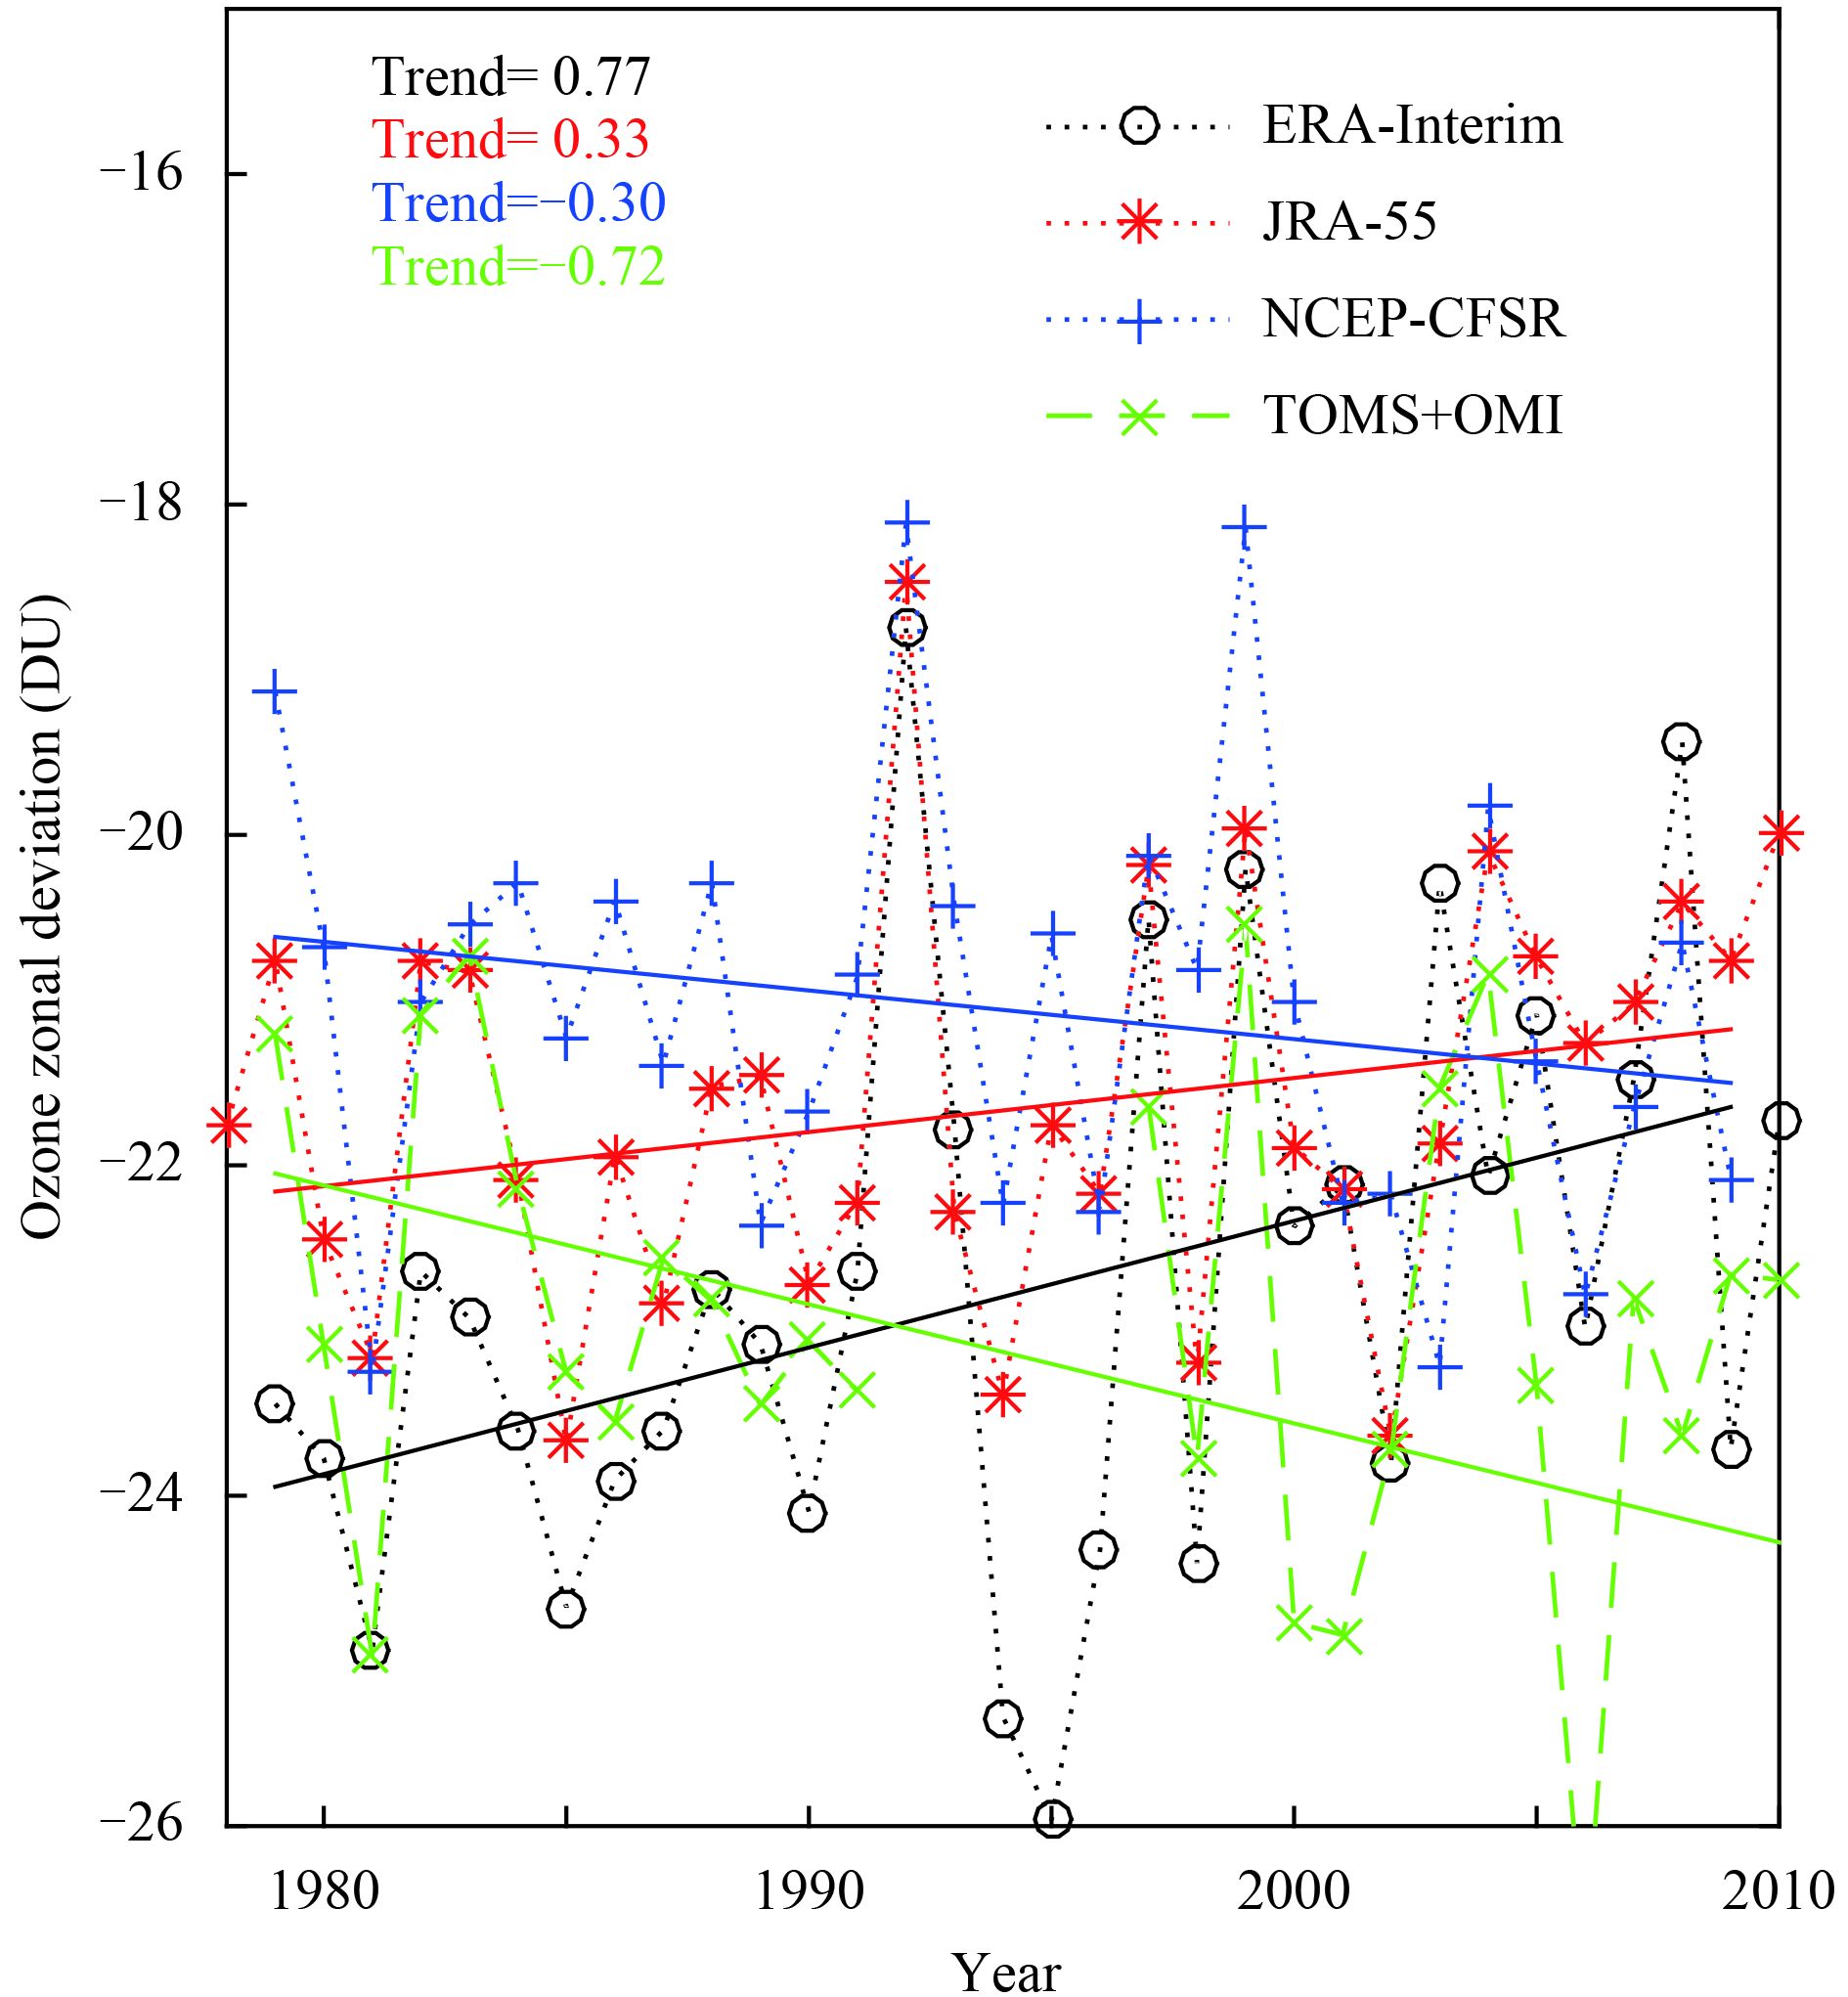
Differences of the TP-area (27°–37°N, 75°–105°E) mean trend of total ozone zonal deviation during 1979–2009 summers between the three reanalysis datasets are huge, and the trends are even opposite (Fig. 2). The summer OVTP negative trend [–0.72 DU (10 yr)–1] in the merged satellite data agrees with the NCEP result [–0.30 DU (10 yr)–1] rather than those of ERA-Interim [0.77 DU (10 yr)–1] and JRA-55 [0.33 DU (10 yr)–1]. Trends in all data pass the statistical significance test with the 95%, 80%, and 90% confidence levels for the ERA-Interim, JRA-55, and NCEP, respectively.
|
| Figure 2 TP-area (27°–37°N, 75°–105°E) mean total ozone zonal deviation during the summers of 1979–2009 in reanalysis and satellite data (dashed curve; DU) and their trends [solid lines; DU (10 yr)–1]. |
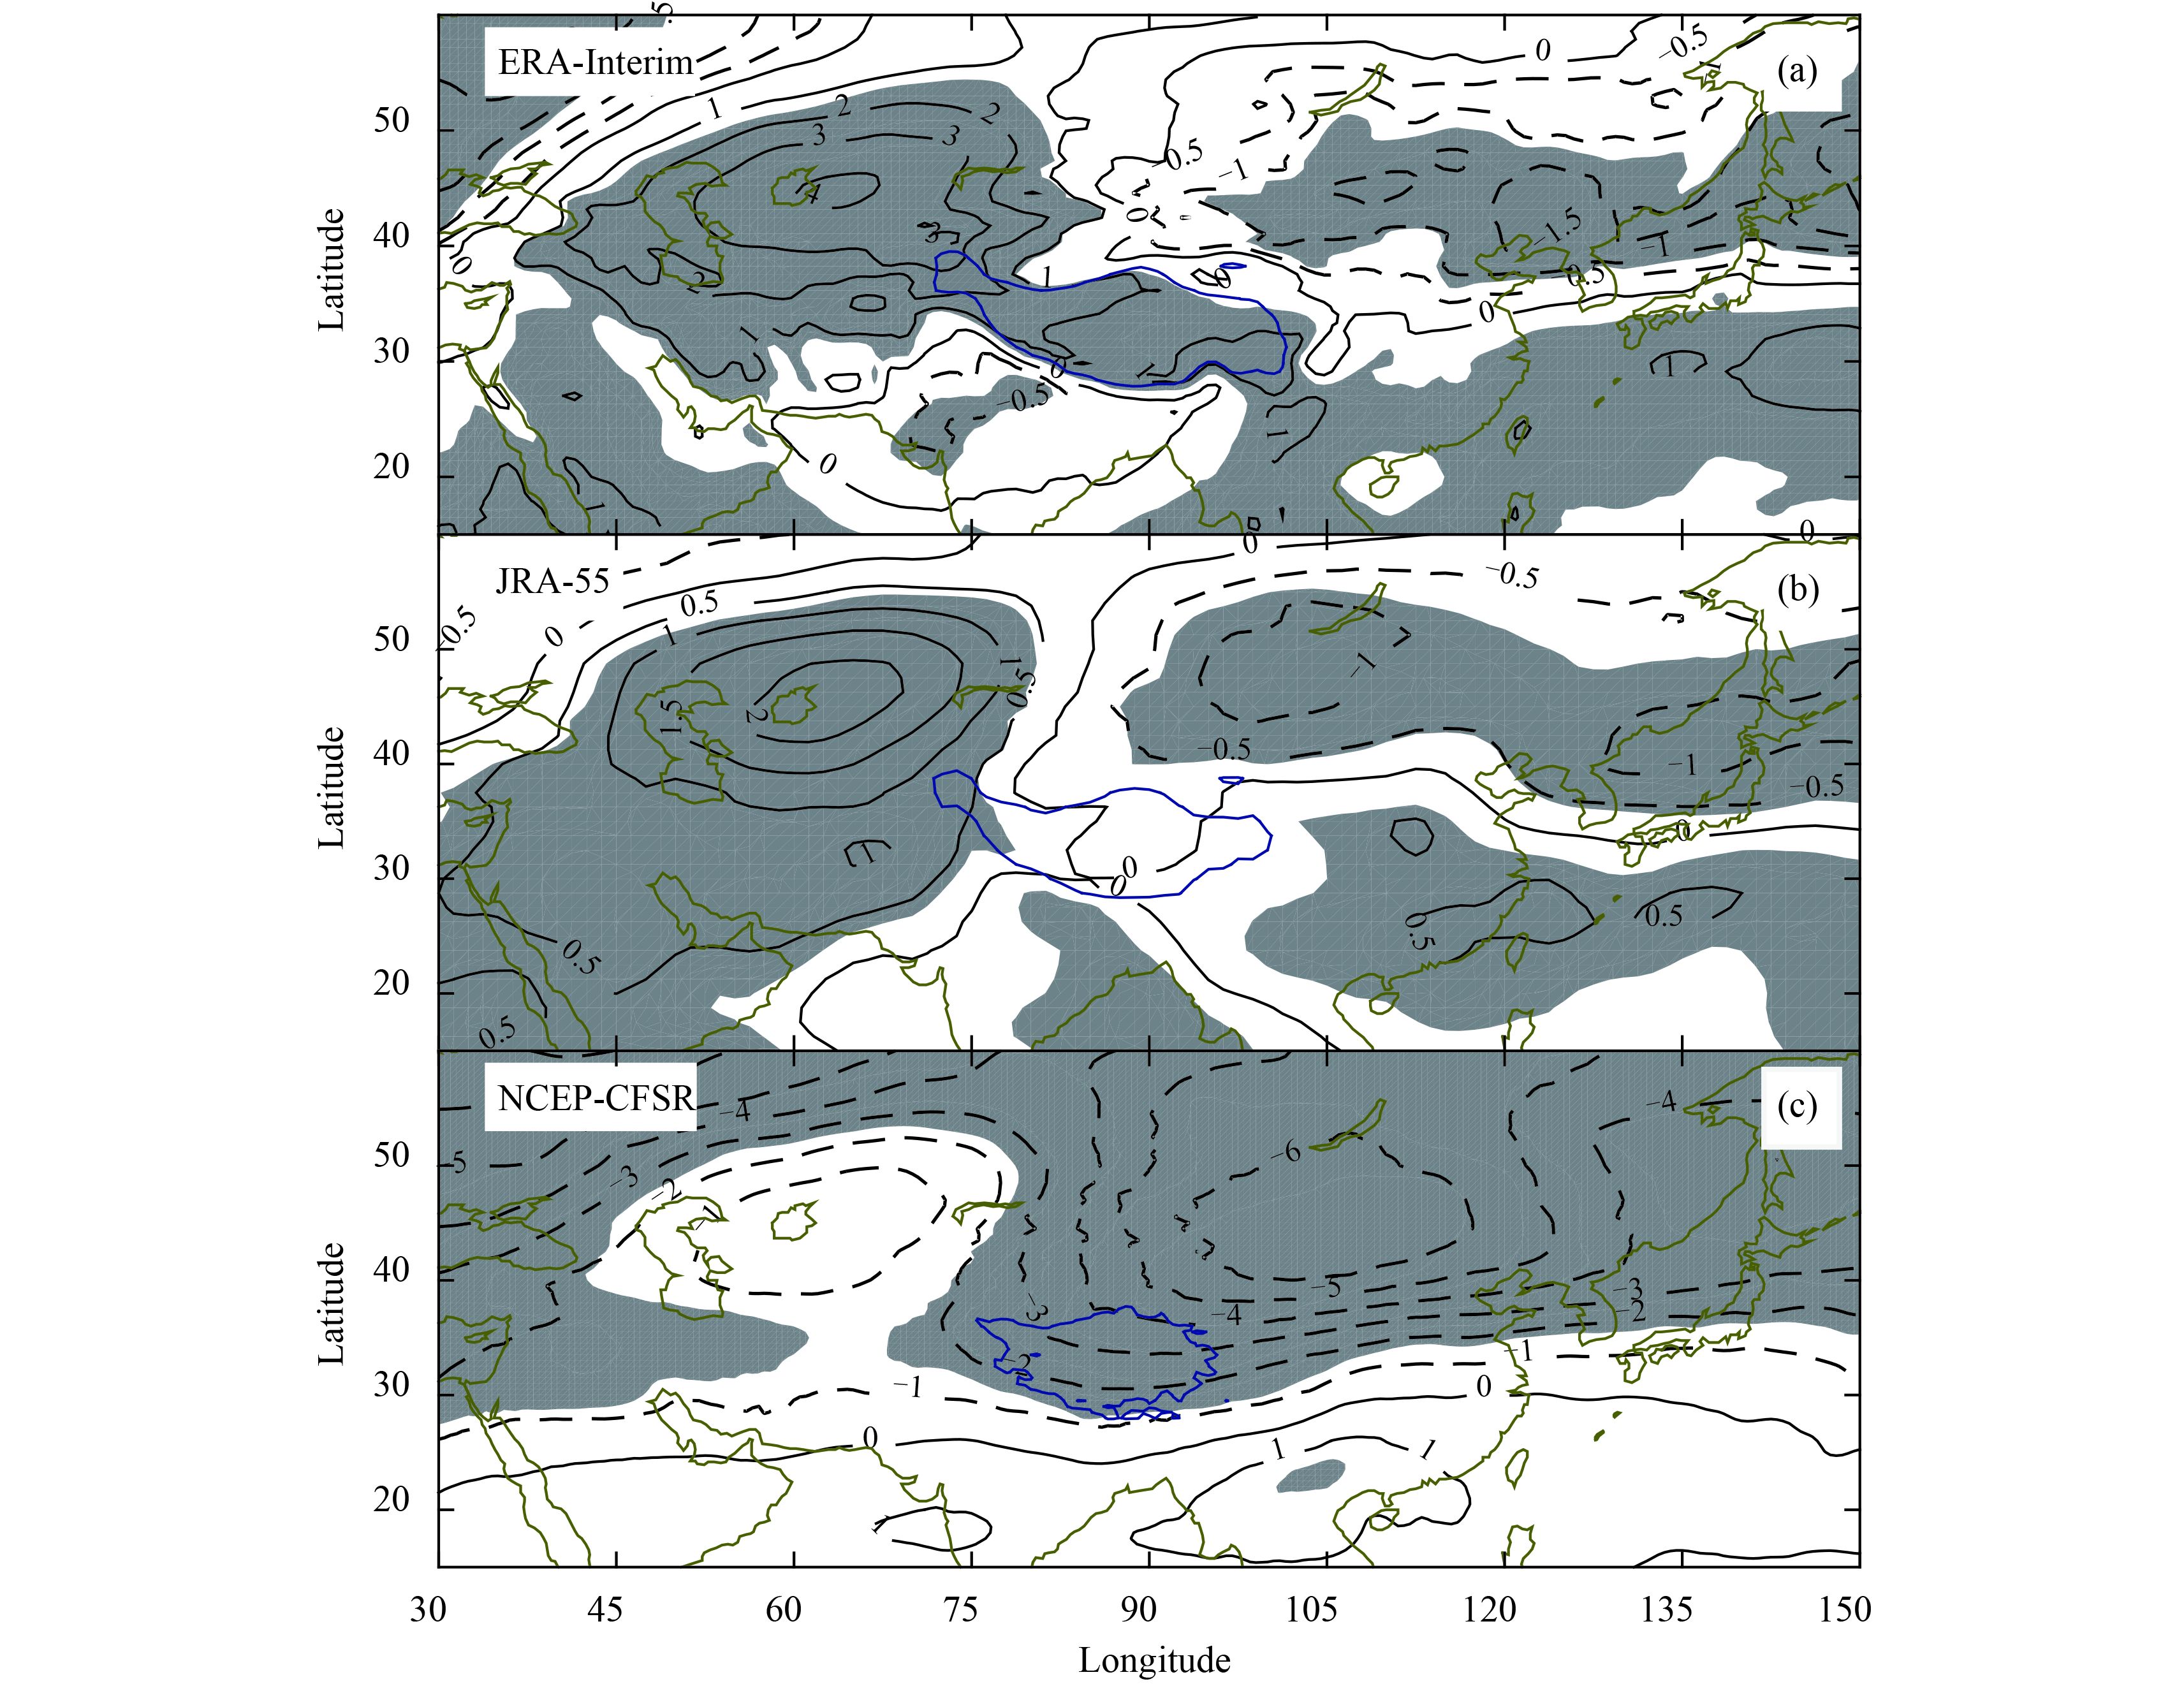
Figure 3 shows the spatial pattern of total ozone zonal deviation in the reanalysis data. The trends of the ERA-Interim deviation in the OVTP region during the summers of 1979–2009 were largely positive, and passed the statistical significance test at the 90% confidence level (Fig. 3a). However, positive trends of JRA-55 deviation in only a small western part of the OVTP region passed the statistical significance test at the 90% confidence level (Fig. 3b). In contrast to the positive trends of ERA-Interim and JRA-55 summer total ozone zonal deviation in the OVTP region over 1979–2009, the NCEP-CFSR trends were negative. In the most northern part of the OVTP region, the NCEP-CFSR negative trends of that deviation passed the statistical significance test at the 90% confidence level (Fig. 3c).
|
| Figure 3 Trends of total ozone zonal deviation in the summers (June–August) of 1979–2009 in (a) ERA-Interim, (b) JRA-55, and (c) NCEP-CFSR [DU (10 yr)–1]. The trends in shaded areas passed the statistical significance test at the 90% confidence level; blue contours are –25-DU total ozone zonal deviation in various datasets. |
In summary, the merged satellite data and ERA-Interim OVTP trends were strong, but the JRA-55 and NCEP-CFSR OVTP trends were small. The merged satellite data and NCEP-CFSR OVTP became strong in the summers of 1979–2009, but ERA-Interim and JRA-55 OVTP became weak.
4 Reason for uncertainty in OVTP trendsThe reason for the huge differences in the summer OVTP trends may be connected with uncertainties in the SAH, tropopause, and atmospheric column loss of the TP. Consequently, we compared trends of the SAH, tropopause height, and non-TP ozone within the 1000–600-hPa layer in the three reanalysis datasets.
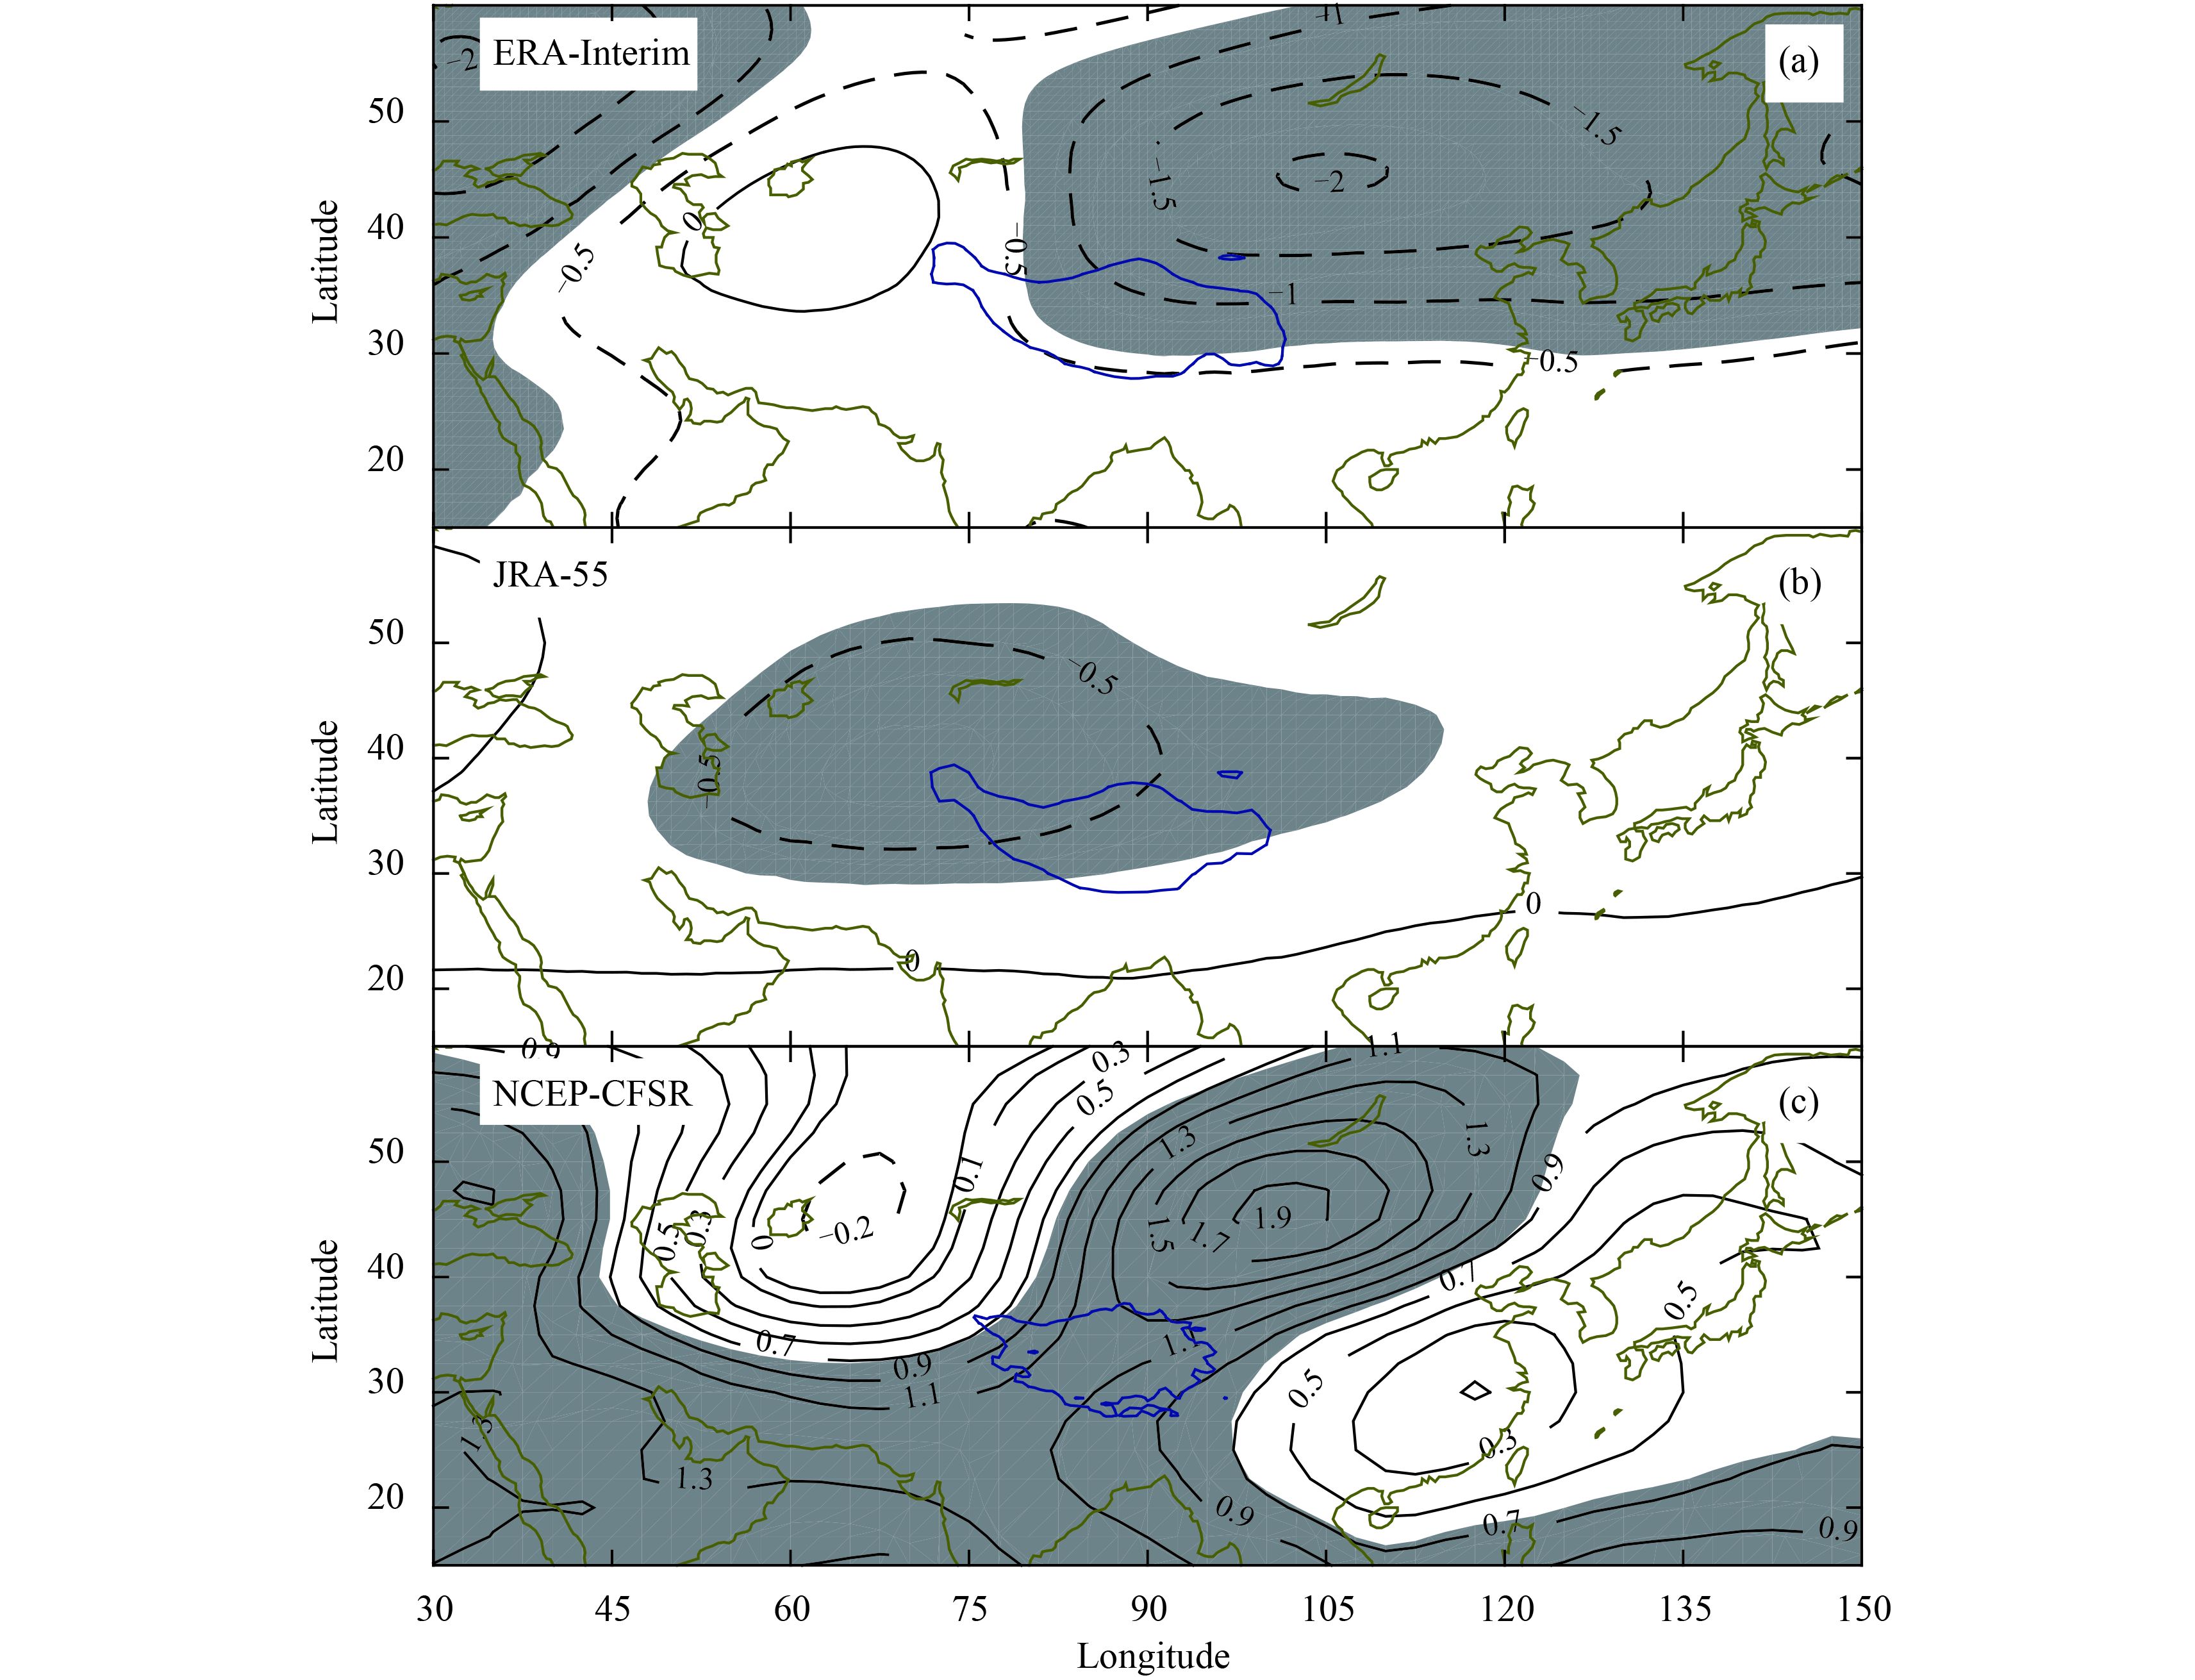
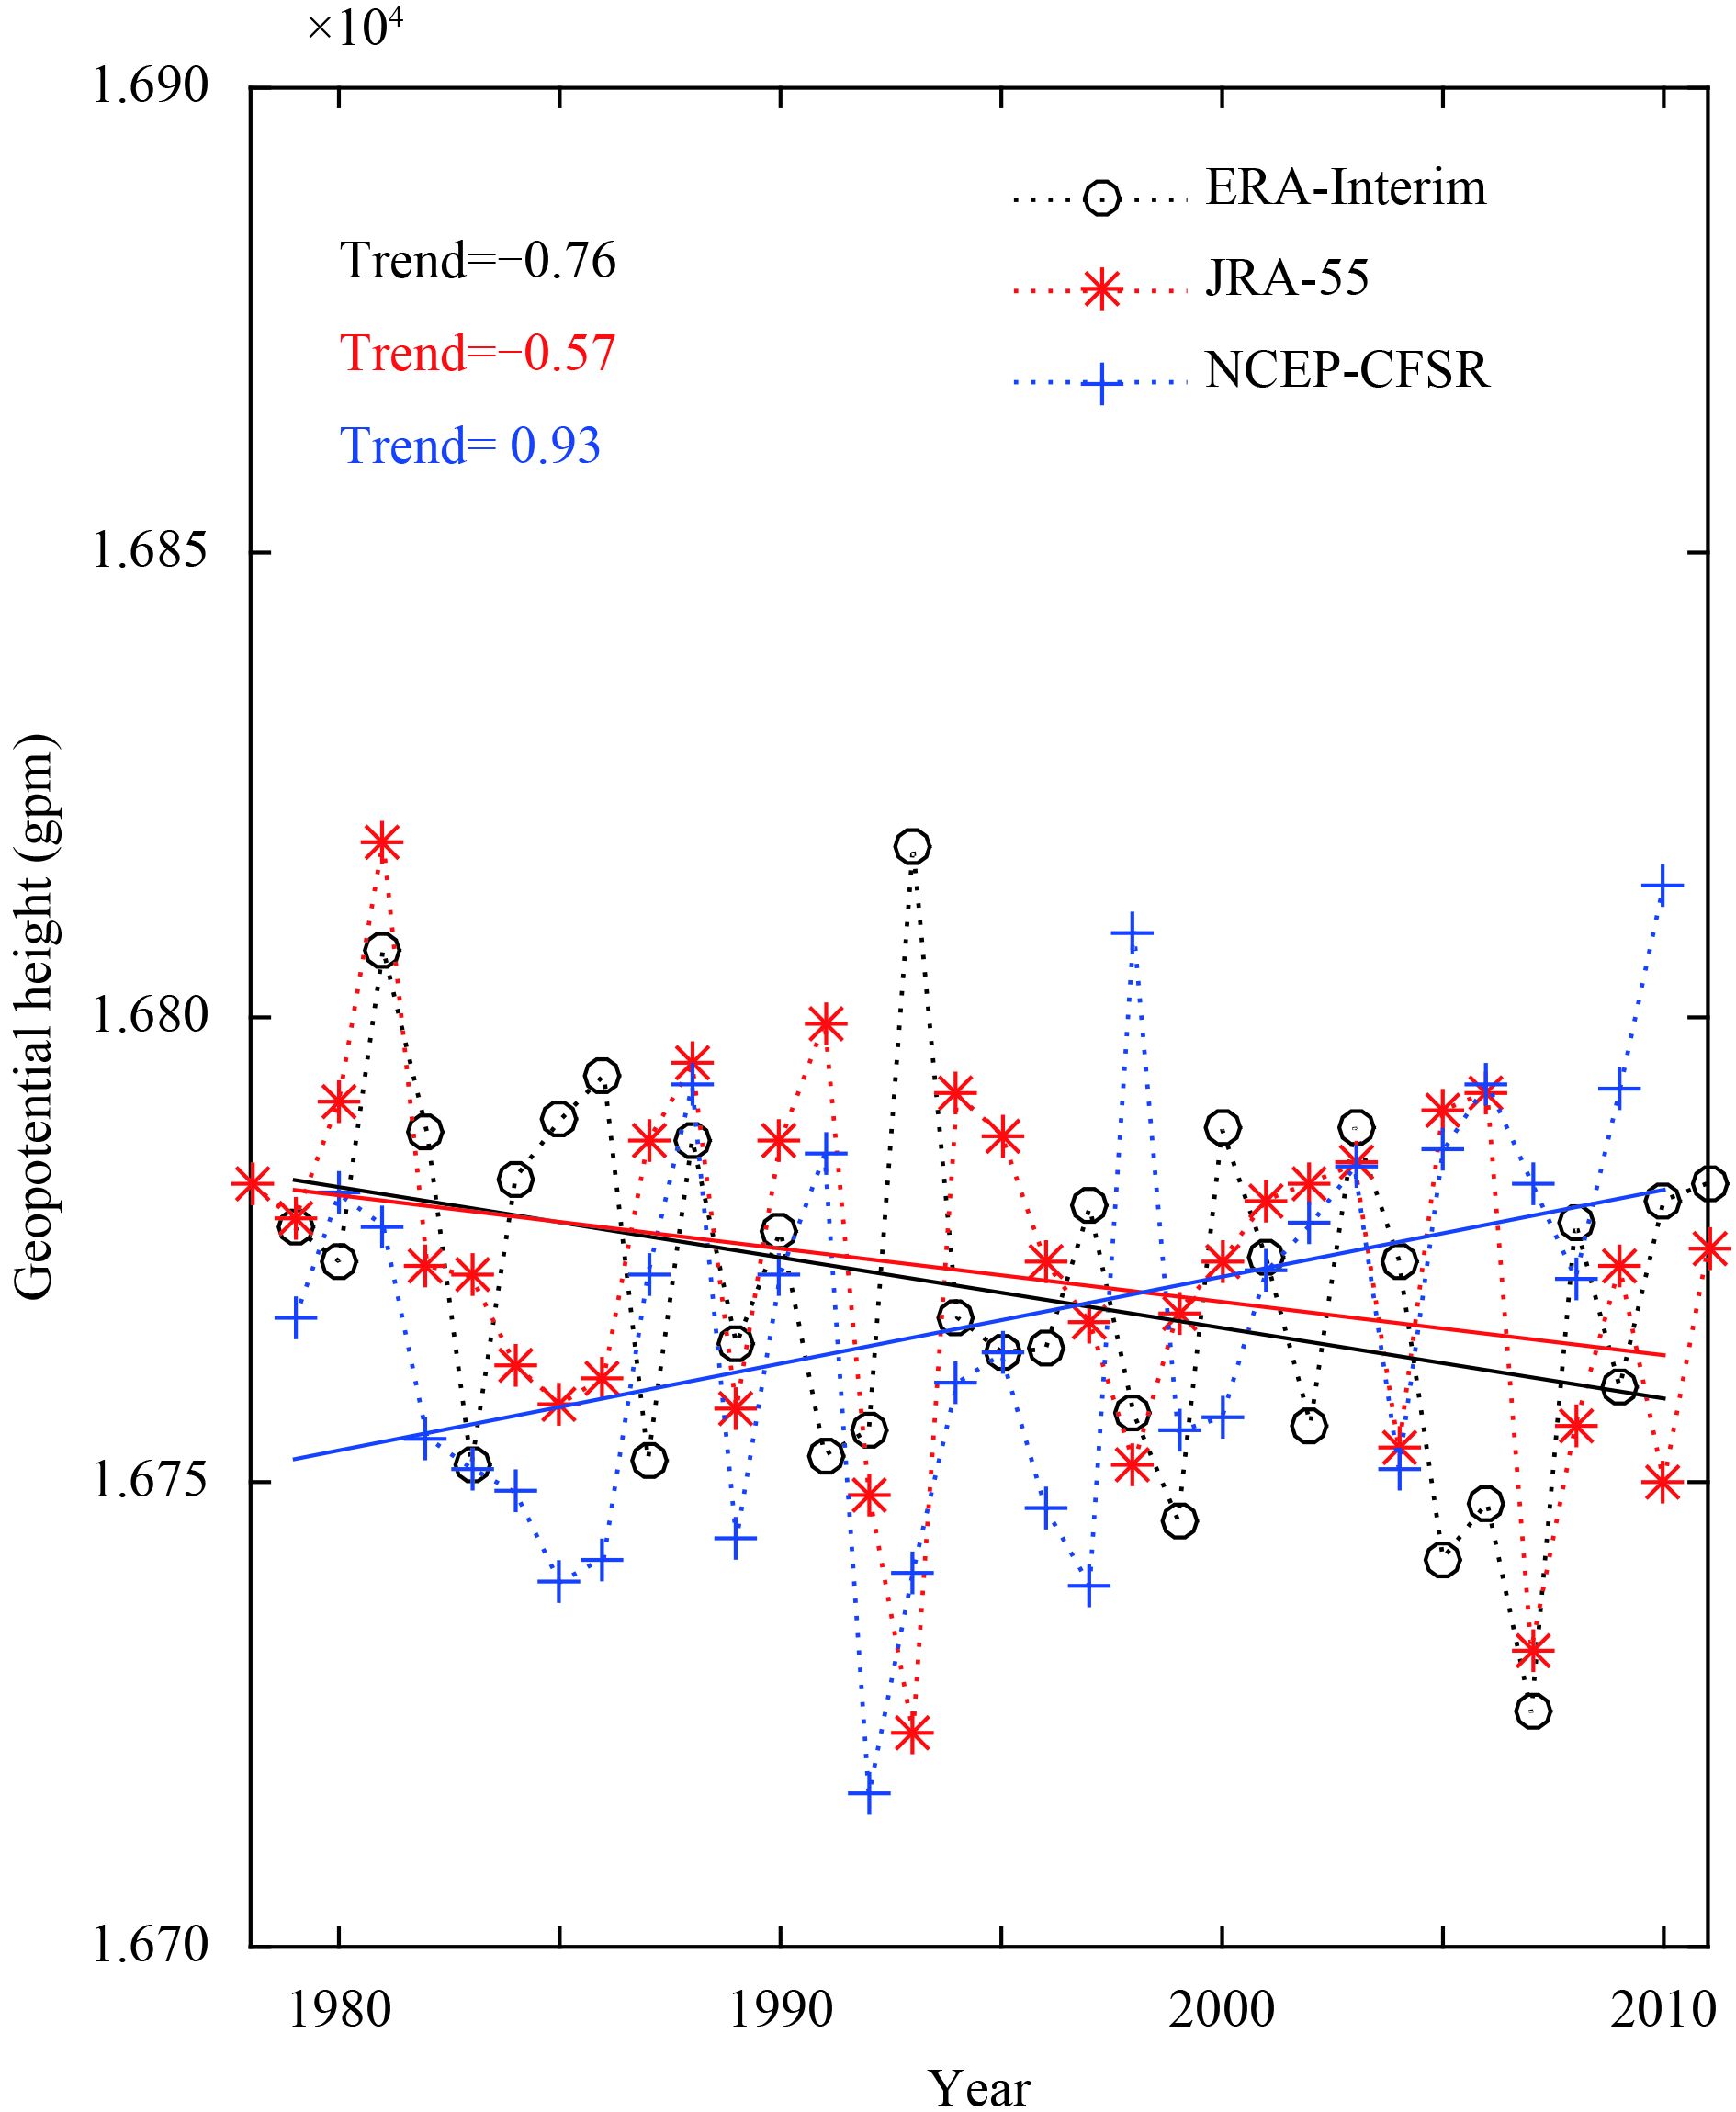
The intensities and locations of the 1979–2009 mean SAH in the three datasets were similar (figure omitted), but their SAH trends showed considerable differences that corresponded to the uncertainties in the OVTP trends. The eastern part of the SAH, which covers most of the OVTP in ERA-Interim, became weak in the summers of 1979–2009—a finding that passed the statistical significance test at the 90% confidence level (Fig. 4a). Furthermore, the TP area mean trend of ERA-Interim geopotential height in those summers was near –0.76 gpm (10 yr)–1, which also passed the statistical significance test at the 90% confidence level (Fig. 5a). This implies that SAH weakening (Figs. 4a, 5) led to the OVTP weakening in ERA-Interim (Figs. 2a, 3). The JRA-55 SAH became weak in the summers of 1979–2009, which again exceeded the 90% confidence level (Fig. 4b). The TP area mean trend of JRA-55 geopotential height in those summers was near –0.57 gpm (10 yr)–1, passing the statistical significance test at the 80% confidence level (Fig. 5a). Similar to ERA-Interim, this suggests that SAH weakening (Figs. 4b, 5) caused the OVTP weakening in JRA-55 (Figs. 2b, 3). On the contrary, SAH strengthening (Figs. 4c, 5) led to the OVTP strengthening in NCEP-CFSR (Figs. 2c, 3). Figure 4c shows that the south and east parts of the SAH, which covers most of the OVTP, became robust during the summers of 1979–2009 in NCEP-CFSR, passing the statistical significance test at the 90% confidence level. The TP-area mean trend of NCEP-CFSR geopotential height in those summers was approximately 0.93 gpm (10 yr)–1, also passing the test at the 90% confidence level (Fig. 5c). Thus, SAH trend uncertainties in the data are connected to OVTP trend uncertainties.
|
| Figure 4 As in Fig. 3, but for trends in geopotential height [gpm (10 yr)–1] at 100 hPa. |
|
| Figure 5 TP-area (27°–37°N, 75°–105°E) mean geopotential height in the OVTP region during the summers of 1979–2009 in reanalysis data (dashed line; 104 gpm) and their trends [solid lines; gpm (10 yr)–1]. |
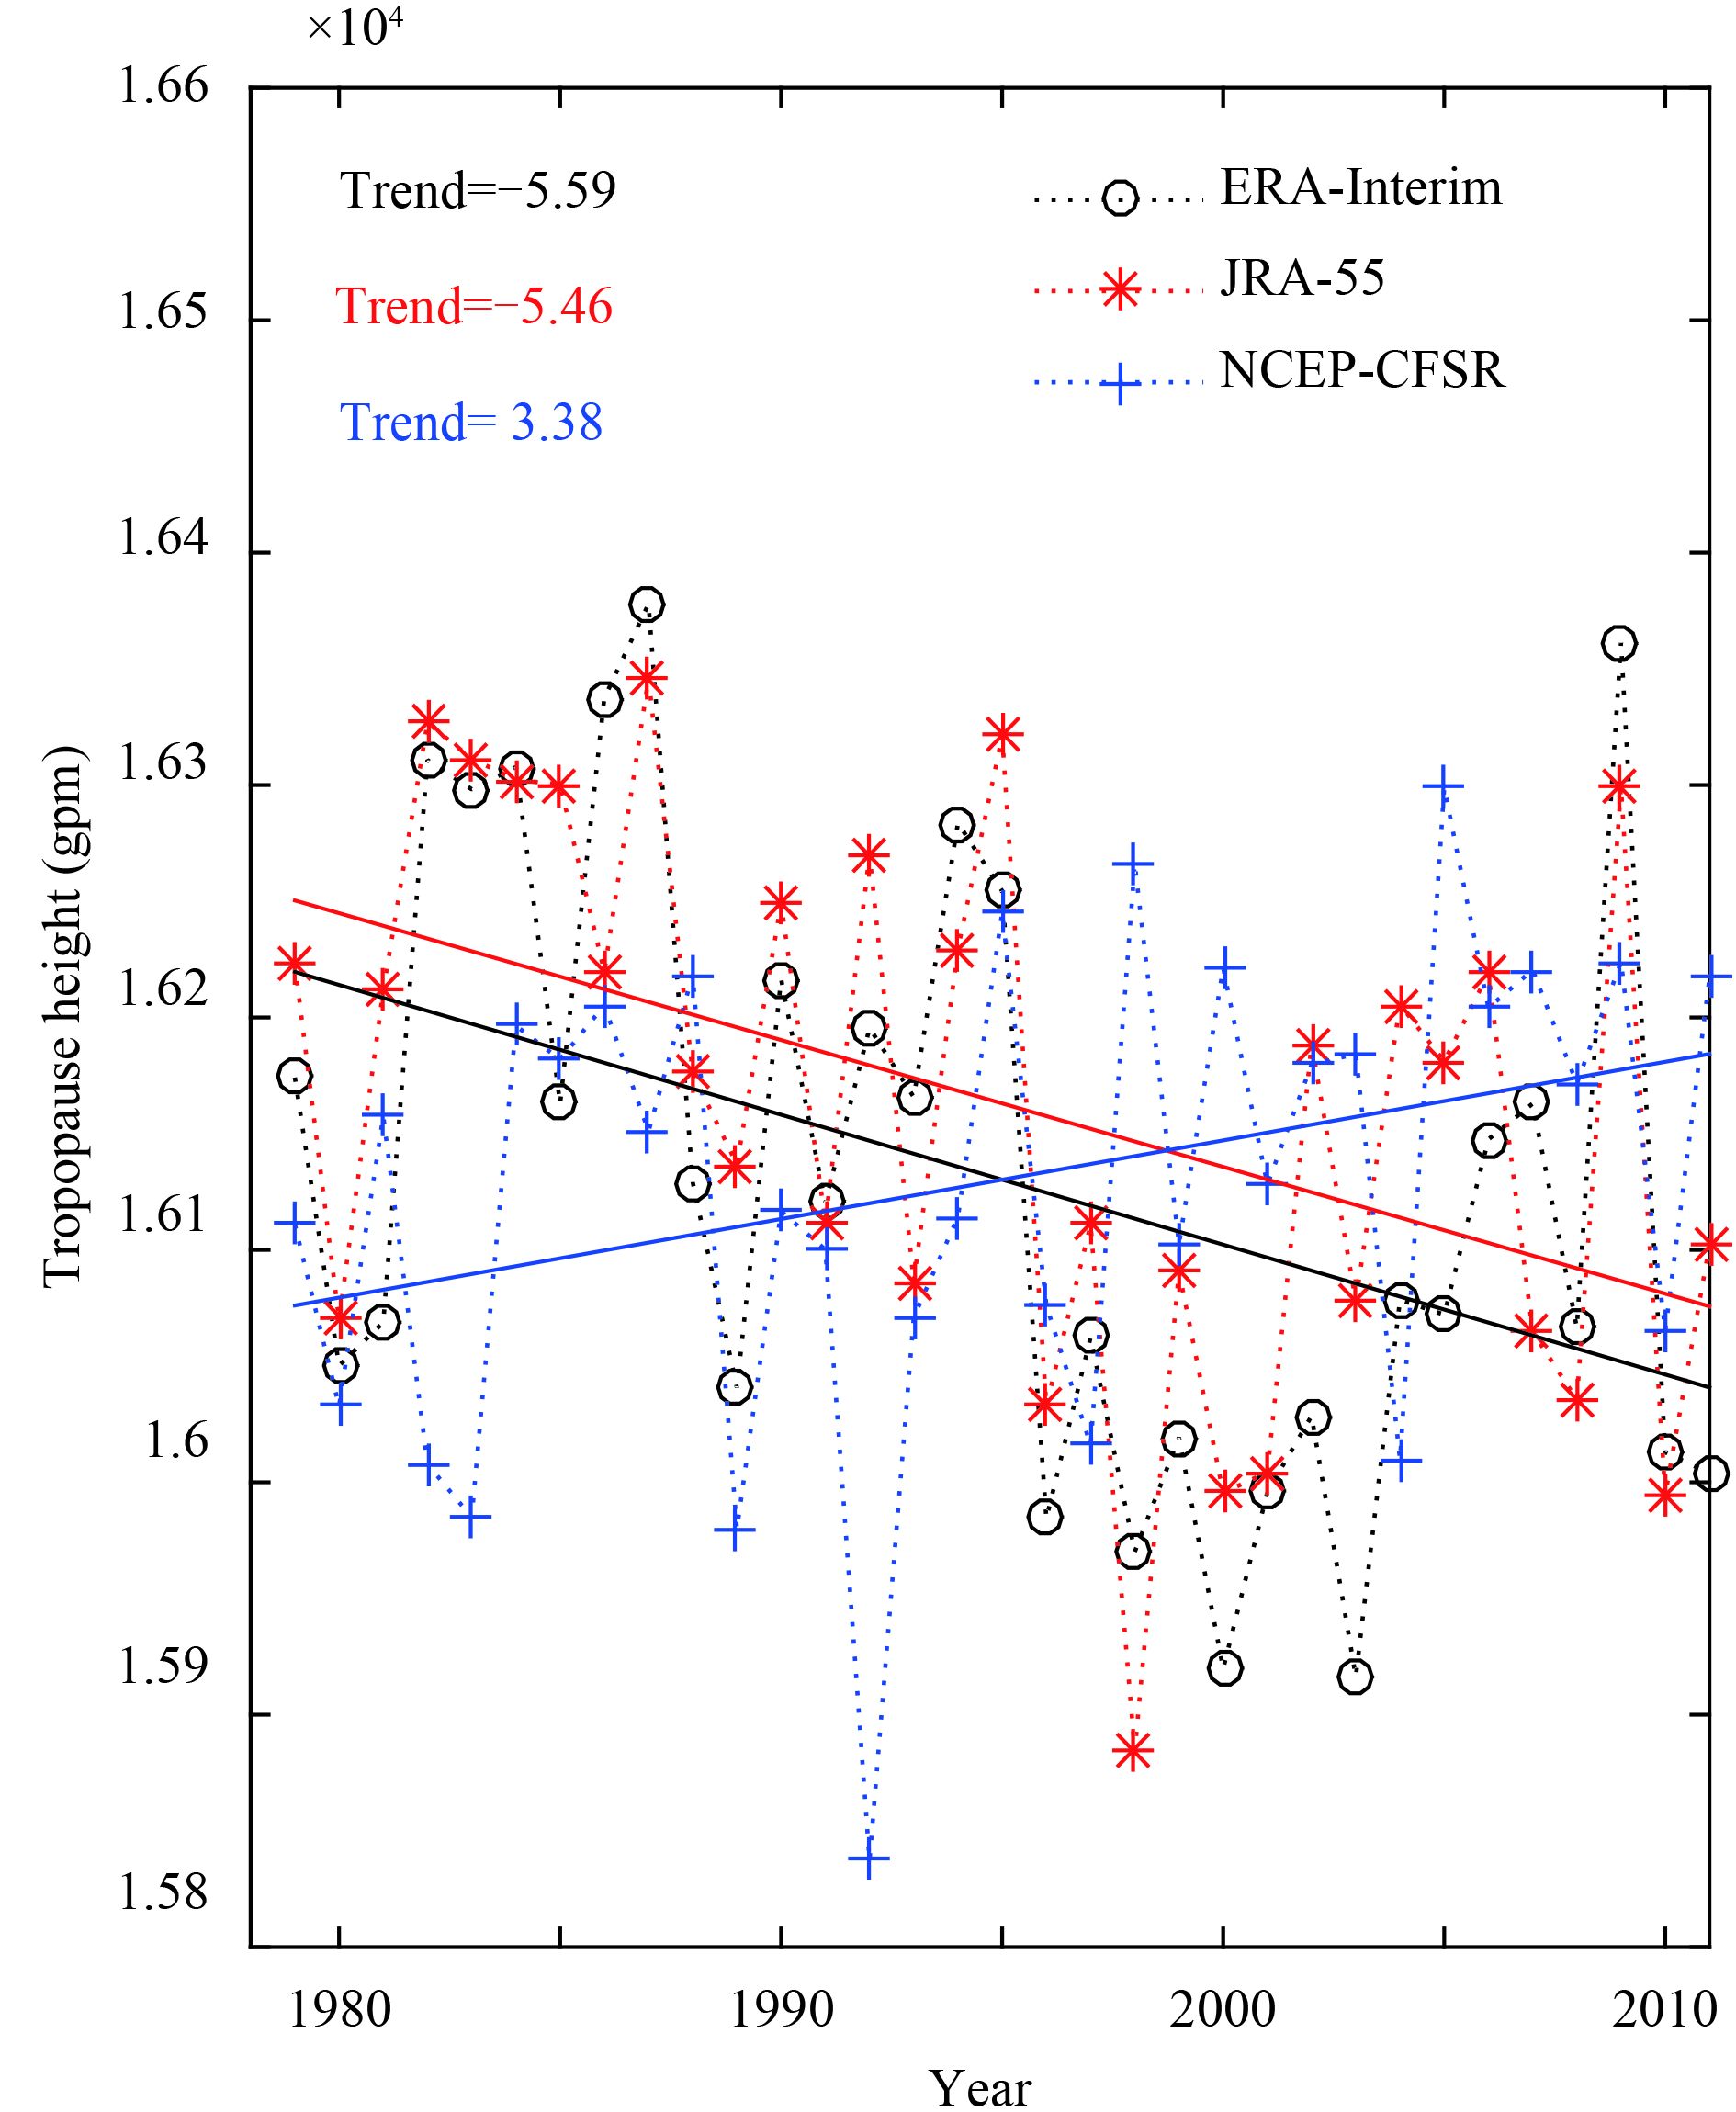
The tropopause trends showed uncertainties similar to those of the SAH and OVTP. The tropopause over the TP during 1979–2009 became lower in ERA-Interim [–5.59 gpm (10 yr)–1] and JRA-55 [–5.46 gpm (10 yr)–1], but higher in NCEP [3.38 gpm (10 yr)–1], passing the statistical significance test at the 95% confidence level (Fig. 6). The tropopause trends corresponded to the SAH trends in the various datasets because, when the SAH is strong, upward atmospheric motion is strong and the tropopause is higher. The reason for the association between the tropopause and OVTP trends may be that a higher tropopause means a thinner stratosphere and thicker troposphere, and ozone is richer in the stratosphere than in the troposphere.
|
| Figure 6 As in Fig. 5, but for the TP-area mean tropopause height. |
The huge trend differences of summer OVTP may also have been affected by uncertainty from the atmospheric loss over the TP. There is less atmosphere over the plateau than over other areas at the same latitude, which translates to less ozone. Hence, we analyzed ozone trends over the non-TP area (27°–37°N, < 75°E and > 105°E) below 600 hPa (Fig. 7). The trends of ERA-Interim ozone in that area and layer during the summers of 1979–2009 were largely negative [–0.093 DU (10 yr)–1], passing the statistical significance test at the 80% confidence level (Fig. 7). The non-TP ozone trend of JRA-55 was near –0.069 DU (10 yr)–1, also passing at the 80% level. On the contrary, the trend of NCEP-CFSR non-TP ozone was approximately 0.23 DU (10 yr)–1, passing at the 90% confidence level. Thus, non-TP ozone trend uncertainties in the data may be another reason for the OVTP trend uncertainties.

|
| Figure 7 Non-TP-area (27°–37°N, < 75°E and > 105°E) mean ozone integrated below 600 hPa during the summers of 1979–2009 in reanalysis data (dashed line; DU) and their trends [solid lines; DU (10 yr)–1]. |
The uncertainties in the OVTP trends during 1979–2009 in the ERA-Interim, JRA-55, and NCEP-CFSR datasets were evaluated, and their potential reasons diagnosed. The results showed that, in the summers of 1979–2009, the NCEP-CFSR OVTP became strong, but the ERA-Interim and JRA-55 OVTP became weak. Satellite data merged with TOMS and OMI data agreed with the OVTP trend of NCEP-CFSR. Furthermore, the OVTP strengthening in NCEP-CFSR in the summers may have been caused by SAH intensification, a rising tropopause, and increased non-TP ozone. Analogously, the summer OVTP weakening in ERA-Interim and JRA-55 may have been affected by weakening SAH, descending tropopause, and decreasing non-TP ozone.
The OVTP trends in recent decades were negative in NCEP-CFSR, which agrees with the studies (Liu et al., 2003; Zhou and Zhang, 2005). Therefore, it is better to use NCEP-CDSR data carry out research on ozone trends over the TP area. However, this paper only discusses the trend of ozone; other signals of ozone, such as solar activity, quasi-biennial oscillation, and ENSO signals, are also worthy of evaluation. In addition, the present study found that the change in the OVTP was explained by the change in the SAH. However, SAH change can also feed back to the OVTP. Therefore, it would be worthwhile diagnosing the interaction between the OVTP and the SAH by using models.
| Andrews, D. G., J. R. Holton, and C. B. Leovy, 1987:Middle Atmosphere Dynamics. Academic Press, New York, NY, USA, 489 pp. |
| Bian J. C., Wang G. C., Chen H. B., et al., 2006: Ozone mini-hole occurring over the Tibetan Plateau in December 2003. Chin. Sci. Bull., 51, 885–888. DOI:10.1007/s11434-006-0885-y |
| Bian J. C., Yan R. C., Chen H. B., et al., 2011: Formation of the summertime ozone valley over the Tibetan Plateau: The Asian summer monsoon and air column variations. Adv. Atmos. Sci., 28, 1318–1325. DOI:10.1007/s00376-011-0174-9 |
| Dee D. P., Uppala D. M., Simmons S. J, et al., 2011: The ERA-Interim reanalysis: Configuration and performance of the data assimilation system. Quart. J. Roy. Meteor. Soc., 137, 553–597. DOI:10.1002/qj.828 |
| Farman J. C., Gardiner B. G., Shanklin J. D., 1985: Large losses of total ozone in Antarctica reveal seasonal ClOx/NOx interaction . Nature, 315, 207–210. DOI:10.1038/315207a0 |
| Fuhrer J., Booker F., 2003: Ecological issues related to ozone: Agricultural issues. Environment International, 29, 141–154. DOI:10.1016/S0160-4120(02)00157-5 |
| Guo D., Wang P. X., Zhou X. J., et al., 2012: Dynamic effects of the South Asian high on the ozone valley over the Tibetan Plateau. Acta Meteor. Sinica, 26, 216–228. DOI:10.1007/s13351-012-0207-2 |
| Guo C. Su Y., Shi D. H., et al., 2015: Double core of ozone valley over the Tibetan Plateau and its possible mechanisms. Journal of Atmospheric and Solar-Terrestrial Physics, 130–131, 127–131. DOI:10.1016/j.jastp.2015.05.018 |
| Igarashi T., 1997: The early results from total ozone mapping spectrometer (TOMS) onboard ADEOS. Geocarto International, 12, 47–50. DOI:10.1080/10106049709354614 |
| Kobayashi S., Ota Y., Harada Y., et al., 2015: The JRA-55 reanalysis: General specifications and basic characteristics. J. Meteor. Soc. Japan, 93, 5–48. DOI:10.2151/jmsj.2015-001 |
| Liu Y., Li W. L., Zhou X. J., et al., 2003: Mechanism of formation of the ozone valley over the Tibetan Plateau in summer—Transport and chemical process of ozone. Adv. Atmos. Sci., 20, 103–109. DOI:10.1007/BF03342054 |
| Liu Y., Guo C. L., Li W. L., et al., 2007: Trends of stratospheric ozone and aerosols over Tibetan Plateau. Acta Meteor. Sinica, 65, 938–945. DOI:10.11676/qxxb2007.088 |
| Liu Y., Li W. L., Zhou X. J., 2010: A possible effect of heterogeneous reactions on the formation of ozone valley over the Tibetan Plateau. Acta Meteor. Sinica, 68, 836–846. DOI:10.11676/qxxb2010.079 |
| Lorenz, E. N., 1967:The Nature and Theory of the General Circulation of the Atmosphere. World Meteorological Organization, Geneva, 213–267. |
| McPeters R. D., Frith S., Labow G. J., 2015: OMI total column ozone: Extending the long-term data record. Atmospheric Measurement Techniques Discussions, 8, 7491–7510. DOI:10.5194/amt-8-4845-2015 |
| Molina M. J., Rowl F. S., 1974: Stratospheric sink for chlorofluoromethanes: Chlorine atom-catalysed destruction of ozone. Nature, 249, 820–821. DOI:10.1038/249810a0 |
| Newman P. A., Gleason J. G., McPeters R. D., et al., 1997: Ano-malously low ozone over the Arctic. Geophys. Res. Lett., 24, 2689–2692. DOI:10.1029/97GL52831 |
| Saha S., Moorthi S., Pan H. L., et al., 2010: The NCEP climate forecast system reanalysis. Bull. Amer. Meteor. Soc., 91, 1015–1057. DOI:10.1175/2010BAMS3001.1 |
| Su Y. C., Guo D., Guo S. L., et al., 2016: Trends of ozone over the Tibetan Plateau in the next 100 years and their possible mechanism. Trans. Atmos. Sci., 39, 309–317. |
| Tian W. S., Chipperfield M., Huang Q., 2008: Effects of the Tibetan Plateau on total column ozone distribution. Tellus B, 60, 622–635. DOI:10.1111/j.1600-0889.2008.00338.x |
| van der Leun J. C., Tang X. Y. , Tevini M., 1995: Environmental effects of ozone depletion: 1994 assessment. Ambio, 24, 138. |
| Wang W. G., Yuan M., Wang Y. H., et al., 2008: A study of ozone amount in the transition layer between troposphere and stratosphere and its heating rate. Chinese Journal of Geophysics, 51, 916–930. DOI:10.1002/cjg2.1287 |
| Zhang J. K., Tian W. S., Xie F., et al., 2014: Climate warming and decreasing total column ozone over the Tibetan Plateau during winter and spring. Tellus B, 66, 23415. DOI:10.3402/tellusb.v66.23415 |
| Zhou R. J., Chen Y. J., 2005: Ozone variations over the Tibetan and Iranian Plateaus and their relationship with the South Asian high. Journal of University of Science and Technology of China, 35, 899–908. |
| Zhou S. W., Zhang R. H., 2005: Decadal variations of temperature and geopotential height over the Tibetan Plateau and their relations with Tibet ozone depletion. Geophys. Res. Lett., 32, L18705. DOI:10.1029/2005GL023496 |
| Zhou X. Y., Luo C., 1994: Ozone valley over Tibetan Plateau. Acta Meteor. Sinica, 8, 505–506. |
| Zou H., 1996: Seasonal variation and trends of TOMS ozone over Tibet. Geophys. Res. Lett., 23, 1029–1032. DOI:10.1029/96GL00767 |
 2017, Vol. 31


